Embed Size (px)
Citation preview
1
Quick lesson For more information, see Help > Contents > Financial Statement Designer.
Goal: To understand the basics in designing a financial statement in the Financial Statement Designer.
Using the Financial Statement Designer (template)
In this quick lesson Step 1: Set security 2 Step 2: Open a template 3 Step 3: Explore the statement title cells 4 Step 4: Explore the columns 5 Step 5: Explore the Amounts rows 6 Step 6: Explore the Total rows 7 Step 7: Explore global properties on the Workbook Properties sheet 8 Step 8: Explore the Design tab and the Preview tab 9
With the Financial Statement Designer, you can create and print balance sheets, profit and loss statements, and other financial statements needed by your firm.
In the Financial Statement Designer, which is based on a spreadsheet, the basic actions are select, define, and view. You select cells in the worksheet, define the contents and appearance of the selection, and view the results and change the definitions, as needed.
You can use properties in the Financial Statement Designer to define common elements found in financial statements. Properties make your design more reusable because they reference the Ajera database.
If what you want is not available, you can manually enter text into the worksheet to define it (for example, a formula or a title for the statement).
You can begin with a blank worksheet and create your own design, or start with a template and make changes to fit your needs. This quick lesson uses a template to describe the components of a design.
2
Quick lesson: Using the Financial Statement Designer (template) For more information, see Help > Contents > Financial Statement Designer.
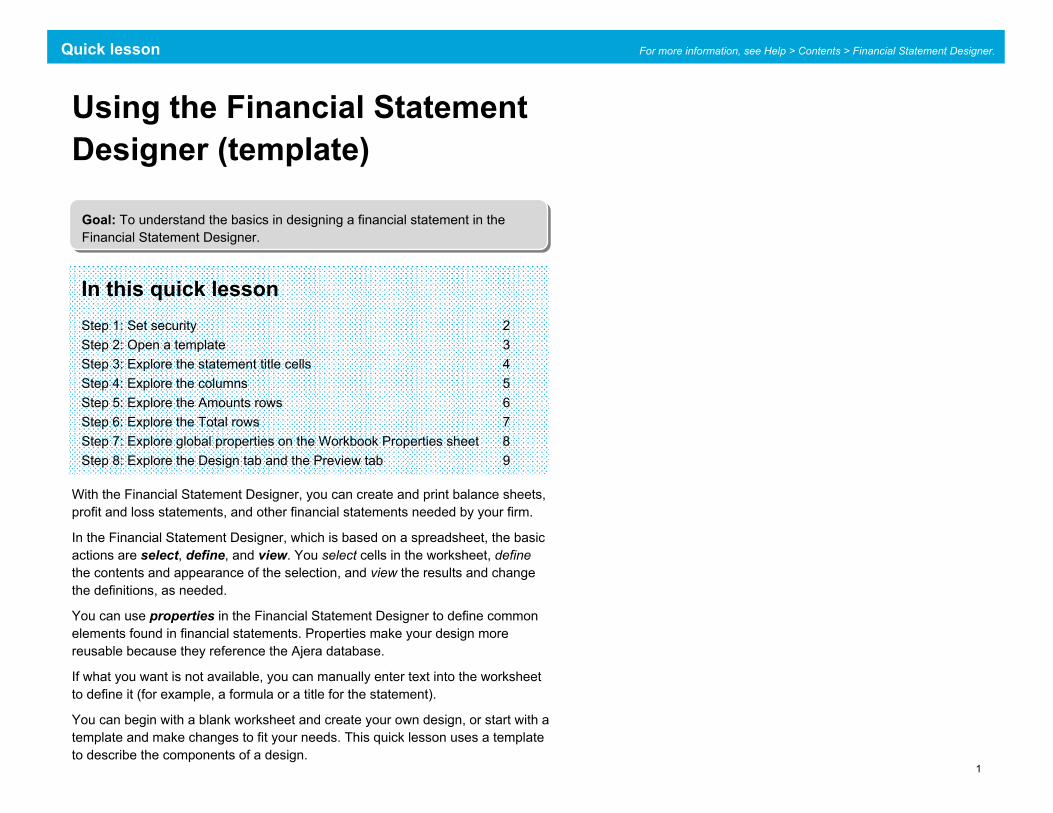
Step 1: Set security 1. Click Company > Security.
2. Select a security group, click Edit and select the following check box:
On the General tab, select this check box to give this security group permission to manage financial statements.
3
Quick lesson: Using the Financial Statement Designer (template) For more information, see Help > Contents > Financial Statement Designer.
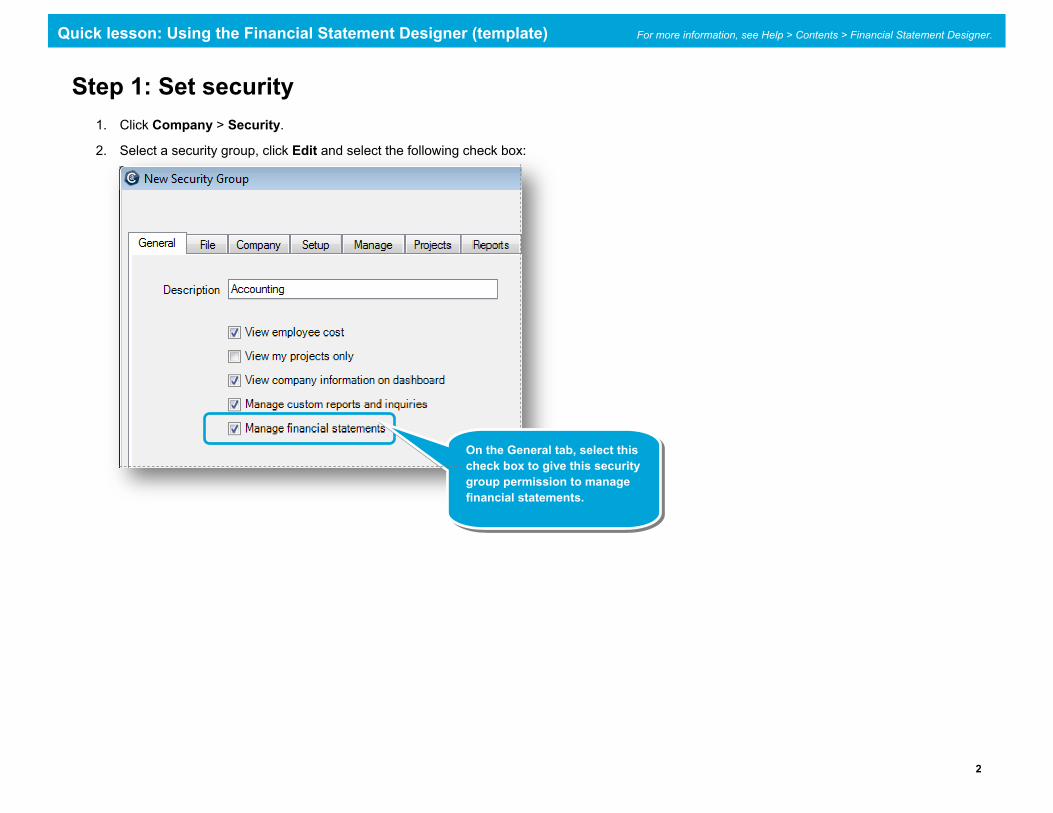
Step 2: Open a template 1. Click Reports > Manage Financial Statements > Designs.
2. Click the Open button.
3. Select Template - Profit and Loss Statement and click the Select button. The profit and loss template appears.
4. On the Design tab is a worksheet with a properties area below it.
The options that appear in the properties area depend on what you select in the worksheet.
Here, a cell is selected in the worksheet, and options for changing the contents of the cell appear in the properties area.
When you select a row or a column, different options for changing the row or column appear.
The worksheet is where you change a design. You begin by selecting cells in the worksheet.
Worksheet
Properties area
4
Quick lesson: Using the Financial Statement Designer (template) For more information, see Help > Contents > Financial Statement Designer.
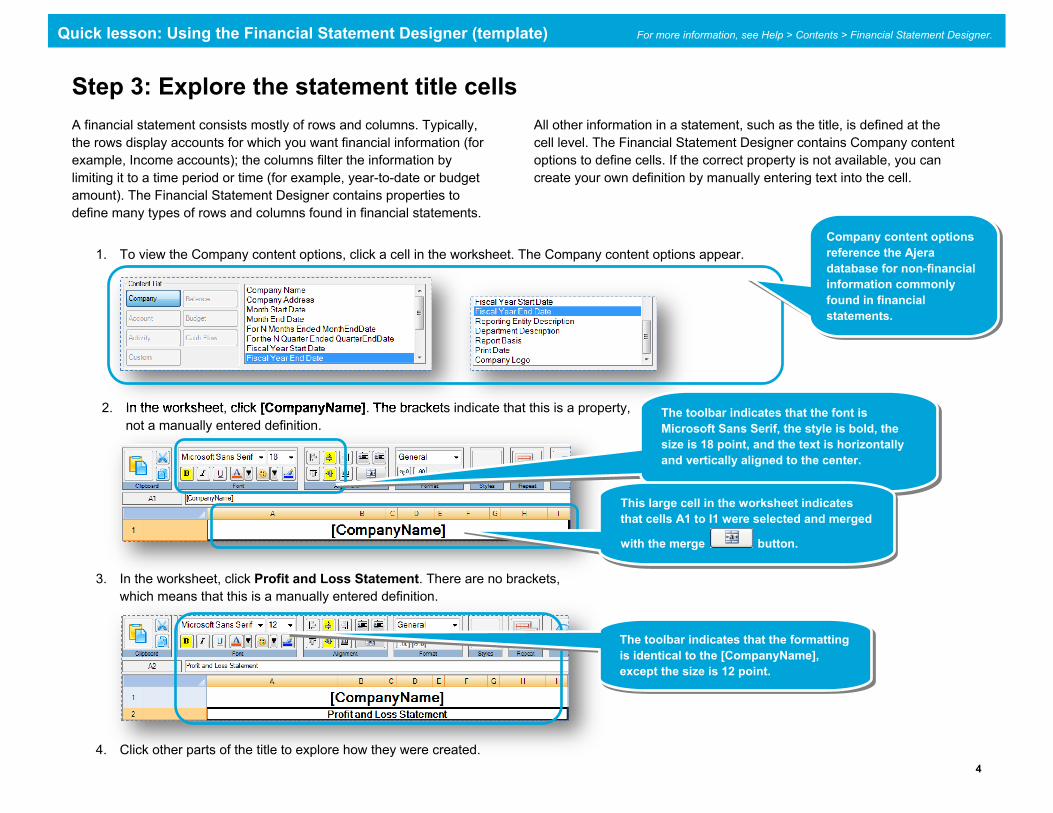
Step 3: Explore the statement title cells A financial statement consists mostly of rows and columns. Typically, the rows display accounts for which you want financial information (for example, Income accounts); the columns filter the information by limiting it to a time period or time (for example, year-to-date or budget amount). The Financial Statement Designer contains properties to define many types of rows and columns found in financial statements.
All other information in a statement, such as the title, is defined at the cell level. The Financial Statement Designer contains Company content options to define cells. If the correct property is not available, you can create your own definition by manually entering text into the cell.
1. To view the Company content options, click a cell in the worksheet. The Company content options appear.
2. In the worksheet, click [CompanyName]. The brackets indicate that this is a property, not a manually entered definition.
3. In the worksheet, click Profit and Loss Statement. There are no brackets, which means that this is a manually entered definition.
4. Click other parts of the title to explore how they were created.
Company content options reference the Ajera database for non-financial information commonly found in financial statements.
The toolbar indicates that the font is Microsoft Sans Serif, the style is bold, the size is 18 point, and the text is horizontally and vertically aligned to the center.
This large cell in the worksheet indicates that cells A1 to I1 were selected and merged
with the merge button.
The toolbar indicates that the formatting is identical to the [CompanyName], except the size is 12 point.
5
Quick lesson: Using the Financial Statement Designer (template) For more information, see Help > Contents > Financial Statement Designer.
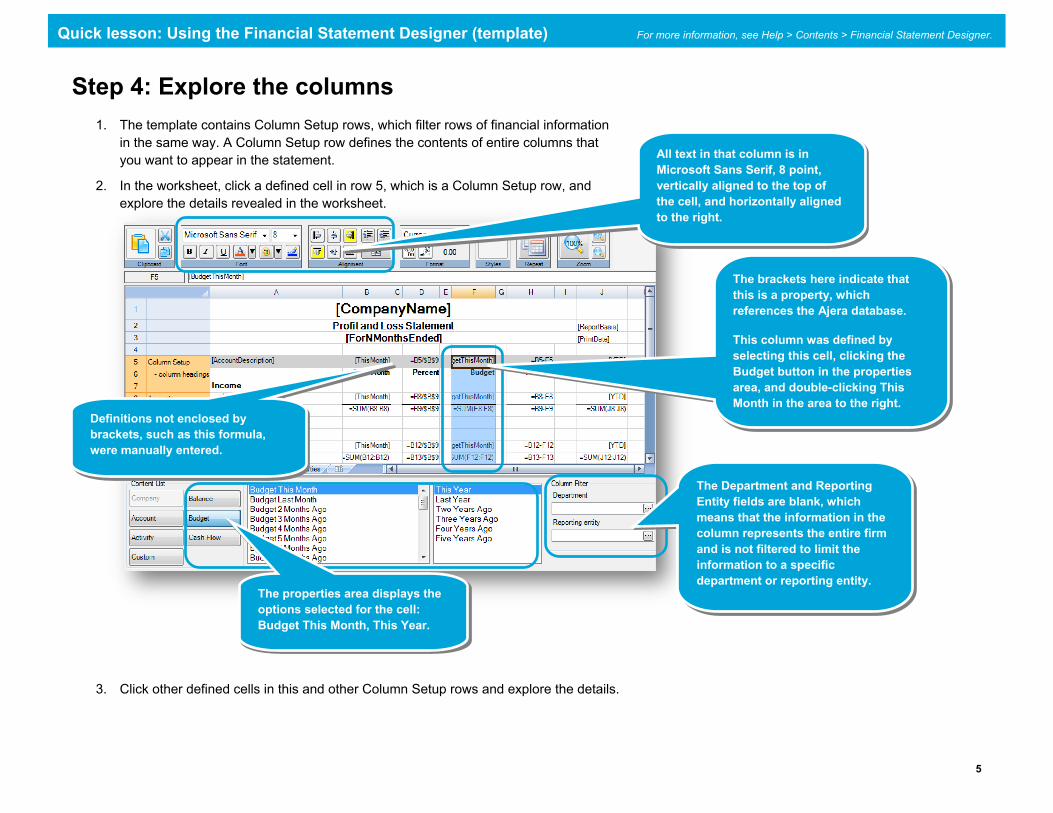
Step 4: Explore the columns 1. The template contains Column Setup rows, which filter rows of financial information
in the same way. A Column Setup row defines the contents of entire columns that you want to appear in the statement.
2. In the worksheet, click a defined cell in row 5, which is a Column Setup row, and explore the details revealed in the worksheet.
3. Click other defined cells in this and other Column Setup rows and explore the details.
All text in that column is in Microsoft Sans Serif, 8 point, vertically aligned to the top of the cell, and horizontally aligned to the right.
The brackets here indicate that this is a property, which references the Ajera database.
This column was defined by selecting this cell, clicking the Budget button in the properties area, and double-clicking This Month in the area to the right.
The Department and Reporting Entity fields are blank, which means that the information in the column represents the entire firm and is not filtered to limit the information to a specific department or reporting entity.
Definitions not enclosed by brackets, such as this formula, were manually entered.
The properties area displays the options selected for the cell: Budget This Month, This Year.
6
Quick lesson: Using the Financial Statement Designer (template) For more information, see Help > Contents > Financial Statement Designer.
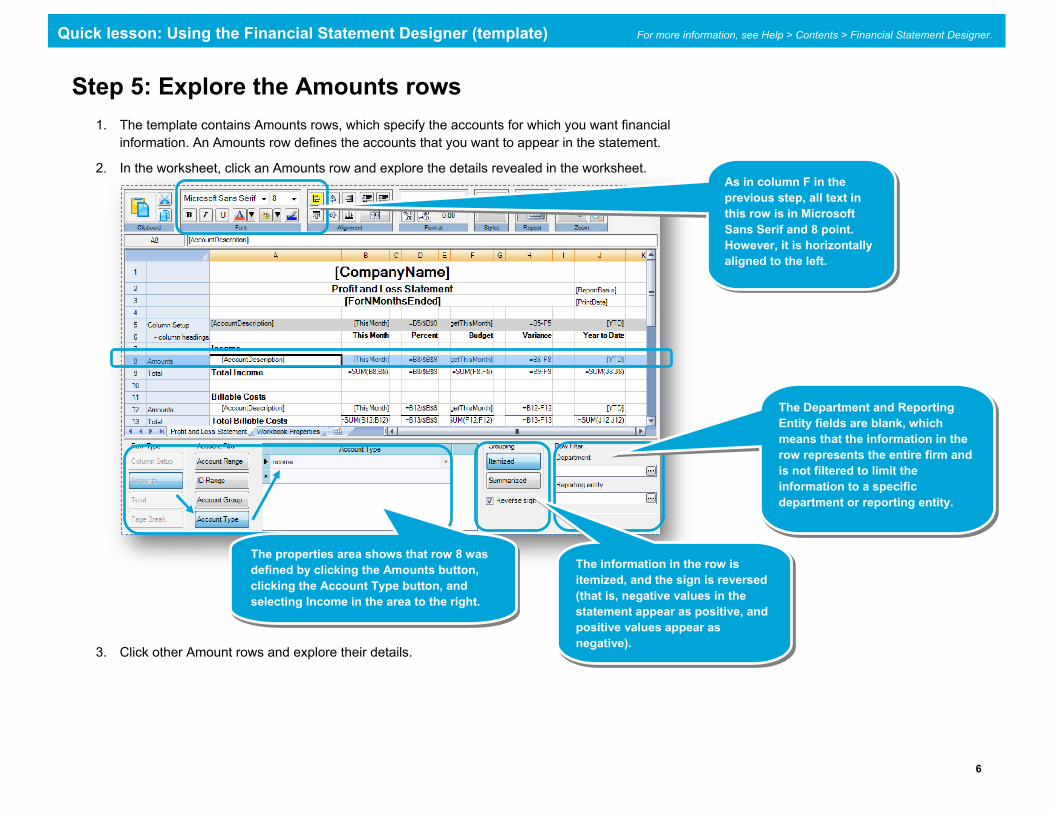
Step 5: Explore the Amounts rows 1. The template contains Amounts rows, which specify the accounts for which you want financial
information. An Amounts row defines the accounts that you want to appear in the statement.
2. In the worksheet, click an Amounts row and explore the details revealed in the worksheet.
3. Click other Amount rows and explore their details.
As in column F in the previous step, all text in this row is in Microsoft Sans Serif and 8 point. However, it is horizontally aligned to the left.
The properties area shows that row 8 was defined by clicking the Amounts button, clicking the Account Type button, and selecting Income in the area to the right.
The Department and Reporting Entity fields are blank, which means that the information in the row represents the entire firm and is not filtered to limit the information to a specific department or reporting entity.
The information in the row is itemized, and the sign is reversed (that is, negative values in the statement appear as positive, and positive values appear as negative).
7
Quick lesson: Using the Financial Statement Designer (template) For more information, see Help > Contents > Financial Statement Designer.
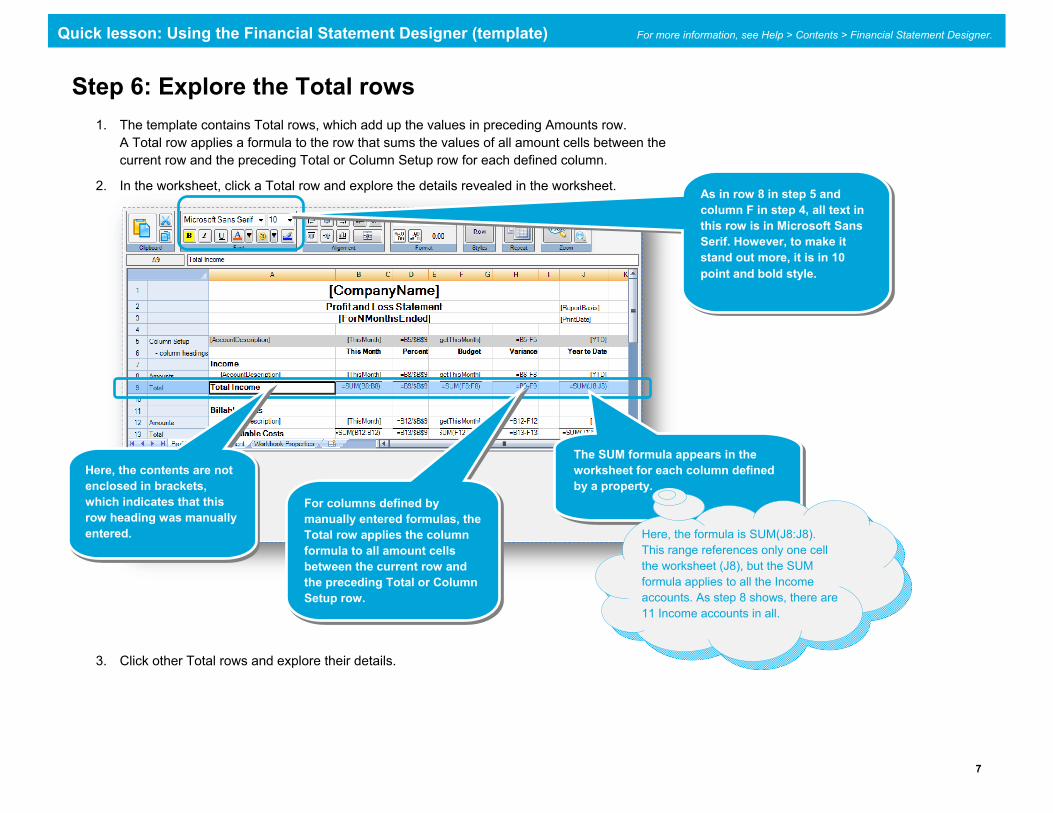
Step 6: Explore the Total rows 1. The template contains Total rows, which add up the values in preceding Amounts row.
A Total row applies a formula to the row that sums the values of all amount cells between the current row and the preceding Total or Column Setup row for each defined column.
2. In the worksheet, click a Total row and explore the details revealed in the worksheet.
3. Click other Total rows and explore their details.
The SUM formula appears in the worksheet for each column defined by a property.
Here, the contents are not enclosed in brackets, which indicates that this row heading was manually entered.
As in row 8 in step 5 and column F in step 4, all text in this row is in Microsoft Sans Serif. However, to make it stand out more, it is in 10 point and bold style.
For columns defined by manually entered formulas, the Total row applies the column formula to all amount cells between the current row and the preceding Total or Column Setup row.
Here, the formula is SUM(J8:J8). This range references only one cell the worksheet (J8), but the SUM formula applies to all the Income accounts. As step 8 shows, there are 11 Income accounts in all.
8
Quick lesson: Using the Financial Statement Designer (template) For more information, see Help > Contents > Financial Statement Designer.
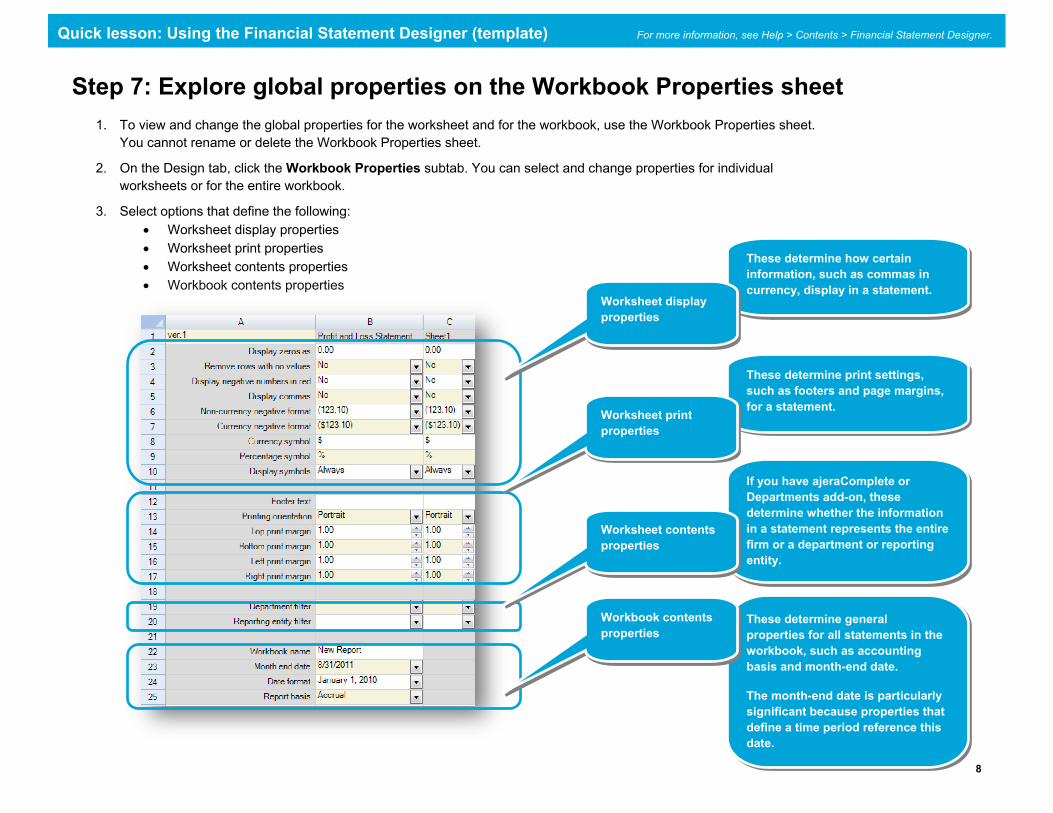
Step 7: Explore global properties on the Workbook Properties sheet 1. To view and change the global properties for the worksheet and for the workbook, use the Workbook Properties sheet.
You cannot rename or delete the Workbook Properties sheet.
2. On the Design tab, click the Workbook Properties subtab. You can select and change properties for individual worksheets or for the entire workbook.
3. Select options that define the following: Worksheet display properties Worksheet print properties Worksheet contents properties Workbook contents properties
These determine general properties for all statements in the workbook, such as accounting basis and month-end date.
The month-end date is particularly significant because properties that define a time period reference this date.
If you have ajeraComplete or Departments add-on, these determine whether the information in a statement represents the entire firm or a department or reporting entity.
These determine print settings, such as footers and page margins, for a statement.
Worksheet print properties
Worksheet contents properties
Workbook contents properties
These determine how certain information, such as commas in currency, display in a statement.
Worksheet display properties
9
Quick lesson: Using the Financial Statement Designer (template) For more information, see Help > Contents > Financial Statement Designer.
Summary If interested, you can view the companion quick lesson, Using the Financial Statement Designer (blank worksheet).
You can also print one of the other templates and try to re-create the design using a blank worksheet. If needed, click the Design tab and view the labels and options selected.
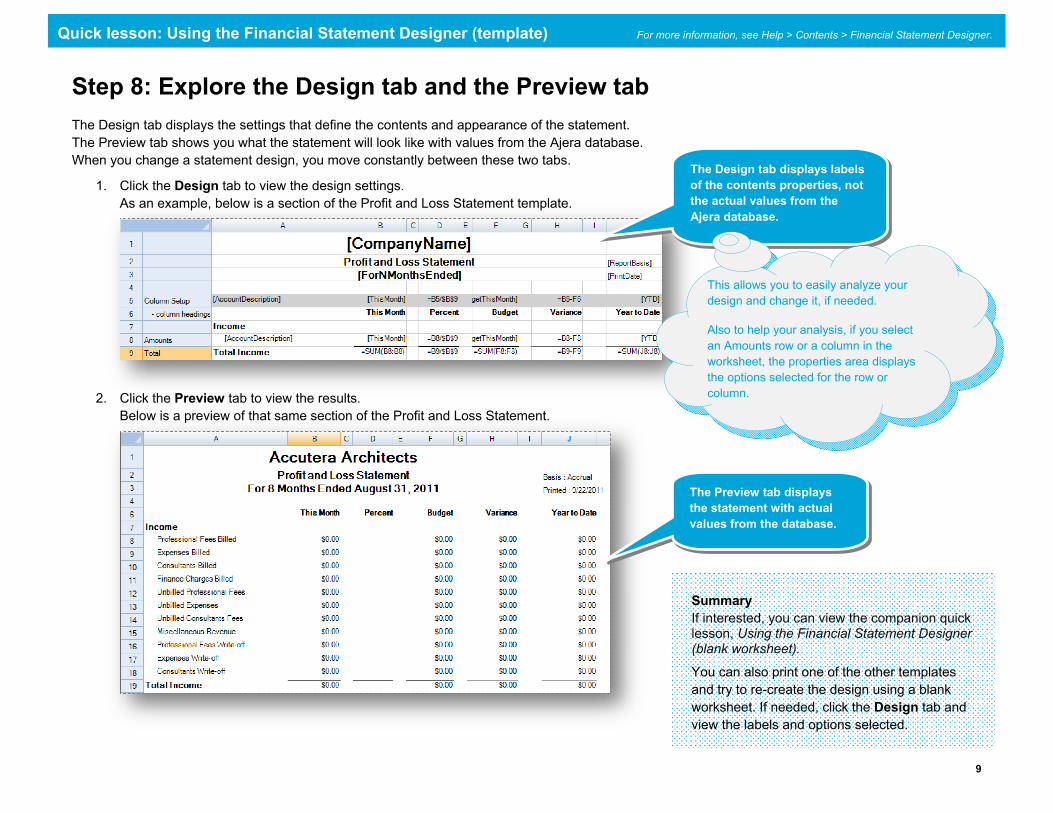
Step 8: Explore the Design tab and the Preview tab The Design tab displays the settings that define the contents and appearance of the statement. The Preview tab shows you what the statement will look like with values from the Ajera database. When you change a statement design, you move constantly between these two tabs.
1. Click the Design tab to view the design settings. As an example, below is a section of the Profit and Loss Statement template.
2. Click the Preview tab to view the results. Below is a preview of that same section of the Profit and Loss Statement.
The Design tab displays labels of the contents properties, not the actual values from the Ajera database.
This allows you to easily analyze your design and change it, if needed.
Also to help your analysis, if you select an Amounts row or a column in the worksheet, the properties area displays the options selected for the row or column.
The Preview tab displays the statement with actual values from the database.