Embed Size (px)
Citation preview

Using the AP Instructional Planning Report to Improve Student Achievement
Using the AP Instructional Planning Report to Improve Student Achievement August 5, 2014
Agenda
+ Why AP Matters
+ Overview of AP Online Score Reporting (OSR) • How to Access
• Types of Reports
• Quick Tips
+ Strategic Use of AP Instructional Planning Reports (APIPR) • Report Overview
• Strategic Questions
• Factors That Influence Performance
• Next Steps
+ Resources
3

Why AP Matters
4
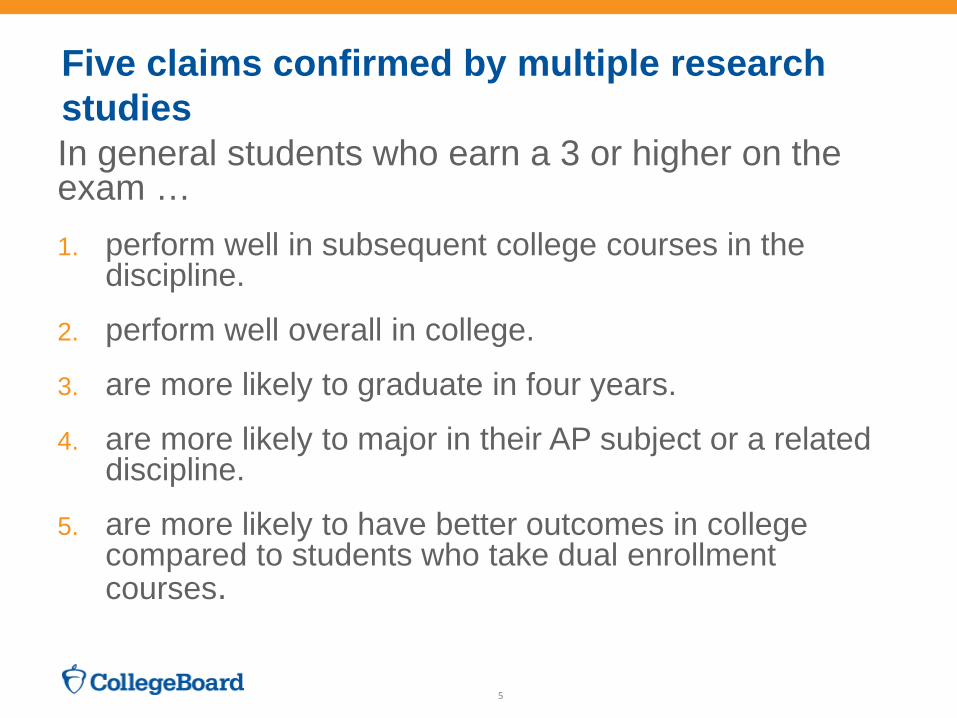
In general students who earn a 3 or higher on the exam … 1. perform well in subsequent college courses in the
discipline.
2. perform well overall in college.
3. are more likely to graduate in four years.
4. are more likely to major in their AP subject or a related discipline.
5. are more likely to have better outcomes in college compared to students who take dual enrollment courses.
Five claims confirmed by multiple research studies
5
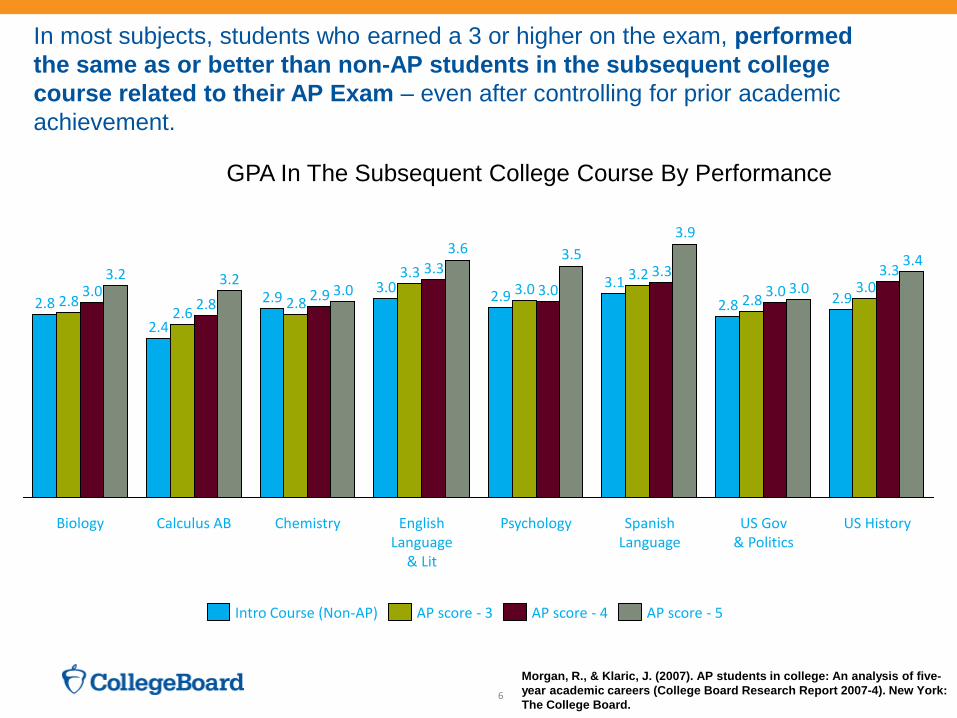
In most subjects, students who earned a 3 or higher on the exam, performed the same as or better than non-AP students in the subsequent college course related to their AP Exam – even after controlling for prior academic achievement.
Morgan, R., & Klaric, J. (2007). AP students in college: An analysis of five-year academic careers (College Board Research Report 2007-4). New York: The College Board.
6
3.3 3.3 3.0
Chemistry
3.0 2.9 2.8 2.9
Calculus AB
3.2 2.8 2.6
US History
3.4 3.3 3.0
2.9
US Gov & Politics
3.0 3.0 2.8 2.8
Spanish Language
3.9
3.3 3.2 3.1
Psychology
3.5
3.0 3.0 2.9
English Language
& Lit
3.6
2.4
Biology
3.2 3.0 2.8 2.8
AP score - 3 Intro Course (Non-AP) AP score - 5 AP score - 4
GPA In The Subsequent College Course By Performance
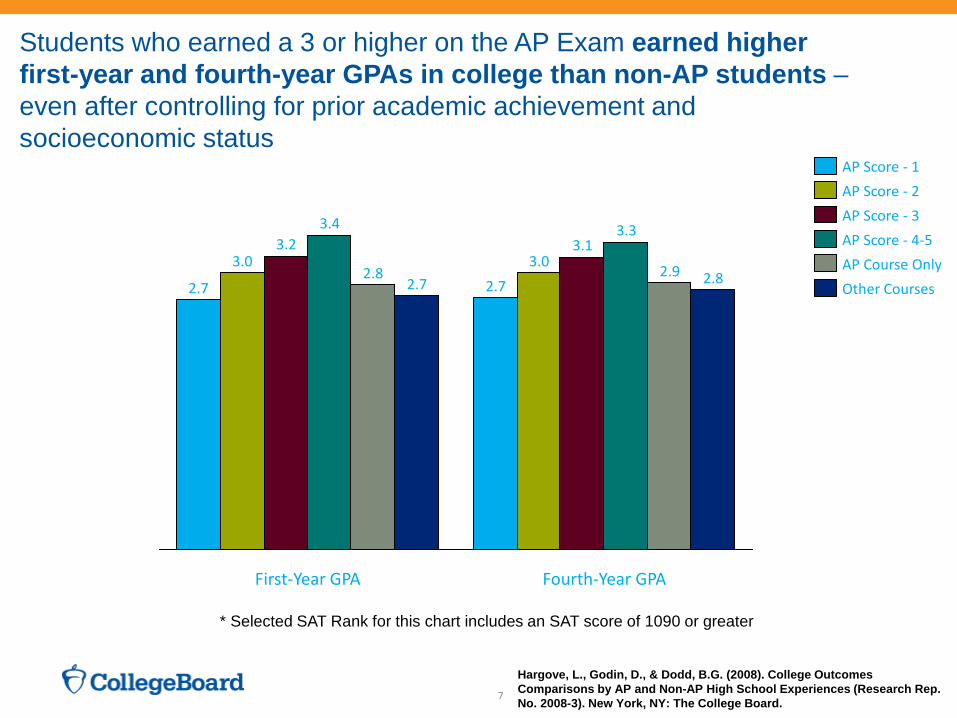
Students who earned a 3 or higher on the AP Exam earned higher first-year and fourth-year GPAs in college than non-AP students – even after controlling for prior academic achievement and socioeconomic status
Hargove, L., Godin, D., & Dodd, B.G. (2008). College Outcomes Comparisons by AP and Non-AP High School Experiences (Research Rep. No. 2008-3). New York, NY: The College Board.
7
Fourth-Year GPA
2.8 2.9
3.3 3.1
3.0 2.7
First-Year GPA
2.7 2.8
3.4 3.2
3.0
2.7
AP Score - 3 AP Score - 4-5 AP Course Only Other Courses
AP Score - 2 AP Score - 1
* Selected SAT Rank for this chart includes an SAT score of 1090 or greater

Students who took one or more AP Exams, regardless of what score was earned, are more likely to graduate in four years than non-AP students - even after controlling for prior academic achievement, demographic variables and school-level variables.
Mattern, K., Marini, J. P., & Shaw, E. J. (2013). Are AP Students More Likely To Graduate On Time? (College Board Research Report 2013-5). New York, NY: The College Board.
8
45%
54% 47%
53% 59%
64% 69%
0%
10%
20%
30%
40%
50%
60%
70%
80%
No Yes 1 2 3 4 5
Expe
cted
Fou
r-Ye
ar G
radu
atio
n Ra
te
AP Participation and Performance
Expected Four-Year Graduation Rate by AP Participation and Performance
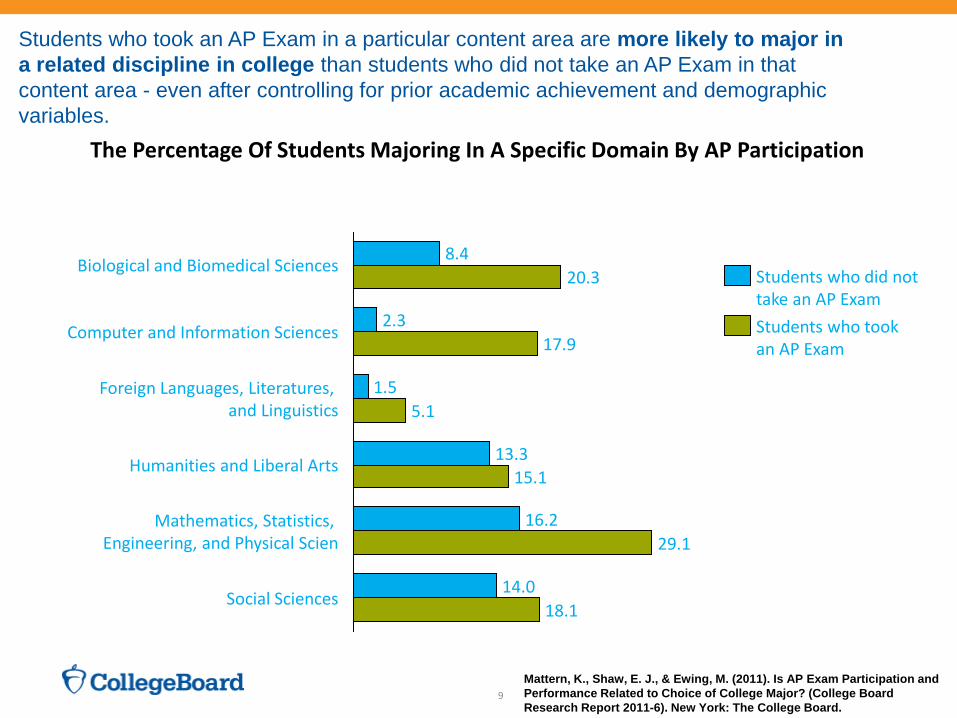
Students who took an AP Exam in a particular content area are more likely to major in a related discipline in college than students who did not take an AP Exam in that content area - even after controlling for prior academic achievement and demographic variables.
Mattern, K., Shaw, E. J., & Ewing, M. (2011). Is AP Exam Participation and Performance Related to Choice of College Major? (College Board Research Report 2011-6). New York: The College Board.
9
The Percentage Of Students Majoring In A Specific Domain By AP Participation
13.3 15.1
Mathematics, Statistics, Engineering, and Physical Scien
16.2 29.1
Social Sciences 14.0
18.1
Biological and Biomedical Sciences
Computer and Information Sciences
Foreign Languages, Literatures, and Linguistics
8.4 20.3
2.3 17.9
1.5 5.1
Humanities and Liberal Arts
Students who did not take an AP Exam Students who took an AP Exam

The AP exam may be a more accurate reflection of academic preparedness for success in college
10
Kaliski, P. & Godfrey, K. (in press). Does the Type of High School Science Course Matter? An Investigation of the Relationship Between Science Courses and First-Year College Outcomes. New York: The College Board.
Predicted First-Year GPAs for Four Science Courses
Overview of AP Online Score Reporting https://scores.collegeboard.org
11
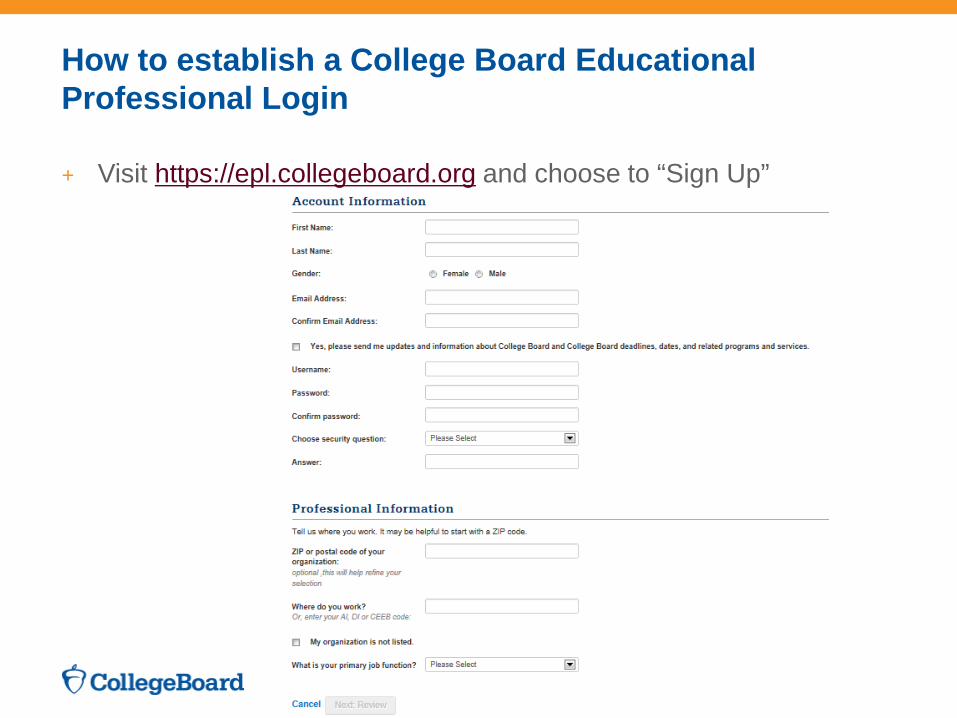
How to establish a College Board Educational Professional Login
+ Visit https://epl.collegeboard.org and choose to “Sign Up”
Teacher Access
+ Only teachers authorized through the AP Course Audit for the current year have access to their students' exam scores online.
+ Teachers only see reports in the subjects they are authorized to teach, and they may see data for students in their specific sections if section codes were designated on exam day.
+ Contact AP Services at (877) 274-6474 if you need assistance.
Access Codes for School Administrators Some administrators who are not authorized through the AP Course Audit will need access codes in addition to their Education Professional logins to view 2014 scores online.
+ Any administrator at your school who has an authorized role in the 2013-14 AP Course Audit does not need an access code.
+ School administrators who do not have a 2013-14 AP Course Audit account need an access code to enter the Online Reports for Educators website if: • They did not access previous years' AP Exam scores online; or
• The email address listed for them on the 2013-14 AP Participation Form does not match the email address in their Education Professional account.
Access Codes for School Administrators
+ If you accessed AP Exam scores online in previous years and the email listed in your Education Professional account matches the email given for you on your school's 2013-14 AP Participation Form, you should not need an access code.
+ In late May and again in late June 2014, the College Board emailed 2014 access codes to AP Coordinators and principals designated on schools' 2013-14 Participation Forms and to 2012-13 AP Course Audit administrators.
+ Contact AP Services at (877) 274-6474 if you need assistance.
Access Codes for District Administrators + District administrators who have an authorized role in the 2013-14
AP Course Audit do not need an access code to enter the Online Reports for Educators website.
+ District administrators who do not have a 2013-14 AP Course Audit account need an access code if: • They did not access previous years' AP Exam scores online; or
• The email address listed for them on the 2014 AP Online Scores Contact Information Update Form (mailed to districts in March 2014) — or, if applicable, on the updated form returned by their district by April 30, 2014— does not match the email address in their College Board Education Professional account.
+ Contact AP Services at (877) 274-6474 if you need assistance.
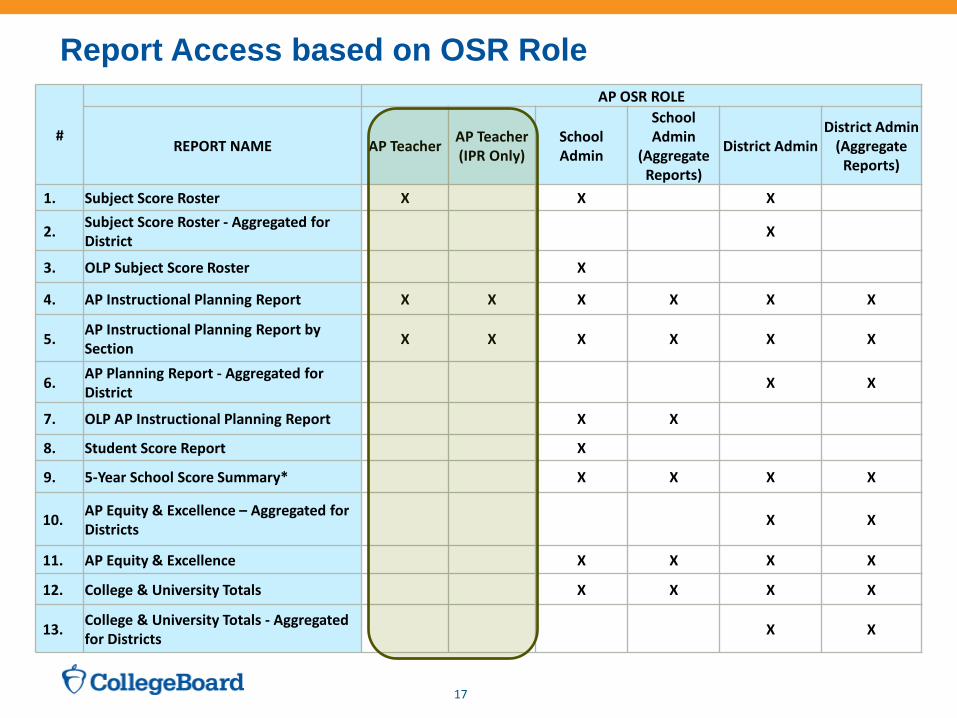
Report Access based on OSR Role
#
AP OSR ROLE
REPORT NAME AP Teacher AP Teacher (IPR Only)
School Admin
School Admin
(Aggregate Reports)
District Admin District Admin
(Aggregate Reports)
1. Subject Score Roster X X X 2. Subject Score Roster - Aggregated for
District X 3. OLP Subject Score Roster X 4. AP Instructional Planning Report X X X X X X
5. AP Instructional Planning Report by Section X X X X X X
6. AP Planning Report - Aggregated for District X X
7. OLP AP Instructional Planning Report X X 8. Student Score Report X 9. 5-Year School Score Summary* X X X X
10. AP Equity & Excellence – Aggregated for Districts
X X
11. AP Equity & Excellence X X X X
12. College & University Totals X X X X
13. College & University Totals - Aggregated for Districts X X
17
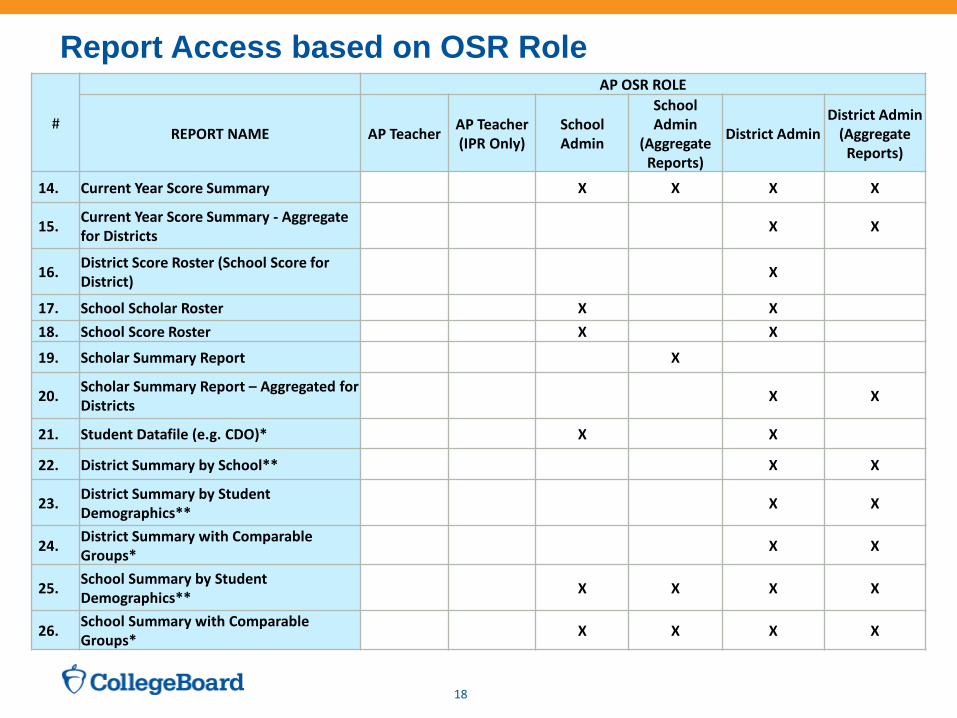
Report Access based on OSR Role
#
AP OSR ROLE
REPORT NAME AP Teacher AP Teacher (IPR Only)
School Admin
School Admin
(Aggregate Reports)
District Admin District Admin
(Aggregate Reports)
14. Current Year Score Summary X X X X
15. Current Year Score Summary - Aggregate for Districts
X X
16. District Score Roster (School Score for District)
X
17. School Scholar Roster X X 18. School Score Roster X X
19. Scholar Summary Report X
20. Scholar Summary Report – Aggregated for Districts X X
21. Student Datafile (e.g. CDO)* X X
22. District Summary by School** X X
23. District Summary by Student Demographics**
X X
24. District Summary with Comparable Groups* X X
25. School Summary by Student Demographics**
X X X X
26. School Summary with Comparable Groups* X X X X
18
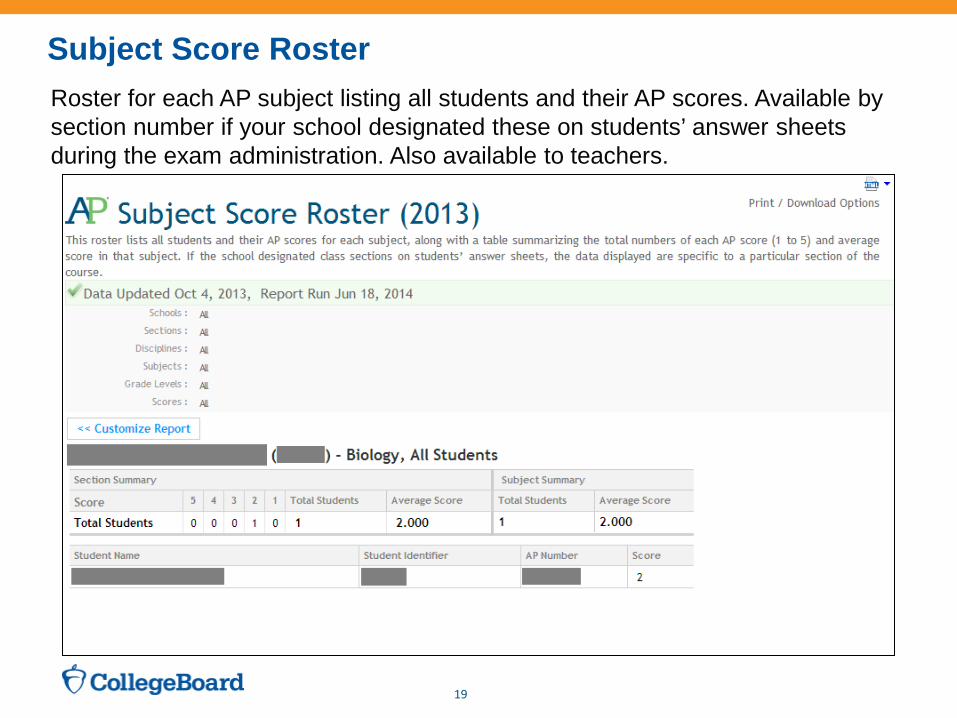
Subject Score Roster Roster for each AP subject listing all students and their AP scores. Available by section number if your school designated these on students’ answer sheets during the exam administration. Also available to teachers.
19

Quick Tips
Navigation: Avoid using the Back button on your browser to navigate the system. Instead, use the navigation bar to go back to your home page:
...and use the Page Up/Page Down links at the bottom of the reports:
Report Years: Reports for multiple exam years are available. To see previous years’ reports, select from the dropdown menu at the top right of your home page:
20
Exporting Data
+ In addition to viewing reports in your Web browser, you can view and export reports in PDF and Excel (2007 and 2002) formats.
Best Practice: Customization and filtering options are available through the website, but exporting data gives you the freedom to customize and filter data in additional ways.
► More best practices for using online score reports are at www.collegeboard.org/apscorestips.
21
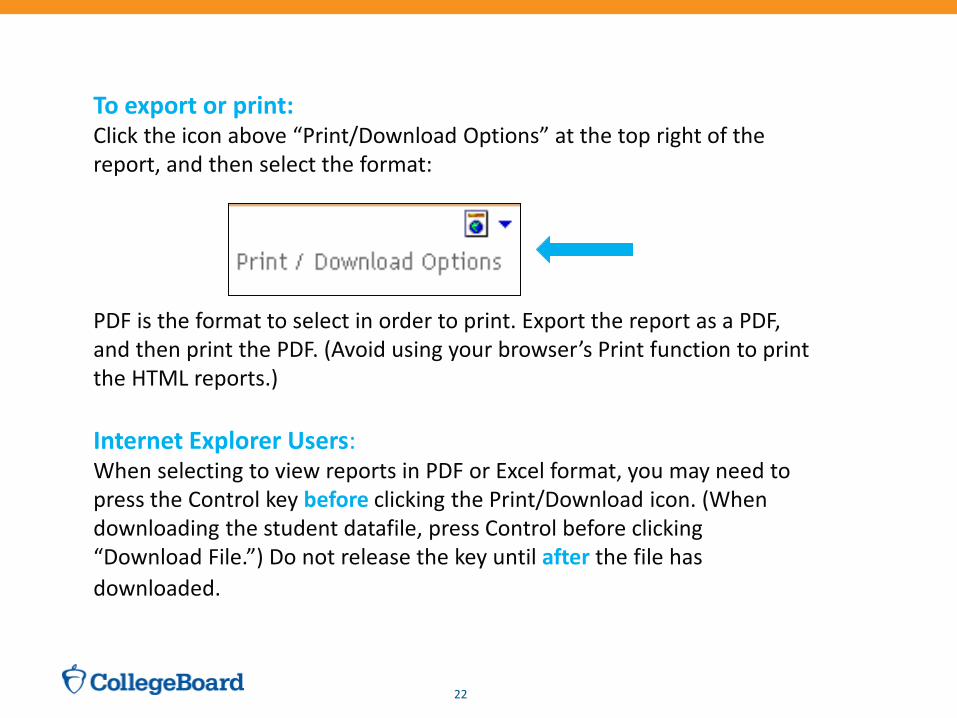
To export or print: Click the icon above “Print/Download Options” at the top right of the report, and then select the format:
PDF is the format to select in order to print. Export the report as a PDF, and then print the PDF. (Avoid using your browser’s Print function to print the HTML reports.) Internet Explorer Users: When selecting to view reports in PDF or Excel format, you may need to press the Control key before clicking the Print/Download icon. (When downloading the student datafile, press Control before clicking “Download File.”) Do not release the key until after the file has downloaded.
Tips and Best Practices for Exporting Data
22
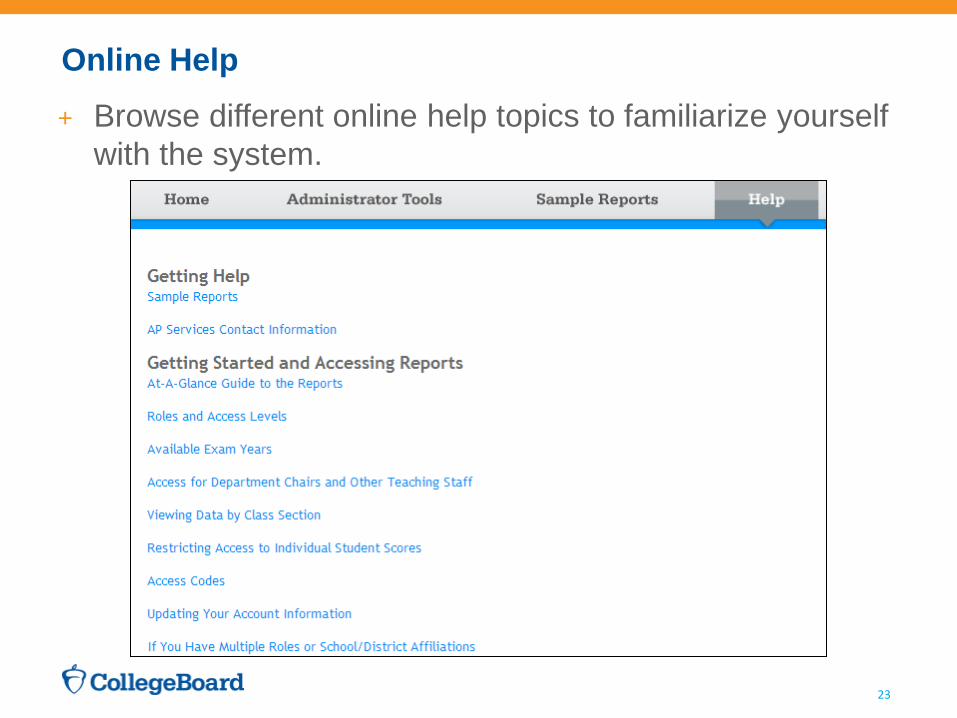
+ Browse different online help topics to familiarize yourself with the system.
Online Help
23

Strategic Use of AP Instructional Planning Reports
24
AP Instructional Planning Report
+ Subject-specific report showing the performance of students on the multiple-choice and free-response sections and on specific topics within that AP Exam, compared to all students.
+ AP teachers have access to this report: • Helps target areas for increased attention and focus in the
curriculum • Helps guide course planning and professional development.
+ Available by section number if your school designated these on
students’ answer sheets during the exam administration. For more information about designating class sections, visit
http://professionals.collegeboard.com/testing/ap/scores/online-score-reporting/designating-class-sections
25
AP Instructional Planning Report (Page 2)
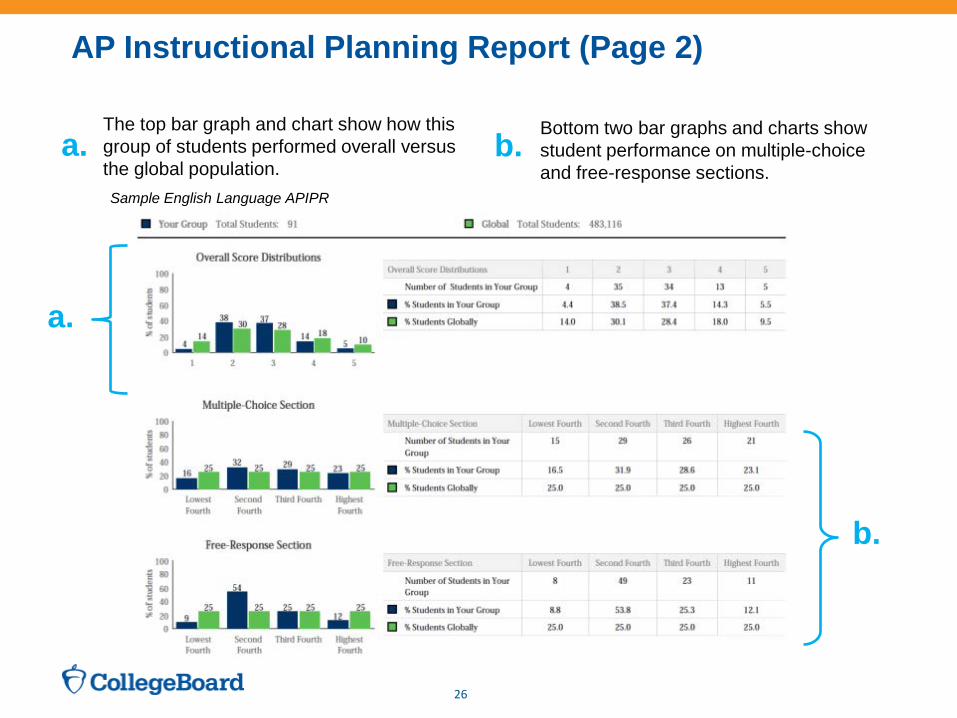
The top bar graph and chart show how this group of students performed overall versus the global population.
Bottom two bar graphs and charts show student performance on multiple-choice and free-response sections.
a. b.
a.
b.
26
Sample English Language APIPR
AP Instructional Planning Report – Deep Dive
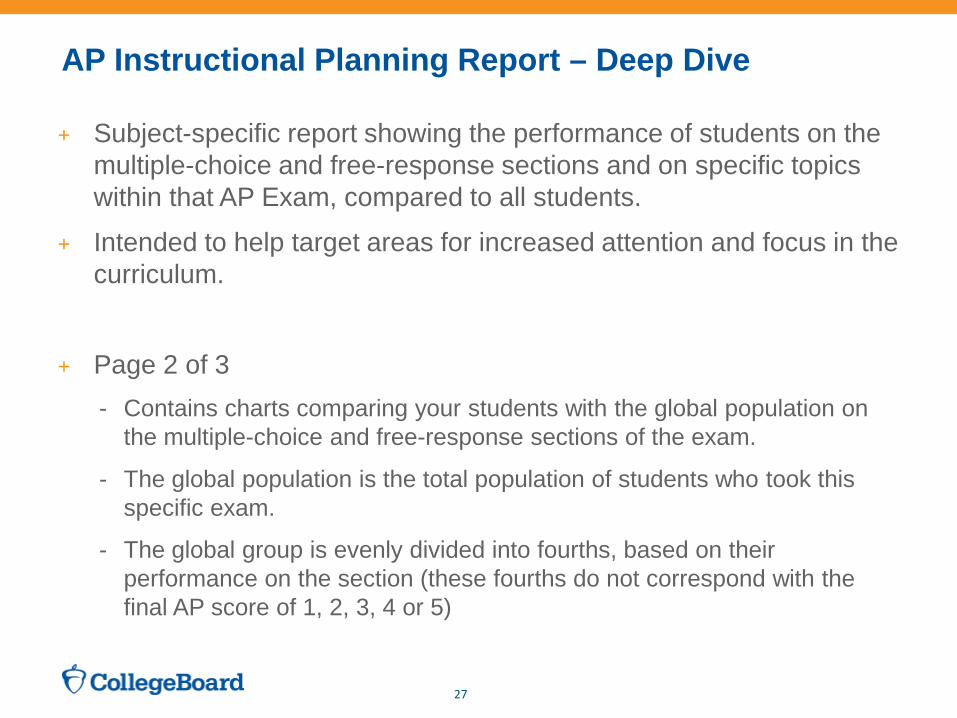
+ Subject-specific report showing the performance of students on the multiple-choice and free-response sections and on specific topics within that AP Exam, compared to all students.
+ Intended to help target areas for increased attention and focus in the curriculum.
+ Page 2 of 3 - Contains charts comparing your students with the global population on
the multiple-choice and free-response sections of the exam.
- The global population is the total population of students who took this specific exam.
- The global group is evenly divided into fourths, based on their performance on the section (these fourths do not correspond with the final AP score of 1, 2, 3, 4 or 5)
27
AP Instructional Planning Report (Page 3)
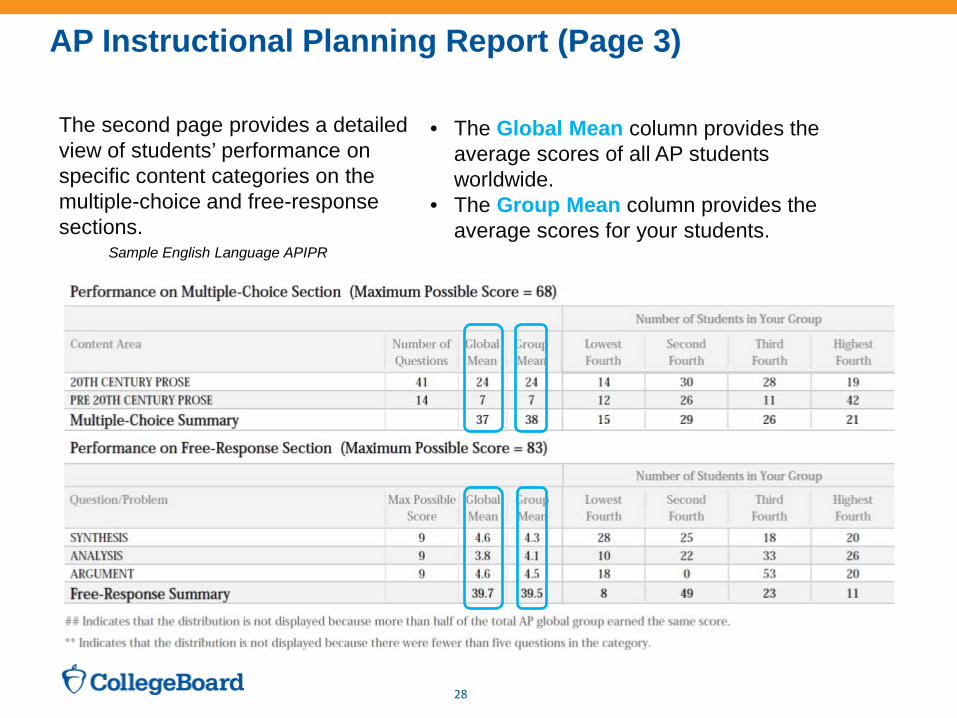
• The Global Mean column provides the average scores of all AP students worldwide.
• The Group Mean column provides the average scores for your students.
The second page provides a detailed view of students’ performance on specific content categories on the multiple-choice and free-response sections.
28
Sample English Language APIPR
AP Instructional Planning Report – Deep Dive Cont’d + Page 3 of 3
- Contains two sections
− Performance on multiple-choice by specific content areas
• Includes Number of Questions, Global Mean, Group Mean, and Quartiles
− Performance on free-response by specific content areas
• Includes Max Possible Score, SP , Global Mean, Group Mean, Quartiles
• SP (known as Science Practice) is only applicable to Biology (redesigned in 2013) and Chemistry (redesigned in 2014). It indicates the Science Practice objectives that were tested in each of the free-response questions on the exam.
- Global Mean is based on all AP student’s average scores on specific content areas (these average scores do not correspond with the final AP score of 1, 2, 3, 4 or 5)
- Group Mean is based on ‘your’ student population.
29

AP Instructional Planning Report (Page 2)
The top bar graph and chart show how this group of students performed overall versus the global population.
Bottom two bar graphs and charts show student performance on multiple-choice and free-response sections.
a. b.
a.
b.
30
Sample English Language APIPR
Strategic Use of AP Instructional Planning Reports
Look Fors: • Number of students below proficiency, at proficiency, and above
proficiency • Number of students scoring in each quartile for the multiple choice and
free response sections • How your students compare to students globally • Comparison of current year data to data from previous years • Statistically significant differences Questions to ask: 1. What are my initial observations? 2. What do my observations mean? 3. What implications are there? 4. What needs to be done?

AP Instructional Planning Report (Page 3)
• The Global Mean column provides the average scores of all AP students worldwide.
• The Group Mean column provides the average scores for your students.
The second page provides a detailed view of students’ performance on specific content categories on the multiple-choice and free-response sections.
32
Sample English Language APIPR
Strategic Use of AP Instructional Planning Reports
Look Fors : • How your students compare to students globally • Number of students scoring in each quartile for the multiple choice
and free response sections • Comparison of current year data to data from previous years • Statistically significant differences • Content area strengths and weaknesses Questions to ask: 1. What are my initial observations? 2. What do my observations mean? 3. What are the implications? 4. What needs to be done?
Factors That Influence Performance
+ Results may be due to departure in local course content from the AP Course Description
+ Differences in performance may result from the use of different instructional methods.
+ Performance may be due to the relative preparation and achievement of your group and the global population.
+ Differences in performance on multiple-choice content areas or free-response questions may occur when your group represents a population of students with characteristics different from the global population (e.g., educational background, level of skills, achievement).
Use Care in Interpreting the Report
+ If your group is very different from the global population, differences in performance should be expected. Schools that are building new AP programs may need several years—as teachers develop and courses in the years prior to AP are aligned—before results matching or exceeding global results are achieved.
+ Small differences in the distribution of students should not be over-interpreted, especially when the number of students in your group is small.
+ Differences in performance should not be over-interpreted when a multiple-choice content area or free-response question/problem of the exam has a small number of questions; the differences may not be statistically significant.
Strategic Use of AP Instructional Planning Reports
Next Steps:
+ Review and compare current APIPR to APIPRs from previous years.
+ If your school has AP teachers with multiple class sections or multiple teachers teaching the same AP subject, you and your teachers can get subject score rosters and AP Instructional Planning Reports at the class section or teacher level.
+ Once you analyze your APIPR individually, work with other AP teachers to identify curriculum and instruction strengths and weaknesses.
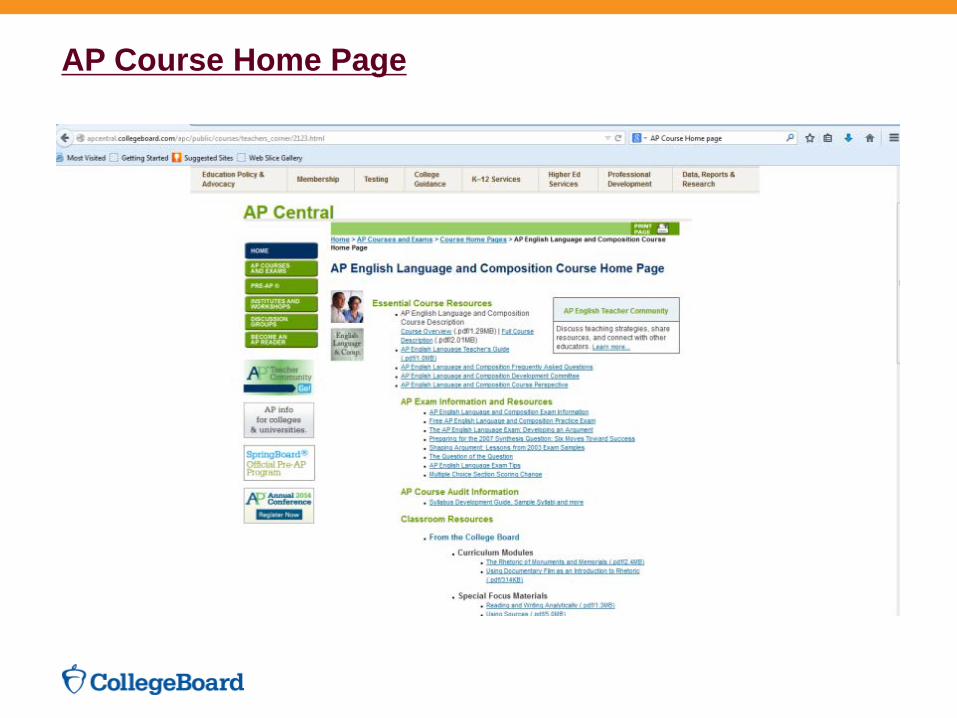
+ Use AP Course home page, AP Audit, and AP Community to access AP Course and AP Exam resources: released free-response scoring guidelines, sample student responses, and commentary.
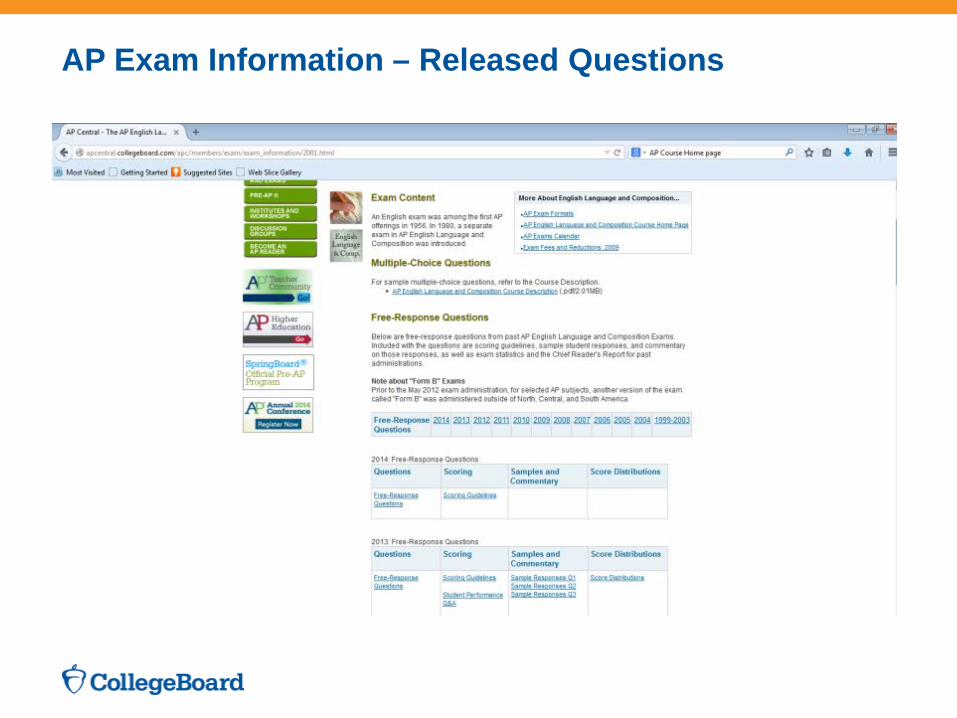
AP Exam Information – Released Questions
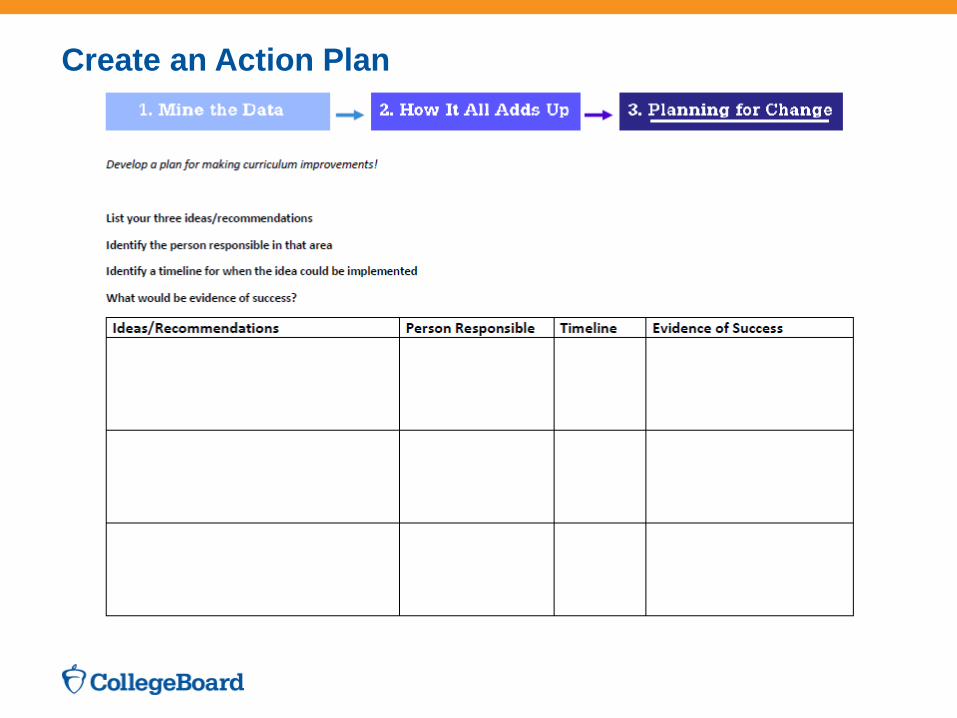
Create an Action Plan

Resources
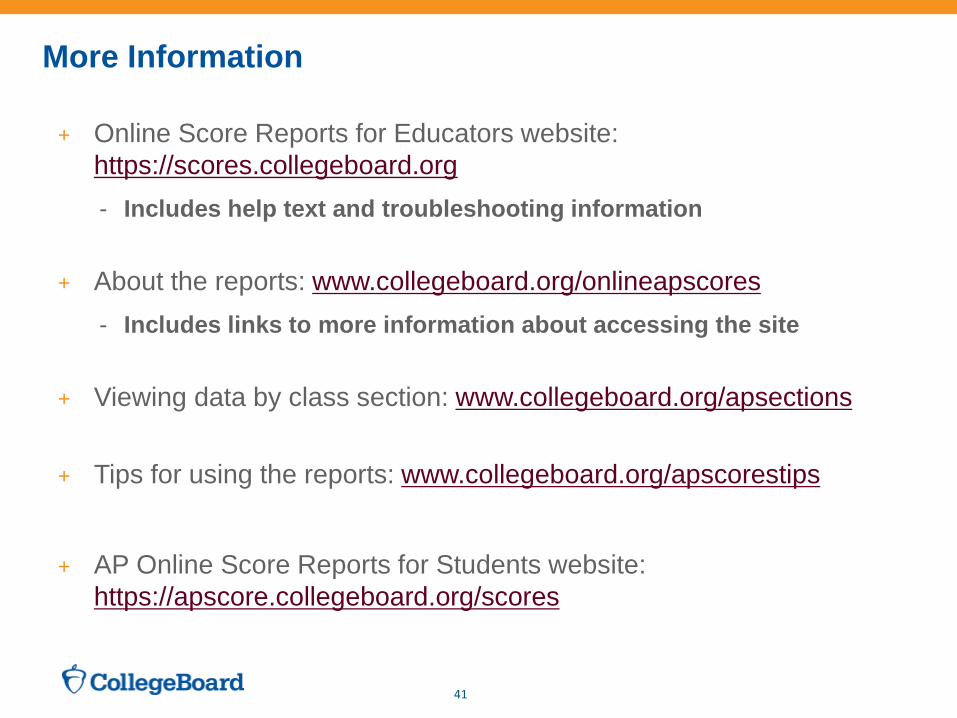
More Information
+ Online Score Reports for Educators website: https://scores.collegeboard.org - Includes help text and troubleshooting information
+ About the reports: www.collegeboard.org/onlineapscores - Includes links to more information about accessing the site
+ Viewing data by class section: www.collegeboard.org/apsections
+ Tips for using the reports: www.collegeboard.org/apscorestips
+ AP Online Score Reports for Students website: https://apscore.collegeboard.org/scores
41
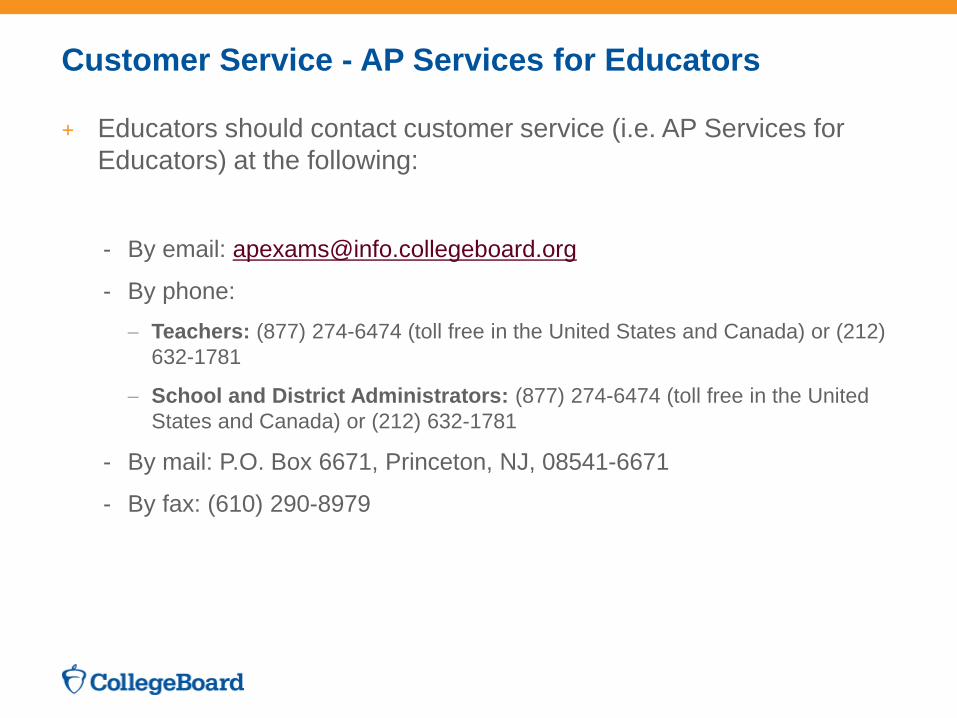
Customer Service - AP Services for Educators
+ Educators should contact customer service (i.e. AP Services for Educators) at the following:
- By email: [email protected]
- By phone: − Teachers: (877) 274-6474 (toll free in the United States and Canada) or (212)
632-1781
− School and District Administrators: (877) 274-6474 (toll free in the United States and Canada) or (212) 632-1781
- By mail: P.O. Box 6671, Princeton, NJ, 08541-6671
- By fax: (610) 290-8979
Contact Information
Amanda Dawson
Senior Educational Manager, K-12 Services
512-721-1832


![Instructional Planning Guide Ix[1]](https://img.pdfslide.us/doc/110x75/55361c9b4a7959a0138b4851/instructional-planning-guide-ix1.jpg)