Embed Size (px)
Citation preview
AQUATIC CONSERVATION: MARINE AND FRESHWATER ECOSYSTEMS
Aquatic Conserv: Mar. Freshw. Ecosyst. 20: 150–158 (2010)
Published online 19 August 2009 in Wiley InterScience(www.interscience.wiley.com). DOI: 10.1002/aqc.1060
Using T-PODs to assess variations in the occurrence of coastalbottlenose dolphins and harbour porpoises
HELEN BAILEYy, GEMMA CLAY, ELIZABETH A. COATES, DAVID LUSSEAU, BRIDGET SENIOR
and PAUL M. THOMPSON�
University of Aberdeen, Institute of Biological & Environmental Sciences, Lighthouse Field Station, Cromarty, Ross-shire, IV11 8YJ,
Scotland, UK
ABSTRACT
1. Assessments of anthropogenic impacts on cetaceans are often constrained by limited data on the extent towhich these species use particular areas.2. Timing porpoise detectors (T-PODs) are autonomous data recorders for detecting cetacean echolocation
clicks, potentially providing cost-effective opportunities for monitoring cetacean occurrence.3. The performance of T-PODs was assessed in three areas off the Scottish east coast, where the relative
occurrence of bottlenose dolphins and harbour porpoises was known to differ. Land-based observations in onearea compared visual and acoustic detections of dolphins, while direct hydrophone recordings of dolphinecholocation clicks were compared with T-POD detections during boat surveys.4. Land-based surveys recorded 89 groups of dolphins within 900 m of the T-POD. All groups spending430min
in the area were detected on the T-POD, and the probability of detection declined in relation to distance from therecording site.5. The number of dolphin clicks recorded on the independent hydrophone system was significantly related to
the number detected by a T-POD. Between pairs of T-PODs, there was also significant correlation with thenumbers of clicks recorded in each hour, both for channels set to detect bottlenose dolphins and for channels setto detect harbour porpoises.6. Year-round deployments of paired T-PODs detected significant geographical variation in detections for both
bottlenose dolphins and harbour porpoises. This pattern reflected published data from visual surveys, wheredolphins occurred most regularly within the Moray Firth Special Area of Conservation, and porpoises weresighted more regularly in offshore waters.7. T-PODs do not detect all cetaceans in the area, and care must be taken when interpreting data from mixed
species communities. Nevertheless, these results confirm that T-PODs provide an effective method for monitoringthe occurrence of bottlenose dolphins and harbour porpoises, and provide excellent potential for collectingbaseline data from poorly studied areas and monitoring long-term temporal change in key areas of interest.Copyright r 2009 John Wiley & Sons, Ltd.
Received 21 November 2008; Revised 1 May 2009; Accepted 21 June 2009
KEY WORDS: cetaceans; passive acoustics; monitoring; echolocation; marine protected areas
INTRODUCTION
Recent developments in survey techniques and analyticalframeworks have greatly improved our understanding ofbroad-scale distribution and abundance of many coastal
cetacean populations (Evans and Hammond, 2004; Redfern
et al., 2006). Nevertheless, efforts to assess the impact ofspecific coastal developments or to monitor the success
of conservation action often remain constrained by a lack offiner-scale data on the occurrence of cetaceans in specific areas.Baseline data on temporal variation in the occurrence of
cetaceans in affected areas is of particular importance for
*Correspondence to: Paul M. Thompson, University of Aberdeen, Institute of Biological & Environmental Sciences, Lighthouse Field Station,Cromarty, Ross-shire, IV11 8YJ, Scotland, UK. E-mail: [email protected] address: NOAA/NMFS, Southwest Fisheries Science Center, Environmental Research Division, 1352 Lighthouse Avenue, Pacific Grove,CA 93950-2097 USA.
Copyright r 2009 John Wiley & Sons, Ltd.
impact assessment and the identification of appropriatemitigation measures (Weilgart, 2007; Jefferson et al., 2009).Typically, these assessments require data to be collected at
scales of only a few to tens of square kilometres, over periodsof at least one or two years. In contrast, cetacean surveytechniques typically focus on providing larger-scale estimates
of abundance (Hammond et al., 2002), or modellingdistribution (Weir et al., 2001; Canadas et al., 2005), acrossscales of hundreds to thousands of square kilometres. The
effort required to survey such large areas consequently meansthat few of these studies are able to extrapolate beyond asingle, short, time period.
Efforts to minimize the impact of coastal developments on
these species therefore require the development and validationof cost-effective techniques that can be used to produceappropriate fine-scale data on cetacean occurrence.
Furthermore, where data are required on temporalvariability, these techniques cannot be dependent upon thegood weather and daylight conditions required for large-scale
visual surveys of cetaceans (Evans and Hammond, 2004).Because cetaceans use sound to communicate and navigate,passive acoustic surveys have the potential to improve
detection probabilities in poor light or weather conditions(Di Sciara and Gordon, 1997). Such techniques are nowcommonly used independently and in combination with ship-based visual surveys (Norris et al., 1999; Clark and Ellison,
2000; Wade et al., 2006). Furthermore, acoustic recordingdevices that can collect data remotely over long periodsprovide additional opportunities for assessing temporal
patterns of occurrence (Verfuss et al., 2007).T-PODs (timing-porpoise detectors) were developed to
detect harbour porpoises (Phocoena phocoena), and have since
underpinned a variety of studies on this species (Culik et al.,2001; Carlstrom, 2005; Thomsen et al., 2005; Carstensen et al.,2006). These devices incorporate a hydrophone, analogue
processor and digital timing system that automatically log thestart and end of each echolocation click to 10 ms resolution.In every minute, the T-POD runs six successive scanswithin different user-defined frequencies, logging detections
for periods of over five months depending upon batteryconfiguration. An accompanying software program is used topost-process the recovered data, detect characteristic click
trains, and remove noises from other sources such as boatsonar (see www.chelonia.co.uk for details). Resulting data onthe number of click trains recorded in each minute can be used
to determine the presence or absence of target species indifferent time periods, or to identify the timing and duration ofencounters with target species. To detect the high frequencyecholocation clicks of harbour porpoises, previous studies
have used a target frequency of 130 kHz, resulting in estimateddetection distances in the region of 200m (Tougaard et al.,2006). However, because cetaceans differ in the frequency
range of their echolocation clicks, T-PODs have the potentialto be used to detect other species. For example, using a targetfrequency of 50 kHz, Philpott et al. (2007) confirmed that
T-PODs could successfully detect bottlenose dolphin (Tursiopstruncatus) at distances of up to 1246m, with over 80% ofschools that were visually detected within 500m of the T-POD
also being detected acoustically.T-PODs therefore have the potential to provide a
finer-scale technique for assessing long-term variability in theoccurrence of certain cetacean species in specific sites. Previous
assessments of the performance of T-PODs have focused onstudies of harbour porpoises (Thomsen et al., 2005; Tougaardet al., 2006). This study builds upon Philpott et al.’s (2007)
work by assessing the potential for using T-PODs to examinelocal geographic variation in the occurrence of bottlenosedolphins. In particular, it was desired to compare the
performance of replicate T-PODs moored at sites that wereknown to differ in the relative probability of sighting harbourporpoises and bottlenose dolphins. Philpott et al.’s (2007)
recommendation for assessing T-POD detection rates by usingindependent visual and acoustic methods to validate automaticdetections of dolphins was followed. Finally, the resulting dataon geographic variation in the occurrence of these two species
are discussed, in relation to those derived from independentsources, to assess the potential for using T-PODs to supportmanagement and monitoring programmes for coastal
cetaceans.
METHODS
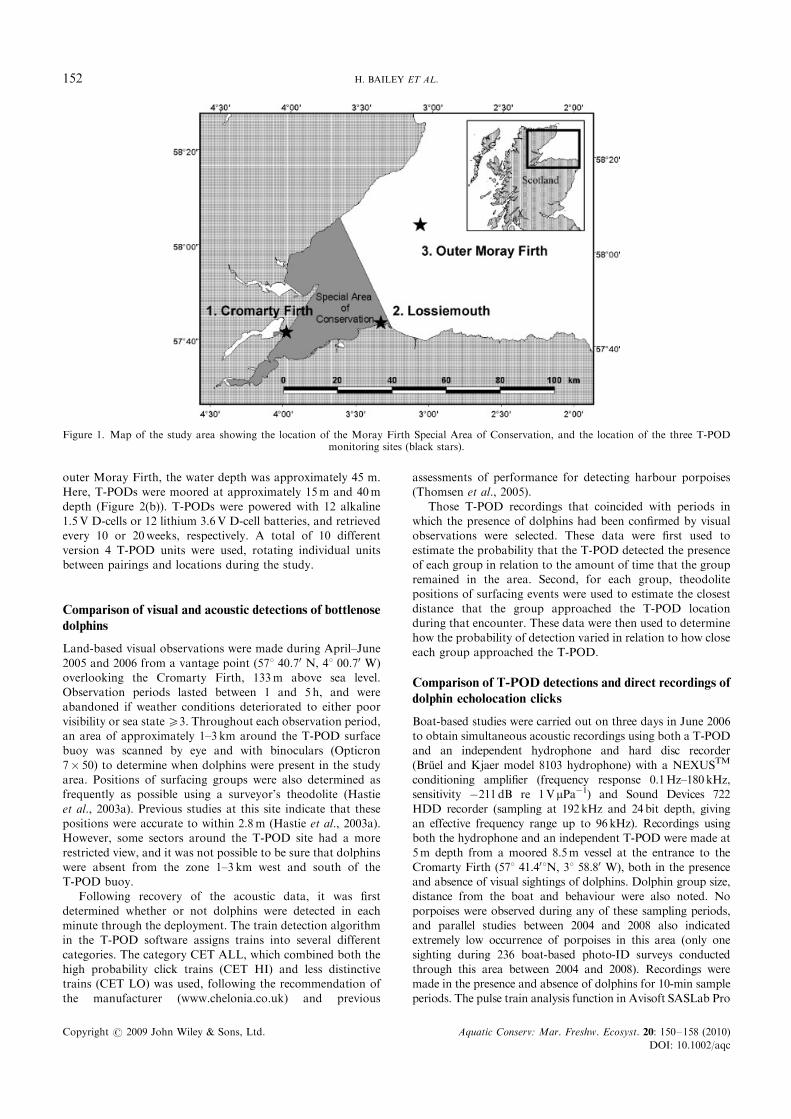
Study area
The study was carried out in the Moray Firth, NE Scotland,part of which has been designated as a Special Area ofConservation (SAC) to protect bottlenose dolphins under the
EU Habitats Directive (Figure 1). Previous studies indicatethat there is a summer peak in the abundance of bottlenosedolphins in the inner Moray Firth (Wilson et al., 1997; Hastieet al., 2004). The primary study site was in the mouth of the
Cromarty Firth, where shore-based visual observations couldbe made from a headland overlooking this area (Hastie et al.,2003a). The second site was also within the SAC, but at the
eastern boundary near Lossiemouth, where dolphins weresighted less frequently. Finally, a third site was located in thecentral part of the Moray Firth, outside the SAC, where
bottlenose dolphins are rarely recorded (Hastie et al., 2003b).In contrast, previous studies indicate that the probability ofsighting harbour porpoises is lower in the inner Moray Firth
but increases in more offshore areas (Hastie et al., 2003b;Bailey and Thompson, 2009). We therefore predict that thesethree sites should provide a gradient of decreasing occurrenceof bottlenose dolphins and increasing occurrence of harbour
porpoises.
Acoustic data collection
Version 4 T-PODs were used to detect echolocation click
trains, and all data were processed using version 8.17 of themanufacturer’s software (v.4 train filter). Following themanufacturer’s guidelines for use in areas where both
harbour porpoises and bottlenose dolphins might bedetected, T-PODs were configured to detect clicks fromdolphins and porpoises on alternate channels. For dolphins,a target frequency of 50 kHz and reference frequency of 70 kHz
(bandwidth5 5 and sensitivity5 6) were set. For porpoises, atarget frequency of 130 kHz and reference frequency of 92 kHz(bandwidth5 4 and sensitivity5 6) were set.
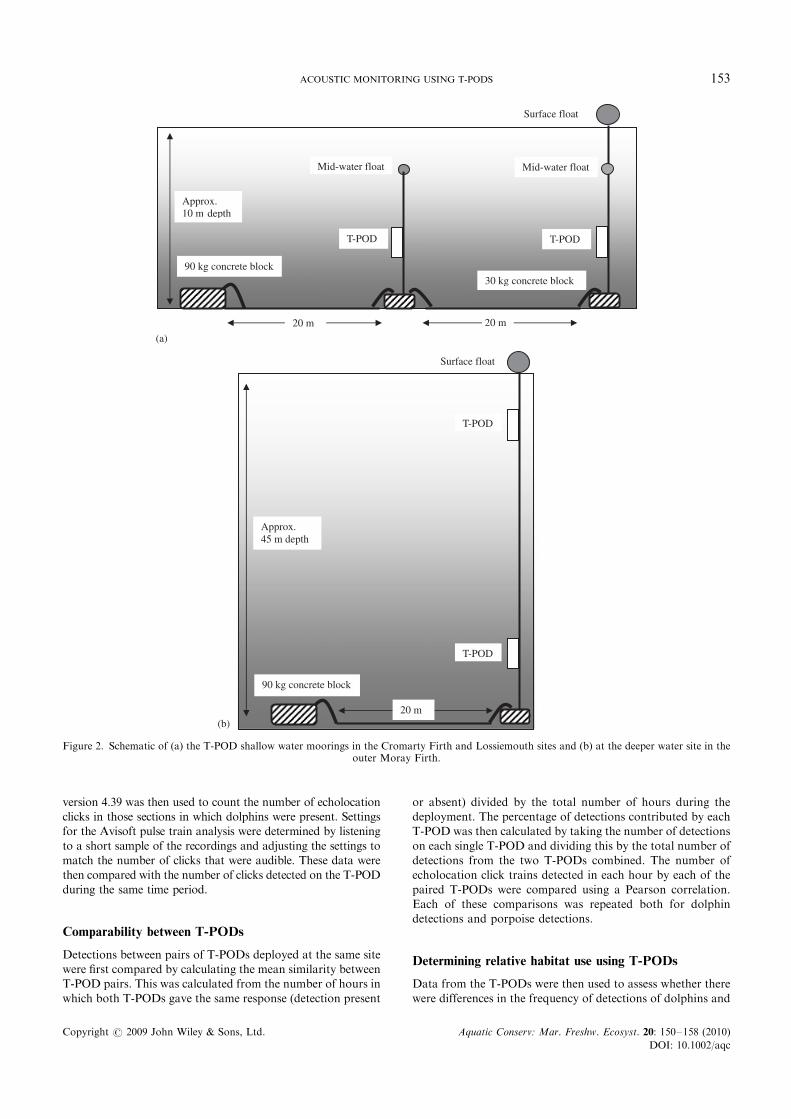
T-PODs were moored in pairs with concrete blocks and asurface float for easy recovery (Figure 2). In the CromartyFirth and at Lossiemouth, the T-PODs were 20m apart, about
2m above the seabed in 10m water depth (Figure 2(a)). In the
ACOUSTIC MONITORING USING T-PODS 151
Copyright r 2009 John Wiley & Sons, Ltd. Aquatic Conserv: Mar. Freshw. Ecosyst. 20: 150–158 (2010)
DOI: 10.1002/aqc
outer Moray Firth, the water depth was approximately 45 m.Here, T-PODs were moored at approximately 15m and 40m
depth (Figure 2(b)). T-PODs were powered with 12 alkaline1.5V D-cells or 12 lithium 3.6V D-cell batteries, and retrievedevery 10 or 20weeks, respectively. A total of 10 different
version 4 T-POD units were used, rotating individual unitsbetween pairings and locations during the study.
Comparison of visual and acoustic detections of bottlenose
dolphins
Land-based visual observations were made during April–June
2005 and 2006 from a vantage point (571 40.70 N, 41 00.70 W)overlooking the Cromarty Firth, 133m above sea level.Observation periods lasted between 1 and 5 h, and wereabandoned if weather conditions deteriorated to either poor
visibility or sea stateX3. Throughout each observation period,an area of approximately 1–3 km around the T-POD surfacebuoy was scanned by eye and with binoculars (Opticron
7� 50) to determine when dolphins were present in the studyarea. Positions of surfacing groups were also determined asfrequently as possible using a surveyor’s theodolite (Hastie
et al., 2003a). Previous studies at this site indicate that thesepositions were accurate to within 2.8m (Hastie et al., 2003a).However, some sectors around the T-POD site had a more
restricted view, and it was not possible to be sure that dolphinswere absent from the zone 1–3 km west and south of theT-POD buoy.
Following recovery of the acoustic data, it was first
determined whether or not dolphins were detected in eachminute through the deployment. The train detection algorithmin the T-POD software assigns trains into several different
categories. The category CET ALL, which combined both thehigh probability click trains (CET HI) and less distinctivetrains (CET LO) was used, following the recommendation of
the manufacturer (www.chelonia.co.uk) and previous
assessments of performance for detecting harbour porpoises(Thomsen et al., 2005).
Those T-POD recordings that coincided with periods inwhich the presence of dolphins had been confirmed by visualobservations were selected. These data were first used to
estimate the probability that the T-POD detected the presenceof each group in relation to the amount of time that the groupremained in the area. Second, for each group, theodolitepositions of surfacing events were used to estimate the closest
distance that the group approached the T-POD locationduring that encounter. These data were then used to determinehow the probability of detection varied in relation to how close
each group approached the T-POD.
Comparison of T-POD detections and direct recordings of
dolphin echolocation clicks
Boat-based studies were carried out on three days in June 2006to obtain simultaneous acoustic recordings using both a T-PODand an independent hydrophone and hard disc recorder
(Bruel and Kjaer model 8103 hydrophone) with a NEXUSTM
conditioning amplifier (frequency response 0.1Hz–180kHz,sensitivity �211dB re 1VmPa�1) and Sound Devices 722
HDD recorder (sampling at 192kHz and 24bit depth, givingan effective frequency range up to 96 kHz). Recordings usingboth the hydrophone and an independent T-POD were made at
5m depth from a moored 8.5m vessel at the entrance to theCromarty Firth (571 41.401N, 31 58.80 W), both in the presenceand absence of visual sightings of dolphins. Dolphin group size,distance from the boat and behaviour were also noted. No
porpoises were observed during any of these sampling periods,and parallel studies between 2004 and 2008 also indicatedextremely low occurrence of porpoises in this area (only one
sighting during 236 boat-based photo-ID surveys conductedthrough this area between 2004 and 2008). Recordings weremade in the presence and absence of dolphins for 10-min sample
periods. The pulse train analysis function in Avisoft SASLab Pro
Figure 1. Map of the study area showing the location of the Moray Firth Special Area of Conservation, and the location of the three T-PODmonitoring sites (black stars).
H. BAILEY ET AL.152
Copyright r 2009 John Wiley & Sons, Ltd. Aquatic Conserv: Mar. Freshw. Ecosyst. 20: 150–158 (2010)
DOI: 10.1002/aqc
version 4.39 was then used to count the number of echolocationclicks in those sections in which dolphins were present. Settingsfor the Avisoft pulse train analysis were determined by listening
to a short sample of the recordings and adjusting the settings tomatch the number of clicks that were audible. These data werethen compared with the number of clicks detected on the T-POD
during the same time period.
Comparability between T-PODs
Detections between pairs of T-PODs deployed at the same sitewere first compared by calculating the mean similarity betweenT-POD pairs. This was calculated from the number of hours in
which both T-PODs gave the same response (detection present
or absent) divided by the total number of hours during thedeployment. The percentage of detections contributed by eachT-POD was then calculated by taking the number of detections
on each single T-POD and dividing this by the total number ofdetections from the two T-PODs combined. The number ofecholocation click trains detected in each hour by each of the
paired T-PODs were compared using a Pearson correlation.Each of these comparisons was repeated both for dolphindetections and porpoise detections.
Determining relative habitat use using T-PODs
Data from the T-PODs were then used to assess whether there
were differences in the frequency of detections of dolphins and
T-POD
Mid-water float
90 kg concrete block 30 kg concrete block
Approx. 10 m depth
Mid-water float
T-POD
Surface float
20 m 20 m
20 m
Approx. 45 m depth
Surface float
T-POD
T-POD
90 kg concrete block
(a)
(b)
Figure 2. Schematic of (a) the T-POD shallow water moorings in the Cromarty Firth and Lossiemouth sites and (b) at the deeper water site in theouter Moray Firth.
ACOUSTIC MONITORING USING T-PODS 153
Copyright r 2009 John Wiley & Sons, Ltd. Aquatic Conserv: Mar. Freshw. Ecosyst. 20: 150–158 (2010)
DOI: 10.1002/aqc
porpoises at the three study locations. Detections wereanalysed for the period May 2005 to June 2006 in theCromarty Firth and Lossiemouth, and August 2005 to June
2006 for the site in the outer Moray Firth. Comparisons werebased on the proportion of hours in each month that dolphinsor porpoises were detected at each location.
RESULTS
Paired T-PODs were successfully deployed at all three sites forperiods of approximately 12 months, although there were someshort gaps within the record caused by battery failure before
recovery (Table 1). Units powered by alkaline batteries weretypically still recording when recovered after 8 to 10weeks.Units powered by lithium batteries recorded for periods of up
to 28weeks.
Ability of T-PODs to detect bottlenose dolphins
Land-based observations were made overlooking the T-POD
in the Cromarty Firth on 20 days in 2005 and 22 days in 2006.Dolphins were observed within 2.5 km of the T-POD locationson 12 and 17 of these days respectively, on 89 occasions
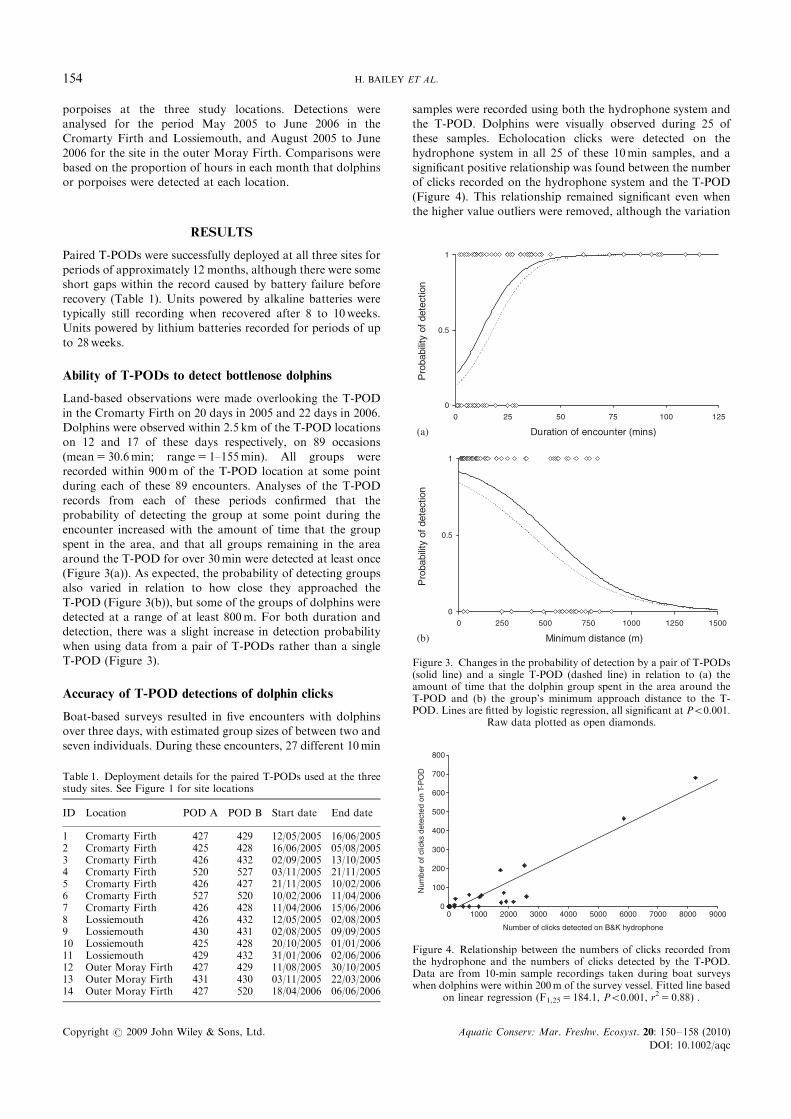
(mean5 30.6min; range5 1–155min). All groups wererecorded within 900m of the T-POD location at some pointduring each of these 89 encounters. Analyses of the T-POD
records from each of these periods confirmed that theprobability of detecting the group at some point during theencounter increased with the amount of time that the group
spent in the area, and that all groups remaining in the areaaround the T-POD for over 30min were detected at least once(Figure 3(a)). As expected, the probability of detecting groupsalso varied in relation to how close they approached the
T-POD (Figure 3(b)), but some of the groups of dolphins weredetected at a range of at least 800m. For both duration anddetection, there was a slight increase in detection probability
when using data from a pair of T-PODs rather than a singleT-POD (Figure 3).
Accuracy of T-POD detections of dolphin clicks
Boat-based surveys resulted in five encounters with dolphinsover three days, with estimated group sizes of between two and
seven individuals. During these encounters, 27 different 10min
samples were recorded using both the hydrophone system andthe T-POD. Dolphins were visually observed during 25 ofthese samples. Echolocation clicks were detected on the
hydrophone system in all 25 of these 10min samples, and asignificant positive relationship was found between the numberof clicks recorded on the hydrophone system and the T-POD
(Figure 4). This relationship remained significant even whenthe higher value outliers were removed, although the variation
Table 1. Deployment details for the paired T-PODs used at the threestudy sites. See Figure 1 for site locations
ID Location POD A POD B Start date End date
1 Cromarty Firth 427 429 12/05/2005 16/06/20052 Cromarty Firth 425 428 16/06/2005 05/08/20053 Cromarty Firth 426 432 02/09/2005 13/10/20054 Cromarty Firth 520 527 03/11/2005 21/11/20055 Cromarty Firth 426 427 21/11/2005 10/02/20066 Cromarty Firth 527 520 10/02/2006 11/04/20067 Cromarty Firth 426 428 11/04/2006 15/06/20068 Lossiemouth 426 432 12/05/2005 02/08/20059 Lossiemouth 430 431 02/08/2005 09/09/200510 Lossiemouth 425 428 20/10/2005 01/01/200611 Lossiemouth 429 432 31/01/2006 02/06/200612 Outer Moray Firth 427 429 11/08/2005 30/10/200513 Outer Moray Firth 431 430 03/11/2005 22/03/200614 Outer Moray Firth 427 520 18/04/2006 06/06/2006
0
100
200
300
400
500
600
700
800
0
Number of clicks detected on B&K hydrophone
Num
ber
of c
licks
det
ecte
d on
T-P
OD
1000 2000 3000 4000 5000 6000 7000 8000 9000
Figure 4. Relationship between the numbers of clicks recorded fromthe hydrophone and the numbers of clicks detected by the T-POD.Data are from 10-min sample recordings taken during boat surveyswhen dolphins were within 200m of the survey vessel. Fitted line based
on linear regression (F1,25 5 184.1, Po0.001, r2 5 0.88) .
0
0.5
1
0 25 50 75 100 125
Duration of encounter (mins)P
roba
bilit
y of
det
ectio
n
(b)
(a)
0
0.5
1
0 250 500 750 1000 1250 1500
Minimum distance (m)
Pro
babi
lity
of d
etec
tion
Figure 3. Changes in the probability of detection by a pair of T-PODs(solid line) and a single T-POD (dashed line) in relation to (a) theamount of time that the dolphin group spent in the area around theT-POD and (b) the group’s minimum approach distance to the T-POD. Lines are fitted by logistic regression, all significant at Po0.001.
Raw data plotted as open diamonds.
H. BAILEY ET AL.154
Copyright r 2009 John Wiley & Sons, Ltd. Aquatic Conserv: Mar. Freshw. Ecosyst. 20: 150–158 (2010)
DOI: 10.1002/aqc
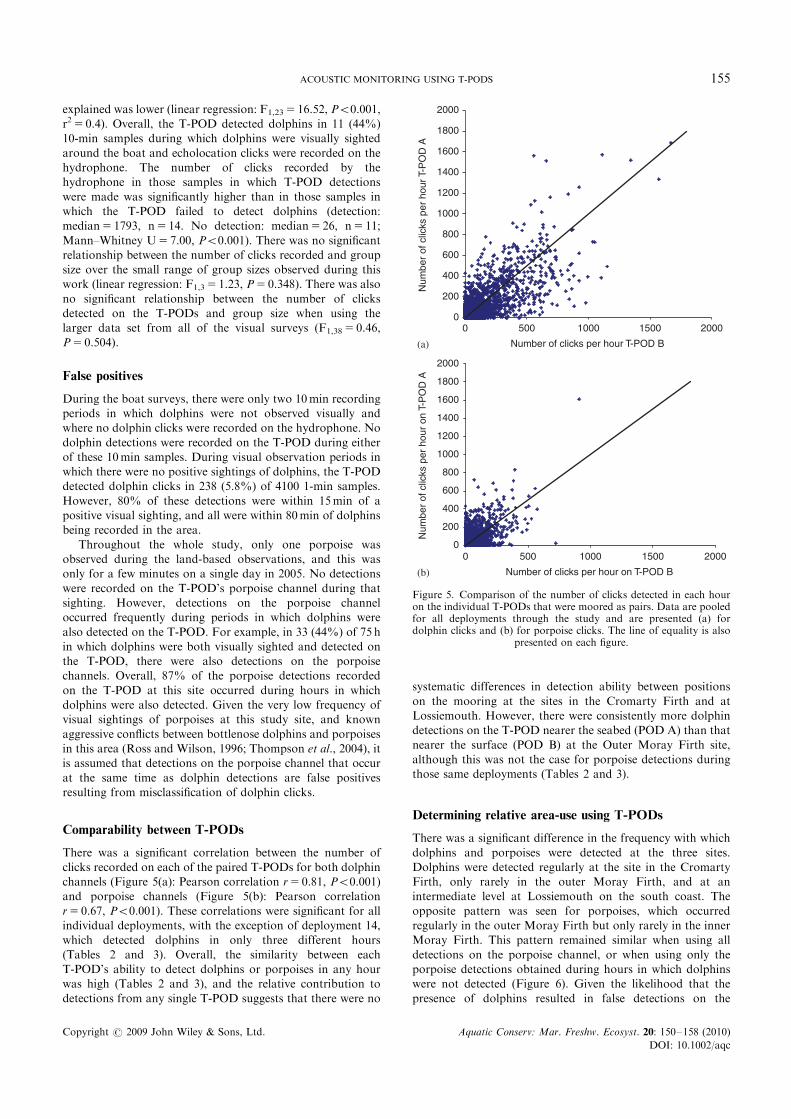
explained was lower (linear regression: F1,23 5 16.52, Po0.001,r2 5 0.4). Overall, the T-POD detected dolphins in 11 (44%)10-min samples during which dolphins were visually sighted
around the boat and echolocation clicks were recorded on thehydrophone. The number of clicks recorded by thehydrophone in those samples in which T-POD detections
were made was significantly higher than in those samples inwhich the T-POD failed to detect dolphins (detection:median5 1793, n5 14. No detection: median5 26, n5 11;
Mann–Whitney U5 7.00, Po0.001). There was no significantrelationship between the number of clicks recorded and groupsize over the small range of group sizes observed during thiswork (linear regression: F1,3 5 1.23, P5 0.348). There was also
no significant relationship between the number of clicksdetected on the T-PODs and group size when using thelarger data set from all of the visual surveys (F1,38 5 0.46,
P5 0.504).
False positives
During the boat surveys, there were only two 10min recordingperiods in which dolphins were not observed visually andwhere no dolphin clicks were recorded on the hydrophone. No
dolphin detections were recorded on the T-POD during eitherof these 10min samples. During visual observation periods inwhich there were no positive sightings of dolphins, the T-PODdetected dolphin clicks in 238 (5.8%) of 4100 1-min samples.
However, 80% of these detections were within 15min of apositive visual sighting, and all were within 80min of dolphinsbeing recorded in the area.
Throughout the whole study, only one porpoise wasobserved during the land-based observations, and this wasonly for a few minutes on a single day in 2005. No detections
were recorded on the T-POD’s porpoise channel during thatsighting. However, detections on the porpoise channeloccurred frequently during periods in which dolphins were
also detected on the T-POD. For example, in 33 (44%) of 75 hin which dolphins were both visually sighted and detected onthe T-POD, there were also detections on the porpoisechannels. Overall, 87% of the porpoise detections recorded
on the T-POD at this site occurred during hours in whichdolphins were also detected. Given the very low frequency ofvisual sightings of porpoises at this study site, and known
aggressive conflicts between bottlenose dolphins and porpoisesin this area (Ross and Wilson, 1996; Thompson et al., 2004), itis assumed that detections on the porpoise channel that occur
at the same time as dolphin detections are false positivesresulting from misclassification of dolphin clicks.
Comparability between T-PODs
There was a significant correlation between the number ofclicks recorded on each of the paired T-PODs for both dolphinchannels (Figure 5(a): Pearson correlation r5 0.81, Po0.001)and porpoise channels (Figure 5(b): Pearson correlation
r5 0.67, Po0.001). These correlations were significant for allindividual deployments, with the exception of deployment 14,which detected dolphins in only three different hours
(Tables 2 and 3). Overall, the similarity between eachT-POD’s ability to detect dolphins or porpoises in any hourwas high (Tables 2 and 3), and the relative contribution to
detections from any single T-POD suggests that there were no
systematic differences in detection ability between positions
on the mooring at the sites in the Cromarty Firth and atLossiemouth. However, there were consistently more dolphindetections on the T-POD nearer the seabed (POD A) than that
nearer the surface (POD B) at the Outer Moray Firth site,although this was not the case for porpoise detections duringthose same deployments (Tables 2 and 3).
Determining relative area-use using T-PODs
There was a significant difference in the frequency with which
dolphins and porpoises were detected at the three sites.Dolphins were detected regularly at the site in the CromartyFirth, only rarely in the outer Moray Firth, and at anintermediate level at Lossiemouth on the south coast. The
opposite pattern was seen for porpoises, which occurredregularly in the outer Moray Firth but only rarely in the innerMoray Firth. This pattern remained similar when using all
detections on the porpoise channel, or when using only theporpoise detections obtained during hours in which dolphinswere not detected (Figure 6). Given the likelihood that the
presence of dolphins resulted in false detections on the
0
200
400
600
800
1000
1200
1400
1600
1800
2000
0
Number of clicks per hour T-POD B
Num
ber
of c
licks
per
hou
r T-P
OD
A
0
200
400
600
800
1000
1200
1400
1600
1800
2000
Number of clicks per hour on T-POD B
Num
ber
of c
licks
per
hou
r on
T-P
OD
A
500 1000 1500 2000
0 500 1000 1500 2000
(a)
(b)
Figure 5. Comparison of the number of clicks detected in each houron the individual T-PODs that were moored as pairs. Data are pooledfor all deployments through the study and are presented (a) fordolphin clicks and (b) for porpoise clicks. The line of equality is also
presented on each figure.
ACOUSTIC MONITORING USING T-PODS 155
Copyright r 2009 John Wiley & Sons, Ltd. Aquatic Conserv: Mar. Freshw. Ecosyst. 20: 150–158 (2010)
DOI: 10.1002/aqc
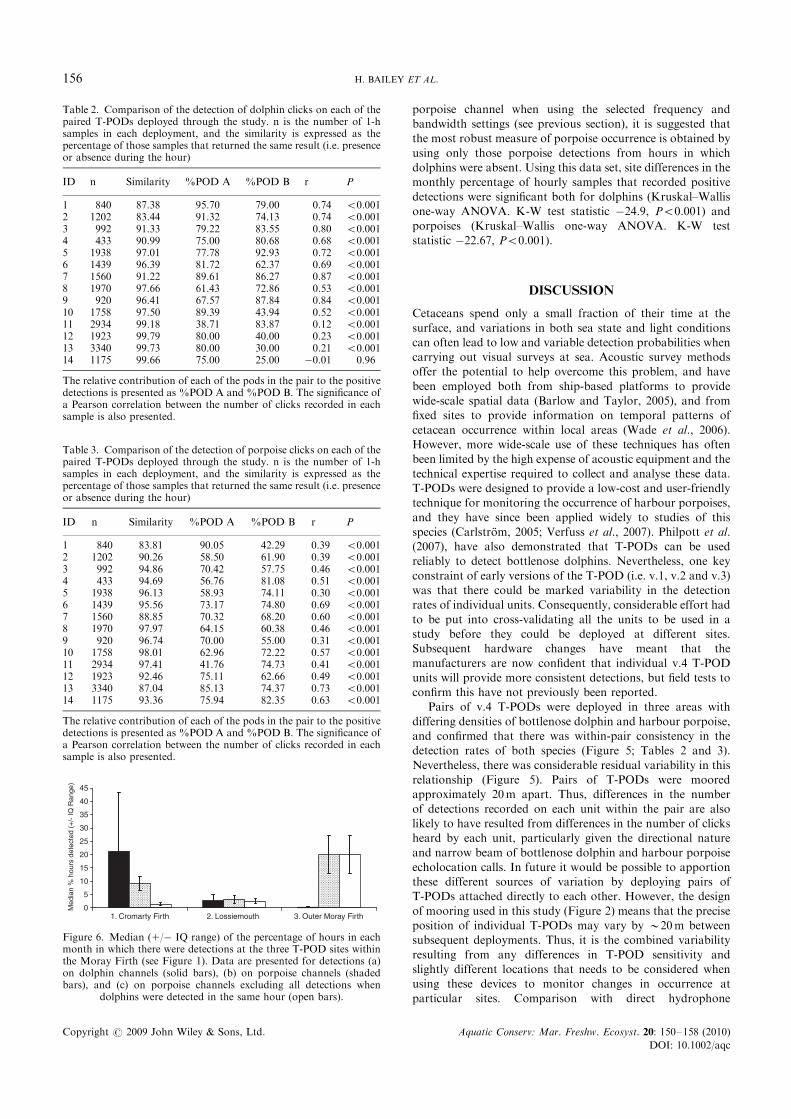
porpoise channel when using the selected frequency andbandwidth settings (see previous section), it is suggested thatthe most robust measure of porpoise occurrence is obtained by
using only those porpoise detections from hours in whichdolphins were absent. Using this data set, site differences in themonthly percentage of hourly samples that recorded positive
detections were significant both for dolphins (Kruskal–Wallisone-way ANOVA. K-W test statistic �24.9, Po0.001) andporpoises (Kruskal–Wallis one-way ANOVA. K-W test
statistic �22.67, Po0.001).
DISCUSSION
Cetaceans spend only a small fraction of their time at the
surface, and variations in both sea state and light conditionscan often lead to low and variable detection probabilities whencarrying out visual surveys at sea. Acoustic survey methodsoffer the potential to help overcome this problem, and have
been employed both from ship-based platforms to providewide-scale spatial data (Barlow and Taylor, 2005), and fromfixed sites to provide information on temporal patterns of
cetacean occurrence within local areas (Wade et al., 2006).However, more wide-scale use of these techniques has oftenbeen limited by the high expense of acoustic equipment and the
technical expertise required to collect and analyse these data.T-PODs were designed to provide a low-cost and user-friendlytechnique for monitoring the occurrence of harbour porpoises,
and they have since been applied widely to studies of thisspecies (Carlstrom, 2005; Verfuss et al., 2007). Philpott et al.(2007), have also demonstrated that T-PODs can be usedreliably to detect bottlenose dolphins. Nevertheless, one key
constraint of early versions of the T-POD (i.e. v.1, v.2 and v.3)was that there could be marked variability in the detectionrates of individual units. Consequently, considerable effort had
to be put into cross-validating all the units to be used in astudy before they could be deployed at different sites.Subsequent hardware changes have meant that the
manufacturers are now confident that individual v.4 T-PODunits will provide more consistent detections, but field tests toconfirm this have not previously been reported.
Pairs of v.4 T-PODs were deployed in three areas with
differing densities of bottlenose dolphin and harbour porpoise,and confirmed that there was within-pair consistency in thedetection rates of both species (Figure 5; Tables 2 and 3).
Nevertheless, there was considerable residual variability in thisrelationship (Figure 5). Pairs of T-PODs were mooredapproximately 20m apart. Thus, differences in the number
of detections recorded on each unit within the pair are alsolikely to have resulted from differences in the number of clicksheard by each unit, particularly given the directional nature
and narrow beam of bottlenose dolphin and harbour porpoiseecholocation calls. In future it would be possible to apportionthese different sources of variation by deploying pairs ofT-PODs attached directly to each other. However, the design
of mooring used in this study (Figure 2) means that the preciseposition of individual T-PODs may vary by �20m betweensubsequent deployments. Thus, it is the combined variability
resulting from any differences in T-POD sensitivity andslightly different locations that needs to be considered whenusing these devices to monitor changes in occurrence at
particular sites. Comparison with direct hydrophone
Table 2. Comparison of the detection of dolphin clicks on each of thepaired T-PODs deployed through the study. n is the number of 1-hsamples in each deployment, and the similarity is expressed as thepercentage of those samples that returned the same result (i.e. presenceor absence during the hour)
ID n Similarity %POD A %POD B r P
1 840 87.38 95.70 79.00 0.74 o0.0012 1202 83.44 91.32 74.13 0.74 o0.0013 992 91.33 79.22 83.55 0.80 o0.0014 433 90.99 75.00 80.68 0.68 o0.0015 1938 97.01 77.78 92.93 0.72 o0.0016 1439 96.39 81.72 62.37 0.69 o0.0017 1560 91.22 89.61 86.27 0.87 o0.0018 1970 97.66 61.43 72.86 0.53 o0.0019 920 96.41 67.57 87.84 0.84 o0.00110 1758 97.50 89.39 43.94 0.52 o0.00111 2934 99.18 38.71 83.87 0.12 o0.00112 1923 99.79 80.00 40.00 0.23 o0.00113 3340 99.73 80.00 30.00 0.21 o0.00114 1175 99.66 75.00 25.00 �0.01 0.96
The relative contribution of each of the pods in the pair to the positivedetections is presented as %POD A and %POD B. The significance ofa Pearson correlation between the number of clicks recorded in eachsample is also presented.
Table 3. Comparison of the detection of porpoise clicks on each of thepaired T-PODs deployed through the study. n is the number of 1-hsamples in each deployment, and the similarity is expressed as thepercentage of those samples that returned the same result (i.e. presenceor absence during the hour)
ID n Similarity %POD A %POD B r P
1 840 83.81 90.05 42.29 0.39 o0.0012 1202 90.26 58.50 61.90 0.39 o0.0013 992 94.86 70.42 57.75 0.46 o0.0014 433 94.69 56.76 81.08 0.51 o0.0015 1938 96.13 58.93 74.11 0.30 o0.0016 1439 95.56 73.17 74.80 0.69 o0.0017 1560 88.85 70.32 68.20 0.60 o0.0018 1970 97.97 64.15 60.38 0.46 o0.0019 920 96.74 70.00 55.00 0.31 o0.00110 1758 98.01 62.96 72.22 0.57 o0.00111 2934 97.41 41.76 74.73 0.41 o0.00112 1923 92.46 75.11 62.66 0.49 o0.00113 3340 87.04 85.13 74.37 0.73 o0.00114 1175 93.36 75.94 82.35 0.63 o0.001
The relative contribution of each of the pods in the pair to the positivedetections is presented as %POD A and %POD B. The significance ofa Pearson correlation between the number of clicks recorded in eachsample is also presented.
0
5
10
15
20
25
30
35
40
45
Med
ian
% h
ours
det
ecte
d (+
/- IQ
Ran
ge)
1. Cromarty Firth 2. Lossiemouth 3. Outer Moray Firth
Figure 6. Median (1/� IQ range) of the percentage of hours in eachmonth in which there were detections at the three T-POD sites withinthe Moray Firth (see Figure 1). Data are presented for detections (a)on dolphin channels (solid bars), (b) on porpoise channels (shadedbars), and (c) on porpoise channels excluding all detections when
dolphins were detected in the same hour (open bars).
H. BAILEY ET AL.156
Copyright r 2009 John Wiley & Sons, Ltd. Aquatic Conserv: Mar. Freshw. Ecosyst. 20: 150–158 (2010)
DOI: 10.1002/aqc
recordings at the same position also demonstrated thatT-PODs did not detect all echolocation clicks (Figure 4).These data, together with the comparison of visual sighting
and T-POD detections suggest that T-PODs did notnecessarily detect dolphins every time they were observed inthe survey area. Nevertheless, while acoustic methods clearly
cannot detect the presence of dolphins every time they enter anarea, these studies do indicate that the technique offers goodopportunities for providing robust relative measures of
occurrence in specific local areas.Further research exploring the factors that influence
detection probability would now be useful, particularly inrelation to the influence of water depth and the position of the
T-POD in the water column. In the meantime, as long as studiesare carried out at appropriate scales, existing data now offersufficient evidence that T-PODs provide a robust method for
monitoring spatial and temporal variations in the occurrence ofbottlenose dolphins and harbour porpoises. Observationsdemonstrated that T-PODs detected the presence of bottlenose
dolphins on every occasion that dolphins were observed in thearea for 430min (Figure 3(a)), and that their detectionprobability was 40.5 for all groups of dolphins that were
observed within 500m of the T-POD (Figure 3(b)). Thus, inshallow coastal waters such as those in the Moray Firth,T-PODs provide a practical method for assessing variations inthe occurrence of bottlenose dolphins within 800–1250m around
the sampling site (this study; Philpott et al., 2007). Nevertheless,when interpreting T-POD data from other sites, factors such aswater depth, mooring depth, levels of background noise and
variations in the echolocation behaviour of animals using thatsite may all influence detection probability.
In this study, differences in the relative number of T-POD
detections from bottlenose dolphins and harbour porpoises atthe three sampling sites (Figure 6) reflected existing data fromland- and boat-based visual surveys. As predicted, bottlenose
dolphins were recorded most frequently in the inner MorayFirth, at a site that is recognized as a key foraging area forthis population (Wilson et al., 1997; Hastie et al., 2004). Incontrast, harbour porpoises were detected regularly in the
outer Moray Firth, but dolphin detections were rare (Hastieet al., 2003b; Bailey and Thompson, 2009). Detection rates forthe two species were similar, but at a low level, on the southern
coast of the Moray Firth at Lossiemouth; an area in whichvisual sightings of both species are recorded at a similarfrequency (Thompson et al., 2004). These differences were
clearly apparent from the T-POD data (Figure 6), despiteinevitable (and often unquantifiable) differences in the otherfactors that potentially affect detection rates. As such, thesedata provide further support for using these techniques to
collect data on local geographical variation in the occurrenceof these species, and to explore temporal patterns ofoccurrence in these areas. At the same time, these data also
highlight how uncertainty over species identification canconstrain the interpretation of data from T-PODs. In thesampling protocol, three of the six channels on the T-POD
were used to detect dolphins (target frequency 50 kHz,reference frequency 70 kHz) and the others to detect harbourporpoises (target frequency 130 kHz, reference frequency
92 kHz). This was based on bottlenose dolphins havingbroadband echolocation clicks that still contain high energyat the lower frequency of 50 kHz (Au et al., 1974), whereas thenarrowband harbour porpoise clicks do not (Au et al., 1999).
However, at the Cromarty Firth observation site, it was foundthat the T-POD regularly detected clicks on the porpoisechannel, despite porpoises being rarely sighted in this area.
Further investigation revealed that these detections occurredalmost entirely during hours in which dolphins were alsodetected. Given that bottlenose dolphins are capable of higher
peak frequencies, for example when producing echolocationclicks at higher source levels (Au, 1993), it was assumed thatporpoise detections occurring in hours in which bottlenose
dolphins are also detected were highly likely to be falsedetections. This assumption is also supported by knownaggressive behaviour between bottlenose dolphins andporpoises (Ross and Wilson, 1996) and fine-scale segregation
of these two species where their ranges do overlap (Thompsonet al., 2004). In future, better discrimination between dolphinsand porpoises should be possible by restricting the bandwidth
in the porpoise channel to exclude wider bandwidth clicksfrom dolphins. However, there will still be limitations on theinterpretation of T-POD data where several dolphin species
co-occur because it is not currently possible to discriminatebetween these different dolphin species based on theirecholocation click characteristics (Soldevilla et al., 2008). In
this study, this was most likely to be an issue in the outerMoray Firth, where dolphin sightings are rare, but typicallyinvolve common dolphins (Delphinus delphis) rather thanbottlenose dolphins. Thus, the T-POD data collected in this
study cannot be used to confirm the presence of bottlenosedolphins in the Outer Moray Firth, but they do indicate that, ifthey do occur in the area, it is only very rarely (Figure 6).
In conclusion, this study has shown that acoustic monitoringusing T-PODs can provide an effective method for monitoringthe occurrence of bottlenose dolphins and harbour porpoises in
coastal waters. Like visual surveys, these acoustic methodscannot provide 100% detection probabilities, and particular caremust be taken over the interpretation of data where mixed
species communities occur. Nevertheless, where studies are madeat appropriate temporal and spatial scales, these techniques offerthe potential to collect data over periods of many months, inareas that may be impossible to access regularly using other
means. In particular, where T-POD data can be supplementedwith data from visual surveys, these techniques provide valuableopportunities for collecting the data required to support the
conservation and management of these populations.
ACKNOWLEDGEMENTS
This project was carried out with support from the EU
Framework 6 DOWNViND Project and Talisman Energy(UK) Ltd. We would also like to thank Tim Barton and all theother colleagues who assisted with fieldwork, and Barbara
Cheney, Ana Candido and Steve Dawson for constructivecomments on an earlier manuscript.
REFERENCES
Au WWL. 1993. The Sonar of Dolphins. Springer-Verlag:New York.
Au WWL, Floyd RW, Penner RH, Murchison AE. 1974.Measurement of echolocation signals of the Atlantic
ACOUSTIC MONITORING USING T-PODS 157
Copyright r 2009 John Wiley & Sons, Ltd. Aquatic Conserv: Mar. Freshw. Ecosyst. 20: 150–158 (2010)
DOI: 10.1002/aqc
bottlenose dolphin, Tursiops truncatus Montagu, in openwaters. Journal of the Acoustical Society of America 56:1280–1290.
Au WWL, Kastelein RA, Rippe T, Schooneman NM. 1999.Transmission beam pattern and echolocation signals of aharbor porpoise (Phocoena phocoena). Journal of theAcoustical Society of America 106: 3699–3705.
Bailey H, Thompson PM. 2009. Using marine mammal habitatmodelling to identify priority conservation zones within amarine protected area. Marine Ecology Progress Series 378:279–287.
Barlow J, Taylor BL. 2005. Estimates of sperm whaleabundance in the Northeastern temperate Pacific from acombined acoustic and visual survey. Marine MammalScience 21: 429–445.
Canadas A, Sagarminaga R, De Stephanis R, Urquiola E,Hammond PS. 2005. Habitat preference modelling as aconservation took proposals for marine protected areas forcetaceans in southern Spanish waters. Aquatic Conservation:Marine & Freshwater Ecosystems 15: 495–521.
Carlstrom J. 2005. Diel variation in echolocation behavior ofwild harbor porpoises. Marine Mammal Science 21: 1–12.
Carstensen J, Henriksen OD, Teilmann J. 2006. Impacts ofoffshore wind farm construction on harbour porpoises: acousticmonitoring of echolocation activity using porpoise detectors(T-PODs). Marine Ecology Progress Series 321: 295–308.
Clark CW, Ellison WT. 2000. Calibration and comparison ofthe acoustic location methods used during the springmigration of the bowhead whale, Balaena mysticetus, offPt. Barrow, Alaska, 1984–1993. Journal of the AcousticalSociety of America 107: 3509–3517.
Culik BM, Koshinski S, Tregenza N, Ellis GM. 2001.Reactions of harbor porpoises Phocoena phocoena andherring Clupea harengus to acoustic alarms. MarineEcology Progress Series 211: 255–260.
Di Sciara GN, Gordon J. 1997. Bioacoustics: a tool for theconservation of cetaceans in the Mediterranean Sea. Marine& Freshwater Behaviour & Physiology 30: 125–146.
Evans PGH, Hammond PS. 2004. Monitoring cetaceans inEuropean waters. Mammal Review 34: 131–156.
Hammond PS, Berggren P, Benke H, Borchers DL, Collet A,Heide-Jorgensen MP, Heimlich S, Hiby AR, Leopold MF,Oien N. 2002. Abundance of harbour porpoise and othercetaceans in the North Sea and adjacent waters. Journal ofApplied Ecology 39: 361–376.
Hastie GD, Wilson B, Thompson PM. 2003a. Fine-scalehabitat selection by coastal bottlenose dolphins; applicationof a new land-based video montage technique. CanadianJournal of Zoology 81: 469–478.
Hastie GD, Barton TR, Grellier K, Hammond PS, Swift RJ,Thompson PM, Wilson B. 2003b. Distribution of smallcetaceans within a candidate Special Area of Conservation;implications for management. Journal of Cetacean Researchand Management 5: 261–266.
Hastie GD, Wilson B, Wilson LJ, Parsons KM, Thompson PM.2004. Functional mechanisms underlying cetacean distributionpatterns: hotspots for bottlenose dolphins are linked toforaging. Marine Biology 144: 397–403.
Jefferson TA, Hung SK, Wursig B. 2009. Protecting smallcetaceans from coastal development: Impact assessment and
mitigation experience in Hong Kong. Marine Policy 33:305–311.
Norris TF, Mc Donald M, Barlow J. 1999. Acousticdetections of singing humpback whale (Megapteranovaeangliae) in the eastern North Pacific during theirnorthbound migration. Journal of the Acoustical Society ofAmerica 106: 506–514.
Philpott E, Englund A, Ingram S, Rogan E. 2007. UsingT-PODs to investigate detection range and echolocationbehaviour of coastal bottlenose dolphins. Journal of theMarine Biological Association (UK) 87: 11–17.
Redfern JV, Ferguson MC, Becker EA, Hyrenbach KD,Good C, Barlow J, Kaschner K, Baumgartner MF,Forney KA, Ballance LT et al. 2006. Techniques forcetacean-habitat modeling. Marine Ecology Progress Series310: 271–295.
Ross HM, Wilson B. 1996. Violent interactions betweenbottlenose dolphins and harbour porpoises. Proceedings ofthe Royal Society of Biological Sciences 263: 283–286.
Soldevilla MS, Henderson EE, Campbell GS, Wiggins SM,Hildebrand JA, Roch MA. 2008. Classification of Risso’sand Pacific white-sided dolphins using spectral properties ofecholocation clicks. Journal of the Acoustical Society ofAmerica 124: 609–624.
Thompson P, White S, Dickson E. 2004. Co-variation in theprobabilities of sighting harbour porpoises and bottlenosedolphins. Marine Mammal Science 20: 322–328.
Thomsen F, van Elk N, Brock V, Piper W. 2005. On theperformance of automated porpoise-click-detectors inexperiments with captive harbor porpoises (Phocoenaphocoena) (L). Journal of the Acoustical Society of America118: 37–40.
Tougaard J, Poulsen LR, Amundin M, Larsen F, Rye J,Teilman J. 2006. Detection function of T-PODS andestimation of porpoise densities. In Proceedings of theWorkshop on Static Acoustic Monitoring of Cetaceans,Leeney RH, Trehanze NJC (eds). Special Issue No. 46,European Cetacean Society.
Verfuss UK, Honnef CG, Meding A, Dahne M, Mundry R,Benke H. 2007. Geographical and seasonal variation ofharbour porpoise (Phocoena phocoena) presence in theGerman Baltic Sea revealed by passive acousticmonitoring. Journal of the Marine Biological Association(UK) 87: 165–176.
Wade P, Heide-Jørgensen MP, Sheldon K, Barlow J,Carretta J, Durban J, LeDuc R, Munger L, Rankin S,Sauter A, Stinchcomb C. 2006. Acoustic detection andsatellite-tracking leads to discovery of rare concentration ofendangered North Pacific right whales. Biology Letters 2:417–419.
Weir CR, Pollock C, Cronin C, Taylor S. 2001. Cetaceans ofthe Atlantic frontier, north and west of Scotland.Continental Shelf Research 21:1047–1071.
Weilgart LS. 2007. The impacts of anthropogenic ocean noiseon cetaceans and implications for management. CanadianJournal of Zoology 85: 1091–1116.
Wilson B, Thompson PM, Hammond PS. 1997. Habitat use bybottlenose dolphins: seasonal distribution and stratifiedmovement patterns in the Moray Firth, Scotland. Journalof Applied Ecology 34: 1365–1374.
H. BAILEY ET AL.158
Copyright r 2009 John Wiley & Sons, Ltd. Aquatic Conserv: Mar. Freshw. Ecosyst. 20: 150–158 (2010)
DOI: 10.1002/aqc


![Responses of bottlenose dolphins and harbor porpoises to impact …. UA Observations on... · 240 dB re 1 lPa (single-pulse sound exposure level [SEL] 198 dB re 1 lPa2 s), and the](https://img.pdfslide.us/doc/110x75/5f07ee6a7e708231d41f7a6b/responses-of-bottlenose-dolphins-and-harbor-porpoises-to-impact-ua-observations.jpg)
![The first case of conjoined twin harbour porpoises ... · et al: Conjoined twin harbour porpoises. DEINSEA 17: 1 - 5 [2017]Kompanje 3 3 Figure 1 Harbour porpoises (Phocoena phocoena),](https://img.pdfslide.us/doc/110x75/5b9f212109d3f204248cbc52/the-first-case-of-conjoined-twin-harbour-porpoises-et-al-conjoined-twin.jpg)