Embed Size (px)
Citation preview

Using Supply Chain Levers to Impact Profits
Sandra Jessop, CPIM, MBA

2 #APICS2017
APICS 2017 Session Evaluation
Visit www.apics.org/Tuesdayor
download the APICS2017 app

3 #APICS2017
Sandra Jessop: Who Am I?
Professional Career
Vice President, Operations – RV Products
Corporate Material Management Leader –
Airxcel, Inc
16 years Supply Chain Experience
Small Business Owner
B.S. Aerospace Engineer, Embry Riddle
Aeronautical University
MBA, Wichita State UniversityProfessional Membership /
Volunteerism
President, APICS Wichita
CPIM & Black Belt Textron Six Sigma
Sustainer Advisor, Junior League of
Wichita Fund Development
Family
Youngest of 6, Wife of 17 Years
Mother of 3 Girls (16, 13, 8)
1 Dog: Pixie
Socially
Workout, Volleyball, Boating
Spending Time with Friends and
Family

4 #APICS2017
Why This Topic
• Raise Your Hand if You Know This Information For Your Company:
• How big is the company in Sales?
• How much is the purchasing spend?
• How much is the Freight spend?
• What is the Inventory Valuation each month by group: Raw Material, WIP, Finished Goods?
• What is the Cost of Goods Sold %?
• What is the biggest supply chain issue you face with regards to these expenses?
How Can You Make a Difference If You Don’t Understand The
Business?
5 #APICS2017
Functional Area Paradigm
Watch This Video and Follow the Instructions

6 #APICS2017

7 #APICS2017
Functional Area Paradigm
Did You See The Gorilla?
It’s Easy to Focus Only On Your Area And Miss The Bigger Picture.

8 #APICS2017
Two Major Measures of Performance
1. Earnings Before Interest, Taxes, Depreciation & Amortization (EBITDA)
2. Net Working Capital (NWC)

9 #APICS2017
Why Are These Metrics Important?
Earnings Before Interest, Taxes, Depreciation, & Amortization (EBITDA)
Net Working Capital (NWC)
They Answer Two Critical Questions!
Are We Making Any Money?
What Do We Have Tied Up In Cash That We Cannot Use To Invest Somewhere
Else?

10 #APICS2017
Overview
Practical Application
Of 6 Supply Chain
Levers To Positively
Impact the Bottom
Line Through EBITDA
And NWC Metrics.
Raw Material Pricing
Payment Terms
On Hand Inventory
Supplier Partnerships
& Supply Chain
Flexibility
Ownership of In-Transit
Inventory
Transportation and
Logistics
6 Supply
Chain
Levers
11 #APICS2017
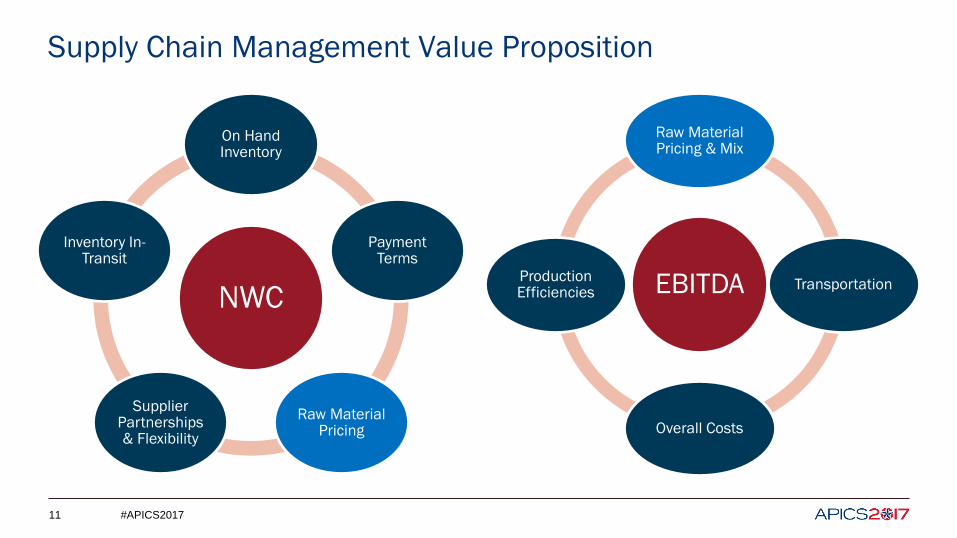
Supply Chain Management Value Proposition
EBITDA
Raw Material Pricing & Mix
Transportation
Overall Costs
Production EfficienciesNWC
On Hand Inventory
Payment Terms
Raw Material Pricing
Supplier Partnerships & Flexibility
Inventory In-Transit
12 #APICS2017
NWC

13 #APICS2017
NWC Calculation
Current Assets
Accounts Receivable
+ Inventory
+ Prepaid Expenses
Current Liabilities
Accounts Payable
+ Accruals (Warranty, Payroll,
Rebates, etc)
+ Other Liabilities
NWC = Current Assets – Current Liabilities

14 #APICS2017
How Can Supply Chain Impact NWC?
Discount or Extended Payment
Terms
Raw Material Pricing
Ownership of
Inventory
Current Liabilities: Accounts Payable
Accounts Receivables:
Customer Payments
& Supplier Rebates
Inventory:
Valuation
Ownership
Consigned / VMI
Understanding Inventory Balances: Raw, WIP, Finished
Current Assets

15 #APICS2017
Net Working Capital Levers and Improvements
• Inventory
• Accounts Receivable
• Accounts Payable

16 #APICS2017
Inventory
Inventory Type
• Raw Material
• WIP (Work in Process)
• Finished Goods
Inventory Mix
• Business/Manufacturing Strategy (Make To
Stock/Make to Order/etc.)
• Inventory Management Strategies
Inventory Valuation
• Supplier Negotiated Contracts
• Cost of Finished Goods
NWC Levers and Improvements

17 #APICS2017
Accounts Receivable / Accounts Payable
Accounts Receivable
• Questions To Ask:
• What Are The Customer Payment Terms?
• Does the Customer Have Discounts?
• How Can I Offset Any Customer Discounts
with Corresponding Supplier Payments?
• Customer Contracts: Rebates/Payment
Terms
• Supplier Contracts: Negotiated Rebates
Accounts Payable
• Questions To Ask:
• When Do You Own It?
• How Much Do You Owe?
• How Can You minimize How Much You
Owe?
• When Do You Need To Pay For It?
• Supplier Contracts: Payment Terms,
Pricing, Rebates, Ownership
NWC Levers and Improvements
The Goal Is To Minimize The Time Between The Payment To The Supplier and
The Payment From the Customer.

18 #APICS2017
EBITDA

19 #APICS2017
How Can Supply Chain Impact EBITDA?
• Many Of The Overall Costs Are Generated
From The Supply Chain.
• Cost Control
• Transportation Rates / Efficiencies /
Backorders
• Raw Material Negotiations, Commodity
Pricing, Flexibility, and Mix
• Factory Variance – Direct Labor Costs /
Purchase Price Variance / Efficiencies
• Quality Control / Reworks
• Indirectly: On Hand Inventory Balances
EBITDA
Raw Material Pricing & Mix
Transportation
Overall Costs
Production Efficiencies

20 #APICS2017
CURRENT MONTH YEAR-TO-DATE
2017 2017 2016 2017 2017 2016
Budget Actual Actual Budget Actual Actual
$19,875,904 $21,899,057 $17,555,999 Sales - US $19,875,904 $21,899,057 $17,555,999
$3,425,987 $4,199,000 $2,500,000 Sales - Canada 3,425,987 $4,199,000 $2,500,000
$430,826 $506,789 $692,654 Sales - International 430,826 $506,789 $692,654
999,999 896,789 300,987 Sales - Associated / Super Widget 999,999 $896,789 $300,987
24,732,716 100.0% 27,501,635 100.0% 21,049,640 100.0% Total gross sales 24,732,716 100.0% $27,501,635 100.0% $21,049,640 100%
Variable expenses:
18,549,537 75.0% 20,626,226 75.0% 16,208,223 77.0% Cost of goods sold 18,549,537 75.0% $20,626,226 75.0% 16,208,223 77.0%
74,198 0.3% 82,505 0.3% 63,149 0.3% Factory variance 74,198 0.3% $82,505 0.3% 63,149 0.3%
49,465 0.2% 0 0.2% 42,099 0.2% Cash discount 49,465 0.2% $0 0.2% 42,099 0.2%
890,378 3.6% 1,127,567 4.1% 757,787 3.6% Transportation 890,378 3.6% $1,127,567 4.1% 757,787 3.6%
519,387 2.1% 577,534 2.1% 442,042 2.1% Warranty 519,387 2.1% $577,534 2.1% 442,042 2.1%
24,733 0.1% 27,502 0.1% 21,050 0.1% Selling expense 24,733 0.1% $27,502 0.1% 21,050 0.1%
20,107,698 81.3% 22,441,334 81.6% 17,534,350 83.3% Total variable expense 20,107,698 81.3% 22,441,334 81.8% 17,534,350 83.3%
4,625,018 18.7% 5,060,301 18.4% 3,515,290 16.7% Marginal income 4,625,018 18.7% 5,060,301 18.4% 3,515,290 16.7%
Fixed expenses:
494,654 2.0% 550,033 2.0% 420,993 2.0% Factory fixed 494,654 2.0% 550,033 2.0% 420,993 2.0%
0 0.0% 0 0.0% 0 0.0% Cost adjustments 0 0.0% 0 0.0% 0 0.0%
123,664 0.5% 137,508 0.5% 105,248 0.5% Design 123,664 0.5% 137,508 0.5% 105,248 0.5%
173,129 0.7% 192,511 0.7% 147,347 0.7% Tooling 173,129 0.7% 192,511 0.9% 147,347 0.7%
247,327 1.0% 275,016 1.0% 210,496 1.0% Selling expense 247,327 1.0% 275,016 1.0% 210,496 1.0%
469,922 1.9% 522,531 1.9% 399,943 1.9% Administrative expense 469,922 1.9% 522,531 1.9% 399,943 1.9%
321,525 1.3% 357,521 1.3% 273,645 1.3% Distributing 321,525 1.3% 357,521 1.3% 273,645 1.3%
173,129 0.7% 192,511 0.7% 147,347 0.7% Other expense / (income) 173,129 0.7% 192,511 0.7% 147,347 0.7%
2,003,350 8.1% 2,227,632 8.1% 1,705,021 8.1% Total fixed expenses 2,003,350 8.1% 2,227,632 8.33% 1,705,021 8.1%
2,621,668 10.6% 2,832,668 10.3% 1,810,269 8.6% Operating income 2,621,668 10.6% 2,832,668 10.3% 1,810,269 8.6%
804,308 4.0% 1,100,065 4.0% 841,986 4.0% Interest expense 804,308 4.0% 1,100,065 4.0% 841,986 4.0%
0 0.0% 0 0.0% 0 0.0% Other (income) / expense 0 0.0% 0 0.0% 0 0.0%
0 0.0% 0 0.0% 0 0.0% Loan cost amortization 0 0.0% 0 0.0% 0 0.0%
764,093 3.8% 783,797 3.8% 615,912 3.8% Amortization expense 764,093 3.8% 783,797 3.8% 615,912 3.8%
1,568,400 7.80% 1,883,862 7.8% 1,457,898 7.8% Total nonoperating expenses 1,568,400 7.8% 1,883,862 7.8% 1,457,898 7.8%
1,053,267 4.3% 948,806 3.4% 352,371 1.7% Profit before tax 1,053,267 4.3% 948,806 3.4% 352,371 1.7%
0 0.0% 0 0.0% 0 0.0% Income tax 0 0.0% 0 0.0% 0 0.0%
$1,053,267 4.3% $948,806 3.4% $352,371 1.7% Net income 1,053,267 4.3% 948,806 3.4% 352,371 1.7%
119,210 119,210 76,619 Depreciation 119,210 119,210 76,619
2,500 2,500 7,500 Non-recurring Expense 2,500 2,500 7,500
2,743,378 11.1% 2,954,378 10.7% 1,894,388 9.0% EBITDA 2,743,378 11.1% 2,954,378 10.7% 1,894,388 9.0%
Jessop Enterprises
Widget Builders
OPERATING INCOME STATEMENTS FOR January 2017
Income Statement Refresher2017
Budget
2017
Actuals
2016 Same
Time Period
2017 Budget
YTD
2017 Actuals
YTD
Learn How
To Read
The Tea
Leaves.
Look For Line Items That are Over Or Under Budget.
Understand what
makes up each cost
by asking questions

21 #APICS2017
Examples of What To Look For With EBITDA
• Higher Cost of Goods Sold % Due To Mix Or
Commodity Price Increases On Raw Material.
• Factory Variance Due To Purchase Price Variance
Within The Month, Overtime, Productivity /
Efficiency Drop/ Scrap / Inventory Accuracy /
Increases in In-bound freight.
• Transportation Increases Due To Increased
Expedites, Backorders, Increases in LTL And
Small Package Shipments, Warranty, Lower
Weights Shipped Per Truckload, Oil / Gas Price
Increases, Driver Shortages.
• Warranty Higher Due To Supplier Quality And
Manufacturing Quality Issues Or Poor Warranty
Process.
• Factory Fixed Expenses are Higher.
▪ Increases In Headcount.
▪ Design Expenses Higher Due To New Product
Development.
▪ Tooling Costs Increasing Due To Purchase Of
New Tools.
▪ Administrative Expense Due To Overhead
Increases In Headcount / Supplies
▪ Distributing Impacts Due To Increased Sales
Driving More Contract Services, Propane,
Pallets, Supplies, and Wages / Overtime in
Distribution.
▪ Production Supply Impacts Due To Increased
Sales.

22 #APICS2017
Supply Chain Management Value Proposition - Recall
EBITDA
Raw Material Pricing & Mix
Transportation
Overall Costs
Production EfficienciesNWC
On Hand Inventory
Payment Terms
Raw Material Pricing
Supplier Partnerships & Flexibility
Inventory In-Transit
Inventory! Cost Control!

23 #APICS2017
Simulation

24 #APICS2017
Company: Jessop Enterprises
Background
Company that provides a product that is needed year round, however, has higher
demand/usage (seasonality) from March – September.
Product: Widgets
Typical Finished Goods Inventory is between 25%-30% of sales. 60% of Raw Material
is purchased Internationally, with 6-10 week lead times.
Industry Information:
Industry is predicting a 4% increase over the previous year. This is already budgeted.
Each Group Will Have One Income Statement To Evaluate.

25 #APICS2017
Important Information Provided
• Income Statement.
• Inventory Dollars.
• December Inventory $ is the on hand inventory dollars for the beginning of January, etc.
• Inventory Dollars For Each Month By Type (Raw Material/WIP/Finished Goods).
• Number and % of On Hand Finished Goods Coming Into a Month.
• Summary of state of the market for that month.

26 #APICS2017
Simulation / Case Study
Divide into Groups Evenly. Designate a speaker for your team.
Compare the budget to the actual and explain what could have happened within the
supply chain to drive the costs/within the month.
• Focus on the %, Not the Actual $
Identify:
• Areas for Improvement based off comparison with Budget / Previous Year.
• What may have happened?
• What can you do to correct or mitigate the risk of this expense for the next month?
Share Your Results with the Broader Group.

27 #APICS2017
Summary
• To Determine The Health Of A Business Ask These Questions:
• Are We Making Any Money? EBITDA
• What Do We Have Tied Up In Cash That We Cannot Use To Invest Somewhere Else? NWC
• All Areas Of The Supply Chain Must Work Together– No Silos!
• It Is Important To Understand The Overall Business In Order To Add Value And
Make An Impact.

28 #APICS2017
APICS 2017 Session Evaluation
Visit www.apics.org/Tuesdayor
download the APICS2017 app

29 #APICS2017
THANK YOU