Embed Size (px)
Citation preview
ARTICLE IN PRESS
Journal of AridEnvironments
Journal of Arid Environments 66 (2006) 477–497
0140-1963/$ -
doi:10.1016/j
�CorrespoE-mail ad
www.elsevier.com/locate/jnlabr/yjare
Using statistical phylogeography to infer populationhistory: Case studies on Pimelia darkling beetles
from the Canary Islands
O. Moyaa, H.G. Contreras-Dıaza,b, P. Oromıb, C. Juana,�
aDepartament de Biologia, Universitat de les Illes Balears, 07122 Palma de Mallorca, SpainbDepartamento de Biologıa Animal, Facultad de Biologıa, Universidad de La Laguna, 38205 La Laguna,
Tenerife, Spain
Available online 3 March 2006
Abstract
Sequence data from a 200 bp fragment of the Cytochrome Oxidase I mitochondrial gene was
derived from endemic populations of the darkling beetle Pimelia laevigata (Coleoptera,
Tenebrionidae) from the volcanic islands of La Gomera, La Palma and El Hierro and from three
related congeneric species of Tenerife (Canary Islands). Statistical phylogeographic methods and
estimates of demographic parameters suggest that there is a higher genetic variation and
geographical structure in two of the Tenerife nominal species than in populations of P. laevigata
in the western islands. In La Gomera, La Palma and El Hierro, the patterns are consistent with
relatively recent colonizations, followed by range expansions. The results show that hypotheses based
on coalescent theory can be useful to reconstruct historic biogeographical events of oceanic islands in
a range of different organisms provided that the sample design is adequate and enough genetic
resolution is present. However, some specific problems arise when interpreting the inference key
applied to the volcanic islands populations.
r 2006 Elsevier Ltd. All rights reserved.
Keywords: Mitochondrial DNA; Nested clade phylogeographic analysis; Colonization; Population expansion;
Arid regions; Darkling beetles
see front matter r 2006 Elsevier Ltd. All rights reserved.
.jaridenv.2006.01.008
nding author. Tel.: +34971173425; fax: +34971173184.
dress: [email protected] (C. Juan).
ARTICLE IN PRESSO. Moya et al. / Journal of Arid Environments 66 (2006) 477–497478
1. Introduction
The application of phylogenetic methods to understand the extent of genetic variation inspace and time among populations or related taxa has emerged as a major issue inevolutionary and conservation biology. Different theoretical approaches exist in relationto this topic, but the more common and recent uses coalescent theory (Kingman, 1982a, b)as a conceptual framework to estimate different population parameters and understanddemographic histories (see Emerson et al., 2001; Knowles, 2004). The inferences obtainedby these methods are based on statistical tests of historical hypotheses and estimates ofdemographic parameters, in contrast with the ‘‘classical’’ intuitive phylogeographicmethodology developed by Avise (1998), which is based on inferring the causes of anassociation between observed patterns of genetic variation and the geographicaldistribution of populations (Knowles, 2004). Nested clade phylogeographic analysis(NCPA) is one of the statistical approaches applied to intraspecific or closely relatedspecies gene genealogies. It combines genealogical data through haplotype networksobtained using statistical parsimony and geographical information to infer historical rangedistribution of haplotypes and range movements (Templeton et al., 1995; Templeton, 1998,2004; Posada and Crandall, 2001).The Hawaiian, Galapagos and Canary volcanic island chains have become models in
evolutionary studies, as they are true microcosms of evolutionary processes (Emerson,2002). Recently, the ease in obtaining DNA sequence data, and the improvementof phylogenetic methods, have promoted their application to many different specioseendemic organisms from the Canary and other Macaronesian archipelagos, includingvertebrate and arthropod groups (e.g. Juan et al., 1995, 1998, 2000; Brown andPestano, 1998; Emerson et al., 1999, 2000a–c; Carranza et al., 2001; Rees et al.,2001a, b; Contreras-Dıaz et al., 2003). The molecular phylogenies provide a hypothesisof relationships of taxa, that can be used for testing the mono- or polyphyly of a particulargroup of taxa on the islands, understanding colonization sequences, disentanglingextinction, hybridization and lineage sorting effects, or even comparing island specia-tion rates with the corresponding continental relatives (Emerson, 2002). Several studieshave used Canary Island beetles and mitochondrial DNA sequences at the populationor the species level, to study the geographical distribution of genetic diversity(phylogeography). They generally have found consistencies with the known geographicalvolcanic evolution of the island chain or different volcanic regions within a single island.For example, two clear divergent mitochondrial lineages in Pimelia (Coleoptera,Tenebrionidae) from Tenerife were deduced to relate to expansion from the older isolatedareas of the island (Juan et al., 1996). In the Fuerteventura and Lanzarote endemicdarkling beetle Hegeter deyrollei (formerly H. politus), a sequential expansion ofthe populations concomitant with the cessation of volcanism was inferred (Juan et al.,1998). Emerson et al. (2000a) showed for the weevil Brachyderes rugatus that themitochondrial haplotypes of populations from the four subspecies occurring in GranCanaria, Tenerife, La Palma and El Hierro belong to two different monophyletic cladesand suggested a recent origin and a possible colonization sequence for this group in theCanary Islands.Darkling beetles (Coleoptera, Tenebrionidae) constitute important elements of the arid
and semi-arid terrestrial ecosystems, because of their high biomass and role as detritivores(De los Santos et al., 2000, 2002a, b). They show adaptations such as diurnal and seasonal
ARTICLE IN PRESSO. Moya et al. / Journal of Arid Environments 66 (2006) 477–497 479
rhythms of activity, resistance to desiccation and adaptation to high temperatures andultra-violet light (Cloudsley-Thompson, 1964) as well as tolerance to low temperatures onhigh mountains (Ottesen and Sømme, 1987). The study of genetic diversity within darklingbeetle species and populations can help not only to understand adaptive trends in theseinsects in relation to environmental factors, but also to give a historic perspective to thebiogeography of these key organisms in arid/semi-arid environments. For example, in aprevious study we analysed the phylogeography of the Pimelia endemic species of theisland of Gran Canaria (Contreras-Dıaz et al., 2003) and the results helped to establishevolutionary units for conservation purposes.
Here we have studied populations of Pimelia species endemic to four islands of theCanary archipelago. New samples of three species (Pimelia canariensis, P. ascendens andP. radula) occurring on Tenerife are added to a previous mitochondrial sequence data setpublished elsewhere (Juan et al., 1996). Using these more extensive population and speciessamples, a re-analysis is performed using new phylogeographic approaches (Templeton,2004). Pimelia canariensis is included in the List of Threatened Species in the Canaries as a‘‘species sensitive to habitat disturbance’’. We also analyse populations of P. laevigata, aspecies endemic to the three westernmost Canary islands, which according toimmunological and numerical taxonomy studies (Oromı, 1979) and in agreement with aprevious morphological taxonomy (Espanol, 1961) includes three different subspecies.Pimelia l. ssp. validipes is present in La Gomera (another Pimelia species occurs in thisisland but it derives from an independent colonization event, see Contreras-Dıaz et al.,2003), Pimelia l. ssp. laevigata in La Palma and P. l. ssp. costipennis in El Hierro. The threesubspecies of P. laevigata are broadly distributed on their correspondent islands, occurringfrom arid and semi-arid lowland environments to high altitude alpine dry areas, but alwaysavoiding forests. In a previous study based on mitochondrial DNA sequences, the threeP. laevigata subspecies were shown to form a monophyletic group apparently derived fromTenerife ancestors, following the east to west and older to younger island generalcolonization pattern (Juan et al., 1995). The Canary Islands are of independent volcanicorigin, so colonization has to be performed across the deep waters separating them.Although we do not have a priori knowledge of when colonization of La Gomera tookplace, this island has been available for a much longer period to support founders than thetwo other islands. La Gomera has been estimated to be of a maximum age about 10 millionyears ago (Ma), while La Palma has been dated at 2Ma and El Hierro less than 1Ma(Ancochea et al., 1990; Fuster et al., 1993; Carracedo et al., 1998).
We have sampled P. laevigata populations on the above three islands, to include arepresentation of the entire geographic range of the species, and we obtained DNAsequences for a short fragment of about 200 bp of Cytochrome Oxidase I (COI)mitochondrial gene. This fragment showed enough variation to resolve the majormitochondrial lineages of closely related species and populations of Tenerifean Pimelia in aprevious study (Juan et al., 1996), so its use here allows a comparison of P. laevigata
sequence diversity with that previously obtained for their Tenerife relatives. The mainquestions we want to address are: (i) What is the genetic differentiation among P. laevigata
subspecies? (ii) Is there geographical structuring among P. laevigata populations withineach of the three islands where they occur? and (iii) Can NCPA and demographicinferences help to elucidate the population history processes of relatively recent colonizers,such as the diversification of Pimelia beetles in Tenerife and their relation to westernCanary Islands taxa?
ARTICLE IN PRESSO. Moya et al. / Journal of Arid Environments 66 (2006) 477–497480
2. Material and methods
2.1. Sampling
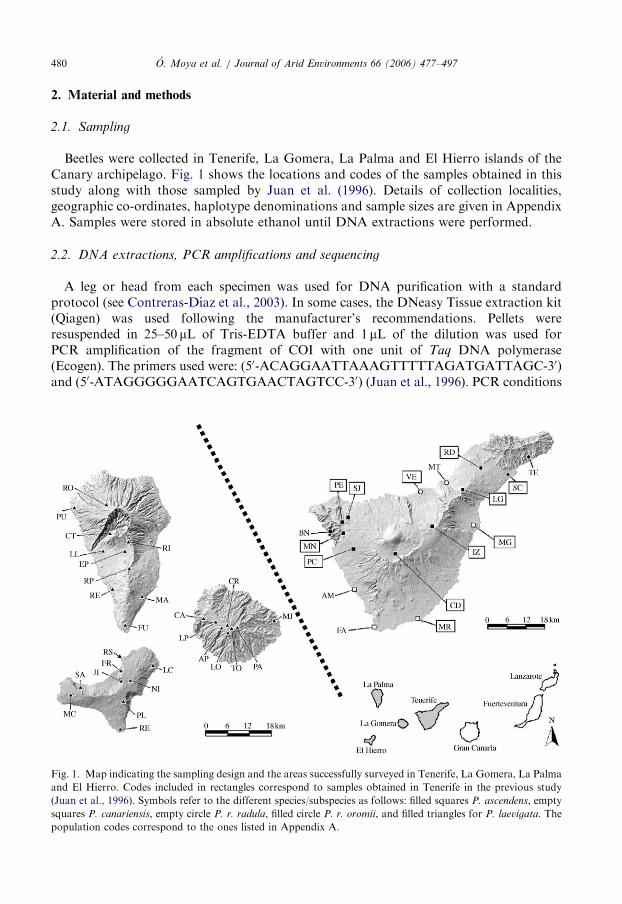
Beetles were collected in Tenerife, La Gomera, La Palma and El Hierro islands of theCanary archipelago. Fig. 1 shows the locations and codes of the samples obtained in thisstudy along with those sampled by Juan et al. (1996). Details of collection localities,geographic co-ordinates, haplotype denominations and sample sizes are given in AppendixA. Samples were stored in absolute ethanol until DNA extractions were performed.
2.2. DNA extractions, PCR amplifications and sequencing
A leg or head from each specimen was used for DNA purification with a standardprotocol (see Contreras-Dıaz et al., 2003). In some cases, the DNeasy Tissue extraction kit(Qiagen) was used following the manufacturer’s recommendations. Pellets wereresuspended in 25–50 mL of Tris-EDTA buffer and 1 mL of the dilution was used forPCR amplification of the fragment of COI with one unit of Taq DNA polymerase(Ecogen). The primers used were: (50-ACAGGAATTAAAGTTTTTAGATGATTAGC-30)and (50-ATAGGGGGAATCAGTGAACTAGTCC-30) (Juan et al., 1996). PCR conditions
Fig. 1. Map indicating the sampling design and the areas successfully surveyed in Tenerife, La Gomera, La Palma
and El Hierro. Codes included in rectangles correspond to samples obtained in Tenerife in the previous study
(Juan et al., 1996). Symbols refer to the different species/subspecies as follows: filled squares P. ascendens, empty
squares P. canariensis, empty circle P. r. radula, filled circle P. r. oromii, and filled triangles for P. laevigata. The
population codes correspond to the ones listed in Appendix A.
ARTICLE IN PRESSO. Moya et al. / Journal of Arid Environments 66 (2006) 477–497 481
were as follows: 4min at 95 1C followed by 35 cycles of denaturation at 95 1C for 30 s,annealing at 50 1C for 1min, and extension at 72 1C for 1min, with a final single extraextension step at 72 1C for 10min. PCR products were checked in a 1% agarose gel and theproducts of the expected length were precipitated with ammonium acetate 5M andisopropanol. The forward, and reverse strands in the cases where sequence ambiguities weredetected, were cycle-sequenced using an Applied Biosystems ABI Prism DYE TerminatorCycle Sequencing Reaction Kit and sequenced in an ABI 377 automated sequencer.A common fragment of about 200bp was sequenced for all samples. An alignment of all thesequences used in this study has been deposited in the EMBL database under accessionnumber ALIGN-000819.
2.3. Phylogenetic analyses
Sequences were aligned using the ClustalX program (Thompson et al., 1997) and nolength differences were found in the alignments. ModelTest (version. 3.06; Posada andCrandall, 1998) was used to select the substitution model(s) that best described the dataunder the Akaike information criterion, and PAUP* vs. 4.0b10 (Swofford, 2002) was usedto calculate sequence divergences and obtain phylogenetic trees. Neighbour-joining (NJ)and maximum parsimony trees were obtained, the latter using heuristic searches with tree-bisection-reconnection as the branch-swapping algorithm and the starting tree wasobtained via stepwise addition with random addition of sequences with 100 replicates. Thesequence from P. lutaria, endemic to Fuerteventura and basal to all congeneric Canarianspecies, as was demonstrated by using different mitochondrial and nuclear markers (Ponset al., 2004), was used as outgroup. Bootstrap values were estimated with heuristic searchesusing 500 pseudo-replicates.
2.4. Molecular diversity and population dynamics
Estimates of mean nucleotide and haplotype diversities within each species andpopulations were obtained with the program DnaSP vs. 4.0 (Rozas et al., 2003). Mismatchanalysis of COI mitochondrial sequences (frequency of pairwise differences betweenhaplotypes) was performed to explore the demographic history of the studied populations.This method is based on the assumption that population growth or decline leave distinctivesignatures in the DNA sequences compared to constant population size. A recent growth isexpected to generate a unimodal distribution of pairwise differences between sequences(Rogers and Harpending, 1992). The distribution is compared to that expected under amodel of population expansion (Rogers, 1995) calculating the estimator of the time ofexpansion (t) and the mutation parameter (y) according to Schneider and Excoffier (1999).The formula t ¼ t=ð2uÞ is used to estimate the timing of population expansions. Weassume a substitution rate per site per lineage of 0.0107 per million years (equivalent to apairwise divergence of 2.15%/Ma assumed to be the average for insect mitochondrialDNA) (De Salle et al., 1987; Brower, 1994), so the mutation rate u in our 200 bp COIsequence is 2.15� 10�6 per generation, assuming a generation time of 1 year. Confidenceintervals for the parameters of the distributions were obtained by parametric bootstrap(1000 replicates) using Arlequin vs. 2.000 (Schneider et al., 2000). If population growthapplies, the validity of a stepwise expansion model is tested using the same bootstrapapproach by a goodness-of-fit statistic (P), representing the probability that the variance of
ARTICLE IN PRESSO. Moya et al. / Journal of Arid Environments 66 (2006) 477–497482
the simulated data set is equal or greater than the observed data set. We also computed theraggedness index (r) of the distribution and its significance, as implemented in Arlequin vs.2.000. The mismatch analysis has been shown to be very conservative, having a lowstatistical power in the case of low sample sizes (Ramos-Onsins and Rozas, 2002). For thisreason, other tests have been proposed for detecting past population growth such as Fu’sF (Fu, 1997) or R2 which have been shown to be superior for small sample sizes (Ramos-Onsins and Rozas, 2002). For this reason, we also computed Fu’s test of neutrality asimplemented in Arlequin vs. 2.000 (Schneider et al., 2000).
2.5. Network estimation and nested clade phylogeographic analysis
The network of mitochondrial Pimelia haplotypes was inferred using statisticalparsimony (Templeton et al., 1992) as implemented in the program TCS vs. 1.13 (Clementet al., 2000). The method links haplotypes with the smallest number of differences asdefined by a 95% confidence criterion. NCPA was used (Templeton et al., 1995) to inferthe population history of studied species of Pimelia. The NCPA first tests the nullhypothesis of no association between haplotype variation and geography, and thenproceeds to interpret the significant association patterns (Crandall and Templeton, 1993).The NCPA nesting design was constructed by hand using the statistical parsimonynetwork following the rules given in Templeton (1998). In essence, the nesting procedureconsists of nesting n-step clades or haplotype groups, where n is correlated with the numberof nucleotide mutations separating haplotypes (Crandall, 1996). The procedure beginsfrom the external (tip) clades and proceeds to the interior (clades joined to one or moreclades by a single step). The haplotypes are nested in increasing step-levels until all the databecome nested into a single clade, the total cladogram. The software GeoDis vs. 2.1(Posada et al., 2000) was used to calculate the NCPA distance measures and theirstatistical significance. This method uses geographical distances between the sampledlocations and estimates four basic statistics: Dc, Dn, IT-Dc and IT-Dn. Dc or cladedistance measures the average distance of all clade members from its geographical centre ofdistribution. Dn or nested clade distance measures how widespread is a particular claderelative to the distribution of its sister clades in the same nesting group. IT-Dc and IT-Dnconstitute similar distances considering tips and interiors differentially. The distinctionbetween tip (with only one connection to the remaining network) and interior (with twoor more connections) haplotype groups in the context of the coalescent theory allowstesting the hypothesis of random geographical distribution by permutational tests(we performed 10,000 permutations). The predictions from the coalescent can besummarized as follows: (i) on average, haplotypes with higher frequency tend to beolder and have a greater probability of being interior, (ii) older haplotypes will be morebroadly geographically distributed, (iii) haplotypes with greater frequency will tend to havemore mutational connections and (iv) unique haplotypes (singletons) are more likely tobe joined to non-unique ones than to other singletons, and to haplotypes from thesame population (Posada and Crandall, 2001). Using the updated version of the inferencekey in Templeton (2004) we can deduce which factor(s) could plausibly account forthe spatial and/or temporal significant association of haplotypes. In this way, wecan distinguish historical (fragmentation, range expansion) from current (gene flow,genetic drift) processes responsible for the observed pattern of genetic variation(Templeton, 2004).
ARTICLE IN PRESSO. Moya et al. / Journal of Arid Environments 66 (2006) 477–497 483
3. Results
3.1. Genetic diversity
For this study, 32 localities were sampled in the four western Canary Islands and 143individuals have been analysed (see Fig. 1, Table 1 and Appendix A). COI sequences wereobtained for 129 individuals of P. laevigata from 27 localities across the three islands wherethis species occurs (La Gomera, La Palma and El Hierro). From the sampling made inTenerife, we obtained 14 further individuals of P. radula and P. canariensis to complete thegeographical range of the 61 samples already sequenced in the previous study (see Fig. 1 inJuan et al., 1996). These 75 individuals are now a good representation of the three differentnominal species present in Tenerife, one of which is split into two subspecies. Consideringthat a taxonomy redefinition has been recently proposed, the haplotypes have beenarranged differently to the denominations used by Juan et al. (1996) (see Vinolas, 1994;Oromı and Garcıa, 1995).
We obtained 83 different haplotypes in our total Pimelia data set (excluding sites withmissing data) that showed considerable genetic diversity. Of those, 36 were exclusive toTenerife beetles and the remaining 47 belonged to P. laevigata from the westernmostislands. Table 1 shows molecular diversity estimates for the sequence data obtained acrossall Pimelia samples within Tenerife, within each of the Tenerife species, and within thethree different island populations of P. laevigata. Haplotype diversities are lower withinP. canariensis (Tenerife) (a fact that could be due to the lower sample size in this case), andin P. l. costipennis (El Hierro) and P. l. laevigata (La Palma), suggesting a relatively recentdiversification of these populations.
3.2. Phylogenetic analyses
Overall, 60 variable positions are present in the ingroup sequence data set (of which 47are parsimoniously informative). Sequences are AT-biased (65.8%); with most changes
Table 1
Summary of mean nucleotide and haplotype diversities of the different Pimelia species sequenced for the
mitochondrial COI fragment
Species/populations N Haplotypes Nucleotide diversity7S.D. Haplotype diversity7S.D.
P. ascendens 34 21 0.017070.0020 0.91170.042
P. canariensis 8 2 0.005870.0013 0.53670.123
P. radula 33 13 0.026470.0038 0.77770.069
Total Tenerife 75 36 0.051170.0019 0.93370.017
La Gomera
P. l. validipes 47 21 0.012670.0019 0.84370.049
La Palma
P. l. laevigata 44 15 0.008770.0012 0.79570.057
El Hierro
P. l. costipennis 38 11 0.008070.0010 0.83570.047
Total P. laevigata 129 47 0.027870.0008 0.94270.010
Total 204 83 0.053370.0018 0.96870.005
ARTICLE IN PRESS
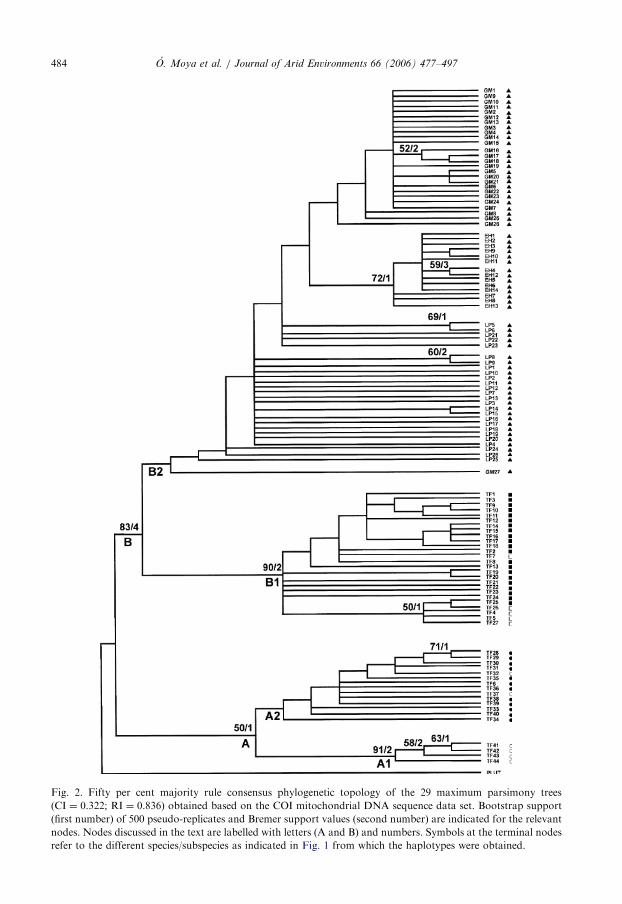
Fig. 2. Fifty per cent majority rule consensus phylogenetic topology of the 29 maximum parsimony trees
(CI ¼ 0.322; RI ¼ 0.836) obtained based on the COI mitochondrial DNA sequence data set. Bootstrap support
(first number) of 500 pseudo-replicates and Bremer support values (second number) are indicated for the relevant
nodes. Nodes discussed in the text are labelled with letters (A and B) and numbers. Symbols at the terminal nodes
refer to the different species/subspecies as indicated in Fig. 1 from which the haplotypes were obtained.
O. Moya et al. / Journal of Arid Environments 66 (2006) 477–497484
ARTICLE IN PRESSO. Moya et al. / Journal of Arid Environments 66 (2006) 477–497 485
corresponding to synonymous substitutions at third codon positions (81.7%). Theconsensus maximum parsimony tree obtained shows the haplotypes arranged into twomajor sister clades (Fig. 2). Clade A includes haplotypes of P. r. oromii (north-eastTenerife) and P. r. radula (north Tenerife), and clade B is formed by P. ascendens (west andcentral regions), P. canariensis (southern arid coastal areas) plus P. laevigata
mitochondrial haplotypes from the three western islands. Haplotypes of P. r. radula fromLa Matanza (MT in Tenerife) are present in clades A1 and A2. In addition, P. canariensis
haplotypes are polyphyletic with P. ascendens haplotypes, despite being the formermarkedly differentiated in morphology from the high altitude P. ascendens populations(see Espanol, 1961). In fact, P. ascendens had been considered just a subspecies of P. radula
when only morphological characters were used (Espanol, 1961); later immunologicalstudies showed higher differences between the two taxa and suggested their independentspecies status (Oromı, 1979), which was finally established (Oromı and Garcıa, 1995) afterbetter supported differences based on mtDNA sequences (Juan et al., 1995). Increasedsampling of this coastal species and the use of additional molecular markers could clarify ifP. canariensis represents an ecotype of P. ascendens. Within clade B, the phylogeneticrelationships are not well resolved—what is not surprising given the short DNA sequenceused and the relatively low divergence observed.
Uncorrected distances between different Pimelia species from the easter and centralCanary Islands haplotypes ranged from 0.005 to 0.14, and the mean distance betweeningroup taxa and the outgroup P. lutaria was 0.12 (0.09–0.16 range). The optimalsubstitution model for the complete data set (including the outgroup) is the General TimeReversible (GTR, Rodrıguez et al., 1990) with a proportion of invariable sites (I) of 0.595and a value for the G distribution of 1.002 using the Akaike information criterion. The NJtopology using these distances and parameters was similar to the one obtained bymaximum parsimony. A likelihood ratio test using the likelihood scores of the original treewith branch lengths estimated implementing the GTR+I+G model assuming nomolecular clock and constraining rate constancy indicated that the data is consistentwith a molecular clock (2DL ¼ 120:88 at df ¼ 110; p ¼ 0:22).
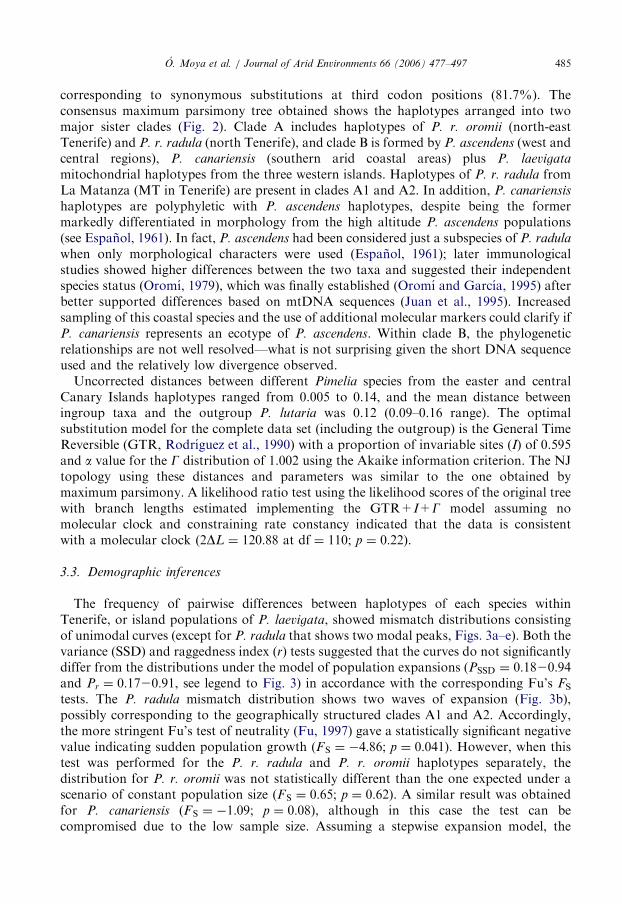
3.3. Demographic inferences
The frequency of pairwise differences between haplotypes of each species withinTenerife, or island populations of P. laevigata, showed mismatch distributions consistingof unimodal curves (except for P. radula that shows two modal peaks, Figs. 3a–e). Both thevariance (SSD) and raggedness index (r) tests suggested that the curves do not significantlydiffer from the distributions under the model of population expansions (PSSD ¼ 0:1820:94and Pr ¼ 0:1720:91, see legend to Fig. 3) in accordance with the corresponding Fu’s FS
tests. The P. radula mismatch distribution shows two waves of expansion (Fig. 3b),possibly corresponding to the geographically structured clades A1 and A2. Accordingly,the more stringent Fu’s test of neutrality (Fu, 1997) gave a statistically significant negativevalue indicating sudden population growth (FS ¼ �4:86; p ¼ 0:041). However, when thistest was performed for the P. r. radula and P. r. oromii haplotypes separately, thedistribution for P. r. oromii was not statistically different than the one expected under ascenario of constant population size (FS ¼ 0:65; p ¼ 0:62). A similar result was obtainedfor P. canariensis (FS ¼ �1:09; p ¼ 0:08), although in this case the test can becompromised due to the low sample size. Assuming a stepwise expansion model, the
ARTICLE IN PRESS
Fig. 3. Mismatch distributions for Pimelia COI DNA sequence subsets. The curves represent the observed relative
frequencies of nucleotide differences between pairs of individuals and the distribution fitted to the data under the
assumption of a model of population expansion. p-Value represents the probability that the variance of the
simulated data set is equal or greater than the observed one. (a) P. ascendens; (b) P. radula including the two
subspecies; (c) P. l. validipes; (d) P. l. laevigata (e) P. l. costipennis. Pimelia canariensis was not included in this
analysis due to the low number of individuals of the sample.
Table 2
Summary of parameters estimated assuming a stepwise population growth model in several Pimelia species from
the Canary Islands. The estimator of the expansion time (t) and the mutation parameters before (y0) and after (y1)the expansions are given according to Schneider and Excoffier (1999). The formula t ¼ t=ð2uÞ was used to estimate
the time of population expansions taking a generation time of 1 year, where u corresponds to the mutation rate for
the DNA sequence used per generation. Confidence intervals for t are based on the maximum–minimum
nucleotide substitution rate values for arthropod mitochondrial DNA
Species y0 y1 t Time (Ma)
P. ascendens 4.116 42.461 2.213 0.5370.04
P. radula 0.004 7.525 12.204 2.9170.20
P. l. validipes 0.509 60.439 2.847 0.6870.05
P. l. laevigata 0.451 19.441 3.104 0.7470.05
P. l. costipennis 0.000 3278.750 1.752 0.4270.03
O. Moya et al. / Journal of Arid Environments 66 (2006) 477–497486
ARTICLE IN PRESSO. Moya et al. / Journal of Arid Environments 66 (2006) 477–497 487
oldest population growth in Tenerife is estimated at about 2.970.2Ma for P. radula. Thisestimate is based on a time of the expansion t value of 12.204 and a mutation rate for theconsidered sequence of u ¼ 2.15� 10�6 per generation (see Material and Methods andTable 2). Similarly, in P. ascendens the expansion could be dated at 0.670.04Ma, whileP. laevigata expansions are estimated to be 0.6870.05Ma for P. l. validipes (La Gomera)and 0.7470.05Ma for P. l. laevigata (La Palma) and 0.470.03Ma for P. l. costipennis
(El Hierro).
3.4. Population history inferences from NCPA
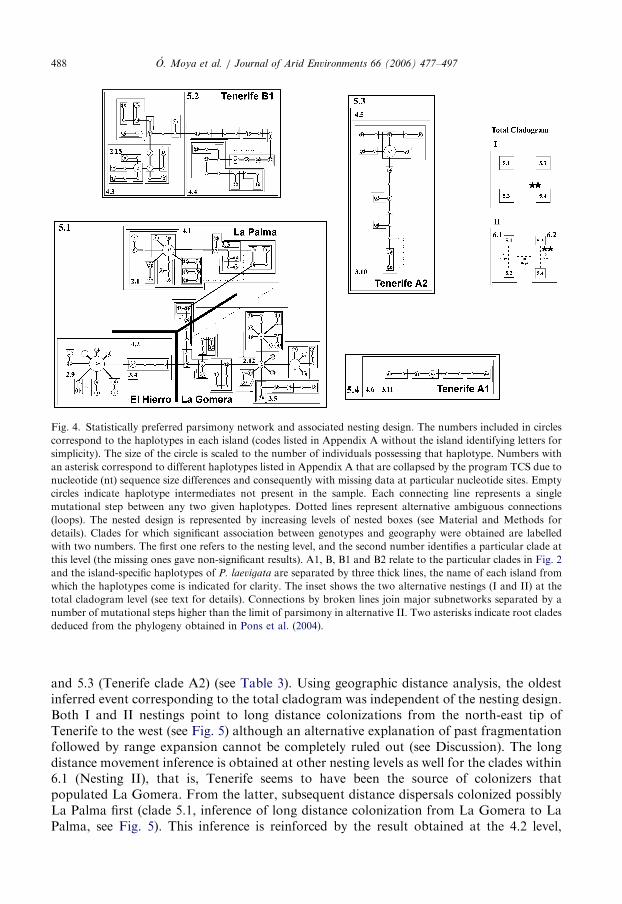
The limit of mutational connections (probabilityX95% of being connected in aparsimonious way) for our data set was five nucleotide substitutions using statisticalparsimony. The parsimony networks of COI haplotypes were resolved except for someloops of ambiguity (haplotypes with more than one most parsimonious connection to therest of the network). We present in Fig. 4 the results for the preferred network, based ongeographical distribution of the mitochondrial genotypes and haplotype frequency criteria(see Material and Methods). Four major subnetworks were obtained connected by morethan five steps. Haplotype group 5.1 includes all P. laevigata haplotypes and 5.2 contain P.
ascendens and P. canariensis haplotypes (equivalent to clade B1 in the tree of Fig. 2).Group 5.3 contains P. r. radula and P. r. oromii haplotypes (corresponding to clade A2 inthe tree of Fig. 2) and 5.4 P. r. radula (Clade A1) exclusively. We used the maximumparsimony tree (Fig. 2) to compute the steps connecting these higher categories; clades 5.1and 5.2 are connected by nine steps, 5.3 and 5.4 by 10, and 6.1 and 6.2 are joined by 18nucleotide substitutions.
At the total cladogram level, we explored two nesting alternatives. The moreconservative nesting option was considering the four 5-levels as unconnected (nesting Iin Fig. 4). The second option (nesting II in Fig. 4) was to build the last two nesting levelsconnecting the clades 5.1–5.2 and 5.3–5.4 to obtain the higher 6.1 and 6.2 clades,respectively, at the total cladogram level. These connections have a high probability ofbeing affected by homoplastic changes, but still this nesting design is a plausiblerepresentation of the phylogenetic relationships if we take into account previousphylogenetic information (Pons et al., 2004) and geographic-paleogeological considera-tions (i.e. distance between islands and their age of emergence; Juan et al., 1995; Juan et al.,2000). In addition, distinguishing tip and interior clades at this nesting levels can beambiguous based on the tree of Fig. 2 or in the distance analysis, as the phylogeneticrelationships of clades A and B in are not well supported. For example, some haplotypes(GM27) seem to be as close to the outgroup as any haplotype in clades A1 or A2. Instead,we used a more robust Pimelia species-phylogeny using mitochondrial (COI+cytochromeb, 16S RNA) and nuclear (28S RNA+Histone 3) sequences (Pons et al., 2004) to root atclade 5.4 (P. r. radula) in nesting I option, while clade 6.2 was the root (interior) and 6.1 tipin nesting II.
The association between genetic and geographic distribution was rejected at most lownesting levels (1step clades) showing haplotypic variation. In the few cases wheresignificant associations were obtained, many gave inconclusive outcomes after followingthe inference key of Templeton (2004) probably due to an inadequate sample design.Contingency tests showed significant geographical associations of haplotypes containedwithin some higher nesting levels, for example, 5.1 (P. laevigata), 5.2 (Tenerife clade B1)
ARTICLE IN PRESS
Fig. 4. Statistically preferred parsimony network and associated nesting design. The numbers included in circles
correspond to the haplotypes in each island (codes listed in Appendix A without the island identifying letters for
simplicity). The size of the circle is scaled to the number of individuals possessing that haplotype. Numbers with
an asterisk correspond to different haplotypes listed in Appendix A that are collapsed by the program TCS due to
nucleotide (nt) sequence size differences and consequently with missing data at particular nucleotide sites. Empty
circles indicate haplotype intermediates not present in the sample. Each connecting line represents a single
mutational step between any two given haplotypes. Dotted lines represent alternative ambiguous connections
(loops). The nested design is represented by increasing levels of nested boxes (see Material and Methods for
details). Clades for which significant association between genotypes and geography were obtained are labelled
with two numbers. The first one refers to the nesting level, and the second number identifies a particular clade at
this level (the missing ones gave non-significant results). A1, B, B1 and B2 relate to the particular clades in Fig. 2
and the island-specific haplotypes of P. laevigata are separated by three thick lines, the name of each island from
which the haplotypes come is indicated for clarity. The inset shows the two alternative nestings (I and II) at the
total cladogram level (see text for details). Connections by broken lines join major subnetworks separated by a
number of mutational steps higher than the limit of parsimony in alternative II. Two asterisks indicate root clades
deduced from the phylogeny obtained in Pons et al. (2004).
O. Moya et al. / Journal of Arid Environments 66 (2006) 477–497488
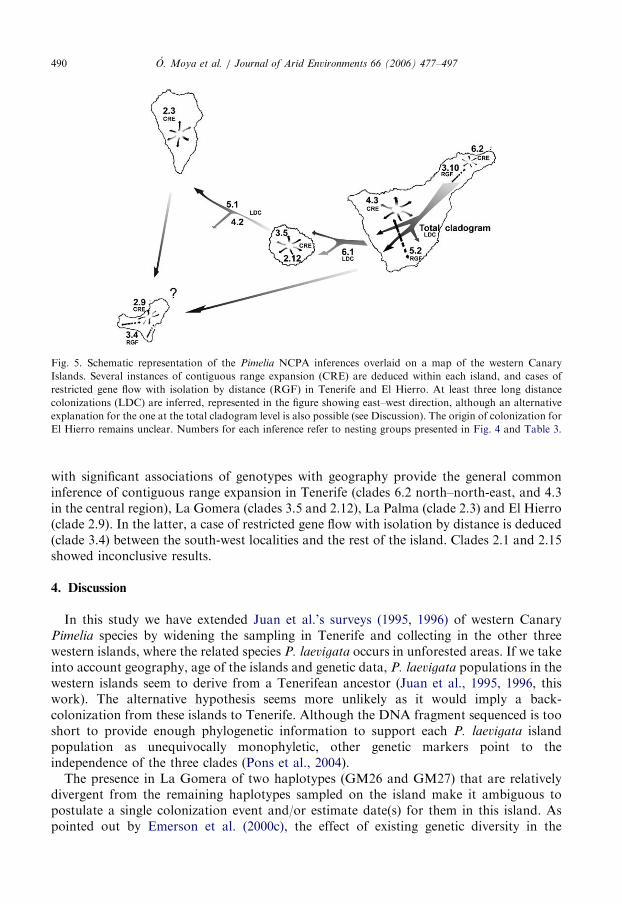
and 5.3 (Tenerife clade A2) (see Table 3). Using geographic distance analysis, the oldestinferred event corresponding to the total cladogram was independent of the nesting design.Both I and II nestings point to long distance colonizations from the north-east tip ofTenerife to the west (see Fig. 5) although an alternative explanation of past fragmentationfollowed by range expansion cannot be completely ruled out (see Discussion). The longdistance movement inference is obtained at other nesting levels as well for the clades within6.1 (Nesting II), that is, Tenerife seems to have been the source of colonizers thatpopulated La Gomera. From the latter, subsequent distance dispersals colonized possiblyLa Palma first (clade 5.1, inference of long distance colonization from La Gomera to LaPalma, see Fig. 5). This inference is reinforced by the result obtained at the 4.2 level,
ARTICLE IN PRESS
Table 3
Results of the nested cladistic phylogeographic analyses for Pimelia samples. Only instances of statistically
significant results obtained by geographical distance analysis are shown. The results at the one-step level are not
shown due to the low number of individuals (see Results). w2 statistics and the associated p-values were obtained
by permutational contingency tests with 10,000 replications. This test was non-significant only for clades 2.1 and
2.3, being the geographical distance analysis using Dc and Dn distances statistically significant
Clade w2 p-Value Inference chain Inference
Clades within
2.1
25.8678 0.2250 1–2–11–17-No Inconclusive outcome
Clades within
2.3
5.0000 0.4010 1–2–11–12-No Contiguous range expansion
Clades within
2.9
91.0350 0.0000 1–2–11–12-No Contiguous range expansion
Clades within
2.12
9.0000 0.0450 1–19–20–2–11–12-No Contiguous range expansion
Clades within
2.15
14.1429 0.0150 1–2–11–17-No Inconclusive outcome
Clades within
3.4
19.9500 0.0250 1–2–3–4-No Restricted gene flow with
isolation by distance
Clades within
3.5
63.6849 0.0000 1–2–11–12-No Contiguous range expansion
Clades within
3.10
18.0556 0.0270 1–2–3–4-No Restricted gene flow with
isolation by distance
Clades within
4.2
127.9667 0.0000 1–2–3–5–6-Too few clades-7-
Yes
Restricted gene flow/Dispersal
but with some long distance
dispersal
Clades within
4.3
20.3667 0.0000 1–2–11–12-No Contiguous range expansion
Clades within
4.4
16.0000 0.0010 1–19–20–2–3–4–9-No Allopatric fragmentation
Clades within
5.1
121.0933 0.0000 1–2–3–5–15–21-Yes Long distance colonisation
Clades within
5.2
21.8169 0.0010 1–2–3–4-No Restricted gene flow with
isolation by distance
Clades within
6.1
171.0000 0.0000 1–19–20–2–11–12–13–21-Yes Long distance colonisation
Clades within
6.2
27.5550 0.0000 1–2–11–12-No Contiguous range expansion
Total cladogram
I
578.3400 0.0000 1–2–11–12–13–21-No Long distance movements or
combined effects of gradual
movement during a past range
expansion and fragmentation
Total cladogram
II
204.0000 0.0000 1–19–20–2–11–12–13–21-No Long distance movements or
combined effects of gradual
movement during a past range
expansion and fragmentation
O. Moya et al. / Journal of Arid Environments 66 (2006) 477–497 489
including haplotypes of P. laevigata from the three islands. Besides these results, twoinstances of restricted gene flow with isolation by distance (clades 3.10 and 5.2) and one ofallopatric fragmentation (clade 4.4) are inferred within Tenerife. Most other nesting levels
ARTICLE IN PRESS
Fig. 5. Schematic representation of the Pimelia NCPA inferences overlaid on a map of the western Canary
Islands. Several instances of contiguous range expansion (CRE) are deduced within each island, and cases of
restricted gene flow with isolation by distance (RGF) in Tenerife and El Hierro. At least three long distance
colonizations (LDC) are inferred, represented in the figure showing east–west direction, although an alternative
explanation for the one at the total cladogram level is also possible (see Discussion). The origin of colonization for
El Hierro remains unclear. Numbers for each inference refer to nesting groups presented in Fig. 4 and Table 3.
O. Moya et al. / Journal of Arid Environments 66 (2006) 477–497490
with significant associations of genotypes with geography provide the general commoninference of contiguous range expansion in Tenerife (clades 6.2 north–north-east, and 4.3in the central region), La Gomera (clades 3.5 and 2.12), La Palma (clade 2.3) and El Hierro(clade 2.9). In the latter, a case of restricted gene flow with isolation by distance is deduced(clade 3.4) between the south-west localities and the rest of the island. Clades 2.1 and 2.15showed inconclusive results.
4. Discussion
In this study we have extended Juan et al.’s surveys (1995, 1996) of western CanaryPimelia species by widening the sampling in Tenerife and collecting in the other threewestern islands, where the related species P. laevigata occurs in unforested areas. If we takeinto account geography, age of the islands and genetic data, P. laevigata populations in thewestern islands seem to derive from a Tenerifean ancestor (Juan et al., 1995, 1996, thiswork). The alternative hypothesis seems more unlikely as it would imply a back-colonization from these islands to Tenerife. Although the DNA fragment sequenced is tooshort to provide enough phylogenetic information to support each P. laevigata islandpopulation as unequivocally monophyletic, other genetic markers point to theindependence of the three clades (Pons et al., 2004).The presence in La Gomera of two haplotypes (GM26 and GM27) that are relatively
divergent from the remaining haplotypes sampled on the island make it ambiguous topostulate a single colonization event and/or estimate date(s) for them in this island. Aspointed out by Emerson et al. (2000c), the effect of existing genetic diversity in the
ARTICLE IN PRESSO. Moya et al. / Journal of Arid Environments 66 (2006) 477–497 491
ancestral population and the possibility of lineage extinction, complicate the inferenceof colonization events from one island to another in a given phylogeny. In Tenerife,the results obtained elsewhere (Juan et al., 1996) pointing out the existence of twovery divergent mitochondrial lineages are confirmed with our present morecomprehensive sampling. Lineage A includes P. radula haplotypes, with the currentsubspecies designation not completely coincidental with lineages A1 and A2 sincehaplotypes of P. r. radula are in both groups. This can be explained either by retentionof ancestral polymorphisms or, more probably, by mitochondrial introgression.Nevertheless, after the analysis of the geographically intermediate, newly discoveredpopulation in La Matanza (MT, Tenerife), we can state that the morphological characterson which the two subspecies are based show a clinal variation along the north–north-eastregion of Tenerife. On the other hand, Tenerife mitochondrial lineage B1 is the sistergroup of P. laevigata, including P. ascendens distributed at relatively high altitudelocalities, and P. canariensis present along the south-east to south-west coastal arid areasof the island. In addition, the tree topology suggests that colonization to the westernislands (being probably La Gomera first to be colonized) was by ancestors of the B1Tenerife lineage.
Pairwise differences between sampled DNA sequences (Fig. 3) show that in all thestudied cases, mitochondrial mismatch distributions are compatible with historicpopulation expansions or bottlenecks followed by a return to the original popula-tion size (Slatkin and Hudson, 1991; Rogers and Harpending, 1992). Estimates forthe corresponding dates of population expansion are in good accordance with theisland dates of formation (Table 2). For example, population expansion is inferred tobe older for the A lineage of Tenerife compared to one of the remaining species, while theP. laevigata expansion in the El Hierro population is deduced to be more recent andexplosive (Table 2). This result is in accordance with the younger age for the subaerialformation of this island and, therefore, within the time frame in which colonization waspossible.
One objective of this paper was to assess the validity of nested phylogeographicalcladistic analysis (Templeton et al., 1995; Templeton, 2004) in order to infer historicalpopulation events in an a priori scenario of recurrent long distance dispersal, such asthe one assumed to explain colonization and diversification of an oceanic archipelago. TheCanary Islands are of independent volcanic origin and have never been connected by theeffect of sea level oscillations, with the possible exception of Fuerteventura and Lanzarotethat are separated by a very shallow strait, but whose populations are not included in thisstudy. As expected, molecular phylogenies show that in the Canaries the general pattern ofcolonization in a diversity of terrestrial organisms is consistent with dispersal from older toyounger islands, westwards along the island chain (Juan et al., 2000). NCPA infers longdistance movements in cases of a large nesting distance (Dn) in a clade with small cladedistance (Dc) (though extinction of intermediate populations in organisms with lowvagility can also be compatible with this pattern). This inference is expected to occur, forexample, if a peripheral population has a unique haplotype, but a reduced geographicaldistribution with respect to that of the haplotypes from which it derived, while, on thecontrary, concordant Dc and Dn values suggest short distance movements (Masta et al.,2003). Assuming an adequate geographical sampling, NCPA should distinguish betweenthe above alternatives, but cases of misinterpretation have been shown to occur insituations of gradual expansions or re-invasions of previous ranges (Masta et al., 2003). In
ARTICLE IN PRESSO. Moya et al. / Journal of Arid Environments 66 (2006) 477–497492
the present data set, the NCPA analysis can detect at least three instances in whichgeographical association of genotypes could be explained by long distance movementsof the species. Alternatively, the pattern could be explained by the combined effectsof gradual movement during a past range expansion and a subsequent fragmentation(step 21 in the NCPA updated inference key, Templeton, 2004). The discriminationbetween the two alternatives has shown to be only possible using outside independentinformation (Masta et al., 2003; Templeton, 2004). Pimelia species are flightless, so passivedispersal has to be invoked for these organisms, possibly through floating vegetationdrifted by the prevailing north-east–south-west sea currents in this part of the Atlantic.In fact, the Canary archipelago has been colonized primarily by single or multiplecontinental dispersal events in terrestrial organisms even in animals with low vagility(Juan et al., 2000; Emerson, 2002). On the other hand, in a scenario of islands ofindependent volcanic origin, the possibility of range expansions followed by fragmenta-tion has to be in principle discarded to explain haplotype distribution patternsamong islands. Because of that, all the instances in which both alternative scenarioswere suggested by the inference key for clades including different islands were consideredas long distance movements. Nevertheless, colonization events of the western islandsof La Gomera, La Palma and El Hierro consistent with a minimum of two eastwardlong distance dispersals, were recovered by the NCPA analysis, although the originof colonization for El Hierro remains unclear. Another inference frequently obtainedat other nesting levels (6.2, 4.3, 3.5, 2.12, 2.9 and 2.3) is contiguous range expansion,deduced to have occurred more than once in Tenerife and in each of P. laevigata islandpopulations, presumably after the original colonizations. These inferences are consistentwith the deduced population growth by mismatch distribution analyses in the same clades(Fig. 3). Finally, in Tenerife a particular case of allopatric fragmentation of the Izana (IZ)locality, and two instances of restricted gene flow with isolation by distance are deduced.This can be related to the complex geological dynamics of the island, in which geographicalbarriers and local extinctions due to volcanism are expected to have been particularlyfrequent.NCPA has indeed limitations inherent to the sampling scheme (size and number of sites)
and cases in which there is not enough resolution to detect past events (Templeton, 2004).In addition, more serious limitations of the analysis occur when false inferences orbiological misidentifications are obtained. The original inference key (Templeton et al.,1995) has been validated using biological examples for which strong prior evidence existedfor particular past events such as range expansion or fragmentation and updated to avoiderrors or ambiguities (Templeton, 1998, 2001, 2004). Cross-validation obtaining multi-locus data from independently segregating DNA regions, is recommended for obtainingrobust inferences (Templeton, 2004). In our case, sampling size is scarce from some of thegeographical sites, and although the number of sampled localities is relatively high, a morecomprehensive sample scheme would be needed to cover the geographic micro-scale of thehigh altitude regions in the western islands. These sampling limitations resulted in fewcases of significant geographical associations of haplotypes for which inconclusiveoutcomes are obtained, although the low nesting level in which they occur is irrelevant forthe main conclusions of NCPA. Our results also show that there is enough variation in the200 bp fragment and the pooling of data from a previous study allowed a comprehensiveNCPA. However, the relatively high divergence of mitochondrial lineages within Tenerife,and the ones corresponding to island populations of P. laevigata, make the connections
ARTICLE IN PRESSO. Moya et al. / Journal of Arid Environments 66 (2006) 477–497 493
and designation of interior-tip status at the higher nesting level ambiguous and dependanton external previous information. Better genetic resolution by longer mitochondrial DNAsequences and independent genetic markers would clarify the above points further. Finally,NCPA and the associated inference key present some difficulties when applied topopulations present in several volcanic islands as the ones studied here. Creer et al. (2001)studied the phylogeography of bamboo viper in Taiwan and in the offshore Pacific, Orchidand Green islands. Haplotypes of the two latter populations were omitted from the NCPAanalysis because the islands are of volcanic origin and never have been connected toTaiwan and the study focused on historical terrestrial migrations. As mentioned above,in the colonization and diversification of an oceanic archipelago, the a priori hypothesisis long distance dispersal, but if the clades within a nesting clade are found inseparate islands (so in separate areas with no overlap by definition) the inference isallopatric fragmentation. In addition, the inferences of long distance colonization withsubsequent fragmentation or past fragmentation followed by range expansion areimplicitly applied to historical terrestrial situations, being the application to oceanicislands somewhat elusive.
In summary statistical phylogeography—and more specifically nested phylogeographiccladistic analysis, provides an excellent opportunity to contrast current and historicalcauses for the genetic and geographical distribution of darkling beetles in the CanaryIslands. There is a considerable genetic variation and geographical structure both in lowand high altitude arid region populations of the ancient, geologically complex island ofTenerife. In contrast, the younger western islands show evidences of more recentcolonizations and subsequent range expansions of Pimelia populations derived from aTenerife ancestor, and, therefore, limited geographical structuring.
Acknowledgements
Giulia Paroni helped us with laboratory techniques. Heriberto Lopez, Antonio J. Perez,Antonio Camacho, Ruben Barone and Jesus Alonso contributed collecting specimens. Wethank the suggestions made by Eduard Petitpierre and Jesus Gomez-Zurita. The commentsof David Posada and of an anonymous referee on a previous version of the manuscripthelped to improve the paper. This study is supported by the Spanish Ministerio deEducacion y Ciencia including European Union FEDER funds (project REN2003-00024).The permits to collect beetles in the protected areas were obtained from the Viceconsejerıade Medio Ambiente del Gobierno de Canarias and the corresponding Cabildos of theislands, which occasionally provided accommodation.
Appendix A
Summary of Pimelia sampling in the western Canary Islands and in Tenerife. Specieslocalities and their codes, co-ordinates, haplotype distribution (number of individuals withthe same haplotype in parenthesis) and number of individuals collected at a given localityare given. Total number of haplotypes is higher than the figures given in Table 1 becausethe haplotypes with missing data were excluded from the analysis of nucleotide andhaplotype diversities. (Table A1)
ARTICLE IN PRESS
Table A1
Localities Code Co-ordinates Haplotypes N
Tenerife
Pimelia ascendens
Bco. Natero BN �16.841/28.284 TF15 1
Izana IZ �16.500/28.305 TF1, TF2(2), TF3, TF7, TF12(2),
TF19, TF20, TF21, TF23
11
Las Canadas CD �16.623/28.223 TF1(2), TF2(5), TF3, TF13, TF18 10
Las Manchas MN �16.800v28.283 TF14, TF17 2
Pinar Chio PC �16.763/28.240 TF3 1
Puerto Erjos PE �16.802/28.317 TF16, TF25 2
San Jose de los Llanos SJ �16.785/28.325 TF8(2), TF9, TF10, TF11, TF22,
TF24
7
Pimelia canariensis
Armenime AM �16.761/28.122 TF5, TF27 2
Faro de Rasca FA �16.695/27.999 TF5 1
Malpaıs de Guımar MG �16.367/28.310 TF4 1
Mna. Roja MR �16.541/28.035 TF4, TF26(3) 4
Pimelia radula oromii
Las Teresitas TE �16.185/28.507 TF6(5), TF38 6
Las Lagunetas LG �16.409/28.413 TF6, TF28, TF29(2), TF30, TF31,
TF35, TF36
8
Sta. Cruz SC �16.251/28.453 TF6, TF39(2) 3
Los Rodeos RD �16.348/28.478 TF6(3), TF33, TF34, TF40 6
Pimelia radula radula
La Matanza MT �16.460/28.442 TF32, TF37, TF41, TF42 4
La Vera VE �16.536/28.400 TF43(5), TF44 6
La Gomera
Pimelia laevigata validipes
Cementerio Arure CA �17.318/28.130 GM3, GM8, GM18,GM25,
GM26
5
Lomo de la Pecena LP �17.286/28.124 GM2, GM3(2), GM4(3), GM15 7
El Apartadero AP �17.267/28.108 GM2(2), GM4, GM8, GM12,
GM21, GM22, GM23
8
La Cruz de Marıa CR �17.256/28.112 GM2, GM14, GM16, GM17,
GM20, GM24
6
Lomo de los Cardos LO �17.249/28.098 GM5(2), GM6(2), GM19, GM27 6
Torian TO �17.241/28.107 GM1(5), GM9, GM13 7
Pajarito PA �17.233/28.108 GM1, GM7(2) 3
Majona MJ �17.122/28.128 GM1(3), GM10, GM11 5
La Palma
Pimelia laevigata laevigata
Los Llanos LL �17.912/28.659 LP1(3), LP5(3), LP21 7
El Remo RM �17.855/28.552 LP1, LP5(2), LP6 4
El Paso EP �17.852/28.657 LP3, LP15, LP16, LP17, LP24,
LP25, LP26
7
Fuencaliente FU �17.845/28.494 LP3(2), LP7(2), LP13, LP14 6
Refugio del Pilar RP �17.835/28.614 LP1 1
Casas de Taburiente CT �17.894/28.704 LP1, LP20 2
El Riachuelo RI �17.846/28.680 LP1, LP4(2), LP18 4
Puntagorda PU �17.999/28.760 LP1, LP11, LP22, LP23 4
O. Moya et al. / Journal of Arid Environments 66 (2006) 477–497494
ARTICLE IN PRESS
Table A1 (continued )
Localities Code Co-ordinates Haplotypes N
Roque de los Muchachos RO �17.906/28.769 LP2, LP8, LP10, LP12 4
Mazo MA �17.792/28.539 LP2, LP6, LP9, LP12, LP19 5
El Hierro
Pimelia laevigata costipennis
Frontera FR �17.997/27.799 EH1, EH3 2
La Caleta LC �17.890/27.801 EH1, EH2, EH3, EH9 4
Nisdafe NI �17.961/27.769 EH1(2), EH2(2) 4
La Restinga RE �17.982/27.644 EH2(2), EH8(3) 5
El Pinar PI �17.981/27.712 EH2(2), EH6(3), EH7(4) 9
Jinama JI �17.981/27.763 EH2(4), EH12, EH14 6
Sabinosa SA �18.097/27.665 EH4(3), EH5(2) 5
Montana Caracol MC �18.124/27.728 EH11, EH13 2
Roque Salmor RS �18.005/27.821 EH10 1
O. Moya et al. / Journal of Arid Environments 66 (2006) 477–497 495
References
Ancochea, E., Fuster, J.M., Ibarrola, E., Cendrero, A., Coello, J., Hernan, F., Cantagrel, J.M., Jamond, C., 1990.
Volcanic evolution of the island of Tenerife (Canary Islands) in the light of new K–Ar data. Journal of
Volcanology and Geothermal Research 44, 231–249.
Avise, J.C., 1998. The history and purview of phylogeography: a personal reflection. Molecular Ecology 7,
371–379.
Brower, A.V.Z., 1994. Rapid morphological radiation and convergence among races of the butterfly Heliconius
erato inferred from patterns of mitochondrial DNA evolution. Proceedings of the National Academy of
Sciences of the USA 91, 6491–6495.
Brown, R.P., Pestano, J., 1998. Phylogeography of skinks (Chalcides) in the Canary Islands inferred from
mitochondrial DNA sequences. Molecular Ecology 7, 1183–1191.
Carracedo, J.C., Day, S., Guillou, H., Rodrıguez Badiola, E., Canas, J.A., Perez Torrado, F.J., 1998.
Hotspot volcanism close to a passive continental margin: the Canary Islands. Geological Magazine 135 (5),
591–604.
Carranza, S., Arnold, E.N., Mateo, J.A., Lopez-Jurado, L.F., 2001. Parallel gigantism and complex colonization
patterns in the Cape Verde scincid lizards Mabuya and Macroscincus (Reptilia: Scincidae) revealed by
mitochondrial DNA sequences. Proceedings of the Royal Society of London, Series B: Biological Sciences 7,
1595–1603.
Clement, M.D., Posada, D., Crandall, K.A., 2000. TCS: a computer program to estimate gene genealogies.
Molecular Ecology 9, 1657–1659.
Cloudsley-Thompson, M.A., 1964. On the function of the sub-elytral desert Tenebrionidae. Entomologists
Monthly Magazine 0, 148–153.
Contreras-Dıaz, H.G., Moya, O., Oromı, P., Juan, C., 2003. Phylogeography of the endangered darkling beetle
species of Pimelia endemic to Gran Canaria (Canary Islands). Molecular Ecology 12, 2131–2143.
Crandall, K.A., 1996. Multiple interspecies transmissions of human and simian T-cell leukemia/lymphoma virus
type I sequences. Molecular Biology and Evolution 13, 115–131.
Crandall, K.A., Templeton, A.R., 1993. Empirical tests of some predictions from coalescent theory with
applications to intraspecific phylogeny reconstruction. Genetics 134, 959–969.
Creer, S., Malhotra, A., Thorpe, R.S., Chou, W.H., 2001. Multiple causation of phylogeographical pattern as
revealed by nested clade analysis of the bamboo viper (Trimeresurus stejnegeri) within Taiwan. Molecular
Ecology 10, 1967–1981.
De Los Santos, A., Gomez-Gonzalez, L.A., Alonso, C., Arbelo, C.D., De Nicolas, J.P., 2000. Adaptive trends of
darkling beetles (Col., Tenebrionidae) on environmental gradients on the island of Tenerife (Canary Islands).
Journal of Arid Environments 45, 85–98.
ARTICLE IN PRESSO. Moya et al. / Journal of Arid Environments 66 (2006) 477–497496
De los Santos, A., De Nicolas, J.P., Ferrer, F., 2002a. Habitat selection and assemblage structure of darkling
beetles (Col., Tenebrionidae) along environmental gradients on the island of Tenerife (Canary Islands).
Journal of Arid Environments 52, 63–85.
De los Santos, A., Alonso, E.J., Hernandez, E., Perez, A.M., 2002b. Environmental correlates of darkling beetle
population size (Col., Tenebrionidae) on the Canadas of Teide in Tenerife (Canary Islands). Journal of Arid
Environments 50, 287–308.
De Salle, R., Freedman, T., Prager, E.M., Wilson, A.C., 1987. Tempo and mode of sequence evolution in
mitochondrial DNA of Hawaiian Drosophila. Journal of Molecular Evolution 26, 157–164.
Emerson, B.C., 2002. Evolution on oceanic islands: molecular phylogenetic approaches to understanding pattern
and process. Molecular Ecology 11, 951–966.
Emerson, B.C., Oromı, P., Hewitt, G.M., 1999. MtDNA phylogeography and recent intra-island diversification
among Canary Island Calathus beetles. Molecular Phylogenetics and Evolution 13, 149–158.
Emerson, B.C., Oromı, P., Hewitt, G.M., 2000a. Colonisation and diversification of the species Brachyderes
rugatus (Coleoptera) on the Canary Islands: evidence from mitochondrial DNA COII gene sequences.
Evolution 54, 911–923.
Emerson, B.C., Oromı, P., Hewitt, G.M., 2000b. Tracking colonisation and diversification of insect lineages on
islands: mitochondrial DNA phylogeography of Tarphius canariensis (Coleoptera: Colydiidae) on the Canary
Islands. Proceedings of the Royal Society of London B 267, 2199–2205.
Emerson, B.C., Oromi, P., Hewitt, G.M., 2000c. Interpreting colonization of the Calathus (Coleoptera:
Carabidae) on the Canary Islands and Madeira through the application of the parametric bootstrap.
Evolution 54, 2081–2090.
Emerson, B.C., Paradis, E., Thebaud, C., 2001. Revealing the demographic history of species using DNA
sequences. Trends in Ecology and Evolution 16, 707–716.
Espanol, F., 1961. Las Pimelias de las Islas Canarias (Col, Tenebrionidae). Anuario de Estudios Atlanticos 7,
487–497.
Fu, Y.-X., 1997. Statistical tests of neutrality of mutations against population growth, hitchiking and background
selection. Genetics 147, 915–925.
Fuster, J.M., Hernan, F., Cendrero, A., Coello, J., Cantagrel, J.M., Ancochea, E., Ibarrola, E., 1993.
Geocronologıa de la isla de El Hierro (Islas Canarias). Boletın de la Real Sociedad Espanola de Historia
Natural (Seccion Geologıa) 88 (1–4), 85–97.
Juan, C., Oromı, P., Hewitt, G.M., 1995. Mitochondrial DNA phylogeny and sequential colonisation of Canary
Islands by darkling beetles of the genus Pimelia (Tenebrionidae). Proceedings of the Royal Society of London
B 261, 173–180.
Juan, C., Ibrahim, K.M., Oromı, P., Hewitt, G.M., 1996. Mitochondrial DNA sequence variation and
phylogeography of Pimelia darkling beetles on the island of Tenerife (Canary Islands). Heredity 77, 589–598.
Juan, C., Ibrahim, K.M., Oromı, P., Hewitt, G.M., 1998. The phylogeography of the darkling beetle Hegeter
politus in the eastern Canary Islands. Proceedings of the Royal Society of London, Series B: Biological
Sciences 265, 135–140.
Juan, C., Emerson, B.C., Oromı, P., Hewitt, G.M., 2000. Colonization and diversification: towards a
phylogeographic synthesis for the Canary Islands. Trends in Ecology and Evolution 15, 104–109.
Kingman, J.F.C., 1982a. The coalescent. Stochastic Processes and their Applications 13, 235–248.
Kingman, J.F.C., 1982b. On the genealogy of large populations. Journal of Applied Probability 19, 27–43.
Knowles, L.L., 2004. The burgeoning field of statistical phylogeography. Journal of Evolutionary Biology 17,
1–10.
Masta, S.E., Laurent, N.N., Routman, E.J., 2003. Population genetic structure of the toad Buffo woodhousii: an
empirical assessment of the effect of haplotypes extinction on nested cladistic analysis. Molecular Ecology 12,
1541–1554.
Oromı, P., 1979. Taxonomıa numerica de las Pimelia (Col., Tenebrionidae) del Archipielago canario. Boletın de la
Asociacion Espanola de Entomologıa 3, 103–118.
Oromı, P., Garcıa, R., 1995. Contribucion al conocimiento de la fauna de coleopteros de Canarias y su
distribucion. Vieraea 24, 175–186.
Ottesen, P., Sømme, L., 1987. Adaptations to high altitudes in beetles from Tenerife. Vieraea 17, 217–226.
Pons, J., Bruvo, B., Petitpierre, E., Plohl, M., Urgacovic, D., Juan, C., 2004. Complex structural features of
satellite DNA sequences in the genus Pimelia (Coleoptera: Tenebrionidae): random differential amplification
from a common ‘satellite DNA library’. Heredity 92, 418–427.
Posada, D., Crandall, K.A., 1998. Modeltest: testing the model of DNA substitution. Bioinformatics 14, 817–818.
ARTICLE IN PRESSO. Moya et al. / Journal of Arid Environments 66 (2006) 477–497 497
Posada, D., Crandall, K.A., 2001. Intraspecific gene genealogies: trees grafting into networks. Trends in Ecology
and Evolution 16, 37–45.
Posada, D., Crandall, K.A., Templeton, A.R., 2000. GeoDis: a program for the cladistic nested analysis of the
geographical distribution of genetic haplotypes. Molecular Ecology 9, 487–488.
Ramos-Onsins, S.E., Rozas, J., 2002. Statistical properties of new neutrality tests against population growth.
Molecular Biology and Evolution 19, 2092–2100.
Rees, D.J., Emerson, B.C., Oromı, P., Hewitt, G.M., 2001a. Reconciling gene trees with organism history: the
mtDNA phylogeography of three Nesotes species (Coleoptera: Tenebrionidae) on the western Canary Islands.
Journal of Evolutionary Biology 14, 139–147.
Rees, D.J., Emerson, B.C., Oromı, P., Hewitt, G.M., 2001b. Mitochondrial DNA, ecology and morphology:
interpreting the phylogeography of the Nesotes (Coleoptera : Tenebrionidae) of Gran Canaria (Canary
Islands). Molecular Ecology 10, 427–434.
Rodrıguez, F., Oliver, J.F., Marın, A., Medina, J.R., 1990. The general stochastic model of nucleotide
substitutions. Journal of Theoretical Biology 142, 485–501.
Rogers, A., 1995. Population forecasting: do simple models outperform complex models? Mathematical
Population Studies 5, 187–202.
Rogers, A.R., Harpending, H., 1992. Population growth makes waves in the distribution of pairwise genetic
differences. Molecular Biology and Evolution 9, 552–569.
Rozas, J., Sanchez-Del Barrio, J.C., Messegyer, X., Rozas, R., 2003. DnaSP, DNA polymorphism analyses by the
coalescent and other methods. Bioinformatics 19, 2496–2497.
Schneider, S., Excoffier, L., 1999. Estimation of past demographic parameters from the distribution of pairwise
differences when the mutation rates vary among sites. Application to human mitochondrial DNA. Genetics
152, 1079–1089.
Schneider, S., Roessli, D., Excoffier, L., 2000. Arlequin, Version 2.000: A Software for Population Genetics Data
Analysis. Genetics and Biometry Laboratory, University of Geneva, Geneva.
Slatkin, M., Hudson, R.R., 1991. Pairwise comparisons of mitochondrial DNA sequences in stable and
exponentially growing populations. Genetics 129, 555–562.
Swofford, D.L., 2002. PAUP*: Phylogenetic Analysis Using Parsimony (and Other Methods), ver. 4.0b10.
Sinauer, Sunderland.
Templeton, A.R., 1998. Nested clade analysis of phylogeographic data: testing hypothesis about gene flow and
population history. Molecular Ecology 7, 381–397.
Templeton, A.R., 2004. Statistical phylogeography: methods of evaluating and minimizing inference errors.
Molecular Ecology 13, 789–809.
Templeton, A.R., Crandall, K.A., Sing, C.F., 1992. A cladistic analysis of phenotypic associations with
haplotypes inferred from restriction endonuclease mapping. III. Cladogram estimation. Genetics 132,
619–633.
Templeton, A.R., Routman, E., Phillips, C.A., 1995. Separating population structure from population history: a
cladistic analysis of the geographical distribution of mitochondrial DNA haplotypes in the Tiger Salamander,
Ambystoma tigrinum. Genetics 140, 767–782.
Thompson, J.D., Gibson, T.J., Plewniak, F., Jeanmougin, Higgins, D.G., 1997. The CLUSTAL_X windows
interface: flexible strategies for multiple sequence alignment aided by quality analysis tools. Nucleic Acids
Research 24, 4876–4882.
Vinolas, A., 1994. El genero Pimelia Fabricius, 1775 en la Penınsula Iberica y Baleares, con nota sistematica sobre
una especie de Canarias (Coleoptera, Tenebrionidae, Pimeliinae). Sessio Conjunta d0Entomologia 8, 125–140.