Embed Size (px)
Citation preview

Peer review stream Ponte
Proceedings of the 2014 Australasian Road Safety Research, Policing & Education Conference
12 – 14 November, Grand Hyatt Melbourne
Using specialised cyclist detection software to count cyclists and determine
cyclist travel speed from video
Pontea, G., Szpakb, Z. L., Woolleya, J. E. & Searson, D. J.
a The Centre for Automotive Safety Research, The University of Adelaide, b Australian Centre for Visual Technologies,
The University of Adelaide.
Abstract
The Australian Centre for Visual Technologies (ACVT) developed software for post-processing
video footage that is capable of detecting, counting and assessing the level of conspicuity of
cyclists. The initial version of the software, on average, correctly identified and tracked 69% of
cyclists in footage of busy intersections and roundabouts when first trialled. A number of additional
trials were conducted to extend the features of the software. The second trial was undertaken to
explore the possibility of automating speed detection. The video detection software correlated well
with the true cyclist counts and speeds measured by GPS. The third trial involved recording cyclists
travelling over specialised bicycle detection counters and measuring their speeds with a laser gun.
This enabled a comparison between the counts provided by the video detection software and the
counts provided by the closed induction loop counters as well as a comparison of speeds. The final
trial involved four real world sites at which video recordings were taken and analysed by an
improved version of the software and compared to human observations. The improved version of
the software was able to detect 89 to 98% of cyclists. The results indicated good correlation with
human observations and demonstrated the feasibility of using readily obtainable video footage to
collect objective bicycle data. This paper briefly summarises the development and improvement of
the software, details the methods used to obtain the experimental data, present the results and
discusses potential future applications of the software and improvements in detection accuracy.
Introduction
With increases in cycling exposure and large gaps in knowledge regarding specific aspects of
cycling safety, the demand for automated data acquisition systems has grown steadily in recent
times.
In June 2013, the South Australian Motor Accident Commission (MAC) funded the University of
Adelaide’s Australian Centre for Visual Technologies (ACVT) to develop software that could
process video footage of road traffic to distinguish and identify bicycles from other road users
within the road traffic system and assess the level of conspicuity of the observed cyclists. This is
part of the MAC’s ongoing commitment to the safe cycling campaign “Be safe, be seen” (Motor
Accident Commission, 2013).
This paper describes the development of this video detection capability and the future potential of
the software.
Object classification by background subtraction
In the past, intelligent traffic surveillance systems have primarily utilised ‘background subtraction’
computer vision algorithms (Cristani et al., 2010; Mayo & Tapamo, 2009; Valera & Velastin, 2005;
Unzueta et al., 2012) in order to detect road traffic. Specific background subtraction algorithms for
detection of cyclists also exist (Heikkila & Silven, 2004; Malinovski et al., 2009). The fundamental
premise of such software systems is that an empty background (‘the background model’) with no
traffic or movement is initially defined (or learned) as a reference scene within the software system.
Each frame of video is then compared to the reference scene and any differences are assumed to be
Peer review stream Ponte
Proceedings of the 2014 Australasian Road Safety Research, Policing & Education Conference
12 – 14 November, Grand Hyatt Melbourne
the result of movement and are interpreted as motion cues. Detected motion cues are analysed,
usually on the basis of predetermined rules, to determine what object might have caused the motion.
For example, a large region of motion might be associated with car and not a pedestrian, whilst a
large rectangular region of motion might be determined to be a large truck rather than a small car.
Even though there are many rules and patterns that can help distinguish between pedestrians,
cyclists and cars, some rules work well only under specific video camera recording configurations
(e.g. a front facing camera) and may perform poorly in other scenarios such as busy crowded
intersections. A significant cause for failure in rules-based approaches to traffic object detection is
the extreme difficulty in devising rules that work for all appearances of vehicles, pedestrians and
bicycles in all weather and lighting conditions.
Object classification by feature tracking
Another popular method of object classification in the context of traffic surveillance is based on
tracking a relatively sparse set of distinguishable points (Ismail et al., 2009; Li et al., 2014; Saunier
& Sayed, 2006; Saunier & Sayed, 2008). The distinguishable points, often referred to as features,
are usually small regions of high local contract and are typically grouped based on spatial proximity
and common motion. Ensuring that all points in a group span only one object and ensuring that one
object is represented by only one group of points, remains a challenging open research problem.
Moreover, it is difficult to delineate an entire object based solely on a sparse set of feature points.
For example, a bounding rectangle containing all the feature points associated with a cyclist may
not contain the entire cyclist. This is problematic if, as in our context, one needs to analyse the torso
of the cyclist to ascertain conspicuity.
Once groups of points have been formed, the groups still need to be categorised into object types
such as cyclists, cars or pedestrians. This too is a non-trivial problem, and is often addressed using
heuristics such as average speed and acceleration (Ismail et al., 2009) which are unlikely to be
reliable indicators of object type across many different vantage points and traffic scenarios.
Object classification by machine learning
In light of the limitations of previous methods used for traffic object classification, the ACVT
sought to dynamically train a computer vision system to ‘learn’ to distinguish between various road
traffic objects. This was to specifically distinguish between cyclists and all other road traffic groups
including cars, motorcycles, and pedestrians using an artificial intelligence paradigm known as
‘supervised learning’ (Bishop, 2006).
To do this, a large collection of images of cyclists in various poses were annotated and presented to
a machine learning module referred to as ‘the classifier’. The classifier attempts to construct a
representation of the general appearance of cyclists and bicycles particularly by detecting ‘edges’
that are unique to a cyclist profile. The accuracy of the learned representation is then evaluated by
presenting the classifier with a further collection of traffic images to allow it to identify cyclists
from all other traffic groups. The classifier may correctly identify some cyclists but it may also
mistake some vehicles or other shapes as bicycles. The situation where too many misclassifications
are made is an indication that classifier has not yet correctly modelled the appearance of cyclists,
and so is retrained with greater emphasis placed on the example images where the identifications
failed.
In order for the system to learn the concept of cyclists with increased accuracy, the system also
needs to be presented with images of other traffic objects that are not cyclists (such as vehicles,
pedestrians and motorcyclists) that will be frequently presented to the classifier during any video
analysis. As more example images are presented to the classification system, the classifier is able to

Peer review stream Ponte
Proceedings of the 2014 Australasian Road Safety Research, Policing & Education Conference
12 – 14 November, Grand Hyatt Melbourne
determine an increasingly accurate decision boundary, which it can use to distinguish between
cyclists and other traffic objects.
Through constant retraining and evaluation, the classifier becomes proficient at identifying cyclists.
In the first version of the software, the training of the classifier occurred using approximately
10,000 example images of cyclists in various poses and an additional 10,000 random images not
containing cyclists. The equivalent technical and mathematical details relating to the design of the
classifier in the context of pedestrian detection are described in Paisitkriangkrai, Shen & Zhang
(2008) and Shen, Wang, Paisitkriangkrai & van den Hengel (2013).
Video analysis system design
The video analysis system contains four components:
1. The frame grabber – this module extracts a frame from a video sequence and forwards it to
the cyclist detector/classifier for analysis.
2. Cyclist detector/classifier – this module scans the entire image and uses the trained cyclist
classifier to determine whether a cyclist appears in the image. The cyclist detector extracts
the image regions in which cyclists have been detected and consults a history of previous
cyclist detections to determine whether the cyclist in the current frame has been detected
before (and hence counted). If the cyclist has not appeared before, then the image region
containing the cyclist is forwarded to the visibility analyser module.
3. Visibility Module – this module examines the hue, saturation and brightness of the torso of
an identified cyclist, to further classify the cyclist as being highly visible or not.
4. Record keeper – once the cyclist detection and visibility analysis is complete, the record of
the frame number, location of the cyclist in the frame and the visibility flag of the cyclist is
recorded and stored for use for human analysis (if necessary) and to facilitate post process
playback.
Each unique cyclist is detected, counted and labelled as high visibility or low visibility.
Additionally, as part of the record keeping and the resultant output, the software selects a ‘snapshot’
of each unique cyclist which is considered to be the best representation of a cyclist. These images
are then easily analysed by a human operator and manually filtered to remove false classifications.
As part of the video analysis procedure, the software also records the position of each unique cyclist
within each frame in which the cyclist appears. After the analysis, the software re-assembles these
frames in to sub-videos that show the movement of cyclists.
Method and results
Following the initial development of the software for the MAC (first trial), three additional trials
involving the ACVT and CASR were conducted to test various extensions to the original
functionality of the software. The following outlines the four trials used to develop the video
detection software.
First trial – feasibility study
In the initial feasibility study, a prototype developed by the ACVT was used to: (1) attempt to
identify cyclists from other road users within the road traffic system, and (2) assess the level of
visibility of the detected cyclists. The performance of the prototype was compared to human
Peer review stream Ponte
Proceedings of the 2014 Australasian Road Safety Research, Policing & Education Conference
12 – 14 November, Grand Hyatt Melbourne
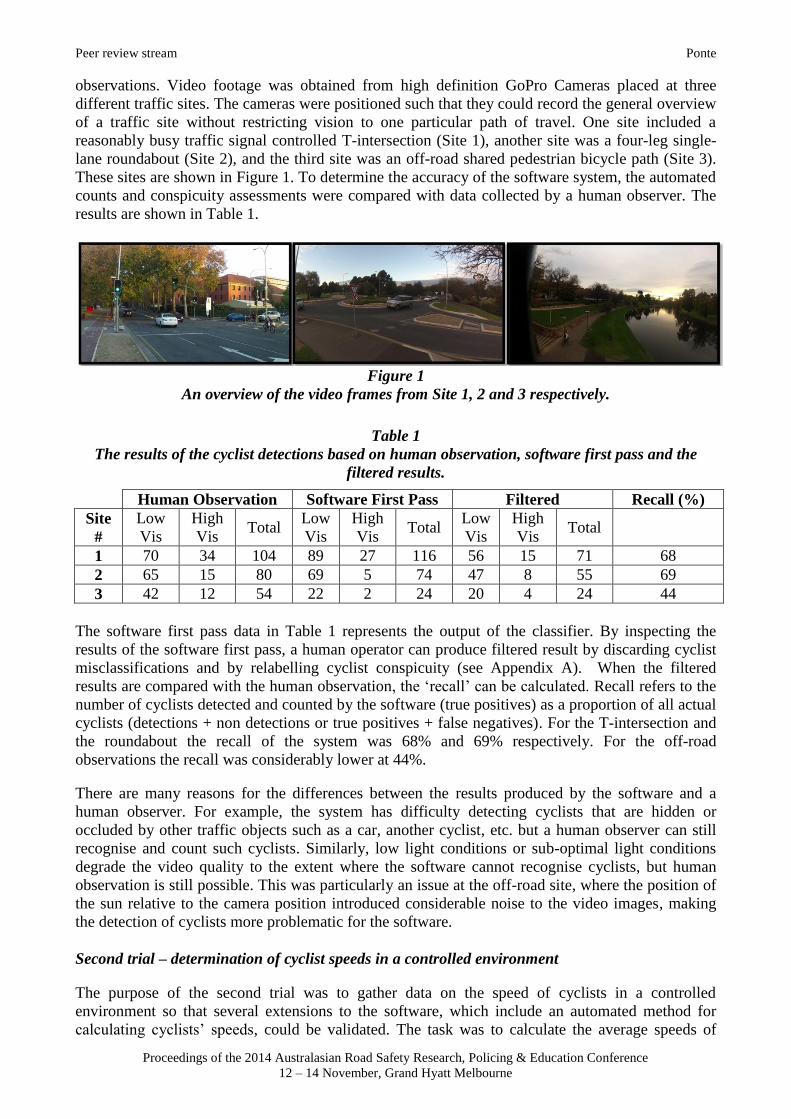
observations. Video footage was obtained from high definition GoPro Cameras placed at three
different traffic sites. The cameras were positioned such that they could record the general overview
of a traffic site without restricting vision to one particular path of travel. One site included a
reasonably busy traffic signal controlled T-intersection (Site 1), another site was a four-leg single-
lane roundabout (Site 2), and the third site was an off-road shared pedestrian bicycle path (Site 3).
These sites are shown in Figure 1. To determine the accuracy of the software system, the automated
counts and conspicuity assessments were compared with data collected by a human observer. The
results are shown in Table 1.
Figure 1
An overview of the video frames from Site 1, 2 and 3 respectively.
Table 1
The results of the cyclist detections based on human observation, software first pass and the
filtered results.
Human Observation Software First Pass Filtered Recall (%)
Site
#
Low
Vis
High
Vis Total
Low
Vis
High
Vis Total
Low
Vis
High
Vis Total
1 70 34 104 89 27 116 56 15 71 68
2 65 15 80 69 5 74 47 8 55 69
3 42 12 54 22 2 24 20 4 24 44
The software first pass data in Table 1 represents the output of the classifier. By inspecting the
results of the software first pass, a human operator can produce filtered result by discarding cyclist
misclassifications and by relabelling cyclist conspicuity (see Appendix A). When the filtered
results are compared with the human observation, the ‘recall’ can be calculated. Recall refers to the
number of cyclists detected and counted by the software (true positives) as a proportion of all actual
cyclists (detections + non detections or true positives + false negatives). For the T-intersection and
the roundabout the recall of the system was 68% and 69% respectively. For the off-road
observations the recall was considerably lower at 44%.
There are many reasons for the differences between the results produced by the software and a
human observer. For example, the system has difficulty detecting cyclists that are hidden or
occluded by other traffic objects such as a car, another cyclist, etc. but a human observer can still
recognise and count such cyclists. Similarly, low light conditions or sub-optimal light conditions
degrade the video quality to the extent where the software cannot recognise cyclists, but human
observation is still possible. This was particularly an issue at the off-road site, where the position of
the sun relative to the camera position introduced considerable noise to the video images, making
the detection of cyclists more problematic for the software.
Second trial – determination of cyclist speeds in a controlled environment
The purpose of the second trial was to gather data on the speed of cyclists in a controlled
environment so that several extensions to the software, which include an automated method for
calculating cyclists’ speeds, could be validated. The task was to calculate the average speeds of

Peer review stream Ponte
Proceedings of the 2014 Australasian Road Safety Research, Policing & Education Conference
12 – 14 November, Grand Hyatt Melbourne
detected cyclists between two points on a road surface. A camera was positioned orthogonally to the
movement of cyclists between two measured points on a road surface (6.25 m apart). The software
was configured to analyse a detected cyclist’s frame by frame movement between the two marked
and measured points in the video frame. The frame rate of the video capture was 24 frames per
second. The software determined the frame number at which a marker (the centroid of the detected
cyclist projected onto the ground plane) passed a first point on the road and the corresponding frame
number the marker passed a second point located 6.25 metres in front of the first point. Hence the
speed of the cyclist was calculated as:
𝑆𝑝𝑒𝑒𝑑 𝑜𝑓 𝐶𝑦𝑐𝑙𝑖𝑠𝑡 =𝐷𝑖𝑠𝑡𝑎𝑛𝑐𝑒
𝑇𝑖𝑚𝑒=
6.25 𝑚
(1
24) ∗ [𝐹𝑟𝑎𝑚𝑒 𝑁𝑢𝑚𝑏𝑒𝑟 @ 0𝑚 − 𝐹𝑟𝑎𝑚𝑒 𝑁𝑢𝑚𝑏𝑒𝑟 @ 6.25 𝑚]
To verify the accuracy of the software speed calculation, each cyclist was fitted with a GPS
(collecting data at one second intervals) to monitor the actual speed of the cyclist passing between
the two points. Additionally, human calculations of cyclist speeds by manual video frame analysis
was also undertaken to compare against the software video frame analysis. Of the 52 cyclist speed
measurements taken, the difference between the GPS speed and the speed calculated by the
software was less than 1 km/h in 81% of speed measurements. There was a difference of between 1
and 2 km/h in 15% of cyclist measurements and in 4% of speed measurements the speed difference
exceeded 2 km/h. The results for the human frame analysis were similar; the difference between the
human video speed estimate and the software estimate was less than 1 km/h in 81% of
measurements. There was a difference of between 1 and 2 km/h in 17% of cyclist measurements
and in 2% of the speed measurements the speed difference exceeded 2 km/h. In both the
measurement comparisons the average difference in speed between the software and other
modalities was only 0.3 km/h.
Third trial – evaluation of software’s counting and speed measurement capabilities
The third trial involved testing the counting and speed measurement capabilities of the software in a
real-world setting. An additional comparison was also made with fixed bicycle counting devices
operated by South Australian Department for Planning, Transport and Infrastructure (DPTI).
Several of these counters are located throughout the metropolitan area and are based on induction
loops buried in the road pavement in cycling lanes or paths.
The trial compared the accuracy of the software detection system against human observation as well
as data collected by the DPTI counters. Additionally, the spot speeds of cyclists were measured by a
laser gun and compared to point-to-point speeds determined by the software.
The site selected for the trial was a major arterial road that contained permanent bicycle lanes, six
lanes of traffic and two tram lines in the centre of the road (see Figure 2). The 24 hour DPTI cyclist
counts for the north-bound bicycle lane indicated that a total of 171 cyclists used the bicycle lane on
the trial day with 23% of the total count (39/171) between 16:30 and 17:30 in time bins of 15
minutes. The human observer counted 40 cyclists between 16:35 and 17:35 on the trial day, so for
all intents and purposes accounting for the slight time difference between the data collection, the
DPTI counter and human observations were the same. This is shown in Table 2. The software ‘first
pass’ analysis of the recorded video resulted in 39 detections. The filtered results are obtained by
manually removing non-cyclist detections and correcting mistakes in conspicuity analysis.

Peer review stream Ponte
Proceedings of the 2014 Australasian Road Safety Research, Policing & Education Conference
12 – 14 November, Grand Hyatt Melbourne
Figure 2
Example of the tracking and speed calculation of a cyclist.
Table 2
A comparison of data from DPTI counter, human observation and software.
DPTI
Detector
Human
Observation Software First Pass
Filtered
Recall
(%)
Count Low
Vis
High
Vis Count
Low
Vis
High
Vis Count
Low
Vis
High
Vis Total
93%
39 31 9 40 28 11 39 29 8 37
The filtered results facilitate an assessment of how effective the recall of the system was. Failure of
the system is highlighted through a detection false positives (DFPs) and can refer to one of two
types of false positives that can result in an over count of cyclists. One type of detection false
positive (DFP1) is the result of the system detecting and counting traffic objects that are not cyclists
(e.g., a motorcyclist or pedestrian), and can be attributed to failure of the software’s classification
algorithm. In this trial one pedestrian was misclassified as a cyclist. The second type of detection
false positive (DFP2) occurs when the system double counts the same cyclist, and can be attributed
to a failure of the tracking algorithm. There was one double count of a cyclist in this trial.
An analysis of the results indicates that there were 37 confirmed cyclists correctly detected and
counted by the system. Each genuine cyclist detection is referred to as a ‘detection’ true positive
(DTP). Finally, a detection false negative (DFN) refers to the number of cyclists the system failed to
detect and count. As the actual number of cyclists counted was 40, and there were 37 DTPs, there
were three DFNs. Hence the performance of software compared to the human count is 93%.
In addition to counting cyclists, a human observer also evaluated the conspicuity of all cyclists for
comparison against the software. Table 2 shows that the human observed nine cyclists wearing high
visibility clothing. In contrast, according to the software first pass, the system counted 11 cyclists
wearing high visibility clothing. However, the filtering process revealed that 3 cyclists were
misclassified as being high visibility when in fact they were low visibility. Additionally it was
found that one low visibility cyclist counted was actually a pedestrian DFP mentioned previously.
The filtered conspicuity results are also shown in Table 2.
While recall indicates how effective the system is in detecting cyclists (compared to human
observations), the filtering of the data and comparison to human observations also facilitates the
calculation of the precision of the system in detecting and counting cyclists. The precision of the
Peer review stream Ponte
Proceedings of the 2014 Australasian Road Safety Research, Policing & Education Conference
12 – 14 November, Grand Hyatt Melbourne
software detection system can be determined by the ratio of the number of detection true positives
(DTP) to the sum of the detection true positives (DTP) and detection false positives (DFP), i.e.
𝐷𝑒𝑡𝑒𝑐𝑡𝑖𝑜𝑛 𝑃𝑟𝑒𝑐𝑖𝑠𝑖𝑜𝑛 =𝐷𝑇𝑃
𝐷𝑇𝑃 + 𝐷𝐹𝑃1 + 𝐷𝐹𝑃1.
The software system correctly detected 37 cyclists (37 DTP) and incorrectly detected one pedestrian
as a cyclist (1 DFP1) and counted one cyclist twice (1 DFP2), hence the precision of the detection
module was 95%.
For visibility assessment, the recall and precision of the system in correctly evaluating conspicuity
considers only detections of genuine cyclists (to prevent confounding the performance analysis with
the detection module). Hence, for the purpose of assessing the visibility module, a visibility false
positive (VFP) corresponds to a low-visibility cyclist incorrectly classified as high visibility. A
visibility false negative (VFN) refers to a high visibility cyclist incorrectly classified as low
visibility and a visibility true positive (VTP) corresponds to a cyclist correctly identified as highly
visible by the system. By assessing the ratio of correct high visibility counts (VTPs) to the sum of
the correct high visibility counts (VTPs) and incorrect high visibility counts (VFNs):
𝑉𝑖𝑠𝑖𝑏𝑖𝑙𝑖𝑡𝑦 𝑅𝑒𝑐𝑎𝑙𝑙 | 𝐺𝑒𝑛𝑢𝑖𝑛𝑒 𝐶𝑦𝑐𝑙𝑖𝑠𝑡 =𝑉𝑇𝑃
𝑉𝑇𝑃 + 𝑉𝐹𝑁,
‘visibility recall’ can be interpreted as the probability that a genuine highly visible cyclist is
correctly classified as such by the visibility module. In this trial all eight high visibility cyclists
labelled by the software were indeed highly visible. Since no high visibility cyclists were
incorrectly classified as being low visibility, recall was 100%.
Precision in the context of visibility is the probability that a cyclist classified as high visibility by
the visibility module, was indeed highly visible. Hence precision of the visibility module based only
on genuine cyclists detections can be calculated as the number of visibility true positives (VTP) to
the sum of the visibility true positives (VTP) and visibility false positives (VFP), i.e.
𝑽𝒊𝒔𝒊𝒃𝒊𝒍𝒊𝒕𝒚 𝑷𝒓𝒆𝒄𝒊𝒔𝒊𝒐𝒏 | 𝑮𝒆𝒏𝒖𝒊𝒏𝒆 𝑪𝒚𝒄𝒍𝒊𝒔𝒕 =𝑽𝑻𝑷
𝑽𝑻𝑷 + 𝑽𝑭𝑷.
The visibility module correctly assessed eight cyclists as being highly visible (8 VTP) and
incorrectly assessed three low visibility cyclists as being highly visible (3 VFP). Hence the
precision of the visibility module for the above site was 73%.
Speeds of real world cyclists
At the site discussed above, two lines spaced six metres apart were marked on the road surface and
were visible in the recorded video frame (see Figure 2). The software determined the frame number
when a cyclist marker (the centroid of the detected cyclist projected onto the ground plane) passed
the first marked lane and the corresponding frame number the cyclist marker passed the second
marked line. The average speeds calculated by the software were compared to the spot speeds
measured by a laser gun. Of the 37 genuine cyclists that the software detected it was able to
determine the average speeds of 36 cyclists passing the two lines marked on the road (one speed
measurement failed due to a pedestrian occluding the cyclist in a critical frame). The difference
between the laser gun speed and the software calculated speed of cyclists was less than 1 km/h in
57% of speed measurements.

Peer review stream Ponte
Proceedings of the 2014 Australasian Road Safety Research, Policing & Education Conference
12 – 14 November, Grand Hyatt Melbourne
There was a difference of between 1 and 2 km/h in 22% of measurements and in 22% of speed
measurements the speed difference exceeded 2 km/h; the average difference in speed was 1.5 km/h.
The variation in speed measurement was due to the difficulty in consistently measuring the spot
speed of cyclists within the two demarcated lines. Nevertheless, Figure 3 shows that the speed
distribution of the cyclists based on the two speed measurement methods is similar.
Figure 3
Comparison of cyclist speed distributions based on two methods of speed measurement.
The trial at this location indicates that use of video footage in conjunction with the software is an
inexpensive way of sourcing extremely useful cyclist data. The software system, unlike the
inductive loop counters, is not just limited to providing cyclist counts, but it can provide conspicuity
data, speed data and also image outputs that can be used for further analysis of cyclist gender,
helmet use and bicycle type.
Fourth trial – evaluation of revised version of software
The final trial involved a repeat of the initial feasibility trial, at different sites with an improved
version of the software.
For the fourth trial video footage was obtained as part of a MAC study to update a previous cyclist
conspicuity study by Raftery and Grigo (2013). Video cameras were placed both orthogonally to the
direction of travel of cyclists (for a direct side field of view of cyclists passing one camera) as well
as a frontal above field of view of cyclist. The positioning of the cameras was such that they were
predominantly focused on capturing cyclists on a particular path of travel. The four locations
selected were (1) The west bound bicycle lane on Rundle Rd near Dequetteville Terrace, Adelaide;
(2) The south-west bound bicycle lane on Anzac Highway, Ashford; (3) The north bound traffic
lanes of Peacock Road near South Terrace, Adelaide and (4) a section of the Torrens River Linear
Park shared bicycle/pedestrian path in Adelaide. The video footage was recorded under ideal
lighting conditions and the software was modified so that it only analysed regions designated ‘of
interest’ and not the entire video frame. Appendix B shows the site locations and the areas
designated ‘of interest’.
The detection results are shown in Table 3 for each of the sites. The frontal above field of view was
chosen for the Peacock Rd, Rundle Rd 1 and Torrens Path analysis, whereas the orthogonal field of
view was selected for the Anzac Highway and Rundle Rd 2 footage analysis.
0
2
4
6
8
10
12
14
0 - 5 6 - 10 11 - 15 16 - 20 21 - 25 26 - 30 31 - 35 36 - 40 41 - 45 46 - 50
Co
un
t
Speed Range (km/h)
Laser Spot Speed Software Average Speed
Peer review stream Ponte
Proceedings of the 2014 Australasian Road Safety Research, Policing & Education Conference
12 – 14 November, Grand Hyatt Melbourne
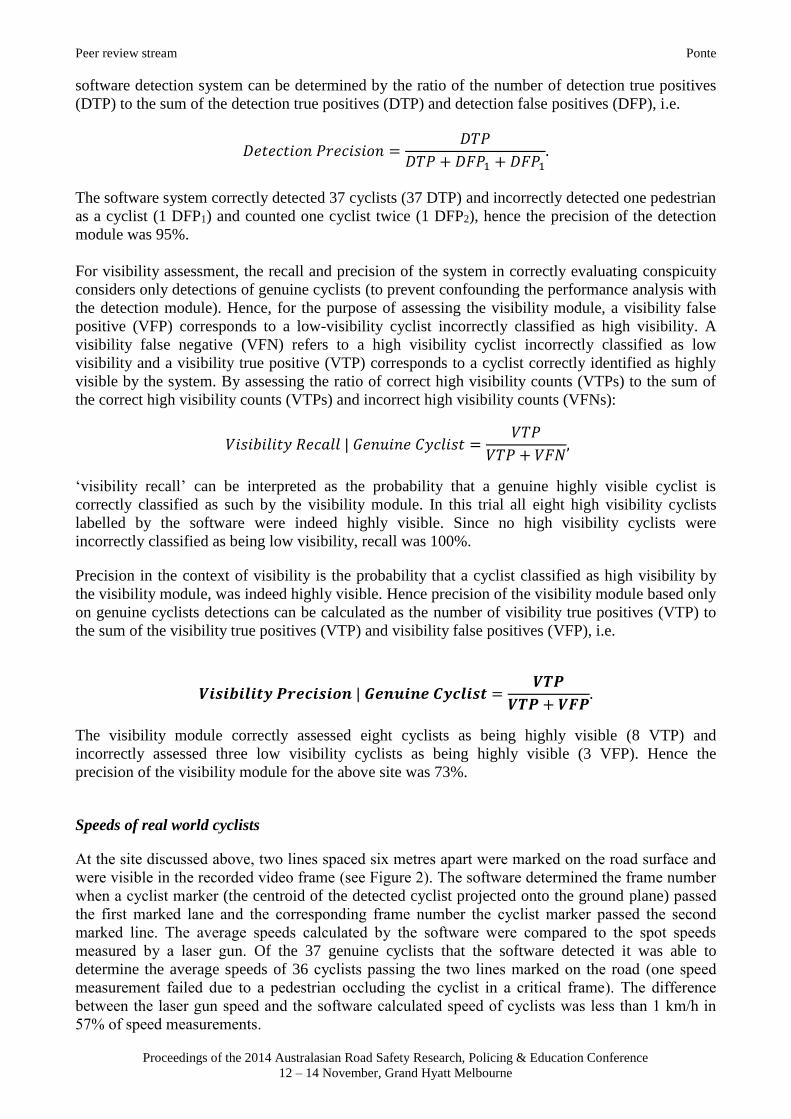
Table 3
A summary of the results from the human counts, initial software analysis and filtering to
determine the performance of the software system.
Sites Count Performance Indicators
Human Software
First Pass DTP DFN DFP1 DFP2 Precision Recall
Anzac Highway 87 137 77 10 55 5 56% 89%
Peacock Rd 185 224 182 3 21 21 81% 98%
Rundle Rd 1 166 216 150 16 54 12 69% 90%
Rundle Rd 2 144 174 143 1 31 0 82% 99%
Torrens Path 51 84 50 1 32 2 60% 98%
Table 3 shows that recall was quite high, varying between 89% – 99%, indicating that the majority
of cyclists are counted. However, the precision of the system varied between 56% – 82%
highlighting that while the software can retrieve a majority of the cyclists in a video analysis, the
current version of the software overestimates the genuine number of cyclists. The performance of
the software visibility module on genuine cyclists was also assessed for each of the sites. It was
found there were considerable issues with discriminating between high/low visibility cyclists on the
Torrens Path. This was due to bright sunlight on an extremely green (grass) background having
similar colour hues to a high visibility cyclist, thus affecting the accuracy of the visibility module—
these results are not presented. However, for the remaining sites, the visibility recall ranged from
71% to 100%, and the precision ranged from 75% to 100%.
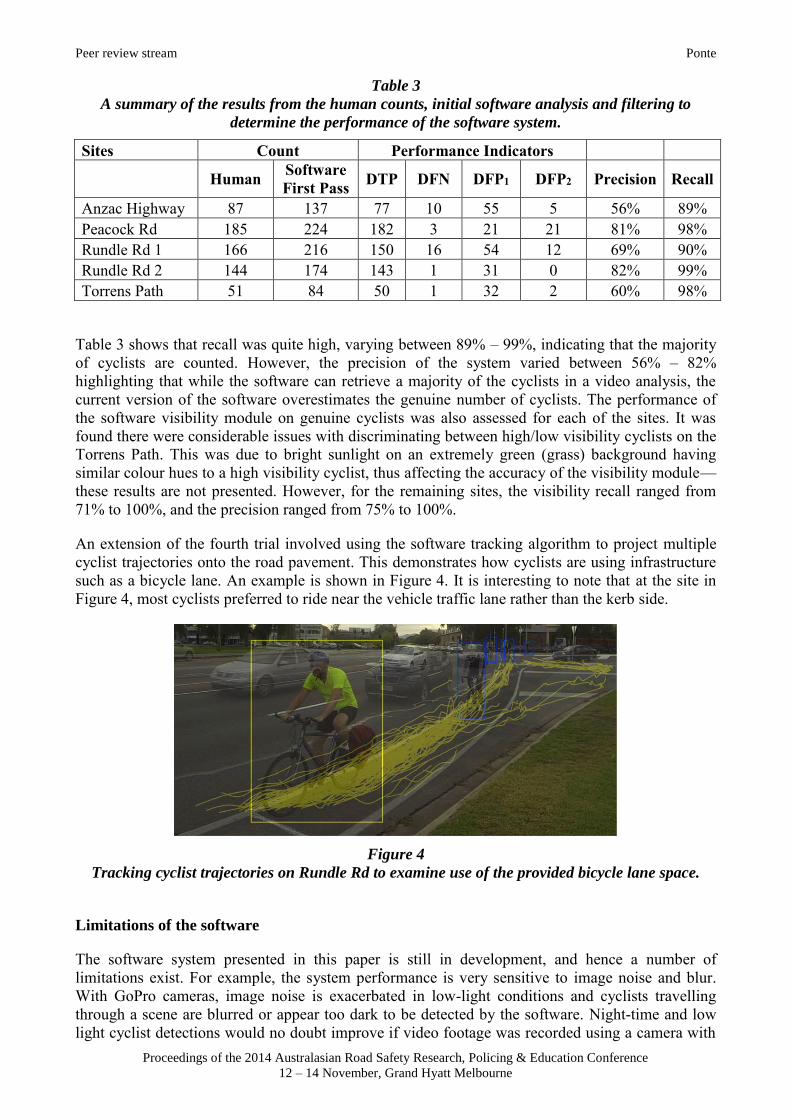
An extension of the fourth trial involved using the software tracking algorithm to project multiple
cyclist trajectories onto the road pavement. This demonstrates how cyclists are using infrastructure
such as a bicycle lane. An example is shown in Figure 4. It is interesting to note that at the site in
Figure 4, most cyclists preferred to ride near the vehicle traffic lane rather than the kerb side.
Figure 4
Tracking cyclist trajectories on Rundle Rd to examine use of the provided bicycle lane space.
Limitations of the software
The software system presented in this paper is still in development, and hence a number of
limitations exist. For example, the system performance is very sensitive to image noise and blur.
With GoPro cameras, image noise is exacerbated in low-light conditions and cyclists travelling
through a scene are blurred or appear too dark to be detected by the software. Night-time and low
light cyclist detections would no doubt improve if video footage was recorded using a camera with
Peer review stream Ponte
Proceedings of the 2014 Australasian Road Safety Research, Policing & Education Conference
12 – 14 November, Grand Hyatt Melbourne
a good quality low-light sensor, a camera with an infra-red sensor or with improved localised
lighting in the area of video capture. It would be necessary to train the classifier for these differing
light conditions. Camera lens glare due to the sun position also adversely affects the number of
cyclist detections. This can be addressed by better positioning of the video camera, use of a lens
hood and polarising filters.
The quality of the recognition accuracy depends on the training data and the vantage point (pose of
cyclists). The training of the classifier was conducted using over 10,000 cyclist image examples
from various camera vantage points and differing cyclist poses as well as over 10,000 random
images that were not cyclists. While the software has shown to retrieve a majority of the cyclists in
a video analysis, the current version of the software overestimates the genuine number of cyclists,
because occasionally the software may classify pedestrians and motorcyclists as cyclists.
Additional training of the detection module using an increased variety of cyclist poses, different
cyclist and bicycle types (for example smaller bicycles, different bicycle type and child cyclists) as
well as cyclists of different conspicuities, would certainly improve the number of genuine cyclists
detected. Training of the software can also be task specific. For example, while the software may
currently classify a dismounted cyclist as a genuine cyclist, this may or may not be a desirable
outcome depending on the task expected of the software. If the purpose is to determine the
compliance rate of cyclist responding to a task to dismount, to be effective, the software would need
to be trained with multiple images of a dismounted cyclist.
In principle, training the software with sufficient examples of a particular characteristic of cyclists,
such as cyclists wearing backpacks or cyclists not wearing helmets, should yield improvements in
recognition rates. However, the vantage point of video capture will always have a critical impact on
performance. For example, suppose the system is tasked with differentiating between cyclists with
and without backpacks. Even if the detection module is trained with multiple images of cyclists
with and without backpacks, the system is likely to fail to recognise cyclists with backpacks if
cyclists are recorded from a frontal perspective, because the backpack will be barely visible. In
general, the system has difficulty detecting cyclists that are hidden or occluded by other traffic
objects, such as cars, other cyclists, pedestrians, and trees.
There are also issues with the visibility module, which is somewhat dependent on any background
colour behind a cyclist. The visibility module analyses a region of interest (that contains the torso of
a cyclist). If there are sufficient image pixels in the area of interest that have colours associated with
high visibility criteria (for example a bright green grassy background), the cyclists may be falsely
classified as highly visible even if they are not. To remedy this, the visibility module would need to
be re-trained to determine the region containing the torso of the cyclist with greater precision.
Ultimately, the recall and precision of the system are dictated by the quality of the input data; that
is, the quantity of training data and the quality of the video recordings analysed by the system.
Discussion, future work and road safety benefits
The current version of the software is an extremely useful tool and sufficiently accurate to serve at
the very least as a convenient cyclist retrieval system from video footage. The feasibility of adding
cyclist conspicuity detection and speed estimates has also been demonstrated. It is conceivable that
variables such as helmet use, bicycle type, gender and trajectories could also be readily added to the
software capabilities.
Future work will focus on increasing the precision of the system, by reducing the false positives due
to misclassification and incorrect tracking. This requires retraining the classifier and implementing
more principled algorithms that utilise contextual information, incorporate plausible motion models

Peer review stream Ponte
Proceedings of the 2014 Australasian Road Safety Research, Policing & Education Conference
12 – 14 November, Grand Hyatt Melbourne
and exploit scene structure. Some promising algorithms that the ACVT intend to explore include
methods based on finding the K-shortest paths in a graph (Berclaz et al., 2011), methods that pose
the tracking problem in the framework of network flows (Zhang et al., 2008) and methods that
attempt to learn how to track from training data (Li and Nevatia, 2009). More work will also be
undertaken to resolve issues regarding bright backgrounds (such as grass) on the performance of the
visibility module, and to extend the detection capabilities of the system to other traffic objects, such
as motorcyclists, pedestrians, passenger vehicles and trucks.
There are considerable opportunities for utilising the current (and extended) version of the software
for road safety applications. The current version of the software has already been tested on CCTV
footage obtained from the Department of Transport, Planning and Infrastructure Traffic
Management Centre and the video quality was sufficient for cyclist detection and tracking. Given
the considerable number of traffic surveillance cameras operating on a 24-hour basis around South
Australia, the potential for monitoring cyclists for exposure purposes alone is already technically
feasible.
The ACVT and CASR are working together to develop additional streams of research that can (1)
shed light on cyclist interactions with road infrastructure; (2) measure uniformity or diversity in
cyclist behaviors, and (3) gather data on infrastructure utilisation and examine questions relating to
compliance (e.g. the number of cyclists going through red signals). Further development of the
software would facilitate the detection and tracking of both cyclists and pedestrians on shared paths,
which would in turn facilitate the examination of speeds, trajectories and potential conflicts on the
shared paths. The software is also being extended to facilitate metric reconstruction of traffic
scenes, which would assist with accurate measurements of passing distances between motor
vehicles and cyclists. This would enable evaluation of motor vehicle-cyclist passing distance
legislation and infrastructure provision.
Ultimately, if the system can be developed to detect and accurately classify any vehicle type and
detect particular traffic incidents, it could be used to examine many hours of video footage at any
number of locations with road safety issues. Video footage recorded near specific road
infrastructure and intersections could be post-processed and analysed to better understand actual
vehicle behaviors compared to intended or expected vehicle behaviors to monitor infrastructure
utilisation. Finally, crashes and near misses captured on video could also be retrieved by the
software and examined by researchers (“a third umpire”) to gain a better an understanding of crash
causation and underlying road safety issues. This would provide yet another useful road safety tool
to assist with the common goal of reducing the number of fatalities and serious injuries on our
roads.
Acknowledgements
The authors would like to acknowledge the support of the Motor Accident Commission and Ross
McColl for initiating and supporting the development of the software. The authors would also like
to thank Y. Li for providing cyclist annotations, Dr. S. Paisitkriangkrai for providing source code
for the classifier and Floriane Boban for assisting with the trials. The Centre for Automotive Safety
Research is supported by both the South Australian Department of Planning, Transport and
Infrastructure and the South Australian Motor Accident Commission. The views expressed in this
report are those of the authors and do not necessarily represent those of the University of Adelaide
or the funding organisations.
References

Peer review stream Ponte
Proceedings of the 2014 Australasian Road Safety Research, Policing & Education Conference
12 – 14 November, Grand Hyatt Melbourne
Berclaz, J., Fleuret, F., Turetken, E. & Fua, P. (2011). Multiple object tracking using K-shortest
paths optimization. IEEE Transactions on Pattern Analysis and Machine Intelligence, 33(9),
1806–1819.
Bishop, C. M. (2006). Pattern Recognition and Machine Learning. Secaucus, NJ, USA : Springer-
Verlag New York, Inc.
Cristani, M., Farenzena, M., Bloisi, D. & Murino, V. (2010). Background subtraction for automated
multisensor surveillance: A comprehensive review. EURASIP Journal on Advances in Signal
Processing, 1, 1–24.
Heikkila, J. & Silven, O. (2004). A real-time system for monitoring of cyclists and pedestrians.
Image and Vision Computing, 22(7), 563–570.
Ismail, K., Sayed, T. & Saunier, N. (2009). Automated pedestrian safety analysis using video data
in the context of scramble phase intersections. Annual Conference and Exhibtion of the
Transporation Association of Canada - Transportation in a Climate of Change, Vancouver,
British Columbia, 20p.
Ismail, K., Sayed, T, Saunier, N. & Lim, C. (2009). Automated analysis of pedestrian–vehicle
conflicts using video data. Transportation Research Record: Journal of the Transportation
Research Board, 2140, 44–54.
Li, Y., Huang, C. & Nevatia, R. (2009) Learning to associate: Hybrid boosted multi-target tracker
for crowded scene. IEEE Conference on Computer Vision and Pattern Recognition, Miami,
Florida, USA, 2953–2960.
Li, J., Hajimirsadeghi, H., Zaki, M. H., Mori, G. & Sayed, T. (2014). Cyclist’s helmet recognition
using computer vision techniques. Transportation Research Board 93rd Annual Meeting,
Washington, D.C, USA, 20p.
Raftery, S. J. & Grigo, J. A. L. (2013). The conspicuity of South Australian cyclists: implications
for safety (CASR113). Adelaide: Centre for Automotive Safety Research.
Malinovski, Y. J., Zheng, J. & Wang, Y. (2009). Model-free video detection and tracking of
pedestrians and bicyclists. Computer-Aided Civil and Infrastructure Engineering, 24(3), 157–
168.
Mayo, Z. & Tapamo, J. R. (2009). Background subtraction survey for highway surveillance.
Proceedings of the Twentieth Annual Symposium of the Pattern Recognition Association of
South Africa, Stellenbosch, South Africa, 77–82.
Motor Accident Commission (2014). Aware and prepared, be safe, be seen. Retrieved July 2014
from http://www.mac.sa.gov.au/besafebeseen/be-aware/
Paisitkriangkrai, S., Shen, C. & Zhang, J. (2008). Fast pedestrian detection using a cascade of
boosted covariance features. IEEE Transactions on Circuits and Systems for Video
Technology, 18(8), 1140–1151.
Shen, C., Wang, P., Paisitkriangkrai, S. & van den Hengel, A. (2013). Training effective node
classifiers for cascade classification. International Journal of Computer Vision, 103(3), 326–
347.
Saunier, N. & Sayed, T. (2006). A feature-based tracking algorithm for vehicles in intersections.
IEE Proceedings of the 3rd Canadian Conference on Computer and Robot Vision, Quebec
City, Canada, 59–65.
Saunier, N. & Sayed, T. (2008). Automated analysis of road safety with video data. Transportation
Research Record: Journal of the Transportation Research Board, 2019, 57–64.

Peer review stream Ponte
Proceedings of the 2014 Australasian Road Safety Research, Policing & Education Conference
12 – 14 November, Grand Hyatt Melbourne
Unzueta, L., Nieto, M., Cortes, A., Barandiaran, J., Otaegui, O. & Sanchez, P. (2012). Adaptive
multicue background subtraction for robust vehicle counting and classification. IEEE
Transactions on Intelligent Transportation Systems, 13(2), 527–540.
Valera, M. & Velastin, S. A. (2005). Intelligent distributed surveillance systems: a review. IEE
Proceedings - Vision, Image and Signal Processing, 152(2), 192–204.
Zhang, L., Li, Y. & Nevatia, R. (2008). Global data association for multi-object tracking using
network flows. IEEE Conference on Computer Vision and Pattern Recognition, Anchorage,
USA, 1–8.

Peer review stream Ponte
Proceedings of the 2014 Australasian Road Safety Research, Policing & Education Conference
12 – 14 November, Grand Hyatt Melbourne
Appendix A – Result output for Site 1, Trial 1

Peer review stream Ponte
Proceedings of the 2014 Australasian Road Safety Research, Policing & Education Conference
12 – 14 November, Grand Hyatt Melbourne
Appendix B - Site locations and the areas designated ‘of interest’ for Trial 4.