Embed Size (px)
Citation preview
gareth.jones Section name
© Department of Economics, University of Reading 2016
Using Social Media to Identify Market Inefficiencies: Evidence from Twitter and Betfair
by Alasdair Brown, Dooruj Rambaccussing,
J. James Reade and Giambattista Rossi
Department of Economics Economic Analysis Research Group (EARG)
Discussion Paper No. 2016-118 Department of Economics University of Reading Whiteknights Reading RG6 6AA United Kingdom www.reading.ac.uk

Using Social Media to Identify Market Inefficiencies:
Evidence from Twitter and Betfair ∗
Alasdair Brown†
University of East Anglia
Dooruj Rambaccussing‡
University of Dundee
James J. Reade§
University of Reading
Institute for New Economic Thinking, Oxford
Giambattista Rossi¶
Birkbeck, University of London
January 6, 2016
∗Alasdair Brown acknowledges financial support from the British Academy and the Leverhulme Trust (Ref:
SG140097), James Reade thanks the Open Society Foundations (OSF) and Oxford Martin School (OMS) for
financial support, and Dooruj Rambaccussing, James Reade and Giambattista Rossi acknowledge support
from Twitter through their #DataGrants scheme. The research presented in this paper was carried out on
the High Performance Computing Cluster supported by the Research and Specialist Computing Support
service at the University of East Anglia. The usual disclaimer applies.†Corresponding Author. School of Economics, University of East Anglia, Norwich NR4 7TJ, U.K. Email:
[email protected]‡Economic Studies, University of Dundee, Dundee DD1 4HN, UK. E-mail: [email protected]§School of Economics, University of Reading, Reading RG6 6AA, UK. E-mail: [email protected]¶Department of Management, Birkbeck College, University of London, Malet Street, Bloomsbury London
WC1E 7HX, U.K. Email: [email protected]
1

Using Social Media to Identify Market Inefficiencies
Abstract
Information extracted from social media has been used by academics, and increas-
ingly by practitioners, to predict stock returns. But to what extent does social media
output predict asset fundamentals, and not simply short-term returns? In this paper we
analyse 13.8m posts on Twitter, and high-frequency betting data from Betfair, concern-
ing English Premier League soccer matches in 2013/14. Crucially, asset fundamentals
are revealed at the end of play. We find that the tweets of certain journalists, and the
tone of all tweets, contain fundamental information not revealed in betting prices. In
particular, tweets aid in the interpretation of news during matches.
JEL Classification: G14, G17
Keywords: social media, prediction markets, fundamentals, sentiment, mispricing
1 Introduction
There is growing evidence that traditional media content can have a distortionary impact
on stock prices. In a seminal paper, Tetlock (2007) finds that pessimism in a widely-read
newspaper column — the Wall Street Journal’s Abreast of the Market — predicts nega-
tive returns in the following days, followed by a subsequent recovery in asset prices. This
indicates that traditional media, far from reducing mispricing by informing readers of new
information, creates noise and (temporarily) drives prices further from fundamentals. Even
stale information, already reported in the preceding week’s newspapers, leads to temporary
stock price movements (Tetlock, 2011).
But what about social media, such as Twitter? Can information extracted from platforms
of this type be useful for predicting, or identifying, mispricing of speculative assets? Or
are the majority of opinions on social media based on sentiment, and unrelated to asset
fundamentals?
It is possible that social media — by drawing on the wisdom of a larger crowd — may
be quicker to reveal new information, or better at interpreting stale information. The retail
orders of small individual investors predict returns (e.g. Kelley and Tetlock, 2013), so why
not the opinions of similar individuals on social media? However, there is also scope for social
1
Using Social Media to Identify Market Inefficiencies
media to emit similar noise or sentiment as that produced by traditional media or, worse,
be involved in the rapid spread of misinformation. A hoax tweet on the Associated Press
twitter feed in 2013, misreporting an explosion at the White House in Washington, briefly
wiped $136 billion off the S&P 500 Index.1 So is social media a hive for misinformation
and sentiment, or a useful tool for the prediction and identification of mispricing in asset
markets?
Chen et al. (2014), Sprenger et al. (2014), and Avery et al. (2015) find that opinions
on three different social media sites — Seeking Alpha, Twitter, and CAPS respectively —
predict subsequent cross-sectional stock returns, and, in the case of Seeking Alpha, posts
also predict earnings announcement surprises. Zhang et al. (2011) find that Twitter content
can even predict returns at the aggregate index level. The problem with such analysis,
however, and indeed the problem with the aforementioned analyses of traditional media,
is that returns are only a proxy for fundamental information, and any effect is inevitably
sensitive to the time-horizon chosen. The ability of social media to predict returns may be
solely due to its capture of short-run sentiment, and not due to fundamentals. Furthermore,
if market participants believe that social media can be mined for asset-relevant information,
then the belief becomes self-fulfilling, as their buying and selling pressure drives asset prices
and returns. To illustrate this point, there are plans to market an Exchange Traded Fund
(ETF) which algorithmically picks stocks on the basis of Twitter sentiment.2 Even earnings
announcements — which may be less vulnerable to such endogeneity issues — are still only
a noisy, and, to a degree, manipulable, measure of asset fundamentals.
So what can social media content tell us about fundamentals? Can tweets, to take one
social media output, inform us of whether an asset is mispriced? In this paper we answer
these questions by analysing Twitter posts and Betfair betting prices for a season of English
Premier League soccer matches in 2013 and 2014. Crucially, at the end of the each match,
fundamentals are revealed as teams either win, and the bet pays out, or they lose (or draw),1‘A Fake AP Tweet Sinks the Dow for an Instant’, Bloomberg, April 23rd 2013. Van Bommel (2003)
models the incentives for the spread of such misinformation. Rumourmongers can profit twice from such
activities: once before spreading the rumour, and once before the price correction after the rumour is proved
false.2‘Hey Finance Twitter, You Are About to Become an ETF’, Bloomberg, October 15th 2015.
2
Using Social Media to Identify Market Inefficiencies
and the bet does not pay out. We can therefore analyse whether tweets predict asset fun-
damentals, rather than just short-term returns. Furthermore, we can examine whether any
effect is concentrated just prior to information events (goals, red cards etc.), or just after-
wards when the implications of information must be deciphered. In our study, we identify the
match that a tweet refers to, and indeed the team that the tweet focuses on, by the hashtag
used (e.g. for Manchester United Football Club, one hashtag used is #mufc). This harvest
of Twitter data yields 13.8 million tweets during 380 matches, an average of 5.2 tweets per
second, during the 2013/14 season.
We find that aggregate tweeting does indeed predict fundamentals but, surprisingly, this
effect is concentrated in the aftermath of events (e.g. goals, red cards). Rather than breaking
news faster than the betting market, activity on social media aids in the interpretation of
information. To be specific, pronounced social media activity for a given team in a given
match, after a goal has been scored (or indeed conceded), implies that that team is more likely
to win than contemporaneous betting market prices suggest. We also find that the predictive
power of social media activity is concentrated amongst a subset of tweeters: the tweets of
British Broadcasting Corporation (BBC) journalists, in particular, are highly predictive of
a team’s fundamental probability of winning, and not just after a significant match event
has occurred. Finally, we find that instances of positive tweeting (measured using the micro-
blogging dictionary of Neilsen, 2011) — for a given team in a given second — also strongly
suggest that the team in question is more likely to win than betting market prices imply.
(We label our measure of tweet content the ‘tone’ of the tweet, as the label ‘sentiment’ is
more often than not used to capture non-fundamental information, e.g. as in Edmans et al.,
2007). In short, aggregate information taken from Twitter is not noise, and does not purely
reveal asset-irrelevant sentiment, but is actually a useful indicator of asset fundamentals, and
can therefore aid in the identification of price inefficiencies.
What are the returns to a strategy that exploits social media information? This will
give us a rough idea of the magnitude of fundamental information that is embedded in social
media content, but not in asset prices. To calculate returns, we first need an an implementable
strategy, which requires us to take two factors into account. Firstly, as evaluated in Brown
and Yang (2015), Betfair operate a speed bump which creates a 5-9 second delay between the
3
Using Social Media to Identify Market Inefficiencies
time at which an order is submitted and the time it is logged on the exchange. (This is to
ensure that bettors in the stadia cannot adversely-select bettors at home watching the match
with a delay). Secondly, we need to allow time for a hypothetical arbitrageur to execute
their trade; this means scraping the information from Twitter, calculating the tone of the
tweets (if applicable), and then placing an automated trade on Betfair. Once we account
for these two factors, we find that a simple strategy of betting when the BBC have tweeted
about a team yields average returns of 2.56% from 1,615 bets, and a strategy of betting when
aggregate tone for that team is positive yields average returns of 2.28% from 903,821 bets.
These returns — for an investment duration of no more than 90 minutes each — compare
very favourably with average returns for all bets of -5.41%, and indicate that the marginal
information contained in social media data is substantial.
Our results are particularly striking given the evidence in the literature that betting
markets — in certain contexts labelled ‘prediction markets’ — are exceptional tools for
forecasting events (Wolfers and Zitzewitz, 2004). Prediction markets have been found to
outperform tipsters in the context of sports (Spann and Skiera, 2009), and outperform polls
and experts in the context of political races (Vaughan Williams and Reade, 2015). Prediction
markets have even performed well when illiquid, as was the case in the corporate prediction
markets studied by Cowgill and Zitzewitz (2015), and have also performed well when attempts
have been made to manipulate prices, as was the case in the 19th-20th Century presidential
betting markets studied by Rhode and Strumpf (2004). So why is it that an aggregation
of Twitter views and tone can add information to that produced by the betting market we
study? One possibility is that while an individual expert or tipster may not, on their own,
have information to add to betting prices — otherwise you might think that they would
bet rather than tip — the collective wisdom of social media crowds can, when collated and
sensibly aggregated, provide information not already in asset prices. In that sense our results
would seem to provide evidence for the ‘wisdom of crowds’ (Surowiecki, 2005).
Betting markets have often been used to study questions of market efficiency (see Ali,
1977, Vaughan Williams and Paton, 1997, Synder, 1978, Snowberg and Wolfers, 2010, and
Brown and Yang, 2014, among many others). One reason, as alluded to earlier, is that the
revelation of fundamentals at the end of play avoids the joint hypothesis problem of testing a
4
Using Social Media to Identify Market Inefficiencies
model and the market’s efficiency according to that model (Fama, 1970). Another reason why
betting markets have proved appealing is that information events occur frequently and can
be accurately time-stamped (Croxson and Reade, 2014). In this paper we take advantage
of both factors. Fundamentals are revealed at the end of play, and we test whether the
extent to which social media can predict these fundamentals is most pronounced just before
the carefully time-stamped events in our sample, when news is breaking, or just after, when
information must be processed and incorporated into prices by betting market participants.
Betfair, the betting market studied in our paper, is the largest exchange of its type in
the world. Bets on the matches in our sample were worth a total of 666 million GBP.
This only includes the money wagered during matches; a substantial amount is also wagered
prior to play. We combine this market data with tweets from the world’s largest micro-
blogging platform, Twitter. Sports, and soccer in particular, are amongst the most tweeted
about events on this platform. The FIFA World Cup — which followed the football season
we analyse — was the most tweeted about event in the platform’s history.3 We are not
the first to compare data from these two platforms. Vaughan Williams and Reade (2014)
also combined Betfair and Twitter data in order to examine whether breaking news reached
betting market prices or tweets first. Their focus was the ‘bigotgate’ incident in 2010, when
the then U.K. Prime Minister Gordon Brown was caught off-camera insulting a prospective
voter. News of that incident broke on Twitter first, and it was a number of hours before the
news was incorporated into betting market prices. In our study we have many more events,
both in terms of goals/red cards, but also in terms of match outcomes. This allows us to
analyse, in a way not feasible for earlier studies, whether social media data has predictive
power over and above that produced by betting market prices and, in turn, whether social
media data can be put to work in the identification of asset price inefficiencies.
The rest of the paper is structured as follows. In Section 2 we introduce the Twitter and
Betfair data, and in Section 3 we conduct our analysis. Section 4 concludes.3‘Twitter in 2014: One Direction and World Cup top list of most tweeted about subjects’, The Mirror,
December 10th 2014.
5
Using Social Media to Identify Market Inefficiencies
2 Data: Twitter and Betfair
The tweets for our analysis were provided by Twitter, through their subsidiary Gnip. Gnip
provide both real-time access to tweets, and also historical sweeps based on hashtags and
tweeter ids. We obtained tweets for every English Premier League soccer match in the
2013/14 season. Many different hashtags are used for each team. For example, for Liverpool
Football Club, the hashtags include #lfc and #ynwa (where ynwa stands for You Never
Walk Alone). In addition to sourcing according to hashtags, we also obtained tweets, and
apportioned them to a team, based on the tag of well-known twitter accounts. In the case
of Liverpool again, these include @thisisanfield, @liverpoolfc and others. Tweets on soccer
teams can occur throughout the week, but we focus on tweets that occur as the team in
question is playing. There are some examples where more than one team is tagged in a
particular tweet. For example, when Liverpool play Chelsea Football Club you may observe
a hashtag #lfcvcfc. These tweets are dropped from our analysis as it is unclear which team
the tweet is focused upon. Our sweep of historical tweets includes original tweets, and the
retweeting (sharing) of an original tweet. Including retweets, we have 13.8 million tweets in
our sample.
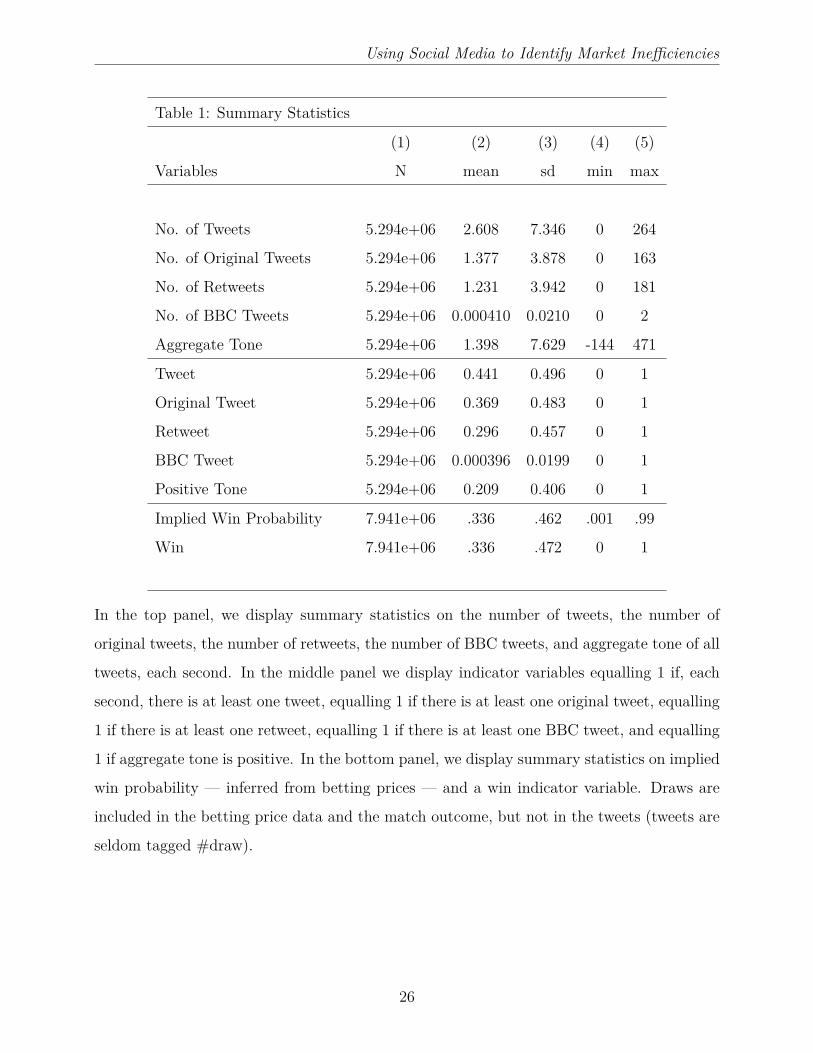
Table 1 provides summary statistics on the number of tweets per second. This is measured
at the team-second level, so there are two observations, one for each team, each second. On
average a team receives 2.6 tweets per second. This distribution is highly positively skewed,
with one instance of a team receiving 264 tweets in a given second. Of these a slight majority
are original, with an average number of original tweets of 1.37 per team per second. (Retweets
come in at an average of 1.23 per team per second). In the middle panel of Table 1 we also
summarize an indicator variable, equalling 1 if there was at least one tweet for that team in
that second, and 0 otherwise. A look at this indicator variable tells us that teams receive at
least one tweet 44.1% of the time. A team receives an original tweet 36.9% of the time, and
a retweet 29.6% of the time. It is important to note that we only consider the inplay period
(as matches are being played), so attention on these teams at that time is typically quite
high. Having said that, the statistics we describe encompass all teams in the 380 matches
in our sample, not simply the matches that are televised. Some matches, of course, receive
6
Using Social Media to Identify Market Inefficiencies
much more attention from social media than others.
Although we are interested in the opinions of all Twitter users, there will be undoubtedly
be variation in the ability of different users to predict fundamentals. A natural subset of users
to focus upon are professional journalists from the British Broadcasting Corporation (BBC).
The BBC has both a national division, that will send journalists to the largest matches, but
also regional divisions which will cover the majority of matches. Moreover, these individuals
are easily identifiable from the BBC suffix in their twitter names. We identified 148 distinct
BBC twitter accounts, and cross-checked their identities online. In Table 1 we summarise
the actions of these BBC tweeters. There is seldom more than one BBC tweet per team per
second. Only in 0.03% of team-second observations is at least one BBC tweet observed, so
while these tweets might contain important information on fundamentals (by breaking news
of goals etc.), they are relatively infrequent.
Although we assume that tweeting about a particular team is a positive signal about a
team’s prospects, this depends, of course, on the content of the tweet. Tweeters may be using
the tweet to voice their dissatisfaction with the team’s performance, and predict that they
will lose the match. Therefore, we cannot argue that a tweet — tagged to a team with their
hashtag — is equivalent to a buy signal on a stock message board. With this in mind, we use
the Neilsen (2011) dictionary for micro-blog content to establish the tone for each team each
second. As mentioned in the Introduction, we label our resultant measure of tweet content
the ‘tone’ of a tweet, as one alternative label, ‘sentiment’, often implies that the information
is unrelated to fundamentals. It is precisely these fundamentals that we want to capture.
Within the Neilsen dictionary, the majority of positive and negative words receive a score of
2 and -2 respectively. The dictionary also captures obscenities, allowing for scores of -4 or -5.
In Table 1 we present summary statistics on this tone measure. We calculate the aggregate
tone for each team in each second; this is the sum across all tweets (which is itself the sum
of all words within the tweet). As captured in the top panel of Table 1, aggregate tone
is, on average, positive. There is, however, great variation across teams and across time.
Aggregate tone ranges from -144 to +471. We also create an indicator variable, equalling
1 if aggregate tone is positive and 0 otherwise. From here we can see that 20.9% of team-
second observations have positive tone. Note, however, that there are only tweets in 44.1%
7
Using Social Media to Identify Market Inefficiencies
of team-second observations, so tone is positive in approximately 46.5% of cases when there
are tweets. Conditional on there being at least one tweet, aggregate tone is negative in 18%
of cases and is neutral (i.e. aggregate tone=0) in 35.5% of cases. This variation justifies our
reluctance to state that a tweet tagged to a given team is an unambiguously positive signal
about the team’s prospects.
Perhaps the best way to describe this dictionary is to give a few examples. In April
2014, Liverpool played Chelsea in an important match for Liverpool’s hopes of winning the
Championship. At 0-0 in the first half, the Liverpool captain Steven Gerrard slipped, allowing
the Chelsea forward Demba Ba to run through and score. The reaction on Twitter ranged
from positive for Chelsea:
Hahahahahaha yes demba ! Chin up liverpool #CFC
This received a score of +1 in the Neilsen dictionary. Others focused more negatively on
the outcome for Liverpool:
WTF #YNWA
This tweet produces a tone score of -4, but is topped by the obscenities (censored in this
paper but not on Twitter) in the next negative tweet which gets a tone score of -9:
F*** u Steve u c*** #lfc
Like any dictionary, there will be instances when the meaning of the tweet is not accurately
captured. For example, the dictionary does not detect the sarcasm in the following tweet:
Captain fantastic and all that... #LFC
This last tweet got a score of +4.
The dictionary provided by Neilsen (2011) is appealing for our research setting, as it is
primarily intended to classify micro-blog output. This means that it captures colloquialisms,
such as ‘WTF’, and obscenities, which are often used in online soccer discussions. We do,
however, recognise the problems that may arise when using a general dictionary in a specific
context. As Loughran and McDonald (2011) illustrated in their study of financial text,
8
Using Social Media to Identify Market Inefficiencies
words can have very different connotations in different settings. (One example of theirs was
that the term ‘liability’ is negative in the majority of contexts, but less so in a financial
context). An alternative is to devise our own dictionary specific for Twitter conversations on
soccer. Our concern with this approach is that this inserts the researcher more closely into
the data-generating process, and perhaps our classifications would subconsciously be biased
in the direction of our prior hypotheses. Another point we can make is that, in this type
of research, the success of a dictionary in capturing tone is, in part, revealed by the extent
to which this tone tells us something that asset prices do not. As we will see in our later
analysis, the dictionary of Neilsen is quite an accurate predictor of market inefficiencies.
We marry our social media data with betting price data from Betfair, a U.K. betting
exchange. The exchange operates as a standard limit order book of the type used by most
financial exchanges. Bettors can place limit orders, which act as quotes for other bettors, or
place market orders, which execute at prices currently quoted by others. Bettors can wager
that a particular team will win (via a ‘back’ bet), or bet that a team will lose (via a ‘lay’ bet).
We obtained Betfair limit order book data from Fracsoft, a third-party provider of historical
data. This data include the best back and lay quotes (and associated volumes), measured
each second, throughout 372 matches in the 2013/14 season. 8 matches are missing from the
Fracsoft database, so we discard the Twitter data on these.
Our main measure from the betting data is the implied win probability. This is defined as
(1/Bt + 1/Lt)/2, where Bt are the best back quotes at time t, and Lt are the best lay quotes
at time t. This is the midpoint of the back-lay (bid-ask) spread. We use this measure because
we want to see whether tweets can add information to that produced by the betting market.
To be specific, we are asking, does the presence of a tweet for a team indicate that the team
is more likely to win than betting market prices imply? For our implied win probability
measure we have 7.94 million observations (rather than 5.29 million), as data on the draw
outcome in a match are included. The average implied win probability is 0.336, with a range
from 0.01 to 0.99. If a team is certain to win or lose, there will be no quotes. Within the
372 matches in the Fracsoft database there are a few missing bets, which explains why the
average implied win probability is 0.336 rather than 0.333. In Table 1 we also summarise an
indicator variable equalling 1 if the team ultimately won. This also averages 0.336, so our
9
Using Social Media to Identify Market Inefficiencies
implied win probability measure appears to be, even with the missing outcomes, an unbiased
measure of actual win probability. For our later analysis, we discard the draw data as tweets
are seldom tagged #draw. Excluding the draw, we have 5.29 million order book observations,
and quotes in 4.44 million cases.
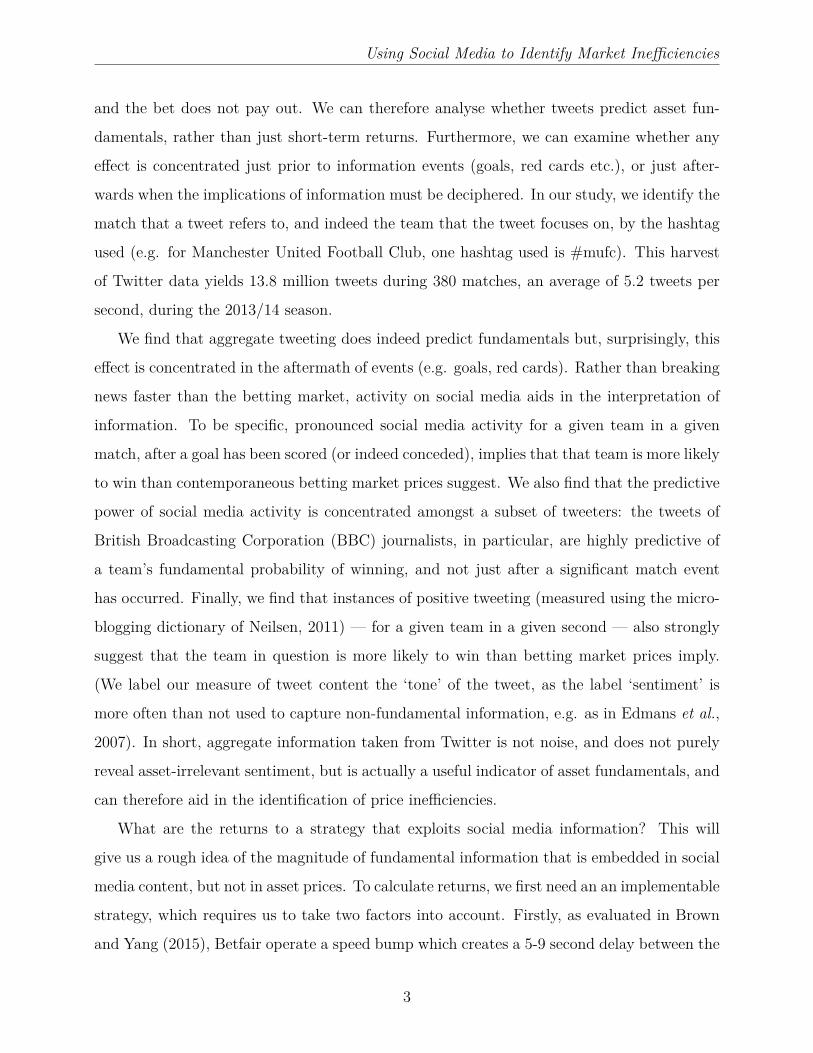
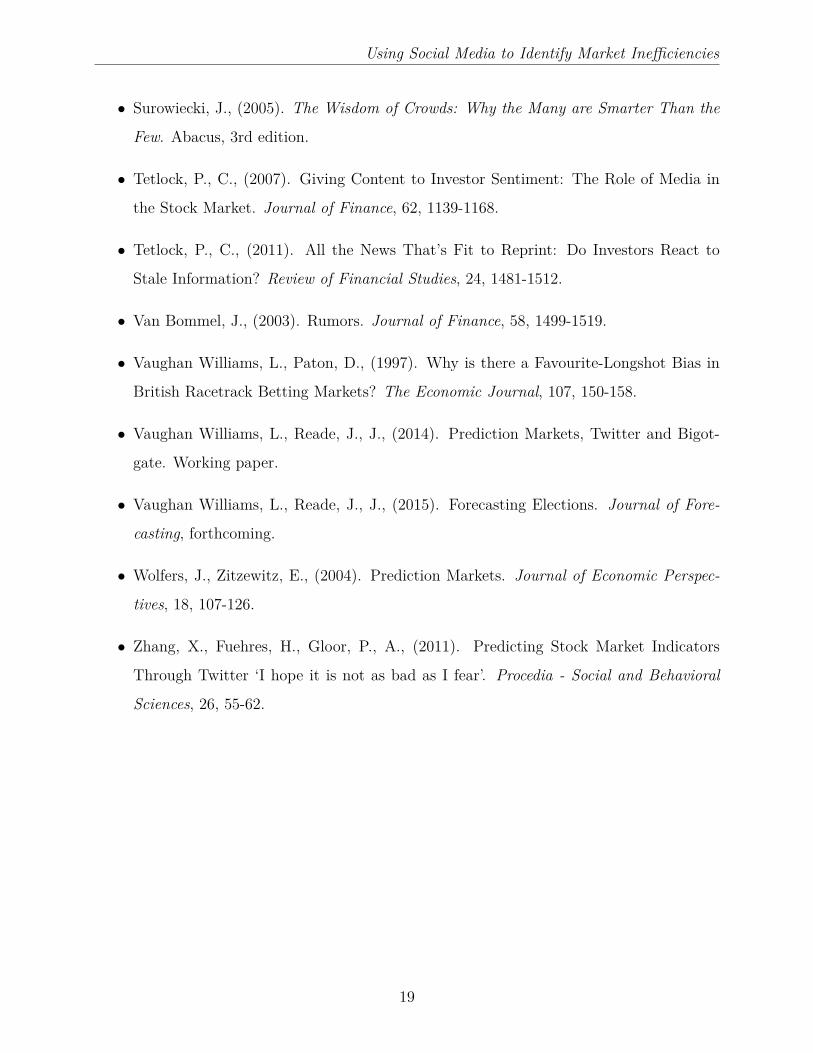
To illustrate the Twitter and Betfair data together, we created Figure 1, which describes
the aforementioned match between Liverpool and Chelsea in April 2014. In the left panel we
have betting prices and the number of tweets for Liverpool each minute of the match. In the
right panel we have the same information for Chelsea. (We will examine prices and tweets
each second in our later analysis, but that level of granularity is too detailed for a plot).
The Gerrard slip, and Demba Ba goal, occurred in the 48th minute (in stoppage time at the
end of the first half). There is little indication from the number of tweets that this goal was
anticipated, but it did set off a spike in tweets for both teams (albeit more for the scoring
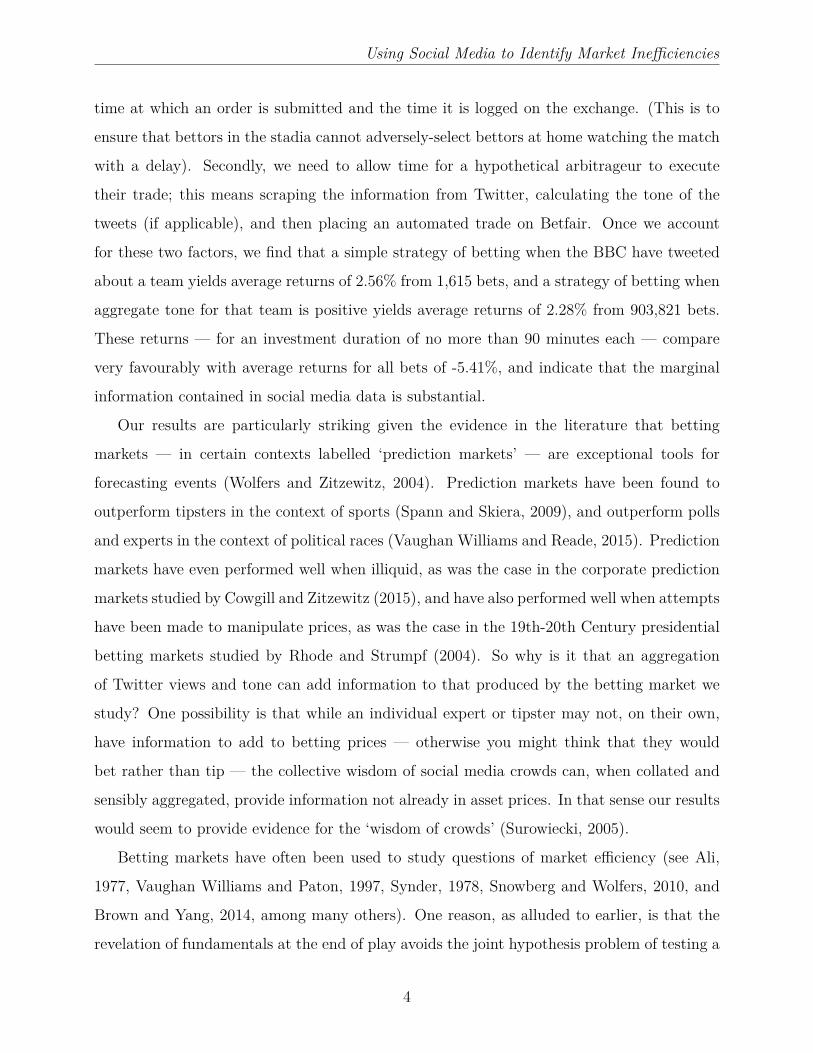
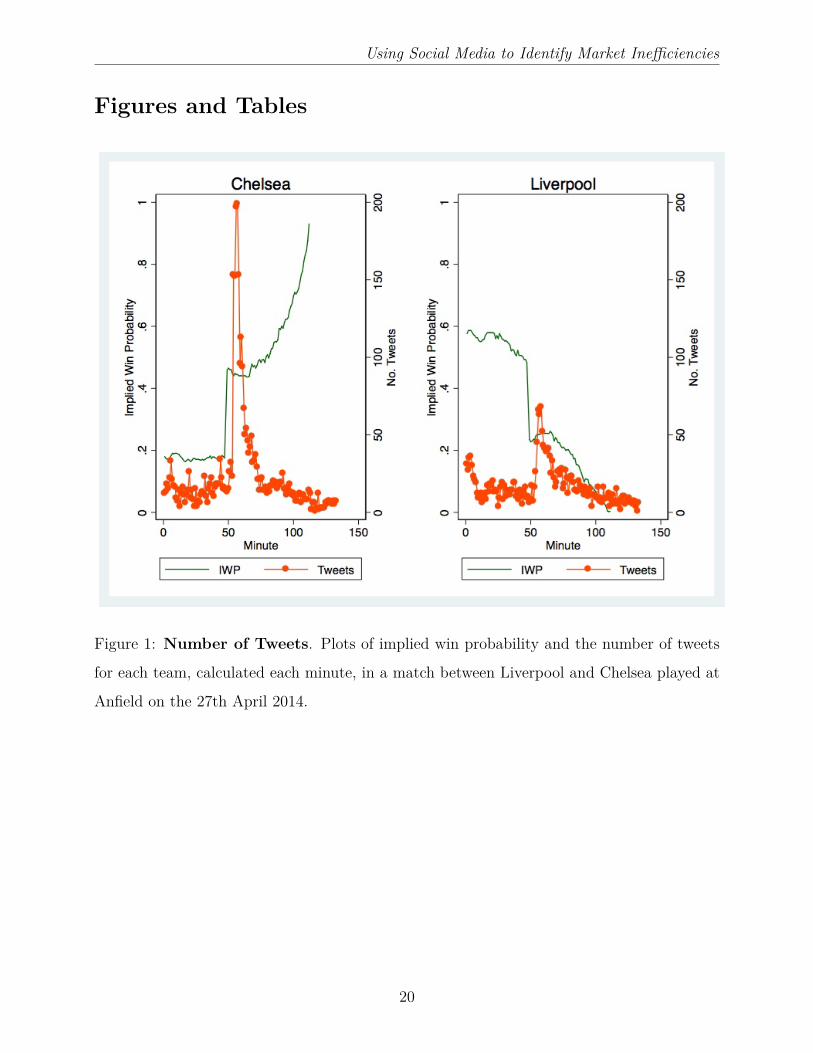
team Chelsea). Similarly, when we plot aggregate tone, instead of the number of tweets, in
Figure 2, we find a similar pattern. Aggregate tone did not appear to predict the goal, but
tone certainly spiked for the scoring team Chelsea, who went on to win the match. There
was a more modest uptick in tone, some of it perhaps defiant, for Liverpool, the team that
conceded. In the next section, we will exploit the full granularity of the data to establish
whether this pattern applies across the full set of goals and matches.
3 Analysis
Throughout the analysis section we predominantly estimate an equation of the following
form:
yi = β0 + β1xit + β2zit + εit (1)
yi is an indicator variable, equalling 1 if team i won the match, xit is the implied win
probability of team i winning as measured from the odds at time t, zit is an indicator variable
capturing some element of Twitter behaviour for team i at time t, and εit is an error term.
This equation, minus the zit term, is common in the estimation of the favourite-longshot bias
(see Vaughan Williams and Reade, 2015, for example).
10
Using Social Media to Identify Market Inefficiencies
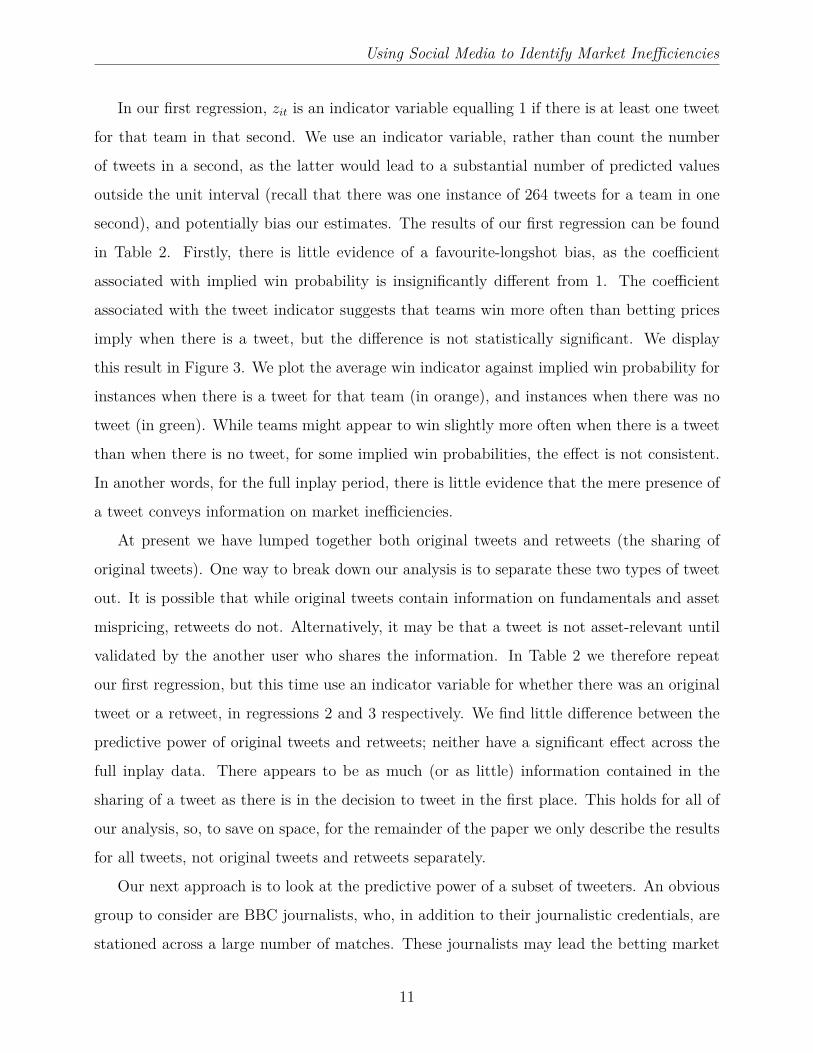
In our first regression, zit is an indicator variable equalling 1 if there is at least one tweet
for that team in that second. We use an indicator variable, rather than count the number
of tweets in a second, as the latter would lead to a substantial number of predicted values
outside the unit interval (recall that there was one instance of 264 tweets for a team in one
second), and potentially bias our estimates. The results of our first regression can be found
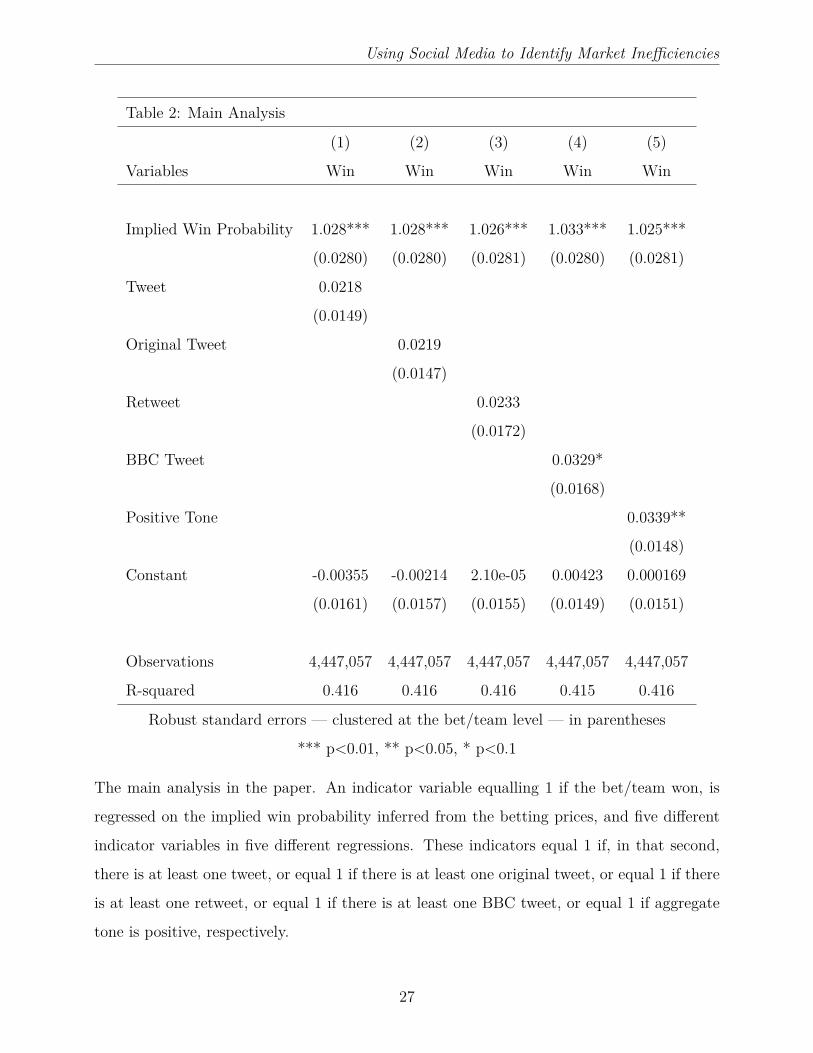
in Table 2. Firstly, there is little evidence of a favourite-longshot bias, as the coefficient
associated with implied win probability is insignificantly different from 1. The coefficient
associated with the tweet indicator suggests that teams win more often than betting prices
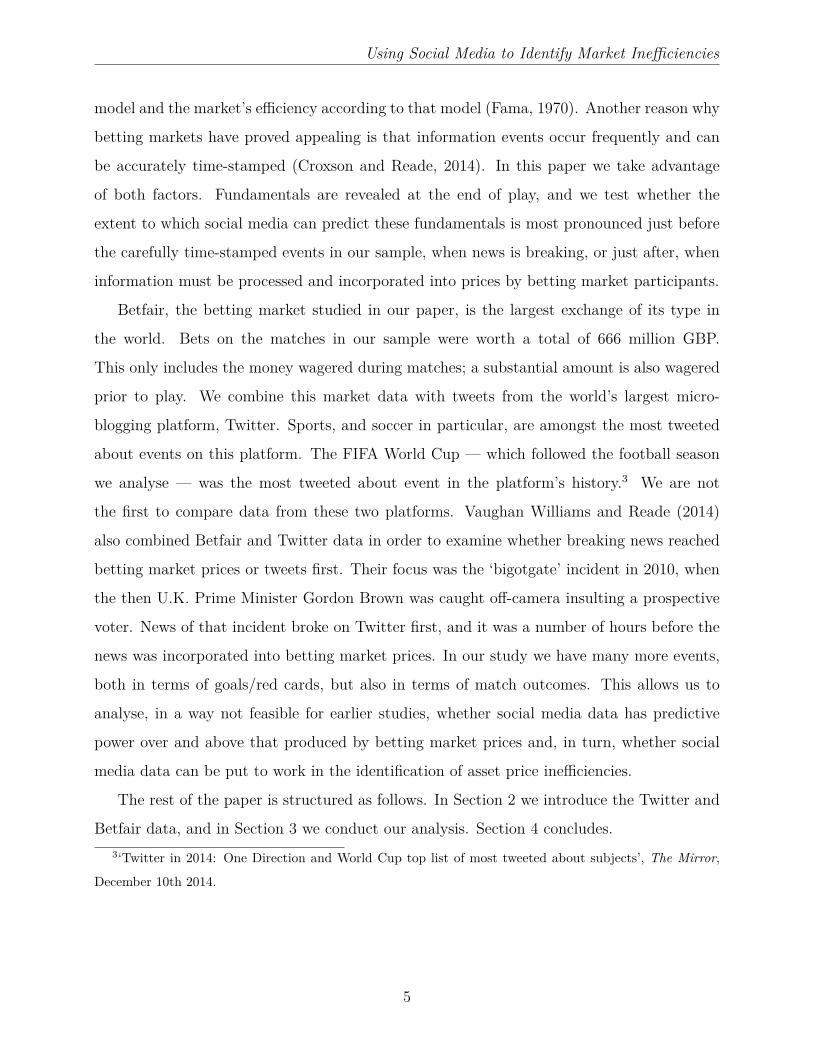
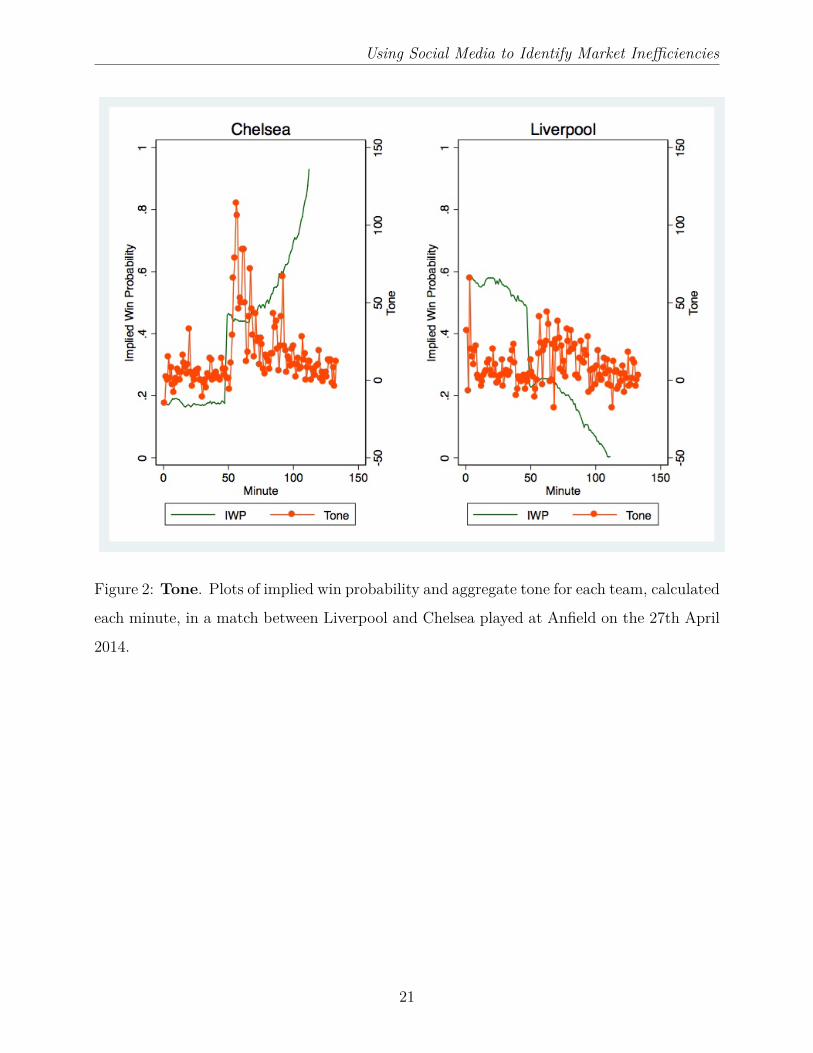
imply when there is a tweet, but the difference is not statistically significant. We display
this result in Figure 3. We plot the average win indicator against implied win probability for
instances when there is a tweet for that team (in orange), and instances when there was no
tweet (in green). While teams might appear to win slightly more often when there is a tweet
than when there is no tweet, for some implied win probabilities, the effect is not consistent.
In another words, for the full inplay period, there is little evidence that the mere presence of
a tweet conveys information on market inefficiencies.
At present we have lumped together both original tweets and retweets (the sharing of
original tweets). One way to break down our analysis is to separate these two types of tweet
out. It is possible that while original tweets contain information on fundamentals and asset
mispricing, retweets do not. Alternatively, it may be that a tweet is not asset-relevant until
validated by the another user who shares the information. In Table 2 we therefore repeat
our first regression, but this time use an indicator variable for whether there was an original
tweet or a retweet, in regressions 2 and 3 respectively. We find little difference between the
predictive power of original tweets and retweets; neither have a significant effect across the
full inplay data. There appears to be as much (or as little) information contained in the
sharing of a tweet as there is in the decision to tweet in the first place. This holds for all of
our analysis, so, to save on space, for the remainder of the paper we only describe the results
for all tweets, not original tweets and retweets separately.
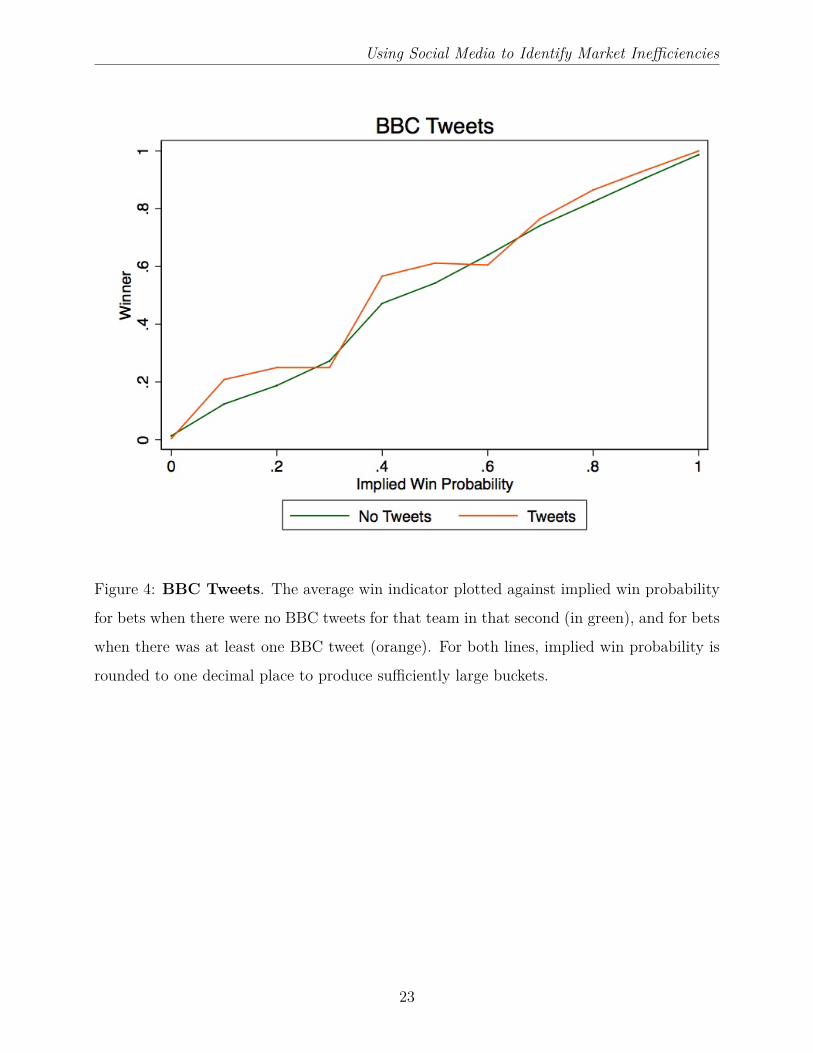
Our next approach is to look at the predictive power of a subset of tweeters. An obvious
group to consider are BBC journalists, who, in addition to their journalistic credentials, are
stationed across a large number of matches. These journalists may lead the betting market
11
Using Social Media to Identify Market Inefficiencies
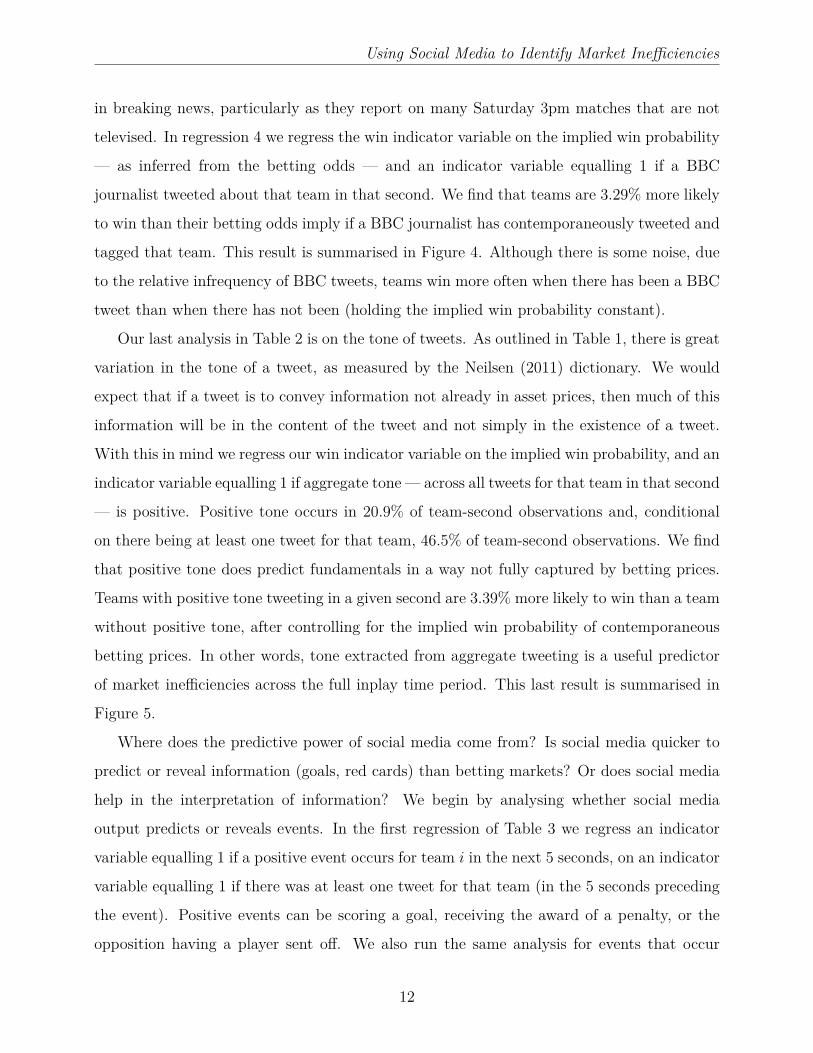
in breaking news, particularly as they report on many Saturday 3pm matches that are not
televised. In regression 4 we regress the win indicator variable on the implied win probability
— as inferred from the betting odds — and an indicator variable equalling 1 if a BBC
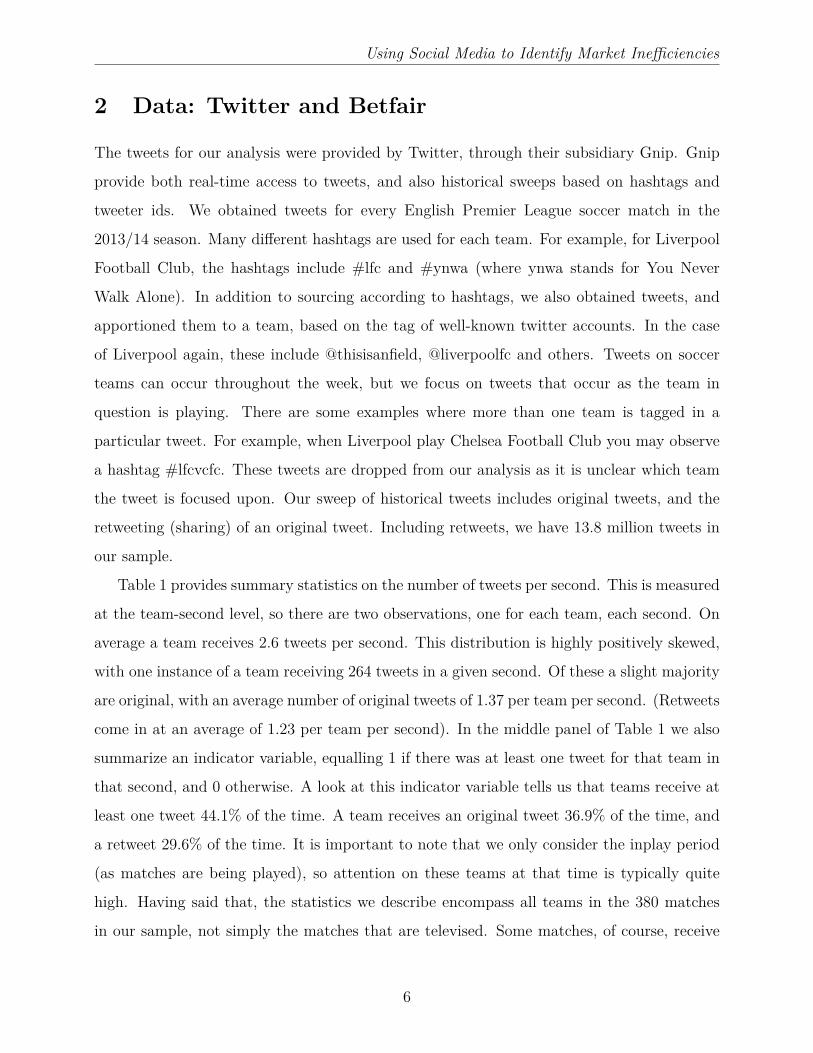
journalist tweeted about that team in that second. We find that teams are 3.29% more likely
to win than their betting odds imply if a BBC journalist has contemporaneously tweeted and
tagged that team. This result is summarised in Figure 4. Although there is some noise, due
to the relative infrequency of BBC tweets, teams win more often when there has been a BBC
tweet than when there has not been (holding the implied win probability constant).
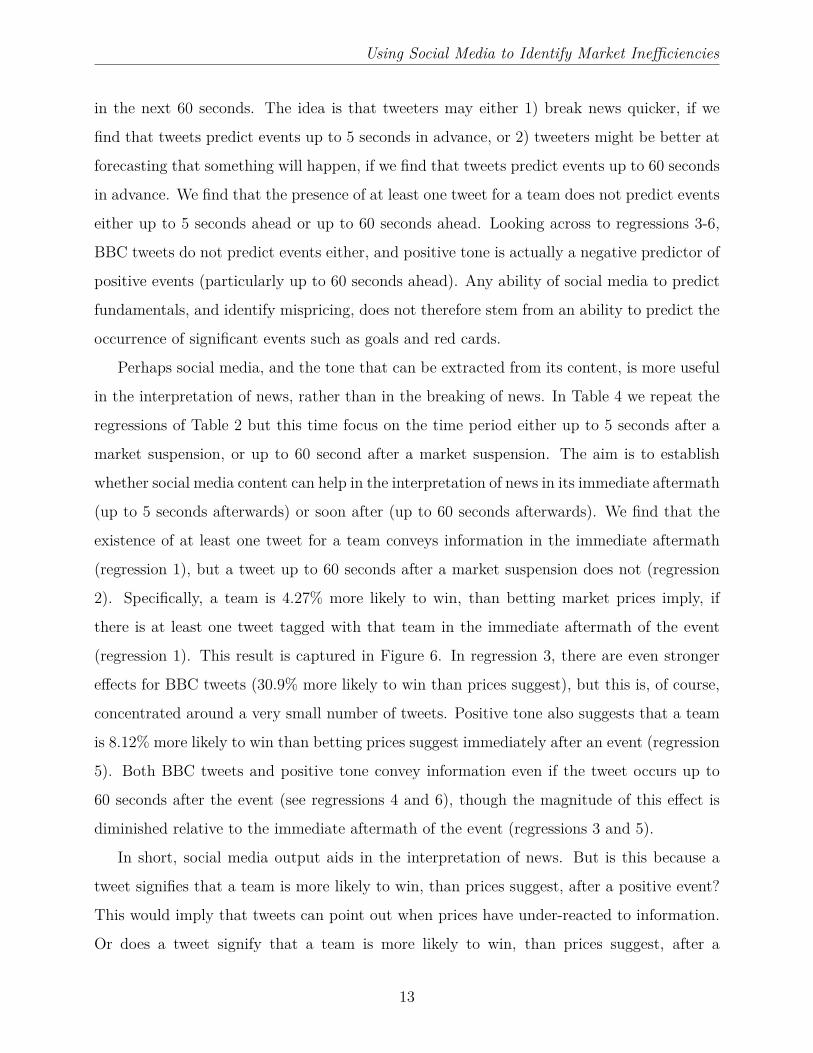
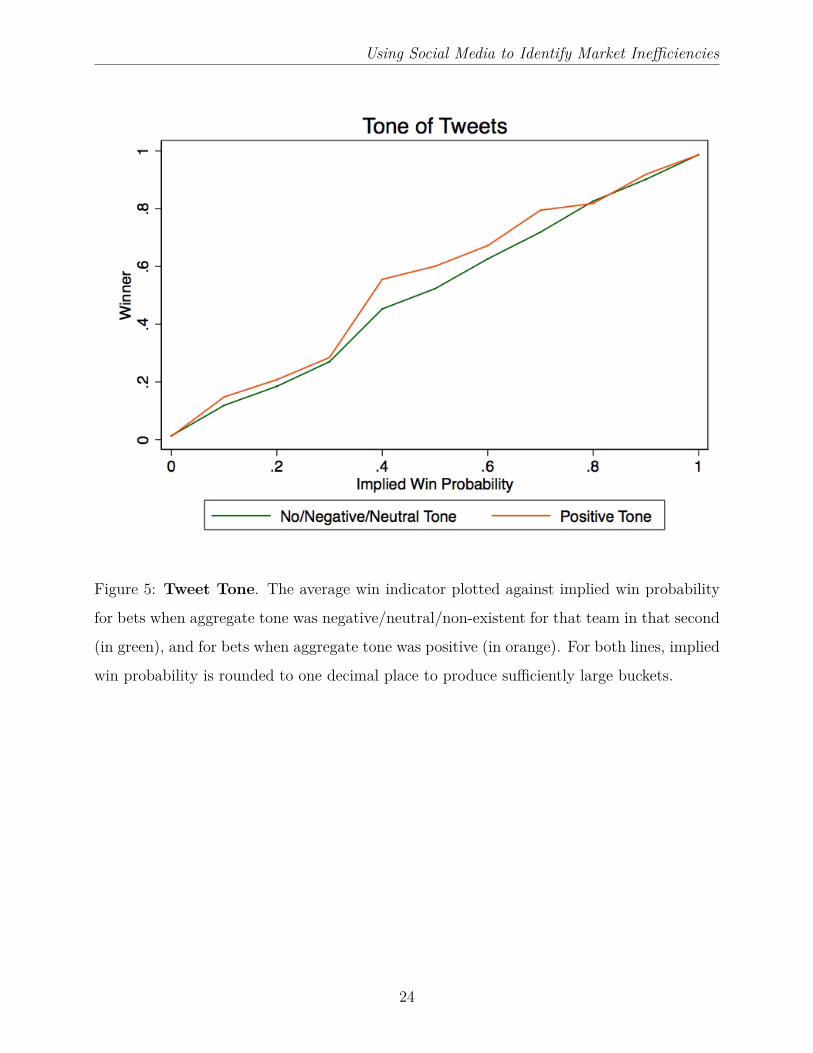
Our last analysis in Table 2 is on the tone of tweets. As outlined in Table 1, there is great
variation in the tone of a tweet, as measured by the Neilsen (2011) dictionary. We would
expect that if a tweet is to convey information not already in asset prices, then much of this
information will be in the content of the tweet and not simply in the existence of a tweet.
With this in mind we regress our win indicator variable on the implied win probability, and an
indicator variable equalling 1 if aggregate tone — across all tweets for that team in that second
— is positive. Positive tone occurs in 20.9% of team-second observations and, conditional
on there being at least one tweet for that team, 46.5% of team-second observations. We find
that positive tone does predict fundamentals in a way not fully captured by betting prices.
Teams with positive tone tweeting in a given second are 3.39% more likely to win than a team
without positive tone, after controlling for the implied win probability of contemporaneous
betting prices. In other words, tone extracted from aggregate tweeting is a useful predictor
of market inefficiencies across the full inplay time period. This last result is summarised in
Figure 5.
Where does the predictive power of social media come from? Is social media quicker to
predict or reveal information (goals, red cards) than betting markets? Or does social media
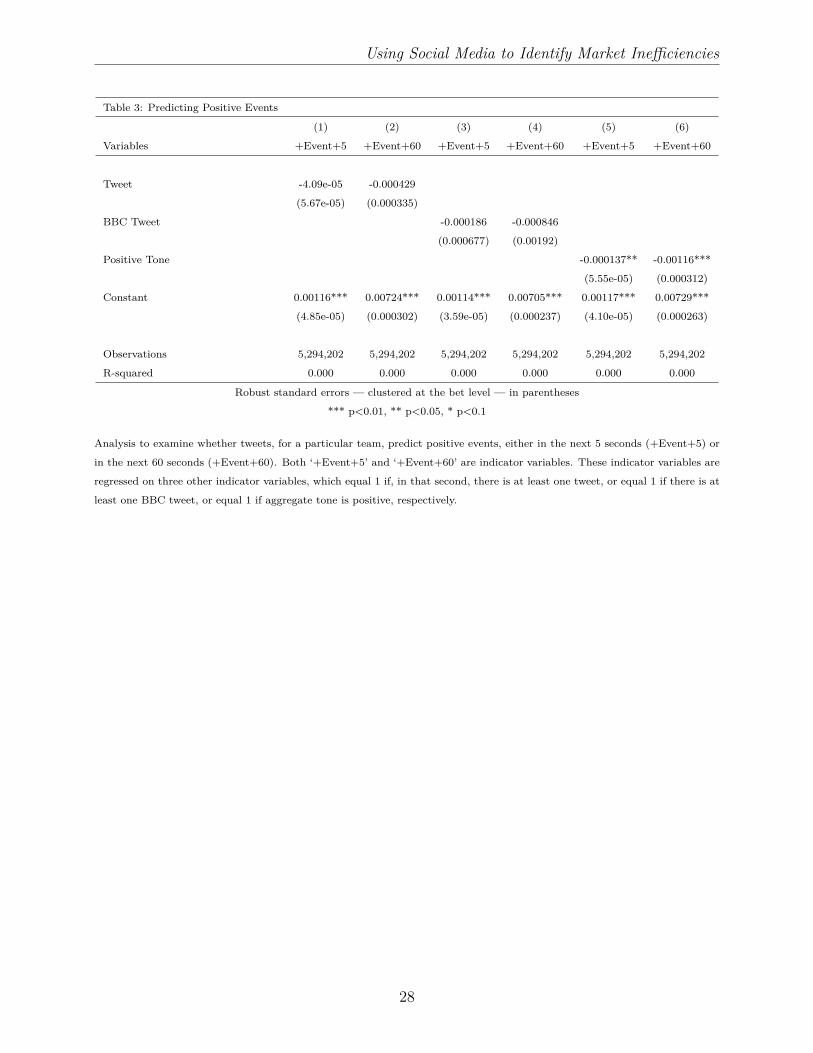
help in the interpretation of information? We begin by analysing whether social media
output predicts or reveals events. In the first regression of Table 3 we regress an indicator
variable equalling 1 if a positive event occurs for team i in the next 5 seconds, on an indicator
variable equalling 1 if there was at least one tweet for that team (in the 5 seconds preceding
the event). Positive events can be scoring a goal, receiving the award of a penalty, or the
opposition having a player sent off. We also run the same analysis for events that occur
12
Using Social Media to Identify Market Inefficiencies
in the next 60 seconds. The idea is that tweeters may either 1) break news quicker, if we
find that tweets predict events up to 5 seconds in advance, or 2) tweeters might be better at
forecasting that something will happen, if we find that tweets predict events up to 60 seconds
in advance. We find that the presence of at least one tweet for a team does not predict events
either up to 5 seconds ahead or up to 60 seconds ahead. Looking across to regressions 3-6,
BBC tweets do not predict events either, and positive tone is actually a negative predictor of
positive events (particularly up to 60 seconds ahead). Any ability of social media to predict
fundamentals, and identify mispricing, does not therefore stem from an ability to predict the
occurrence of significant events such as goals and red cards.
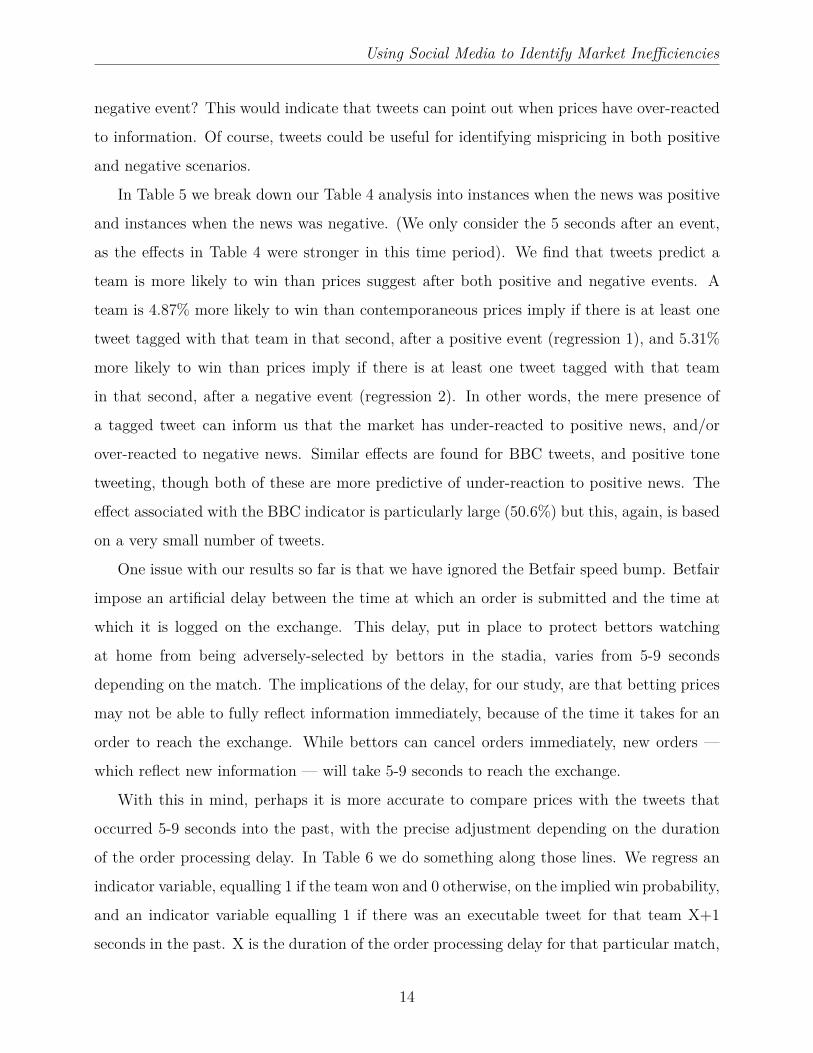
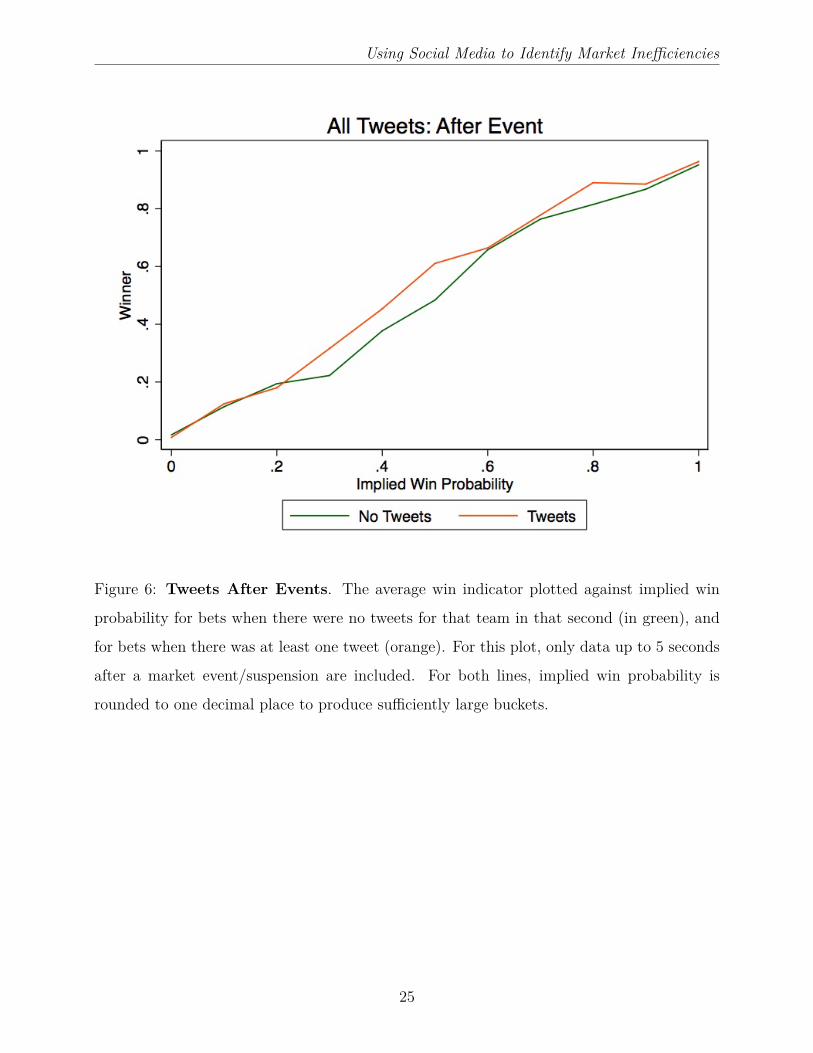
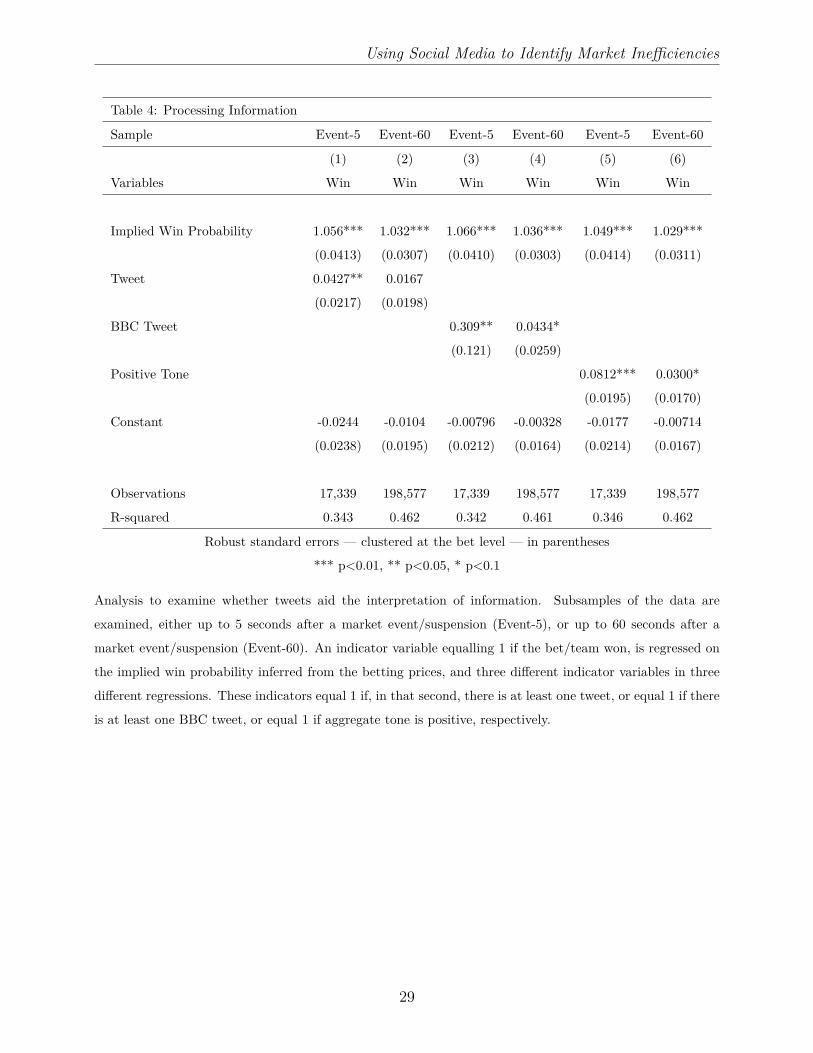
Perhaps social media, and the tone that can be extracted from its content, is more useful
in the interpretation of news, rather than in the breaking of news. In Table 4 we repeat the
regressions of Table 2 but this time focus on the time period either up to 5 seconds after a
market suspension, or up to 60 second after a market suspension. The aim is to establish
whether social media content can help in the interpretation of news in its immediate aftermath
(up to 5 seconds afterwards) or soon after (up to 60 seconds afterwards). We find that the
existence of at least one tweet for a team conveys information in the immediate aftermath
(regression 1), but a tweet up to 60 seconds after a market suspension does not (regression
2). Specifically, a team is 4.27% more likely to win, than betting market prices imply, if
there is at least one tweet tagged with that team in the immediate aftermath of the event
(regression 1). This result is captured in Figure 6. In regression 3, there are even stronger
effects for BBC tweets (30.9% more likely to win than prices suggest), but this is, of course,
concentrated around a very small number of tweets. Positive tone also suggests that a team
is 8.12% more likely to win than betting prices suggest immediately after an event (regression
5). Both BBC tweets and positive tone convey information even if the tweet occurs up to
60 seconds after the event (see regressions 4 and 6), though the magnitude of this effect is
diminished relative to the immediate aftermath of the event (regressions 3 and 5).
In short, social media output aids in the interpretation of news. But is this because a
tweet signifies that a team is more likely to win, than prices suggest, after a positive event?
This would imply that tweets can point out when prices have under-reacted to information.
Or does a tweet signify that a team is more likely to win, than prices suggest, after a
13
Using Social Media to Identify Market Inefficiencies
negative event? This would indicate that tweets can point out when prices have over-reacted
to information. Of course, tweets could be useful for identifying mispricing in both positive
and negative scenarios.
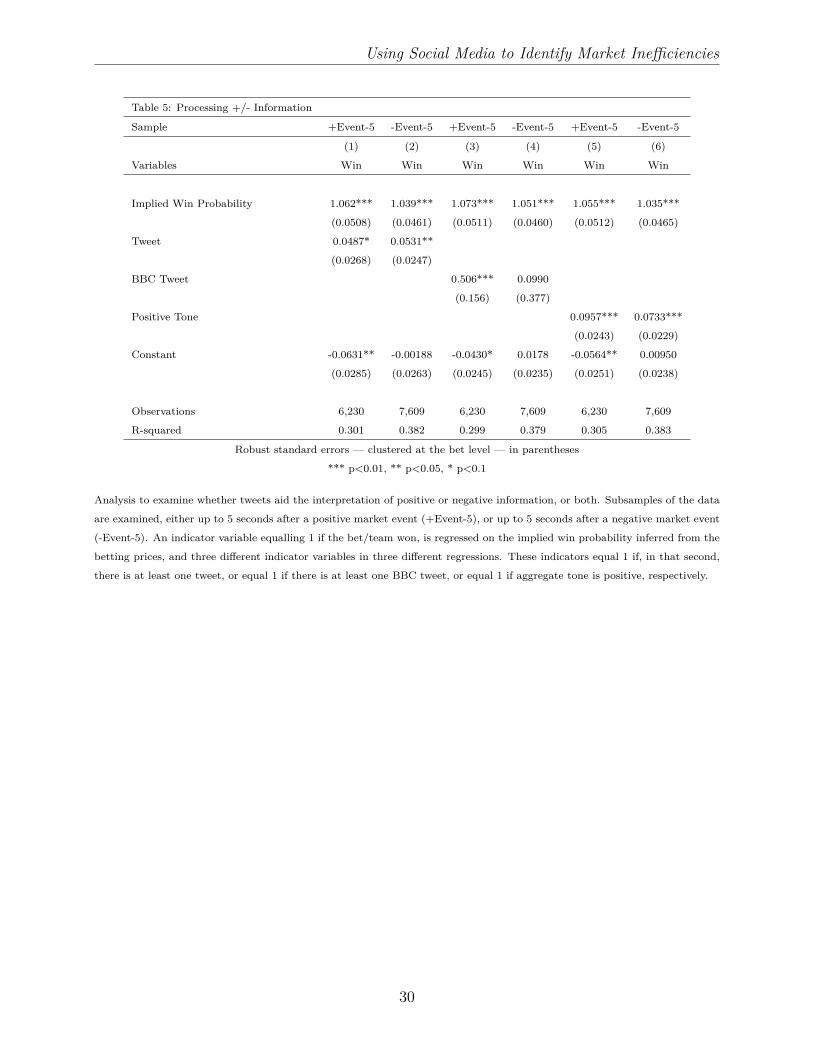
In Table 5 we break down our Table 4 analysis into instances when the news was positive
and instances when the news was negative. (We only consider the 5 seconds after an event,
as the effects in Table 4 were stronger in this time period). We find that tweets predict a
team is more likely to win than prices suggest after both positive and negative events. A
team is 4.87% more likely to win than contemporaneous prices imply if there is at least one
tweet tagged with that team in that second, after a positive event (regression 1), and 5.31%
more likely to win than prices imply if there is at least one tweet tagged with that team
in that second, after a negative event (regression 2). In other words, the mere presence of
a tagged tweet can inform us that the market has under-reacted to positive news, and/or
over-reacted to negative news. Similar effects are found for BBC tweets, and positive tone
tweeting, though both of these are more predictive of under-reaction to positive news. The
effect associated with the BBC indicator is particularly large (50.6%) but this, again, is based
on a very small number of tweets.
One issue with our results so far is that we have ignored the Betfair speed bump. Betfair
impose an artificial delay between the time at which an order is submitted and the time at
which it is logged on the exchange. This delay, put in place to protect bettors watching
at home from being adversely-selected by bettors in the stadia, varies from 5-9 seconds
depending on the match. The implications of the delay, for our study, are that betting prices
may not be able to fully reflect information immediately, because of the time it takes for an
order to reach the exchange. While bettors can cancel orders immediately, new orders —
which reflect new information — will take 5-9 seconds to reach the exchange.
With this in mind, perhaps it is more accurate to compare prices with the tweets that
occurred 5-9 seconds into the past, with the precise adjustment depending on the duration
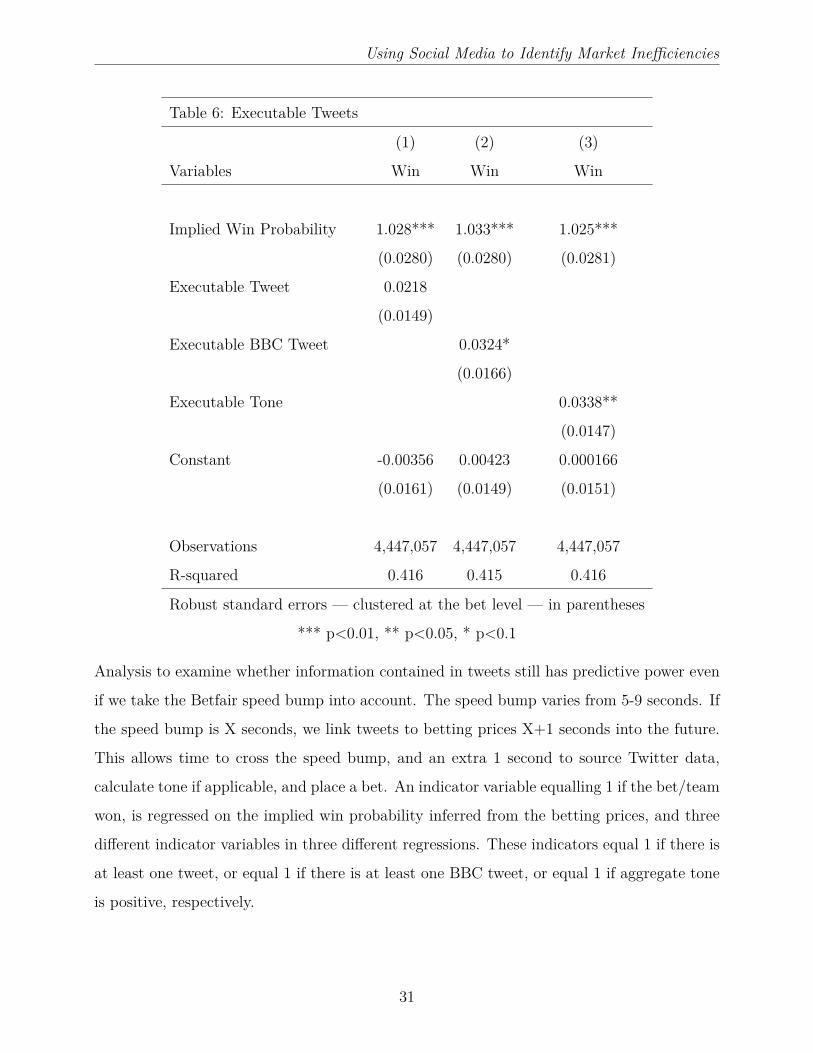
of the order processing delay. In Table 6 we do something along those lines. We regress an
indicator variable, equalling 1 if the team won and 0 otherwise, on the implied win probability,
and an indicator variable equalling 1 if there was an executable tweet for that team X+1
seconds in the past. X is the duration of the order processing delay for that particular match,
14
Using Social Media to Identify Market Inefficiencies
and an extra 1 second is added to simulate the time it might take to source data from Twitter
and execute a trade algorithmically. In effect, we are checking whether there is a mispricing
on Betfair, pointed out by activity on Twitter, that could generate abnormal profits. The
analysis in Table 6 mirrors the results in Table 2. There are executable BBC tweets that
indicate betting market mispricing, and executable tone (revealed in tweets X+1 seconds in
the past) that could also indicate betting market mispricing. The similarity between the
coefficients in Tables 2 and 6 create the view that the type of mispricing that Twitter reveals
decays, but does not decay rapidly. For example, a team is 3.39% more likely to win than
contemporaneous betting market prices suggest if there is positive tone on Twitter (regression
5 Table 2), and is 3.38% more likely to win than prices at time t + X + 1 suggest if there
is positive tone at time t (regression 3 Table 6). Given our earlier results this is perhaps
unsurprising, as most of the ability of social media to predict mispricing occurred in the
aftermath of news (when information processing is important), rather than in the prediction,
or revelation, of breaking news.
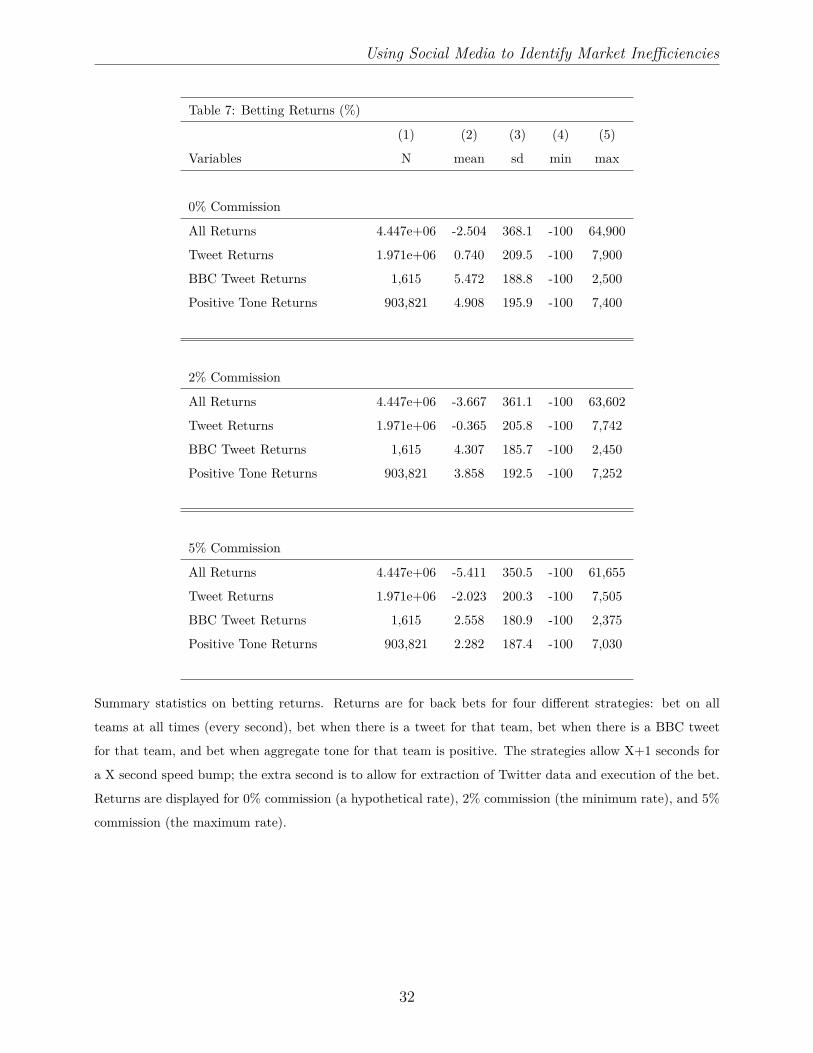
A natural next step is to estimate the returns that might be available to an arbitrageur
looking to capitalise on the mispricing we describe. This arbitrageur could extract informa-
tion from Twitter, calculate the tone of the tweets (if necessary), and then algorithmically
execute a bet on Betfair. These bets will be executed at the best back quote, not at the
midpoint of the back-lay spread as previously analysed. In Table 7 we present summary
statistics on the returns to four strategies. (All strategies allow X+1 seconds for execution,
where X is the duration of the order processing delay). The first strategy is to bet on all
teams, in all seconds. This is the benchmark return and gives us an idea of the margins on
the exchange. The second strategy is to bet when there has been at least one tweet tagged
with the team in question in that second. The third strategy is to bet when there has been
a BBC tweet on that team in that second. And the fourth and final strategy is to bet when
aggregate tone for that team in that second is positive. Betfair charge commission of 2-5% on
profits within each market, with the rate depending on the historical activity of the bettor.
We therefore present the returns to the four strategies for three different commission rates:
0% (a hypothetical rate), 2% (the minimum rate, available to the most active customers),
and 5% (the maximum rate, available to a first-time user of the exchange).
15
Using Social Media to Identify Market Inefficiencies
There are substantial returns available for betting on the basis of BBC tweets, and on the
basis of positive aggregate tone. To take the highest commission rate of 5% as an example,
the average returns to the BBC strategy are 2.55% (from 1,615 bets), and the returns to the
positive tone strategy are 2.28% (from 903,821 bets). This compares with average returns
of -5.41% across all 4.44 million bets. Given that the strategy returns are for, at most, a 90
minute investment, the magnitudes are quite striking. Of course, if we wanted to properly
establish the economic significance of these returns, we would need to calculate the volume
available for each of these bets, and use a model to predict the price impact of each of our
trades. Nevertheless, even our back-of-the-envelope calculations illustrate the magnitude of
mispricing that social media can identify.
4 Conclusion
Social media is increasingly used as an investment tool. Mining the opinions of the millions
of Twitter users allows trading firms to gauge the sentiment of a broad investor population.
To the extent to which this sentiment also determines trading, these same firms can also
then forecast short-term returns. But is there harder, more concrete, information related to
asset fundamentals that can be garnered from social media activity? Can the ‘wisdom of the
crowd’ tell us something fundamental that market prices cannot? Or is social media output
purely comprised of sentiment and misinformation? Given the incentives to manipulate
markets, and the disincentive to share asset-relevant information rather than trade upon it,
it is plausible that the information content of social media output might be limited.
In this paper we analyse 13.8 million Twitter posts on English Premier League football
matches, and compare them with contemporaneous betting prices available on Betfair, a
popular U.K. betting exchange. We follow both throughout 372 matches in the 2013/14
season. We ask a series of simple questions: does social media activity predict fundamentals,
after accounting for betting market prices? Does the positive tone of tweets predict that a
team is more likely to win than the market implies? Or does excess positivity, or insufficient
negativity, inform us, on average, that prices are inflated? Importantly, in our setting we can
observe asset fundamentals, as they are revealed at the end of each match. We are therefore
16
Using Social Media to Identify Market Inefficiencies
not relating Twitter content to sentiment and short-run returns, but instead to fundamentals.
We find that Twitter activity predicts asset fundamentals, after controlling for betting
market prices. The effect is concentrated amongst journalists from a large media organisation,
the BBC, but can also be found in the general tone of all tweets. Much of the predictive
power of social media presents itself just after significant market events, such as goals and red
cards, where the tone of tweets can help in the correction of market under-reaction or over-
reaction. Returns to strategies predicated on social media activity can generate returns of
2.28% to 2.55%, for less than 90 minute investments, even for first time users of the exchange.
In short, social media activity does not just represent sentiment or misinformation, but, if
sensibly aggregated, can help to identify instances when fundamentals have changed, and
when markets are inefficient.
References
• Ali, M., M., (1977). Probability and Utility Estimates for Racetrack Bettors. Journal
of Political Economy, 85, 803-815.
• Avery, C., N., Chevalier, J., A., Zeckhauser, R., J., (2015). The ‘CAPS’ Prediction
System and Stock Market Returns. Review of Finance, forthcoming.
• Brown, A., Yang, F., (2014). The Role of Speculative Trade in Market Efficiency:
Evidence from a Betting Exchange. Working paper.
• Brown, A., Yang, F., (2015). Slowing Down Fast Traders: Evidence from the Betfair
Speed Bump. Working paper.
• Chen, H., De, P., Hu, Y., Hwang, B., H., (2014). Wisdom of Crowds: The Value of
Stock Opinions Transmitted Through Social Media. Review of Financial Studies, 27,
1367-1403.
• Cowgill, B., Zitzewitz, E., (2015). Corporate Prediction Markets: Evidence from
Google, Ford, and Firm X. Review of Economic Studies, forthcoming.
17
Using Social Media to Identify Market Inefficiencies
• Croxson, K., Reade, J., J., (2014). Information and Efficiency: Goal Arrival in Soccer
Betting. Economic Journal, 124, 62-91.
• Edmans, A., Garcia, D., Norli, O., (2007). Sports Sentiment and Stock Returns. Jour-
nal of Finance, 62, 1967-1998.
• Fama, E., F., (1970). Efficient Capital Markets: A Review of Theory and Empirical
Work. Journal of Finance, 25, 383-417.
• Kelley, E., K., Tetlock, P., C., (2013). How Wise are Crowds? Insights from Retail
Orders and Stock Returns. Journal of Finance, 68, 1229-1265.
• Loughran, T., McDonald, B., (2011). When is a Liability not a Liability? Textual
Analysis, Dictionaries, and 10-Ks. Journal of Finance, 66, 35-65.
• Neilsen, F., A., (2011). A new ANEW: Evaluation of a Word List for Sentiment
Analysis in Microblogs. Proceedings of the ESWC2011 Workshop on ’Making Sense of
Microposts, 93-98.
• Rhode, P., W, Strumpf, K., S., (2004). Historical Presidential Betting Markets. Journal
of Economic Perspectives, 18, 127-142.
• Spann, M., Skiera, B., (2011). Sports Forecasting: A Comparison of the Forecast
Accuracy of Prediction Markets, Betting Odds and Tipsters. Journal of Forecasting,
28, 55-72.
• Sprenger, T., O., Tumasjan, A., Sandner, P., G., Welpe, I., M., (2014). Tweets and
Trades: the Information Content of Stock Microblogs. European Financial Manage-
ment, 20, 926-957.
• Snowberg, E., Wolfers, J., (2010). Explaining the Favorite-Long Shot Bias: Is it Risk
Love or Misperceptions? Journal of Political Economy, 118, 723-746.
• Snyder, W., W., (1978). Horse Racing: Testing the Efficient Markets Model. Journal
of Finance, 33, 1109-1118.
18
Using Social Media to Identify Market Inefficiencies
• Surowiecki, J., (2005). The Wisdom of Crowds: Why the Many are Smarter Than the
Few. Abacus, 3rd edition.
• Tetlock, P., C., (2007). Giving Content to Investor Sentiment: The Role of Media in
the Stock Market. Journal of Finance, 62, 1139-1168.
• Tetlock, P., C., (2011). All the News That’s Fit to Reprint: Do Investors React to
Stale Information? Review of Financial Studies, 24, 1481-1512.
• Van Bommel, J., (2003). Rumors. Journal of Finance, 58, 1499-1519.
• Vaughan Williams, L., Paton, D., (1997). Why is there a Favourite-Longshot Bias in
British Racetrack Betting Markets? The Economic Journal, 107, 150-158.
• Vaughan Williams, L., Reade, J., J., (2014). Prediction Markets, Twitter and Bigot-
gate. Working paper.
• Vaughan Williams, L., Reade, J., J., (2015). Forecasting Elections. Journal of Fore-
casting, forthcoming.
• Wolfers, J., Zitzewitz, E., (2004). Prediction Markets. Journal of Economic Perspec-
tives, 18, 107-126.
• Zhang, X., Fuehres, H., Gloor, P., A., (2011). Predicting Stock Market Indicators
Through Twitter ‘I hope it is not as bad as I fear’. Procedia - Social and Behavioral
Sciences, 26, 55-62.
19
Using Social Media to Identify Market Inefficiencies
Figures and Tables
Figure 1: Number of Tweets. Plots of implied win probability and the number of tweets
for each team, calculated each minute, in a match between Liverpool and Chelsea played at
Anfield on the 27th April 2014.
20
Using Social Media to Identify Market Inefficiencies
Figure 2: Tone. Plots of implied win probability and aggregate tone for each team, calculated
each minute, in a match between Liverpool and Chelsea played at Anfield on the 27th April
2014.
21
Using Social Media to Identify Market Inefficiencies
Figure 3: All Tweets. The average win indicator plotted against implied win probability for
bets when there were no tweets for that team in that second (in green), and for bets when
there was at least one tweet (orange). For both lines, implied win probability is rounded to
one decimal place to produce sufficiently large buckets.
22
Using Social Media to Identify Market Inefficiencies
Figure 4: BBC Tweets. The average win indicator plotted against implied win probability
for bets when there were no BBC tweets for that team in that second (in green), and for bets
when there was at least one BBC tweet (orange). For both lines, implied win probability is
rounded to one decimal place to produce sufficiently large buckets.
23
Using Social Media to Identify Market Inefficiencies
Figure 5: Tweet Tone. The average win indicator plotted against implied win probability
for bets when aggregate tone was negative/neutral/non-existent for that team in that second
(in green), and for bets when aggregate tone was positive (in orange). For both lines, implied
win probability is rounded to one decimal place to produce sufficiently large buckets.
24
Using Social Media to Identify Market Inefficiencies
Figure 6: Tweets After Events. The average win indicator plotted against implied win
probability for bets when there were no tweets for that team in that second (in green), and
for bets when there was at least one tweet (orange). For this plot, only data up to 5 seconds
after a market event/suspension are included. For both lines, implied win probability is
rounded to one decimal place to produce sufficiently large buckets.
25
Using Social Media to Identify Market Inefficiencies
Table 1: Summary Statistics
(1) (2) (3) (4) (5)
Variables N mean sd min max
No. of Tweets 5.294e+06 2.608 7.346 0 264
No. of Original Tweets 5.294e+06 1.377 3.878 0 163
No. of Retweets 5.294e+06 1.231 3.942 0 181
No. of BBC Tweets 5.294e+06 0.000410 0.0210 0 2
Aggregate Tone 5.294e+06 1.398 7.629 -144 471
Tweet 5.294e+06 0.441 0.496 0 1
Original Tweet 5.294e+06 0.369 0.483 0 1
Retweet 5.294e+06 0.296 0.457 0 1
BBC Tweet 5.294e+06 0.000396 0.0199 0 1
Positive Tone 5.294e+06 0.209 0.406 0 1
Implied Win Probability 7.941e+06 .336 .462 .001 .99
Win 7.941e+06 .336 .472 0 1
In the top panel, we display summary statistics on the number of tweets, the number of
original tweets, the number of retweets, the number of BBC tweets, and aggregate tone of all
tweets, each second. In the middle panel we display indicator variables equalling 1 if, each
second, there is at least one tweet, equalling 1 if there is at least one original tweet, equalling
1 if there is at least one retweet, equalling 1 if there is at least one BBC tweet, and equalling
1 if aggregate tone is positive. In the bottom panel, we display summary statistics on implied
win probability — inferred from betting prices — and a win indicator variable. Draws are
included in the betting price data and the match outcome, but not in the tweets (tweets are
seldom tagged #draw).
26
Using Social Media to Identify Market Inefficiencies
Table 2: Main Analysis
(1) (2) (3) (4) (5)
Variables Win Win Win Win Win
Implied Win Probability 1.028*** 1.028*** 1.026*** 1.033*** 1.025***
(0.0280) (0.0280) (0.0281) (0.0280) (0.0281)
Tweet 0.0218
(0.0149)
Original Tweet 0.0219
(0.0147)
Retweet 0.0233
(0.0172)
BBC Tweet 0.0329*
(0.0168)
Positive Tone 0.0339**
(0.0148)
Constant -0.00355 -0.00214 2.10e-05 0.00423 0.000169
(0.0161) (0.0157) (0.0155) (0.0149) (0.0151)
Observations 4,447,057 4,447,057 4,447,057 4,447,057 4,447,057
R-squared 0.416 0.416 0.416 0.415 0.416
Robust standard errors — clustered at the bet/team level — in parentheses
*** p<0.01, ** p<0.05, * p<0.1
The main analysis in the paper. An indicator variable equalling 1 if the bet/team won, is
regressed on the implied win probability inferred from the betting prices, and five different
indicator variables in five different regressions. These indicators equal 1 if, in that second,
there is at least one tweet, or equal 1 if there is at least one original tweet, or equal 1 if there
is at least one retweet, or equal 1 if there is at least one BBC tweet, or equal 1 if aggregate
tone is positive, respectively.
27
Using Social Media to Identify Market Inefficiencies
Table 3: Predicting Positive Events
(1) (2) (3) (4) (5) (6)
Variables +Event+5 +Event+60 +Event+5 +Event+60 +Event+5 +Event+60
Tweet -4.09e-05 -0.000429
(5.67e-05) (0.000335)
BBC Tweet -0.000186 -0.000846
(0.000677) (0.00192)
Positive Tone -0.000137** -0.00116***
(5.55e-05) (0.000312)
Constant 0.00116*** 0.00724*** 0.00114*** 0.00705*** 0.00117*** 0.00729***
(4.85e-05) (0.000302) (3.59e-05) (0.000237) (4.10e-05) (0.000263)
Observations 5,294,202 5,294,202 5,294,202 5,294,202 5,294,202 5,294,202
R-squared 0.000 0.000 0.000 0.000 0.000 0.000
Robust standard errors — clustered at the bet level — in parentheses
*** p<0.01, ** p<0.05, * p<0.1
Analysis to examine whether tweets, for a particular team, predict positive events, either in the next 5 seconds (+Event+5) or
in the next 60 seconds (+Event+60). Both ‘+Event+5’ and ‘+Event+60’ are indicator variables. These indicator variables are
regressed on three other indicator variables, which equal 1 if, in that second, there is at least one tweet, or equal 1 if there is at
least one BBC tweet, or equal 1 if aggregate tone is positive, respectively.
28
Using Social Media to Identify Market Inefficiencies
Table 4: Processing Information
Sample Event-5 Event-60 Event-5 Event-60 Event-5 Event-60
(1) (2) (3) (4) (5) (6)
Variables Win Win Win Win Win Win
Implied Win Probability 1.056*** 1.032*** 1.066*** 1.036*** 1.049*** 1.029***
(0.0413) (0.0307) (0.0410) (0.0303) (0.0414) (0.0311)
Tweet 0.0427** 0.0167
(0.0217) (0.0198)
BBC Tweet 0.309** 0.0434*
(0.121) (0.0259)
Positive Tone 0.0812*** 0.0300*
(0.0195) (0.0170)
Constant -0.0244 -0.0104 -0.00796 -0.00328 -0.0177 -0.00714
(0.0238) (0.0195) (0.0212) (0.0164) (0.0214) (0.0167)
Observations 17,339 198,577 17,339 198,577 17,339 198,577
R-squared 0.343 0.462 0.342 0.461 0.346 0.462
Robust standard errors — clustered at the bet level — in parentheses
*** p<0.01, ** p<0.05, * p<0.1
Analysis to examine whether tweets aid the interpretation of information. Subsamples of the data are
examined, either up to 5 seconds after a market event/suspension (Event-5), or up to 60 seconds after a
market event/suspension (Event-60). An indicator variable equalling 1 if the bet/team won, is regressed on
the implied win probability inferred from the betting prices, and three different indicator variables in three
different regressions. These indicators equal 1 if, in that second, there is at least one tweet, or equal 1 if there
is at least one BBC tweet, or equal 1 if aggregate tone is positive, respectively.
29
Using Social Media to Identify Market Inefficiencies
Table 5: Processing +/- Information
Sample +Event-5 -Event-5 +Event-5 -Event-5 +Event-5 -Event-5
(1) (2) (3) (4) (5) (6)
Variables Win Win Win Win Win Win
Implied Win Probability 1.062*** 1.039*** 1.073*** 1.051*** 1.055*** 1.035***
(0.0508) (0.0461) (0.0511) (0.0460) (0.0512) (0.0465)
Tweet 0.0487* 0.0531**
(0.0268) (0.0247)
BBC Tweet 0.506*** 0.0990
(0.156) (0.377)
Positive Tone 0.0957*** 0.0733***
(0.0243) (0.0229)
Constant -0.0631** -0.00188 -0.0430* 0.0178 -0.0564** 0.00950
(0.0285) (0.0263) (0.0245) (0.0235) (0.0251) (0.0238)
Observations 6,230 7,609 6,230 7,609 6,230 7,609
R-squared 0.301 0.382 0.299 0.379 0.305 0.383
Robust standard errors — clustered at the bet level — in parentheses
*** p<0.01, ** p<0.05, * p<0.1
Analysis to examine whether tweets aid the interpretation of positive or negative information, or both. Subsamples of the data
are examined, either up to 5 seconds after a positive market event (+Event-5), or up to 5 seconds after a negative market event
(-Event-5). An indicator variable equalling 1 if the bet/team won, is regressed on the implied win probability inferred from the
betting prices, and three different indicator variables in three different regressions. These indicators equal 1 if, in that second,
there is at least one tweet, or equal 1 if there is at least one BBC tweet, or equal 1 if aggregate tone is positive, respectively.
30
Using Social Media to Identify Market Inefficiencies
Table 6: Executable Tweets
(1) (2) (3)
Variables Win Win Win
Implied Win Probability 1.028*** 1.033*** 1.025***
(0.0280) (0.0280) (0.0281)
Executable Tweet 0.0218
(0.0149)
Executable BBC Tweet 0.0324*
(0.0166)
Executable Tone 0.0338**
(0.0147)
Constant -0.00356 0.00423 0.000166
(0.0161) (0.0149) (0.0151)
Observations 4,447,057 4,447,057 4,447,057
R-squared 0.416 0.415 0.416
Robust standard errors — clustered at the bet level — in parentheses
*** p<0.01, ** p<0.05, * p<0.1
Analysis to examine whether information contained in tweets still has predictive power even
if we take the Betfair speed bump into account. The speed bump varies from 5-9 seconds. If
the speed bump is X seconds, we link tweets to betting prices X+1 seconds into the future.
This allows time to cross the speed bump, and an extra 1 second to source Twitter data,
calculate tone if applicable, and place a bet. An indicator variable equalling 1 if the bet/team
won, is regressed on the implied win probability inferred from the betting prices, and three
different indicator variables in three different regressions. These indicators equal 1 if there is
at least one tweet, or equal 1 if there is at least one BBC tweet, or equal 1 if aggregate tone
is positive, respectively.
31
Using Social Media to Identify Market Inefficiencies
Table 7: Betting Returns (%)
(1) (2) (3) (4) (5)
Variables N mean sd min max
0% Commission
All Returns 4.447e+06 -2.504 368.1 -100 64,900
Tweet Returns 1.971e+06 0.740 209.5 -100 7,900
BBC Tweet Returns 1,615 5.472 188.8 -100 2,500
Positive Tone Returns 903,821 4.908 195.9 -100 7,400
2% Commission
All Returns 4.447e+06 -3.667 361.1 -100 63,602
Tweet Returns 1.971e+06 -0.365 205.8 -100 7,742
BBC Tweet Returns 1,615 4.307 185.7 -100 2,450
Positive Tone Returns 903,821 3.858 192.5 -100 7,252
5% Commission
All Returns 4.447e+06 -5.411 350.5 -100 61,655
Tweet Returns 1.971e+06 -2.023 200.3 -100 7,505
BBC Tweet Returns 1,615 2.558 180.9 -100 2,375
Positive Tone Returns 903,821 2.282 187.4 -100 7,030
Summary statistics on betting returns. Returns are for back bets for four different strategies: bet on all
teams at all times (every second), bet when there is a tweet for that team, bet when there is a BBC tweet
for that team, and bet when aggregate tone for that team is positive. The strategies allow X+1 seconds for
a X second speed bump; the extra second is to allow for extraction of Twitter data and execution of the bet.
Returns are displayed for 0% commission (a hypothetical rate), 2% commission (the minimum rate), and 5%
commission (the maximum rate).
32