Embed Size (px)
Citation preview

Using Social Media to Enhance Disease Surveillance
Jacqueline S. Coberly, PhD Clay Fink, PhD
Eugene Elbert, MS In-Kyu Yoon, MD
John Mark Velasco, MD, MPH Sheri Lewis, MPH
NDIA BioSurveillance Conference
28 August 2012
Disclaimer
The views expressed in this presentation are those of the authors and do not reflect the official policy of the Department of the Army, Department of Defense, or the U.S. Government.

Outline
• Disease Surveillance Program at JHU/APL
• Can Twitter provide valid surrogate data to inform electronic disease surveillance
– Twitter Project Objective
– Methods & Results
• Conclusions

Electronic Syndromic Surveillance
Alert is identified for a
particular day /
syndrome
ED Chief Complaints
Epidemiologist
performs daily
system review
PUBLIC
HEALTH
RESPONSE
INITIATED
Outbreak
Confirmed
School
Absenteeism
Radiology Diagnostic
Labs
Poison Control
Rx Drugs
Nurse Call
Center
OTC Sales (Over the
Counter)
Epidemiologist
gathers additional
data
• Surveillance data
• Lab reports
• Facility reports
• Verbal reports
Ambulance Logs
More detailed analysis
of alert

Evolution of ESSENCE and Electronic Disease Surveillance at JHU/APL
Maryland
National Capitol Region
United States
Global

JHU/APL Global Involvement
• Collaboration with Global Emerging Infection Systems (GEIS), now part of AFHSC
• Initially Assess the utility of syndromic surveillance in resource poor areas
• Currently Develop, implement, support and evaluate integrated global disease surveillance and response software system.
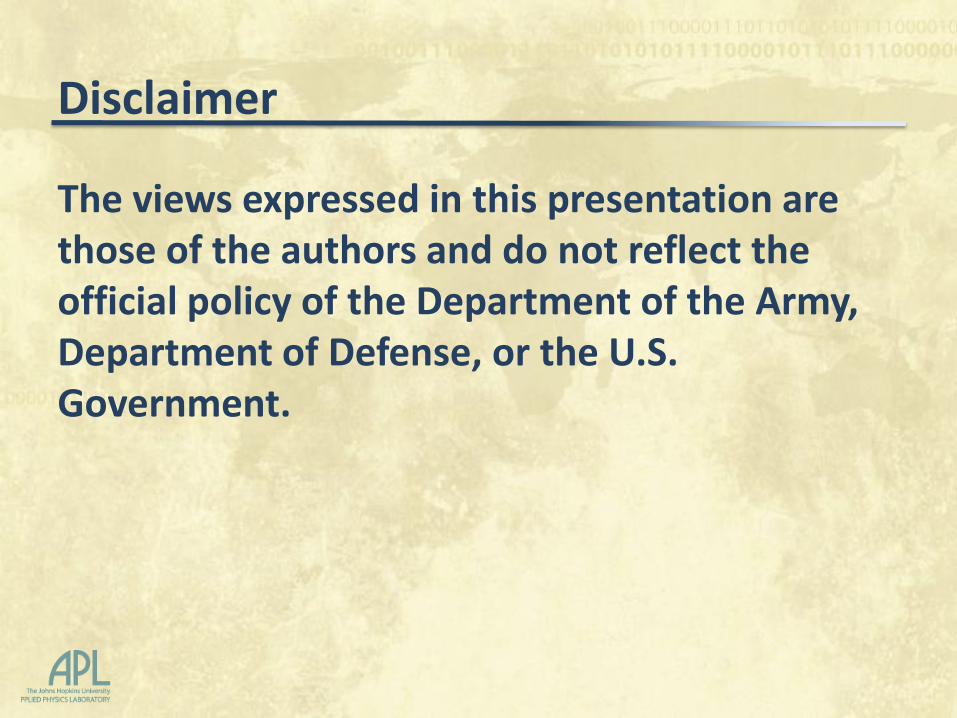
SAGES (Suite for Automated Global Electronic bioSurveillance)

Twitter as a Surveillance Data Source? • Project Objectives – To investigate whether
Twitter data can be used to detect & characterize the incidence of dengue-like fever in a dengue-endemic area.
• Limited pilot done on internal R&D funding
─ Compare Twitter ‘dengue’ trend data with ‘fever’ and dengue incidence data collected by local and national health authorities.
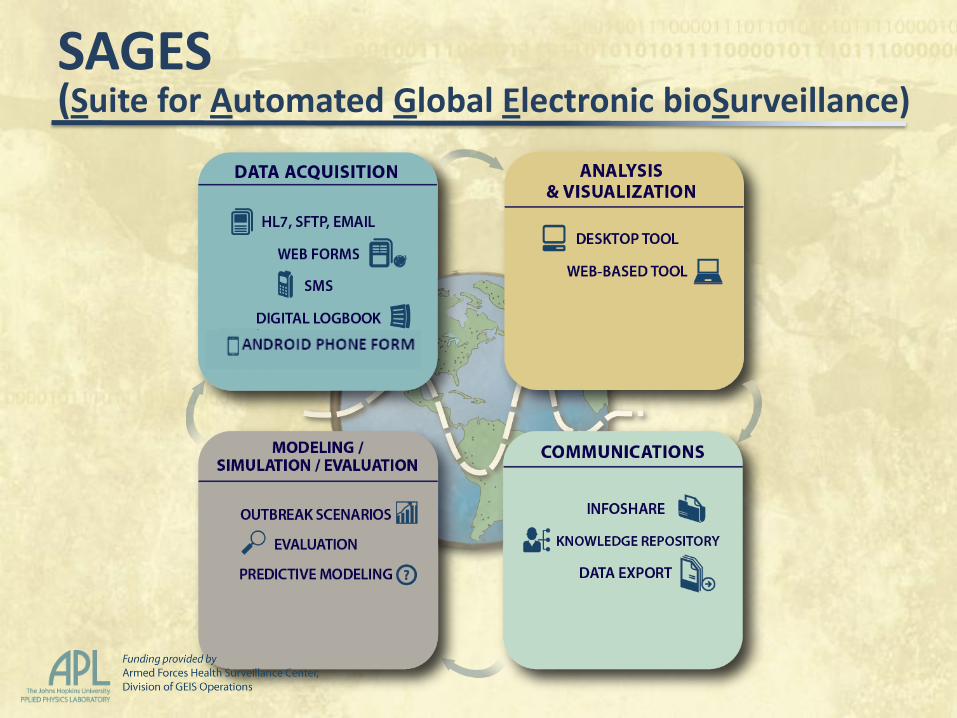
Twitter Project – Methods Overview
• Obtain ‘ground truth’ data for 2011
• Collect publicly available Twitter messages during 2011 dengue season.
• Identify a vocabulary of words/phrases in tweets
• Perform keyword analysis using vocabulary; compare marked tweets with SMS-C and PIDSR

Ground Truth Data
• Two sources
– Fever SMS data, Cebu City, PI (SMS-C)
– Nat’l Reportable Disease System, Dengue (PIDSR)

Ground Truth Data Fever SMS Program, Cebu City
• Fever incidence mimics dengue incidence • Paper based fever reporting system used in
Cebu City until 2009 • Replaced by city-wide fever reporting via SMS
– Each local clinic texts data for each patient presenting with fever to the Cebu City Health Office (CCHO) daily
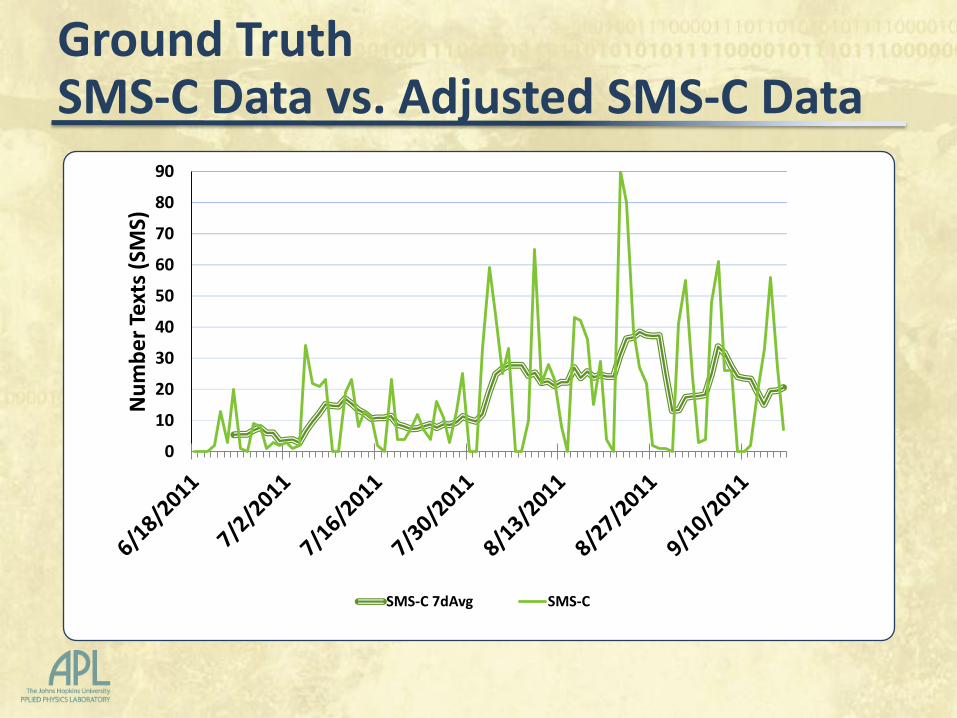
Ground Truth SMS-C Data vs. Adjusted SMS-C Data
0
10
20
30
40
50
60
70
80
90
Nu
mb
er
Text
s (S
MS)
SMS-C 7dAvg SMS-C

Ground Truth Data National Reportable Disease System
• Philippines Integrated Disease Surveillance and Reporting system (PIDSR)
• Each case of reportable disease observed, including dengue, is reported to the National Epidemiology Center
• Covers entire country
• Detailed case report, but not timely

Pearson Correlation Coefficient = 0.594, p<0.0001
0
5
10
15
20
25
30
35
0
50
100
150
200
250
300
PID
SRC
No
. Ne
w C
ase
s
Nu
mb
er
Ne
w C
ase
s
PIDSRM PIDSRC
0
50
100
150
200
250
300
Nu
mb
er
Ne
w C
ase
s
PIDSRC PIDSRM PIDSR-C&NCR
Ground Truth PIDSR - Cebu City, NCR & Combination

Collection of Tweets • From 2 areas of the Philippines:
– Cebu City (C) – National Capitol Region (NCR)
• Time period: – Cebu: 6/18/2011 – 9/16/2011* – NCR: ~7/27/2011 – 9/16/2011
• From Twitter public Application Program Interface (API) – Prospective only – Only a fraction of total, exact method of
selection is unclear

Tweets by Location: Cebu City vs. NCR
0
10
20
30
40
50
60
70
0
50
100
150
200
250
Nu
mb
er
Twe
ets
- C
Nu
mb
er
Twe
ets
Tweets-NCR Tweets-C
0
10
20
30
40
50
60
70
0
50
100
150
200
250
300
Nu
mb
er
Twe
ets
- C
Nu
mb
er
Twe
ets
Tweets-NCR Tweets-C&NCR Tweets-C

Keyword Analysis Results
• Dengue ─ Few mentions n=287 (~0.001%) ─ Most from public health/news announcements
• Clinical diagnosis (fever and >1 other sx) ─ Increased specificity ─ Still relatively few mentions, N=441 (~0.002%)
• Fever ─ Traditionally used as a surrogate for dengue ─ Most frequent appearance, N= 8814 (~0.03%) ─ Medically related fever is less common (N=4409),
but more relevant

Description of Tweets 10,303,366
Cebu Tweets 15,719,767 NCR Tweets
0.02% of total
9,461 Fever Not ‘Beiber’
8,814 All Fever (Cebu – 2,472) (NCR – 6,746)
644 Duplicates
4715 Fever <> Medical
4099 Fever, Medically Related (Cebu – 995) (NCR – 3,104)
0.01% of total
Used combined Cebu City & NCR tweets

All Fever vs Medically Related Fever Tweets
Used medically-relevant tweets
0
50
100
150
200
250
300
Nu
mb
er
Twe
ets
AllTweets TweetsMedRltd
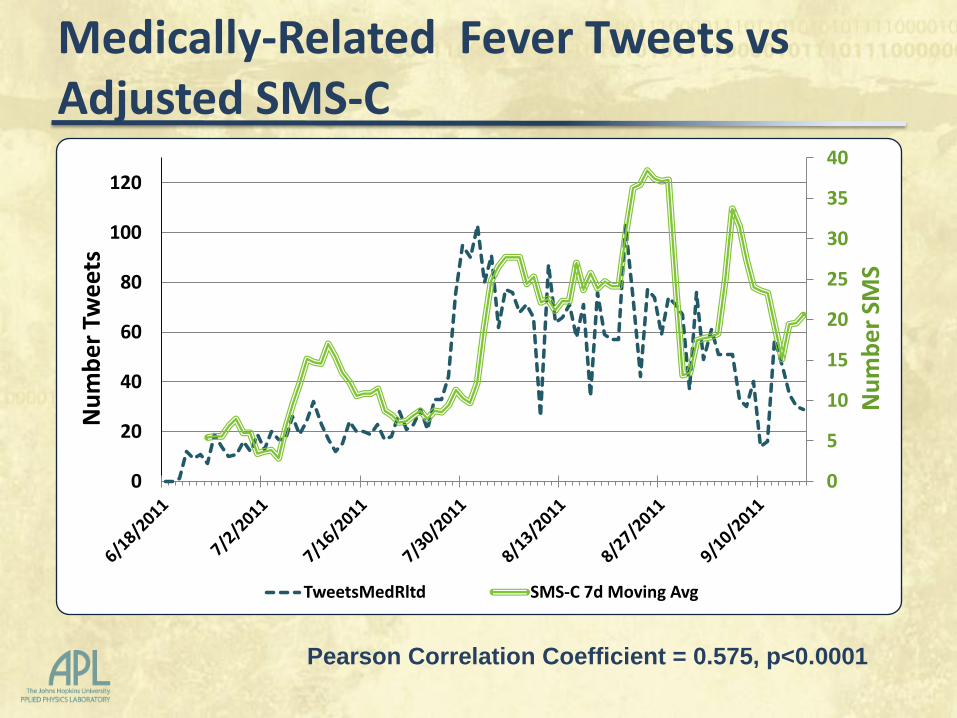
Medically-Related Fever Tweets vs Adjusted SMS-C
Pearson Correlation Coefficient = 0.575, p<0.0001
0
5
10
15
20
25
30
35
40
0
20
40
60
80
100
120
Nu
mb
er
SMS
Nu
mb
er
Twe
ets
TweetsMedRltd SMS-C 7d Moving Avg

Medically-Related Fever Tweets with 6 day Shift vs Adjusted SMS-C
Pearson Correlation Coefficient = 0.769, p<0.0001
0
5
10
15
20
25
30
35
40
0
20
40
60
80
100
Nu
mb
er
of
SMS
Nu
mb
er
Twe
ets/
SMS
TweetsMedRltd SMS-C 7d Moving Avg w/6d Shift

Medically–Related Fever Tweets vs Nat’l Reportable Disease (PIDSR-C&NCR)
Pearson Correlation Coefficient = 0.629, p<0.0001
0
50
100
150
200
250
300
Nu
mb
er
New
Cas
es
PIDSR-C&NCR MedRltdTweets

Medically-Related Fever Tweets w/12d Shift vs Nat’l Reportable Dengue (PIDSR-C&NCR)
Pearson Correlation Coefficient = 0.829, p<0.0001
0
50
100
150
200
250
300
Nu
mb
er
New
Cas
es
Tweets-Med Rltd-12d Shift PIDSR-C&NCR

Limitations
• Limitations on ‘free’ tweets from Twitter • Issues with the Twitter data feed
necessitated combining tweets from Cebu City and NCR

Conclusions
• Twitter leads SMS-C data by 6 days and PIDSR-C&NCR data by 12 days
• This suggests that Twitter data may be a useful and timely source of data for automated disease surveillance
• Further investigation is needed – Repetition with 2012 data to resolve data
collection errors – More sophisticated machine learning techniques – Implementation into an electronic surveillance
system

SAGES Team Members JHU/APL Sheri Lewis Jacqueline Coberly Brian Feighner Rekha Holtry Vivian Hung Richard Wojcik Timothy Campbell Adjoa Poku Charles Hodanics Howard Burkom
AFRIMS In-Kyu Yoon John Mark Velasco Maria Theresa Alera Agnes Tomayo
NEC Enrique Roque
CCHO Ilya A. Tac-an Abellanosa Durinda Macasoco


Related Research • Carneiro, H. A., & Mylonakis, E. (2009. Google trends: a web-based tool for real-
time surveillance of disease outbreaks. Clinical infectious diseases : an official publication of the Infectious Diseases Society of America, 49(10, 1557-64. Oxford University Press. doi: 10.1086/630200.
• Gomide, J., Veloso, A., Meira, W., Almeida, V., Benevenuto, F., Ferraz, F., et al. (2011. Dengue surveillance based on a computational model of spatio-temporal locality of Twitter. Web Science 2011.
• Paul, M. J., & Dredze, M. (2011. You Are What You Tweet : Analyzing Twitter for Public Health. Proceedings of the Fifth International Conference on Weblogs and Social Media. international conference on weblogs and social media (pp. 265-272.
• Sgnorini, A., Segre, A. M., & Polgreen, P. M. (2011. The Use of Twitter to Track Levels of Disease Activity and Public Concern in the U.S. during the Influenza A H1N1 Pandemic. PloS one, 6(5, e19467. doi: 10.1371/journal.pone.0019467.