Embed Size (px)
Citation preview
HAL Id: hal-00640859https://hal.archives-ouvertes.fr/hal-00640859
Submitted on 14 Nov 2011
HAL is a multi-disciplinary open accessarchive for the deposit and dissemination of sci-entific research documents, whether they are pub-lished or not. The documents may come fromteaching and research institutions in France orabroad, or from public or private research centers.
L’archive ouverte pluridisciplinaire HAL, estdestinée au dépôt et à la diffusion de documentsscientifiques de niveau recherche, publiés ou non,émanant des établissements d’enseignement et derecherche français ou étrangers, des laboratoirespublics ou privés.
Using Quad-Pol and Single-Pol RADARSAT-2 Data forMonitoring Cold Alpine and Outlet Antarctic Glaciers
Olivier Harant, Emmanuel Le Meur, Gabriel Vasile, Lionel Bombrun, LaurentFerro-Famil, Michel Gay, Emmanuel Trouvé
To cite this version:Olivier Harant, Emmanuel Le Meur, Gabriel Vasile, Lionel Bombrun, Laurent Ferro-Famil, et al..Using Quad-Pol and Single-Pol RADARSAT-2 Data for Monitoring Cold Alpine and Outlet Antarc-tic Glaciers. POLinSAR 2011 - 5th International Workshop on Science and Applications of SARPolarimetry and Polarimetric Interferometry, Jan 2011, Frascati, Italy. 6 p. �hal-00640859�
USING QUAD-POL AND SINGLE-POL RADARSAT-2 DATA FOR MONITORING A LPINEAND OUTLET ANTARCTIC GLACIERS
Olivier Harant 1,3, Emmanuel Le Meur4, Gabriel Vasile1, Lionel Bombrun2, Laurent Ferro-Famil 3, Michel Gay1,Emmanuel Trouve5
1 Grenoble-Image-sPeech-Signal-Automatics LabGIPSA-lab DIS/SIGMAPHY, CNRS
Grenoble INP, 961 rue de la Houille Blanche, BP 46 38402 Grenoble, France{olivier.harant|gabriel.vasile|michel.gay}@gipsa-lab.grenoble-inp.fr
2 Universite de Bordeaux, UB1, IPB, ENSEIRB-Matmeca, Laboratoire IMSUMR 5218, Groupe Signal et Image, Talence, France
3 Institute of Electronics and Telecommunications RennesIETR SAPHIR, CNRS
Universite de Rennes 1, Bat. 11D, 263 avenue du General Leclerc 35042 Rennes, [email protected]
4 Laboratoire de glaciologie et geophysique de l’environnement, CNRS54, rue Moliere, BP 96, 38402 Saint Martin d’Heres, France
5 Laboratoire d’Informatique, Systemes, Traitement de l’Information et de la ConnaissanceLISTIC, CNRS
Polytech’Savoie, 74944 Annecy le Vieux, [email protected]
ABSTRACT
This paper presents some applications of the MaximumLikelihood (ML) texture tracking on displacement esti-mation of some alpine and antarctic glaciers surfaces.This method is adapted to the statistical characteristic ofthe new High Resolution (HR) Polarimetric SAR (Pol-SAR) data. The ML texture tracking method is firstlyreminded and a statistical model of HR PolSAR data isexplained. The main part of this paper is focused on theapplication of this method on glaciers monitoring. Threedifferent glaciers have been chosen to test the algorithm:a cold alpine glacier, a temperate alpine glacier and anoutlet antarctic glacier. The accuracy and limits of themethod are highlighted in each case and results applica-tion is discussed.
Key words: Polarimetric SAR, Texture modeling, MLtracking, glacier.
1. INTRODUCTION
The glaciers are changing due to climate evolution. Theconsequences of the glaciers reaction are of importancein landscape evolution and may increase some naturalrisks. The antarctic glaciers are directly representativeof the ice cap evolution and some alpine glaciers mayrepresent a threat for some villages in the valleys.SAR imagery and more particularly the new HR SARsensors represent a powerful tool helpful in monitoringglaciers. Considering the complexity of the glaciersand their high temporal and spatial variability, SARinterferometry may often be faced to some speckledecorrelation. Hence with the new generation of HRPolSAR sensors, the images reach a high level ofdetails and tracking methods have to be focused on anaccurate statistical modeling. In reconsidering the usualhomogeneous PolSAR clutter model, a new ML trackingmethod has been derived from the intensity-basedmethod introduced by [1]. Heterogeneous clutter modelshave therefore recently been studied with PolSAR datathrough the SIRV processes [2]. This paper is focusedon the application of this new ML tracking algorithmpreviously introduced in [3] on different kind of glaciers
________________________________________________ Proc. ‘PolInSAR 5th Int. Workshop on Science and Applications of SAR Polarimetry and Polarimetric Interferometry’, Frascati, Italy, 24–28 January 2011 (ESA SP-695, March 2011)
using various polarimetric and non-polarimetric images.The first part is dedicated to the method scheme. Eachstep is detailed from the texture extraction to the simi-larity criteria definition. The second part of this paperpresents some displacement fields estimations results onRADARSAT-2 (RS2) data acquired on three glaciers.
2. DISPLACEMENT ESTIMATION
The displacement estimation based on the ML trackingmethod in case of HR PolSAR data may be decomposedin different steps as it is illustrated in Fig. 1. First of all,the texture componentτ of these PolSAR data must beextracted through a SIRV process.
2.1. SIRV model
The target vectork can be decomposed as the prod-uct of a square root of a positive random variableτ(representing the texture) with an independent complexGaussian vectorz: k =
√τ z. z is zero mean and have
a covariance matrix[M ] = E{zzH} (representing thespeckle), where the superscriptH denotes the complexconjugate transposition andE{·} the mathematicalexpectation.
Here is briefly described the SIRV estimation schemewhich is one way to estimate the texture componentτ .The principle is an iterative process which estimates bothτ and the normalized covariance matrix[M ].For a given covariance matrix[M ], the ML estimator ofthe texture parameterτ for the pixeli (τi) is given by:
τi =kHi [M ]−1
ki
p, (1)
wherep is the dimension of the target scattering vectork (p = 3 in the reciprocal case). For sake of simplicity,in this study the texture component is approximated toa deterministic case. Under this hypothesis, the MLestimator of[M ] is solution of:
[MML] = f([MML]) =p
N
N∑
i=1
kikHi
kHi [MML]−1ki
=p
N
N∑
i=1
zizHi
zHi [MML]−1zi
.
(2)
For more details about the SIRV estimation scheme,reader may refer to [2].
2.2. Texture modeling
After having extracted the texture componentτ , a correctstatistical description must be found to modelτ in order
to derive an accurate similarity criterion. Previous stud-ies [4] have exhibited the relevance of the Fisher Proba-bility Density Funvtion (PDF) for modelingτ :
pτ (τ) = F [m,L,M] =Γ(L+M)
Γ(L)Γ(M)
LMm
( LτMm
)L−1
(
1 +LτMm
)L+M
(3)wherem is a scale parameter,L andM are two shapeparameters.
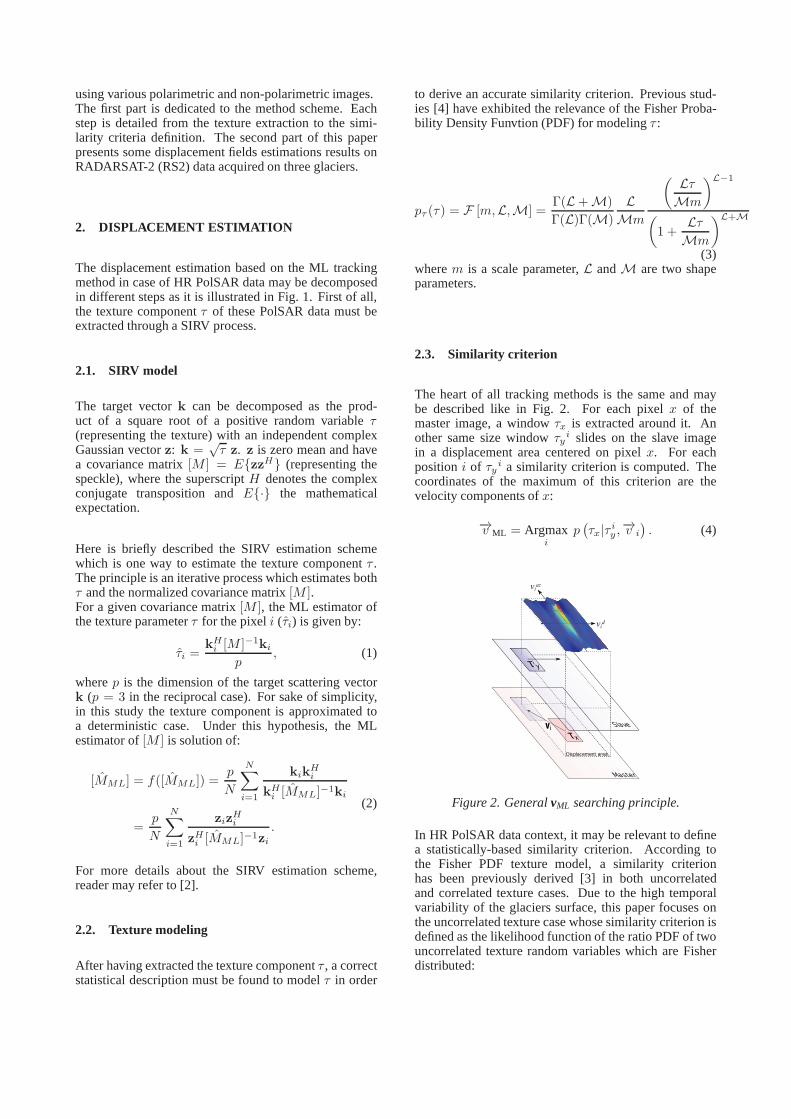
2.3. Similarity criterion
The heart of all tracking methods is the same and maybe described like in Fig. 2. For each pixelx of themaster image, a windowτx is extracted around it. Another same size windowτyi slides on the slave imagein a displacement area centered on pixelx. For eachpositioni of τyi a similarity criterion is computed. Thecoordinates of the maximum of this criterion are thevelocity components ofx:
−→v ML = Argmaxi
p(
τx|τ iy ,−→v i
)
. (4)
τx
τiy
vid
viaz
vi
Figure 2. GeneralvML searching principle.
In HR PolSAR data context, it may be relevant to definea statistically-based similarity criterion. According tothe Fisher PDF texture model, a similarity criterionhas been previously derived [3] in both uncorrelatedand correlated texture cases. Due to the high temporalvariability of the glaciers surface, this paper focuses onthe uncorrelated texture case whose similarity criterion isdefined as the likelihood function of the ratio PDF of twouncorrelated texture random variables which are Fisherdistributed:
τSIRVk
τk
HH
VV
HV
z
MODELING
Vx
Vy
τx
τy
ML
Displacement Estimation
Flow Constraint
High Res. PolSAR data
τ
Hierarchical
Segmentation
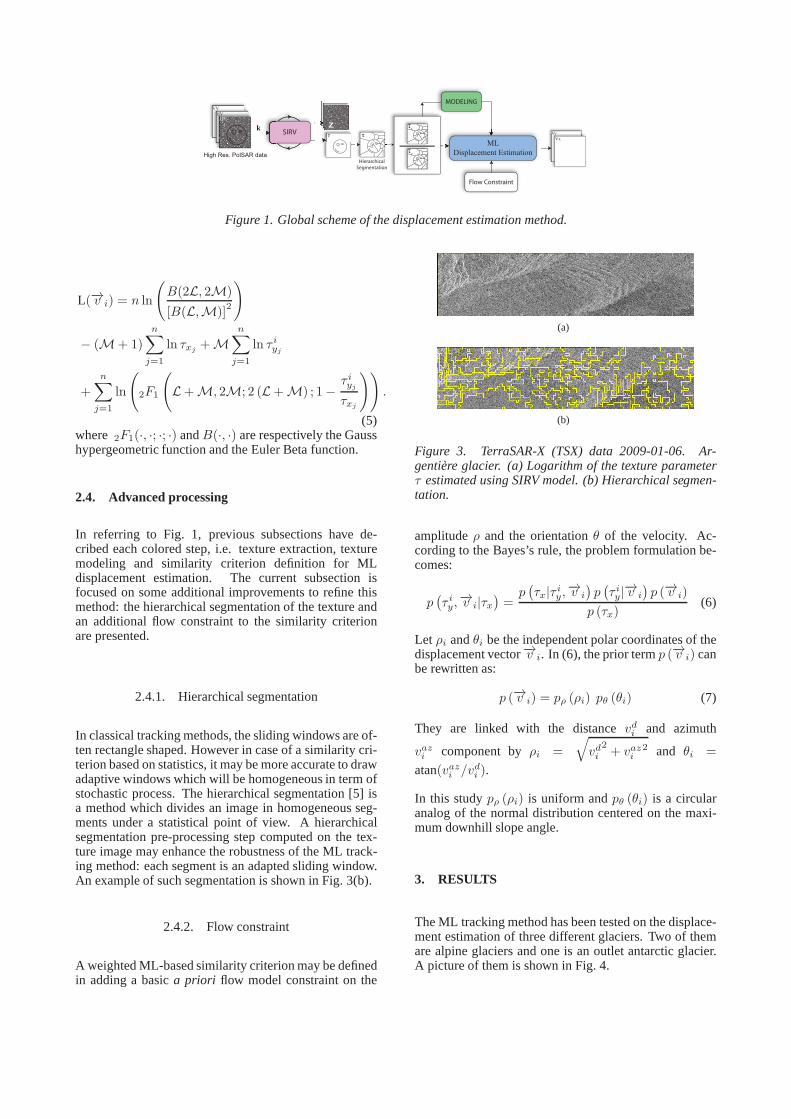
Figure 1. Global scheme of the displacement estimation method.
L(−→v i) = n ln
(
B(2L, 2M)
[B(L,M)]2
)
− (M+ 1)
n∑
j=1
ln τxj+M
n∑
j=1
ln τ iyj
+
n∑
j=1
ln
(
2F1
(
L+M, 2M; 2 (L+M) ; 1−τ iyj
τxj
))
.
(5)where 2F1(·, ·; ·; ·) andB(·, ·) are respectively the Gausshypergeometric function and the Euler Beta function.
2.4. Advanced processing
In referring to Fig. 1, previous subsections have de-cribed each colored step, i.e. texture extraction, texturemodeling and similarity criterion definition for MLdisplacement estimation. The current subsection isfocused on some additional improvements to refine thismethod: the hierarchical segmentation of the texture andan additional flow constraint to the similarity criterionare presented.
2.4.1. Hierarchical segmentation
In classical tracking methods, the sliding windows are of-ten rectangle shaped. However in case of a similarity cri-terion based on statistics, it may be more accurate to drawadaptive windows which will be homogeneous in term ofstochastic process. The hierarchical segmentation [5] isa method which divides an image in homogeneous seg-ments under a statistical point of view. A hierarchicalsegmentation pre-processing step computed on the tex-ture image may enhance the robustness of the ML track-ing method: each segment is an adapted sliding window.An example of such segmentation is shown in Fig. 3(b).
2.4.2. Flow constraint
A weighted ML-based similarity criterion may be definedin adding a basica priori flow model constraint on the
(a)
(b)
Figure 3. TerraSAR-X (TSX) data 2009-01-06. Ar-gentiere glacier. (a) Logarithm of the texture parameterτ estimated using SIRV model. (b) Hierarchical segmen-tation.
amplitudeρ and the orientationθ of the velocity. Ac-cording to the Bayes’s rule, the problem formulation be-comes:
p(
τ iy,−→v i|τx
)
=p(
τx|τ iy,−→v i
)
p(
τ iy|−→v i
)
p (−→v i)
p (τx)(6)
Let ρi andθi be the independent polar coordinates of thedisplacement vector−→v i. In (6), the prior termp (−→v i) canbe rewritten as:
p (−→v i) = pρ (ρi) pθ (θi) (7)
They are linked with the distancevdi and azimuth
vazi component byρi =
√
vdi2+ vazi
2 and θi =
atan(vazi /vdi ).
In this studypρ (ρi) is uniform andpθ (θi) is a circularanalog of the normal distribution centered on the maxi-mum downhill slope angle.
3. RESULTS
The ML tracking method has been tested on the displace-ment estimation of three different glaciers. Two of themare alpine glaciers and one is an outlet antarctic glacier.A picture of them is shown in Fig. 4.
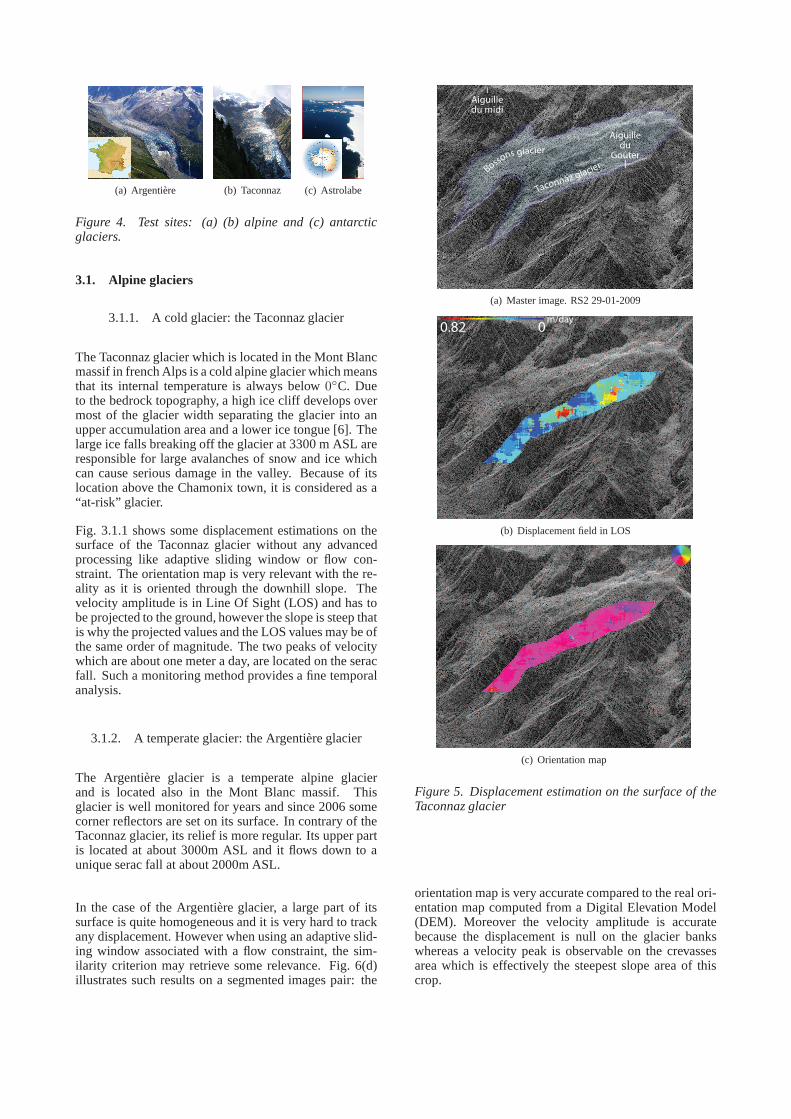
(a) Argentiere (b) Taconnaz (c) Astrolabe
Figure 4. Test sites: (a) (b) alpine and (c) antarcticglaciers.
3.1. Alpine glaciers
3.1.1. A cold glacier: the Taconnaz glacier
The Taconnaz glacier which is located in the Mont Blancmassif in french Alps is a cold alpine glacier which meansthat its internal temperature is always below0◦C. Dueto the bedrock topography, a high ice cliff develops overmost of the glacier width separating the glacier into anupper accumulation area and a lower ice tongue [6]. Thelarge ice falls breaking off the glacier at 3300 m ASL areresponsible for large avalanches of snow and ice whichcan cause serious damage in the valley. Because of itslocation above the Chamonix town, it is considered as a“at-risk” glacier.
Fig. 3.1.1 shows some displacement estimations on thesurface of the Taconnaz glacier without any advancedprocessing like adaptive sliding window or flow con-straint. The orientation map is very relevant with the re-ality as it is oriented through the downhill slope. Thevelocity amplitude is in Line Of Sight (LOS) and has tobe projected to the ground, however the slope is steep thatis why the projected values and the LOS values may be ofthe same order of magnitude. The two peaks of velocitywhich are about one meter a day, are located on the seracfall. Such a monitoring method provides a fine temporalanalysis.
3.1.2. A temperate glacier: the Argentiere glacier
The Argentiere glacier is a temperate alpine glacierand is located also in the Mont Blanc massif. Thisglacier is well monitored for years and since 2006 somecorner reflectors are set on its surface. In contrary of theTaconnaz glacier, its relief is more regular. Its upper partis located at about 3000m ASL and it flows down to aunique serac fall at about 2000m ASL.
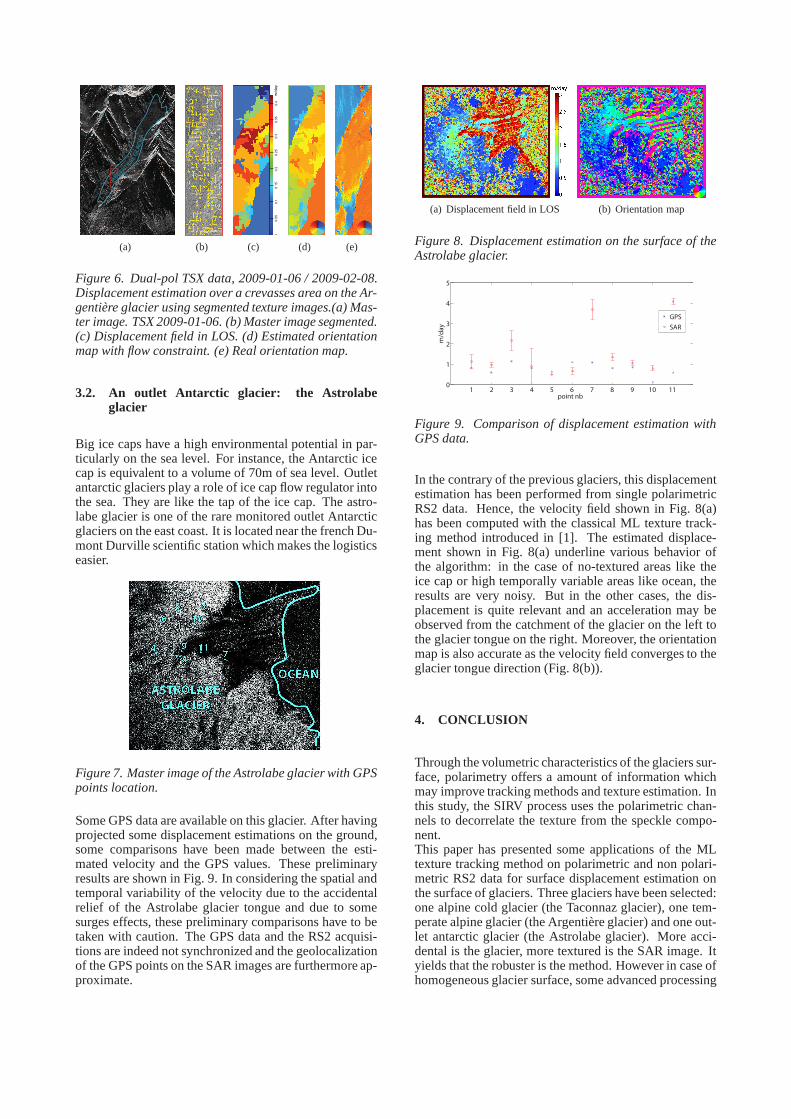
In the case of the Argentiere glacier, a large part of itssurface is quite homogeneous and it is very hard to trackany displacement. However when using an adaptive slid-ing window associated with a flow constraint, the sim-ilarity criterion may retrieve some relevance. Fig. 6(d)illustrates such results on a segmented images pair: the
Aiguilledu
Goûter
Taconnaz glacierBossons glacier
Aiguilledu midi
(a) Master image. RS2 29-01-2009
00.82m/day
(b) Displacement field in LOS
(c) Orientation map
Figure 5. Displacement estimation on the surface of theTaconnaz glacier
orientation map is very accurate compared to the real ori-entation map computed from a Digital Elevation Model(DEM). Moreover the velocity amplitude is accuratebecause the displacement is null on the glacier bankswhereas a velocity peak is observable on the crevassesarea which is effectively the steepest slope area of thiscrop.
ARGENTIE
RE G
LAC
IER
(a) (b) (c) (d) (e)
Figure 6. Dual-pol TSX data, 2009-01-06 / 2009-02-08.Displacement estimation over a crevasses area on the Ar-gentiere glacier using segmented texture images.(a) Mas-ter image. TSX 2009-01-06. (b) Master image segmented.(c) Displacement field in LOS. (d) Estimated orientationmap with flow constraint. (e) Real orientation map.
3.2. An outlet Antarctic glacier: the Astrolabeglacier
Big ice caps have a high environmental potential in par-ticularly on the sea level. For instance, the Antarctic icecap is equivalent to a volume of 70m of sea level. Outletantarctic glaciers play a role of ice cap flow regulator intothe sea. They are like the tap of the ice cap. The astro-labe glacier is one of the rare monitored outlet Antarcticglaciers on the east coast. It is located near the french Du-mont Durville scientific station which makes the logisticseasier.
Figure 7. Master image of the Astrolabe glacier with GPSpoints location.
Some GPS data are available on this glacier. After havingprojected some displacement estimations on the ground,some comparisons have been made between the esti-mated velocity and the GPS values. These preliminaryresults are shown in Fig. 9. In considering the spatial andtemporal variability of the velocity due to the accidentalrelief of the Astrolabe glacier tongue and due to somesurges effects, these preliminary comparisons have to betaken with caution. The GPS data and the RS2 acquisi-tions are indeed not synchronized and the geolocalizationof the GPS points on the SAR images are furthermore ap-proximate.
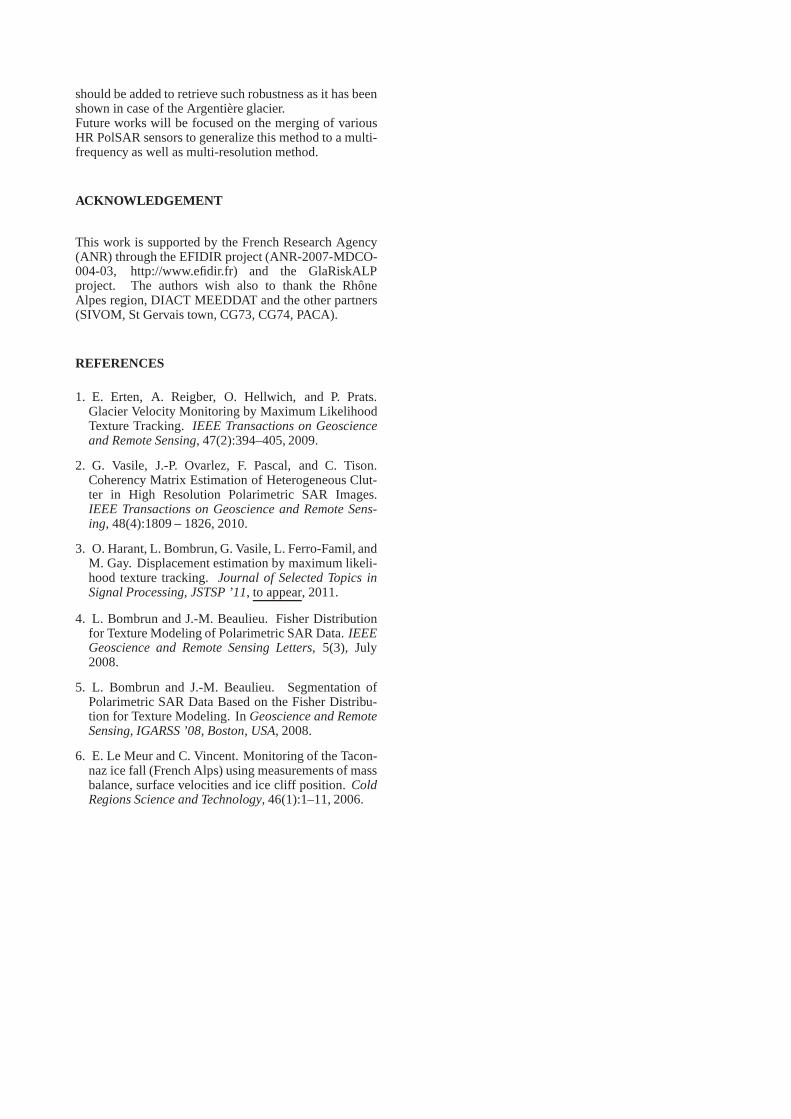
(a) Displacement field in LOS (b) Orientation map
Figure 8. Displacement estimation on the surface of theAstrolabe glacier.
2 4 6 8 100
1
2
3
4
5
m/d
ay
point nb
GPS
SAR
1 3 5 7 9 11
Figure 9. Comparison of displacement estimation withGPS data.
In the contrary of the previous glaciers, this displacementestimation has been performed from single polarimetricRS2 data. Hence, the velocity field shown in Fig. 8(a)has been computed with the classical ML texture track-ing method introduced in [1]. The estimated displace-ment shown in Fig. 8(a) underline various behavior ofthe algorithm: in the case of no-textured areas like theice cap or high temporally variable areas like ocean, theresults are very noisy. But in the other cases, the dis-placement is quite relevant and an acceleration may beobserved from the catchment of the glacier on the left tothe glacier tongue on the right. Moreover, the orientationmap is also accurate as the velocity field converges to theglacier tongue direction (Fig. 8(b)).
4. CONCLUSION
Through the volumetric characteristics of the glaciers sur-face, polarimetry offers a amount of information whichmay improve tracking methods and texture estimation. Inthis study, the SIRV process uses the polarimetric chan-nels to decorrelate the texture from the speckle compo-nent.This paper has presented some applications of the MLtexture tracking method on polarimetric and non polari-metric RS2 data for surface displacement estimation onthe surface of glaciers. Three glaciers have been selected:one alpine cold glacier (the Taconnaz glacier), one tem-perate alpine glacier (the Argentiere glacier) and one out-let antarctic glacier (the Astrolabe glacier). More acci-dental is the glacier, more textured is the SAR image. Ityields that the robuster is the method. However in case ofhomogeneous glacier surface, some advanced processing
should be added to retrieve such robustness as it has beenshown in case of the Argentiere glacier.Future works will be focused on the merging of variousHR PolSAR sensors to generalize this method to a multi-frequency as well as multi-resolution method.
ACKNOWLEDGEMENT
This work is supported by the French Research Agency(ANR) through the EFIDIR project (ANR-2007-MDCO-004-03, http://www.efidir.fr) and the GlaRiskALPproject. The authors wish also to thank the RhoneAlpes region, DIACT MEEDDAT and the other partners(SIVOM, St Gervais town, CG73, CG74, PACA).
REFERENCES
1. E. Erten, A. Reigber, O. Hellwich, and P. Prats.Glacier Velocity Monitoring by Maximum LikelihoodTexture Tracking.IEEE Transactions on Geoscienceand Remote Sensing, 47(2):394–405, 2009.
2. G. Vasile, J.-P. Ovarlez, F. Pascal, and C. Tison.Coherency Matrix Estimation of Heterogeneous Clut-ter in High Resolution Polarimetric SAR Images.IEEE Transactions on Geoscience and Remote Sens-ing, 48(4):1809 – 1826, 2010.
3. O. Harant, L. Bombrun, G. Vasile, L. Ferro-Famil, andM. Gay. Displacement estimation by maximum likeli-hood texture tracking.Journal of Selected Topics inSignal Processing, JSTSP ’11, to appear, 2011.
4. L. Bombrun and J.-M. Beaulieu. Fisher Distributionfor Texture Modeling of Polarimetric SAR Data.IEEEGeoscience and Remote Sensing Letters, 5(3), July2008.
5. L. Bombrun and J.-M. Beaulieu. Segmentation ofPolarimetric SAR Data Based on the Fisher Distribu-tion for Texture Modeling. InGeoscience and RemoteSensing, IGARSS ’08, Boston, USA, 2008.
6. E. Le Meur and C. Vincent. Monitoring of the Tacon-naz ice fall (French Alps) using measurements of massbalance, surface velocities and ice cliff position.ColdRegions Science and Technology, 46(1):1–11, 2006.