Embed Size (px)
Citation preview
Using Photoelectron Spectroscopy and Quantum Mechanics toDetermine d‑Band Energies of Metals for Catalytic ApplicationsTimo Hofmann,†,* Ted H. Yu,‡ Michael Folse,† Lothar Weinhardt,†,§,⊥,¶ Marcus Bar,†,#,∇
Yufeng Zhang,†,○ Boris V. Merinov,‡ Deborah J. Myers,◆ William A. Goddard, III,‡
and Clemens Heske†,⊥,¶,■,*†Department of Chemistry, University of Nevada, Las Vegas (UNLV), 4505 S. Maryland Parkway, Las Vegas, Nevada 89154-4003,United States‡Materials and Process Simulation Center, m/c 139-74, California Institute of Technology, 1200 East California Boulevard, Pasadena,California 91125, United States§Experimentelle Physik VII, Universitat Wurzburg, Am Hubland, D-97074 Wurzburg, Germany⊥Institute for Photon Science and Synchrotron Radiation and ¶ANKA Synchrotron Radiation Facility, Karlsruhe Institute ofTechnology (KIT), Hermann-v.-Helmholtz-Platz 1, 76344 Eggenstein-Leopoldshafen, Germany#Solar Energy Research, Helmholtz-Zentrum Berlin fur Materialien und Energie GmbH, Hahn-Meitner-Platz 1, D-14109 Berlin,Germany∇Institut fur Physik und Chemie, Brandenburgische Technische Universitat Cottbus, Konrad-Wachsmann-Allee 1, D-03046 Cottbus,Germany○Department of Physics, Xiamen University, 422 Si-Ming-Nan-Lu, Xiamen, Fujian, 361005, People’s Republic of China◆Chemical Sciences and Engineering Division, Argonne National Laboratory, 9700 S. Cass Avenue, Argonne, Illinois 60439, UnitedStates■Institute for Chemical Technology and Polymer Chemistry, Karlsruhe Institute of Technology (KIT), Engesserstrasse 18/20, 76128Karlsruhe, Germany
*S Supporting Information
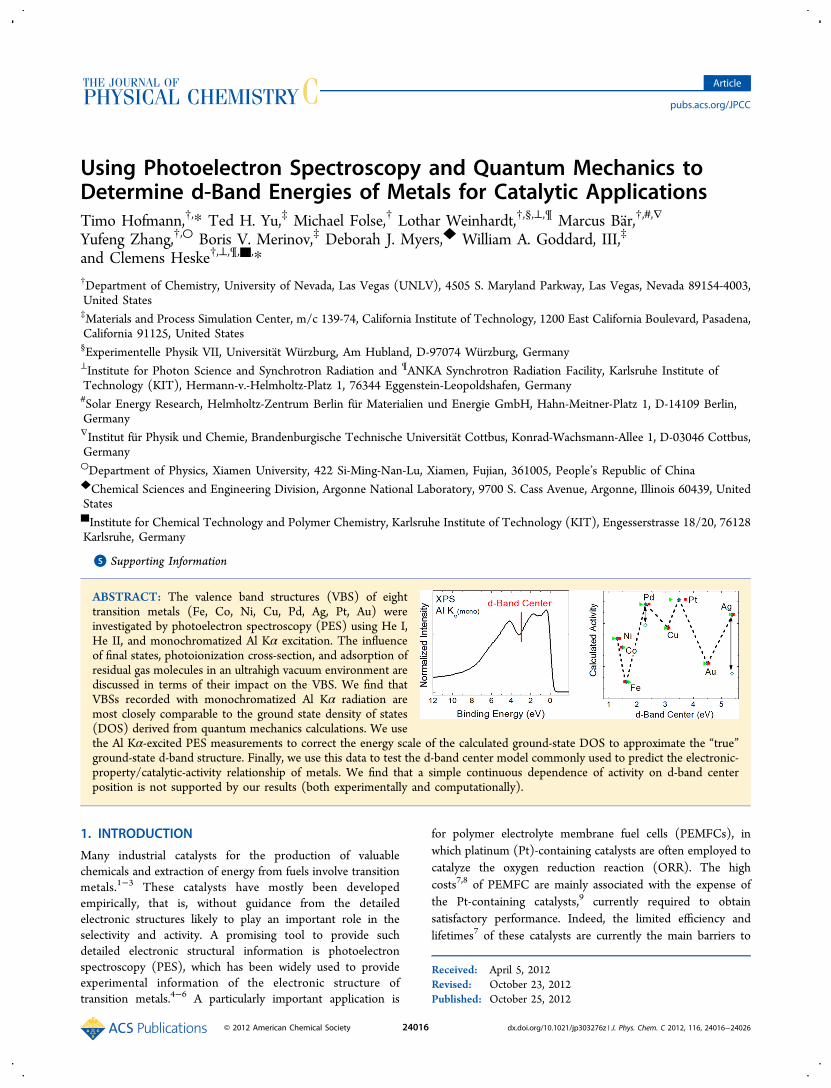
ABSTRACT: The valence band structures (VBS) of eighttransition metals (Fe, Co, Ni, Cu, Pd, Ag, Pt, Au) wereinvestigated by photoelectron spectroscopy (PES) using He I,He II, and monochromatized Al Kα excitation. The influenceof final states, photoionization cross-section, and adsorption ofresidual gas molecules in an ultrahigh vacuum environment arediscussed in terms of their impact on the VBS. We find thatVBSs recorded with monochromatized Al Kα radiation aremost closely comparable to the ground state density of states(DOS) derived from quantum mechanics calculations. We usethe Al Kα-excited PES measurements to correct the energy scale of the calculated ground-state DOS to approximate the “true”ground-state d-band structure. Finally, we use this data to test the d-band center model commonly used to predict the electronic-property/catalytic-activity relationship of metals. We find that a simple continuous dependence of activity on d-band centerposition is not supported by our results (both experimentally and computationally).
1. INTRODUCTION
Many industrial catalysts for the production of valuablechemicals and extraction of energy from fuels involve transitionmetals.1−3 These catalysts have mostly been developedempirically, that is, without guidance from the detailedelectronic structures likely to play an important role in theselectivity and activity. A promising tool to provide suchdetailed electronic structural information is photoelectronspectroscopy (PES), which has been widely used to provideexperimental information of the electronic structure oftransition metals.4−6 A particularly important application is
for polymer electrolyte membrane fuel cells (PEMFCs), inwhich platinum (Pt)-containing catalysts are often employed tocatalyze the oxygen reduction reaction (ORR). The highcosts7,8 of PEMFC are mainly associated with the expense ofthe Pt-containing catalysts,9 currently required to obtainsatisfactory performance. Indeed, the limited efficiency andlifetimes7 of these catalysts are currently the main barriers to
Received: April 5, 2012Revised: October 23, 2012Published: October 25, 2012
Article
pubs.acs.org/JPCC
© 2012 American Chemical Society 24016 dx.doi.org/10.1021/jp303276z | J. Phys. Chem. C 2012, 116, 24016−24026
commercialization. This has triggered vast research efforts tofind a catalytic material that combines high catalytic activitywith low cost and high stability. A multitude of pathways toimprove current catalysts and to explore novel catalyticmaterials has been pursued, ranging from the reduction ofthe utilized amount of Pt10−12 to the synthesis of non-noblecatalysts13 and nanocatalysts of particular shape14 and/or with adeliberate mixture of nonplatinum metal constituents.15−17
These developments have often been guided by theoreticalcalculations to predict the catalytic activity of a particularsurface.18−25 Most notably, Hammer and Nørskov developedthe “d-band center model” that correlates the electronicstructure of a (transition) metal, through calculation of theweighted mean energy of its d-band (“d-band center”), to itsreactivity.18,22,23,26 Indeed, this model is in excellent agreementwith some experimental results,27−29 while some authors findsignificant differences.25,30,31 The criticism typically relates tothe poor correlation between the d-band center and reactivitymeasures (or changes in the reactivity measures) inconsistentwith the model predictions, while the published d-band centervalues are often uncontested. Centroid values reported in theliterature, however, often suffer from poor correlation betweenexperimental and theoretical29 values. Furthermore, the properdefinition, experimental determination, and analysis of the d-band center is unclear and varies throughout literature, both forcomputational32 and experimental results.It is hence the purpose of the present paper (1) to perform a
careful and detailed analysis of photoelectron spectra recordedwith various lab-based excitation sources for a range of metalsrelevant to catalysis, (2) to compare these with theoreticalground state density-of-states (DOS) calculations, (3) tocombine the experimental data and DOS calculations to derivethe “true” valence band structures (VBS) and thus to refinetheir d-band center energies, (4) to provide a detaileddiscussion on the methodology of measurement and analysisof d-band centers and compare them to values reported in theliterature and, finally, (5) to compare these d-band centers topublished catalytic activities, thereby providing an experiment-based analysis of the validity of the “d-band center model”.In section 2 we outline various details of the experimental
and theoretical methodologies. The results are analyzed anddiscussed in section 3, and d-band centers for all eight metalsare determined and compared to published catalytic activities.Finally, conclusions are presented in section 4.
2. EXPERIMENTAL AND THEORETICAL METHODS2.1. Experimental Methods. Polycrystalline metal foils
(purity of 99.9% or higher) were cleaned by Ar+ ion sputteringusing ion energies between 0.5 and 5 keV. Surface cleanlinesswas verified by recording Mg and Al Kα-excited PES detailspectra of the C 1s and O 1s energy region. Sputtering wascontinued until no or only trace amounts of carbon and oxygencould be detected on the sample surface. Valence band PESmeasurements were performed using He I (hν = 21.22 eV) andHe II (hν = 40.82 eV) ultraviolet excitation lines (ultravioletphotoelectron spectroscopy, “UPS”) and monochromatized AlKα (hν = 1486.58 eV) X-ray radiation (X-ray photoelectronspectroscopy, “XPS”). The UPS spectra were excited with aVacuum Generators (VG) He discharge source and recordedwith a SPECS PHOIBOS 150 MCD electron analyzer. ForUPS, a negative bias voltage of 12 or 15 V was applied to thesample to accelerate electrons of low kinetic energy andtherefore to allow for an accurate determination of the
secondary electron cutoff. The XPS spectra were excited witha Scienta MX650 X-ray source (consisting of an SAX-100 X-raysource and an XM-780 X-ray monochromator) and recordedwith a Scienta R4000 electron analyzer. The energy scale of thetwo electron spectrometers was calibrated using the kineticenergy positions of the most prominent photoemission lines ofcopper, silver, and gold.33 The experiments were performed intwo connected ultrahigh vacuum (UHV) systems at basepressures of 5 × 10⁻¹⁰ mbar or better.
2.2. Computational Methods. Periodic quantum mechan-ics (QM) calculations were carried out with the SeqQuestcode,34,35 which employs Gaussian basis functions at theoptimized double-ζ plus polarization level rather than theplane-wave basis often used in periodic systems. We used thePerdew−Becke−Ernzerhof (PBE) flavor36 of density functionaltheory (DFT) in the generalized gradient approximation(GGA)37,38 and allowed the up-spin orbitals to be optimizedindependently of the down-spin orbitals (spin-unrestrictedDFT). All calculations were performed with spin optimization.We used small core pseudopotentials with angular momentumprojections.39,40
The d-band structures were analyzed with the SeqQuestPost-Analysis Code35 and further broken down into to deg(dx2−y2, dr2−z2) and dt2g (dxy, dyz, dxz) orbitals. The DOS wasbroadened by convolution with a 0.5 eV fwhm Gaussianfunction to approximate the experimental and lifetime broad-ening of the spectra. Furthermore, the DOS was multiplied withthe Fermi function at 300 K to limit the description to occupiedelectronic states. Additional modifications to the energy axis ofthe DOS were performed, as described in detail in the Resultsand Discussion section.
3. RESULTS AND DISCUSSION
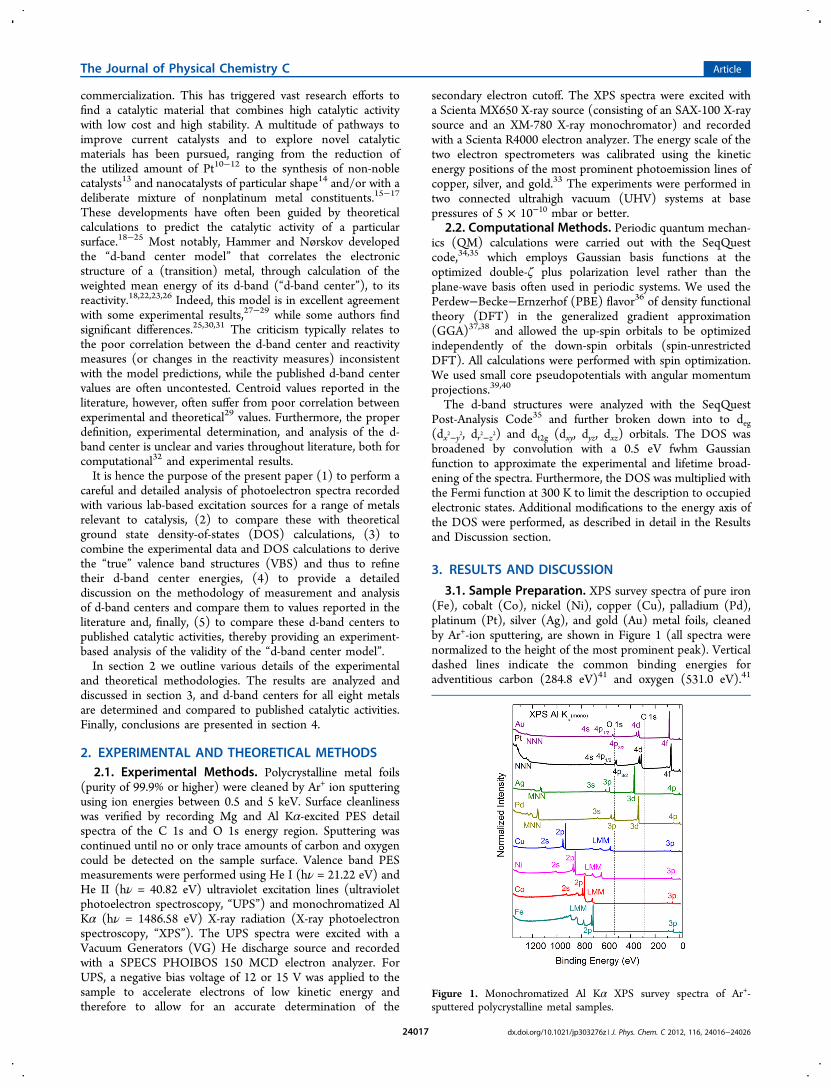
3.1. Sample Preparation. XPS survey spectra of pure iron(Fe), cobalt (Co), nickel (Ni), copper (Cu), palladium (Pd),platinum (Pt), silver (Ag), and gold (Au) metal foils, cleanedby Ar+-ion sputtering, are shown in Figure 1 (all spectra werenormalized to the height of the most prominent peak). Verticaldashed lines indicate the common binding energies foradventitious carbon (284.8 eV)41 and oxygen (531.0 eV).41
Figure 1. Monochromatized Al Kα XPS survey spectra of Ar+-sputtered polycrystalline metal samples.
The Journal of Physical Chemistry C Article
dx.doi.org/10.1021/jp303276z | J. Phys. Chem. C 2012, 116, 24016−2402624017
The absence of spectral intensity along these lines shows thatthe samples were successfully cleaned. XPS spectra of the C 1sand O 1s regions taken after the UPS measurements (notshown here) reveal a small carbon contamination for all metalsurfaces (Pt ≈ 5−8, Fe ≈ 3, Ni ≈ 1−2, Co ≈ 3−6, Pd ≈ 0, Ag≈ 0−1, Au ≈ 0−3 atom %). Furthermore, the oxygen-relatedsignals were found to be low on all metals (Pt ≈ 0−5, Fe ≈ 4,Ni ≈ 0−1, Co ≈ 2−7, Pd ≈ 0, Ag ≈ 0−1, Au ≈ 0 atom %). Theremaining adsorbates are attributed to the adsorption ofresidual gases at background pressures of 10−10 mbar42,43 and/or to carbon and oxygen atoms embedded in the surface of thefoil. As will be discussed later, such adsorbates can influence thespectral weight distribution of photoemission spectra, inparticular when taken in a very surface-sensitive mode (i.e.,using UPS).In addition to monitoring surface cleanliness using XPS core
level spectra, UV excitation was employed to determine thesecondary electron cutoff and thus the work function of a set ofsimilarly cleaned metal foils. The presence of small amounts ofcontaminants generally impacts the surface dipole and hencethe work function significantly (see, e.g., refs 44 and 45). Table1 lists the work functions of the metals as determined by UPS
using He I excitation. We find that the work functions of allmetals are well within the range of literature values (thirdcolumn in Table 1). The good agreement of the work functionswith reported values suggests that the here-studied surfaces canserve as “clean” model systems to derive the electronic valencestructure.3.2. Derivation of d-band Centers and the Impact of
Photon Energy Variation and Surface Adsorbates. For aproper comparison of the various PES-based approaches tostudy the electronic structure of transition metals, it is necessaryto review the inherent experimental challenges, such that themost meaningful method for evaluation of the d-band structurecan be derived. We start by comparing the VBS of the metalfoils, as measured by UPS and XPS, in Figure 2. Panels a and bgive the valence band spectra taken with He I and He IIexcitation, respectively, while panel c shows the spectra takenwith monochromatized Al Kα radiation. Stars mark spectralcontributions associated with adsorbed species on the metalsurface (as will be discussed below), and short vertical lines givethe weighted average energy of the VBS (error bars are in therange of ±0.05 to ±0.25 eV and will be given in more detail inconjunction with Table 2 and Figure 5). This energy, which iscommonly associated with the d-band center (since s- and p-
contributions to the VBS are relatively small), is derived usingthe procedure outlined in ref 27. Since this procedure includesintegrals over the valence band region, the procedure fordefining background boundaries can lead to significantvariability in the derived average energy. The contribution ofthe background that lies within the integration boundaries isshown as a thin line underneath each spectrum; itsdetermination will be discussed in the following.We start the discussion of proper quantification of the d-
band center by addressing the experimental challenges. A closerlook at Figure 2 reveals substantially varying spectral weightdistributions that reflect the energies and occupation of thevalence bands of the different metals and also the significantinfluence of the excitation energy. For example, all He I-excitedspectra (Figure 2a) and some of the He II-excited spectra(Figure 2b) exhibit a strong secondary electron background,which is noticeably reduced for the XPS spectra in Figure 2c.The region of interest, that is, the binding energy range ofcatalytically active states, is thus superimposed on the slope ofthe background, leading to challenges to properly separateactual states and background intensity. Furthermore, thespectral weight distributions obtained from He I, He II, andXPS reveal pronounced changes for all samples. This raises thequestion of which experimentally determined VBS is the bestchoice to determine the true d-band center for correlation withelectrochemical performance. As will be discussed below, weconclude that the use of X-ray excitation spectra is preferableover UV-based approaches.Photon-energy-dependent changes of the VBS can arise for
several reasons. First, variations in the single-electron final state(i.e., free electron state vs band-like character) can have asignificant impactVBSs generally change in width and relativeintensity ratios with excitation energy (see, e.g., ref 46 for astudy of Cu). In the UPS regime, the VBS is often discussed interms of final-state effects, which are responsible for theobserved line positions and intensities determined bytransition-matrix-element modulations,47 both because of theangular and radial parts of the transition matrix element.48 Also,the nature of the integration over the Brillouin zone (BZ) isimportant. In UPS, the low photon energies (and thus the lowphoton momentum) require the availability of suitable finalstates for transitions that are vertical in momentum space.49 InXPS, in contrast, the kinetic energy and thus the momentum(uncertainty) of the photoelectrons is so large that theexperiment probes the entire BZ in the final state, sincetransitions no longer need to be vertical. Furthermore, at thesehigh energies, the significantly larger number of states that arereduced back into the BZ will allow the transition to a finalstate at essentially any k-value. We further note that all foilsstudied are of a polycrystalline nature, and thus no predominantcrystal orientation is expected. If present, such an orientationcould lead to (significant) variations in the VBS, becausetransitions become dependent on the band structure (inparticular the availability of a suitable one-electron final state)along the respective crystal orientation.46 Again, this effect ismore pronounced for lower photon energies (lower photonmomenta). In addition, particular surface orientations havebeen found to strongly influence the catalytic activity due tochanges in the number of available adsorption sites and theirgeometry (see, e.g., ref 50 for the case of Pt).Second, cross section effects can also play a significant role in
the variation of the VBS. For example, “atomic-type” cross-section effects, where the cross-section varies strongly over a
Table 1. Work Functions (WF) of Polycrystalline MetalFoils, as Derived from Secondary Electron Cutoffs of He I-Excited Photoemission Spectraa
metal WF (eV) literature values (eV)
Fe 4.68 ± 0.10 4.5,49 4.67 (100),27,49 4.71 α-phase108 4.81 (111)27,49
Co 4.92 ± 0.10 4.89 α-phase,108 5.027,49
Ni 5.21 ± 0.10 5.04 (110),27 5.15,49 5.22 (100),27 5.35 (111)27
Cu 4.44 ± 0.10 4.46,109 4.48 (110),27 4.53 (112),27 4.65,49 4.94 (111),27 5.10 (100)27
Pd 5.19 ± 0.10 5.22,27,49 5.6 (111)27
Ag 4.30 ± 0.10 4.26,12 4.52 (110),27,49 4.64 (100),27,49 4.74 (111)27,49
Pt 5.59 ± 0.10 5.12 (331),27 5.22 (320),27 5.27,110 5.5,49 5.64,27
5.84 (110),27,49 5.93 (111)27,49
Au 5.26 ± 0.10 5.1,49 5.31 (111),27,49 5.37 (110),27,49 5.47 (100)27,49
aLiterature values are listed for single crystals (with surfaceorientations given in parentheses) and polycrystalline samples.
The Journal of Physical Chemistry C Article
dx.doi.org/10.1021/jp303276z | J. Phys. Chem. C 2012, 116, 24016−2402624018

small energy range at low photon energies, are well-known for4d-group and 5d-group elements (e.g., below 150 eV forAg46,51).Third, as already briefly mentioned, the spectral background
(slope and curvature) of inelastically scattered electrons alsogreatly influences the VBS and any numerical integrationthereof. The thin lines underneath each spectrum in Figure 2represent the background determined in the following manner.For spectral features with kinetic energies well above thesecondary electron peak, a Shirley background (whose intensitydepends on the selected energy range) was subtracted from themeasured spectrum.27 For spectra measured with He I,however, the overlap of the spectral features with the secondaryelectron peaks becomes strong, and hence an additionalbackground subtraction is necessary. In our case, we havesubtracted an exponential background prior to the removal of aShirley background, adding several additional (somewhatarbitrary) parameters in the spectral analysis.Fourth, variations of the photon energy and hence the kinetic
energy of the probed photoelectrons also leads to a variation ofthe electron inelastic mean free path (IMFP). This, in turn,varies the probed sample volume and the ratio of the samplesurface and bulk contributions to the overall spectrum.For polycrystalline and/or macroscopically disordered
samples, it is not likely to find true surface states or evensurface resonancesthese are generally only found on single-crystalline surfaces with long-range lateral order. In contrast,surface defects might be present and play a role on all surfaces,in particular those of polycrystalline samples (as studied here)and nanoparticles (as most commonly found for real-worldcatalysts). Hence, the VBS of the here-studied surfacesprimarily refers to the bulk states, which exponentially decayinto the vacuum at the surface, augmented by contributionsfrom surface defects and, possibly, adsorbates. If surfaceadsorbates are present (see below), then photoemission
experiments with kinetic energies near the minimum of theIMFP distribution52−55 will contain a larger contribution ofsuch spurious surface effects.It is important to note that both UPS and XPS measure the
bulk states that exist throughout the crystal and also dominatethe electronic structure at the surface.56−58 In other words, theDOS at the surface is made up of contributions originatingfrom the outermost surface layer, as well as deeper-lying layersdue to the delocalized nature of electrons in the valence band(for completion, we note that, in contrast, “surface core levelshifts” indeed originate from localized core levels at theoutermost surface but do not involve delocalized valencestates). For the first atomic layer of metals, a narrowing of bulkbands due to the reduced number of neighboring atoms hasbeen reported,59,60 while the second layer is often regarded asrepresentative of the bulk.61 In PES measurements, whicheffectively consist of an exponentially weighted integration overthe probing depth, the first atomic layer accounts for the largestfraction of the overall signal, while the contributions ofsubsequent atomic layers are (exponentially) attenuated.Hence, VBS measured with PES is most closely related tothe surface DOS responsible for the catalytic activity of amaterial.Finally, adsorbates such as residual carbon and oxygen
species on the surface need to be considered. In comparing theHe I and He II UPS spectra with published spec-tra6,42,44,45,62−75 of clean and adsorbate-covered surfaces,adsorbate states can be identified (marked with a star in Figure2a,b). For example, comparison with literature shows that themain adsorbate contributions in Fe and Co can be ascribed tothe oxygen species, and in Ni, Pd, and Pt to carbon monoxideor similar species. On Pt, we further find resonances that can beascribed to OH groups. For the spectra presented herein, noadsorbate-related peaks were found for Cu, Pd, Ag, Pt, and Au.We find that all adsorbate-induced states are located at binding
Figure 2. Valence band spectra of different Ar+-sputtered polycrystalline metal samples collected using He I (a), He II (b), and monochromatized AlKα (c) excitation. The average energies of the valence band spectral weight (i.e., the d-band center position), derived after subtraction of thebackground (shown as thin lines underneath each spectrum) and integration, are marked by vertical bars. Adsorbate state contributions are markedwith a star (★).
The Journal of Physical Chemistry C Article
dx.doi.org/10.1021/jp303276z | J. Phys. Chem. C 2012, 116, 24016−2402624019
energies larger than the VBS integration window of the metal,that is, the influence of these states on the valence band spectralregion (and the d-band center determination) is negligible.However, they are accompanied by a reduction of the DOSclose to the Fermi energy69,71 and can be interpreted as acharge transfer due to the formation of metal-adsorbatebonds.42,67 We expect such a redistribution of spectral weightto shift the center of mass (and hence the derived d-bandcenter values) toward higher binding energy for all UPS spectrain which adsorbate states are found. Nevertheless, since theobserved adsorbate intensities are estimated to correspond tosubmonolayer coverages, we suspect that this shift is generallyrather small and that it decreases with increasing excitationenergy. In Pd, for example, peaks around 8 and 11 eV can befound after prolonged storage in UHV, which may be derivedfrom the 5σ- and 1π-orbitals of adsorbed carbon mon-oxide,42,70,72 and the associated difference in d-band centerposition was found to be 0.1 eV (see Figure S1 in theSupporting Information). To minimize adsorbate-inducedeffects, X-ray instead of UV excitation can be used, becausethe IMFP (and the associated information depth) increasesapproximately with the square-root of the kinetic energy of thephotoelectron.52−55
Taking into account the aspects discussed above, we arguethat the determination of the energetic position of d-bandcenters from XPS spectra appears most favorable, in that itmitigates several experimental (e.g., surface adsorbates) andspectroscopic (e.g., final state effects) complications for astraightforward comparison with such a ground-state property.To analyze this argument more quantitatively, we havedetermined the d-band center position of the valence bandfor each metal using He I, He II, and Al Kα excitation. Table 2lists these experimentally determined values, together with ourtheoretically determined d-band centers, and a comparison withtheoretical (“theo”) and experimental positions (“expt”) fromthe literature. The columns with our theoretical results list thebulk d-band center derived from the total DOS (“TDOS”), therefined TDOS (“TDOS refined”), the partial contributionsfrom the bands with t2g and eg symmetry, and the sum of thesetwo bands (“d-sum”).
When the experimentally derived d-band center positionswith the published theoretical and (where available) exper-imental values are compared, we find significant differences.There are several possible reasons for the observed differences.First, we note that different calculation approaches can lead tovariations in the DOS and/or the associated energy scale.32
Even for a given (fixed) DOS, the calculation of the d-bandcenter value requires the definition of upper and lowerintegration limits, the choice of which significantly impactsthe derived value. To circumvent such complications, someauthors have chosen constant (but somewhat arbitrary) limits,for example, 10 eV for occupied states27,76 and 15 eV forunoccupied states32 or considered infinite cutoff energies (e.g.,refs.19 and 77). In many publications, additional details wouldbe needed to judge the analysis approach, such as integrationlimits or background shape (e.g., refs.18, 20, 22, 29, 31, and78−81). As the d-bandwidth significantly varies for the metalsunder study, we have followed a different approach, namely tovary the upper (high binding energy) integration limit such thatonly those states are taken into account that are actuallyresolved by the measurement. For this purpose, we (visually)determined the high energy tail of the d-bands as measuredusing the three different excitation energies and compared thesevalues with the d-band widths reported for PES studies of cleanmetals.6,42,44,45,62−75 To estimate the variance of this procedure,the d-band center was determined additionally by varying theupper integration limit by ±0.2−1.0 eV (depending onexcitation energy, direction of variation, position of features,and background shape). The resulting error bars (which areasymmetric) are listed in Table 2 (and will also be shown inFigure 5).We find that, for a given metal, the such-derived d-band
center positions vary up to ≈ 0.5 eV, depending on theexcitation energy used. Values determined from the XPS VBSwere found to be the highest because the higher-binding-energystates of the VB are more pronounced in this case. Despitesignificant shape changes in the VB, the differences between theHe I- and He II-derived values lie well within the error bars formost metals. The d-band centers of the metals with filled d-
Table 2. Metal d-Band Centers (eV)a
element He I He II Al Kα TDOSTDOSrefined t2g eg
d-sum theob exptb
Fe 1.06 +0.20/−0.25 1.13 +0.15/−0.20
1.55 +0.10/−0.10 2.14 1.86 1.57 1.71 1.62 0.9220,22
Co 1.08 +0.15/−0.20 1.05 +0.10/−0.10
1.54 +0.10/−0.10 2.54 1.77 1.44 1.53 1.48 1.17,20,22 2.032
Ni 1.14 +0.20/−0.20 1.01 +0.10/−0.10
1.20 +0.05/−0.10 2.35 1.49 1.39 1.16 1.30 1.29,20,22
1.48,18 1.732
Cu 2.93 +0.10/−0.10 3.04 +0.05/−0.05
3.05 +0.05/−0.05 3.02 3.29 3.14 3.00 3.09 2.4,32 2.6718,22
Pd 1.68 +0.20/−0.15 1.74 +0.05/−0.10
2.09 +0.05/−0.10 2.44 2.44 2.43 2.13 2.30 1.8,32 1.8320,22
Ag 5.19 +0.10/−0.15 5.27 +0.05/−0.05
5.28 +0.05/−0.05 4.31 5.30 5.42 5.30 5.37 4.0,32 4.3020,22
Pt 2.14 +0.20/−0.20 2.83 +0.05/−0.05
2.94 +0.05/−0.10 3.37 3.77 3.72 3.18 3.49 2.25,20,22 2.4,32
2.75182.356,79 2.54,273.4581
3.9829 4.7780
Au 4.32 +0.10/−0.15 4.30 +0.05/−0.05
4.45 +0.05/−0.05 4.06 4.62 4.56 4.40 4.49 3.5,32 3.56,20,22
3.91184.2784
aValues derived from photoelectron spectroscopy (for different excitation energies), theory [total DOS (TDOS), refined TDOS, refined symmetry-resolved (t2g and eg), and refined summed d-band contributions], and literature [theory (theo) and experiment (expt)]. The “+” and “−“ values givethe estimated errors in determining the d-band center values. bCitations: Ref 18, d-band center of (111) metal surfaces; Ref 22, d-band center ofmost close-packed surface of each metal; Refs 32, 81, 29, and 84, approximate values taken from Fig. 4 in ref 32, Fig. 8 in ref , Fig. 7 in ref 29, and Fig.3 in ref 84.
The Journal of Physical Chemistry C Article
dx.doi.org/10.1021/jp303276z | J. Phys. Chem. C 2012, 116, 24016−2402624020
shells (Cu, Ag, Au) vary noticeably less than, in particular, theones of Fe and Co.For bulk metals, only experimental d-band centers for Pt and
Au have been published to our knowledge.82 The measure-ments of Pt were obtained using photon energies of 90eV27,29,79 and 1486.6 eV,80 respectively. Two of the four valuesobtained with 90 eV (2.356 eV79 and 2.54 eV27) arecomparable to our UPS-derived results, while the other tworeported values for 90 eV excitation (3.45 eV81 and 3.98 eV29)significantly exceed this range. We note that, due to the lowphoton energy employed, all of these experiments face the sameexperimental challenges described above. Lastly, the value of4.77 eV for Pt determined by Hwang et al.80 usingmonochromatized Al Kα radiation is significantly larger thanthose reported with 90 eV excitation, and also larger than ourvalue of 2.94 (+0.05/-0.10) eV (unfortunately, neither thespectrum, nor the integration limits or background subtractioninformation is given, and thus the reason for the large deviationis unknown).For Au, the value of 4.27 eV29 measured with 60 eV photon
energy was obtained after subtraction of a Shirley backgroundand using the inflection points of the d-band boundaries as
integration limits. On the basis of the comparable data analysismethod of the authors we find their values to agree well withours [4.32 (+0.10/-0.15) eV for He I and 4.30 (+0.05/-0.05)eV for He II excitation]. Our XPS-based value of 4.45(+0.05/-0.05) eV is slightly higher due to the (improved) determinationapproach at higher excitation energies.In summary, thus, we find that experimentally determined d-
band centroids are most often determined using photonenergies in the UPS regime27,29,79,81,83,84 and frequentlyinformation on the exact treatment of the background andthe selection of integration limits is lacking. In contrast, for thereasons discussed earlier, we favor XPS-based measurements toovercome the challenges associated with low-excitation-energyspectra. Poor correlation of published results using the samephoton energy further suggests that a uniform data analysismethod is needed for proper comparison.Comparing our results with previously published DFT-
derived d-band center positions, we find rather large deviations,presumably due to the well-known shortcomings of DFT toaccurately describe the energies of (localized) d-band states.85
An in-depth discussion of differences in the computationalmodels will be published elsewhere.86 We focus here on
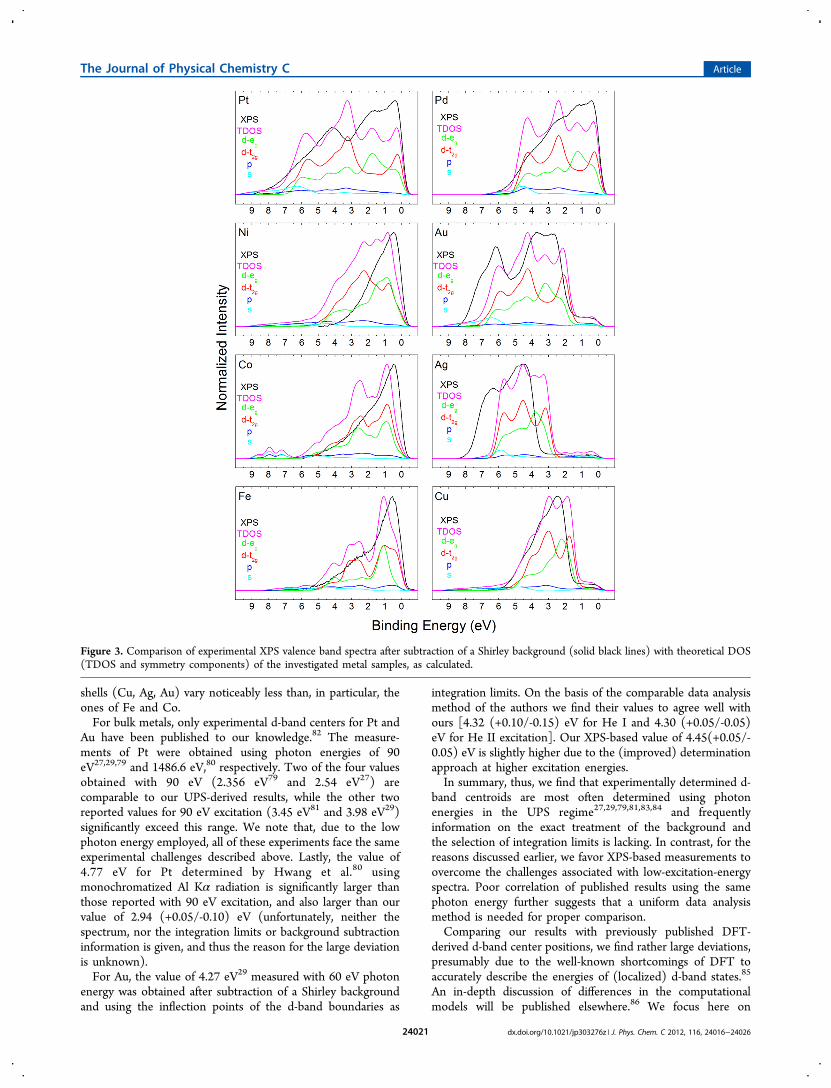
Figure 3. Comparison of experimental XPS valence band spectra after subtraction of a Shirley background (solid black lines) with theoretical DOS(TDOS and symmetry components) of the investigated metal samples, as calculated.
The Journal of Physical Chemistry C Article
dx.doi.org/10.1021/jp303276z | J. Phys. Chem. C 2012, 116, 24016−2402624021
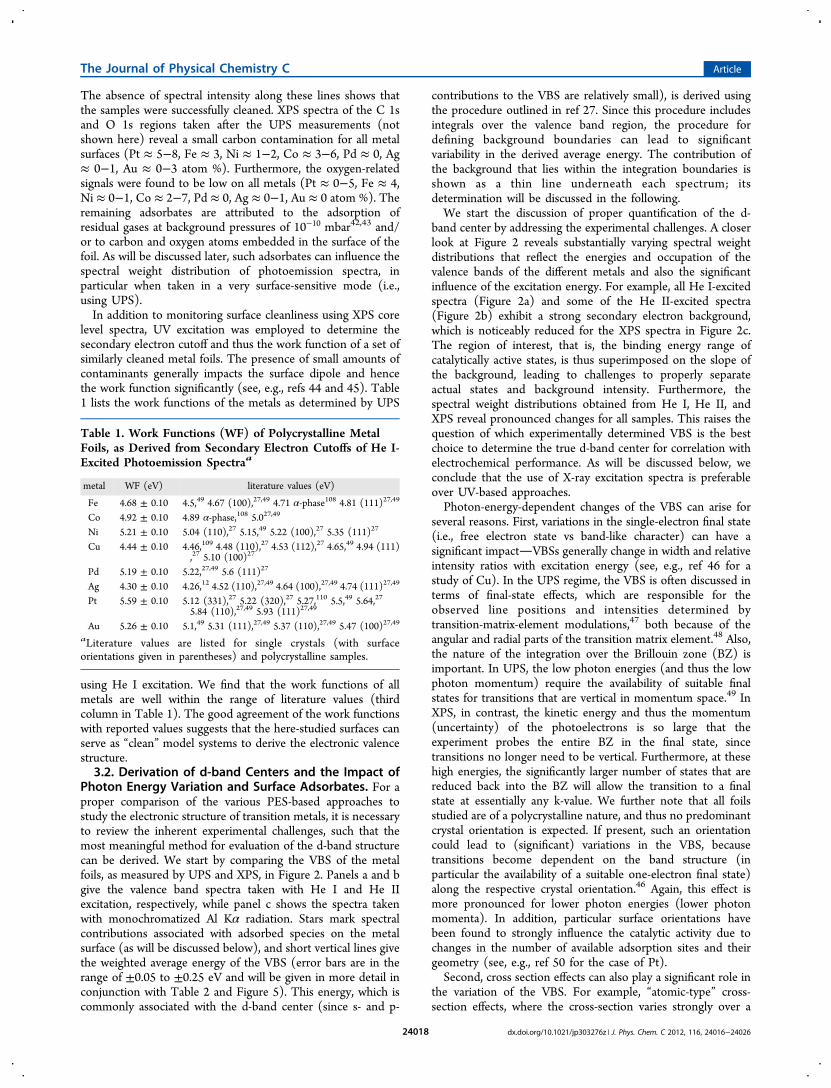
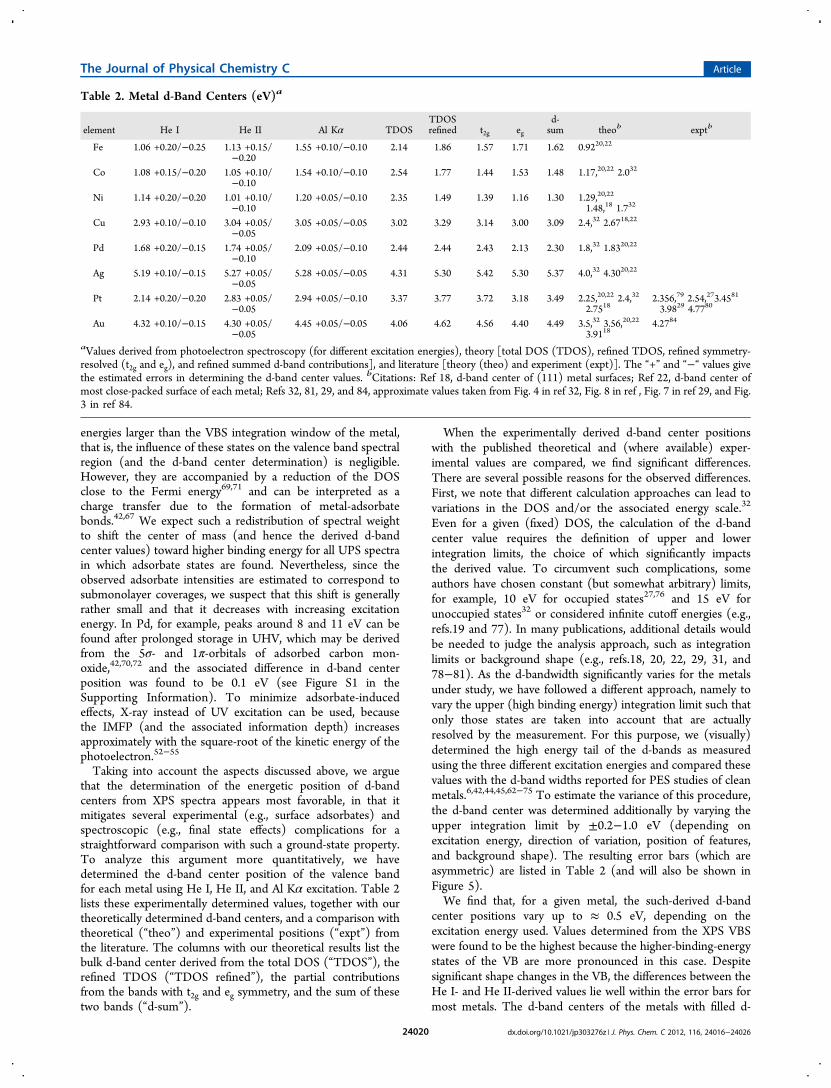
comparing the theoretical values reported in the literature. Theformer typically refer to the d-“band” center position of the firstatomic layer (the same is true for synchrotron-based photo-emission studies with kinetic energies near the minimum of theIMFP curve52). UPS (even lower kinetic energies) andespecially XPS (high kinetic energy) measurements averagethe VBS over a larger volume. Thus, we expect our PES-derivedcentroid values to be closer to the d-band center calculated forthe bulk of the metals (“TDOS”), listed in Table 2. The latterexclude influences of the surface, such as surface defects and thenarrowing of surface d-bands, which is considered to be a rathersmall effect.57,87 We find the TDOS centroid (i.e., the d-bandcenter) of Fe, Co, Ni, Pd, and Pt to be higher, the one of Cu tobe similar, and the ones of Ag and Au to be lower whencompared to the experimentally derived values. The deviationsare mainly due to variations in the relative intensity of bandswith different symmetries, and in the energy scale between theTDOS and XPS. This can be easily seen in Figure 3, whichpresents the calculated TDOS along with the symmetry-resolved contributions of the s, p, d-eg, and d-t2g partial DOS ofall metals, and compared to the respective measured XPS VB.When comparing the relative intensities between theory andexperiment of the metals in Figure 3, it is noticeable that theVBS at higher binding energies has higher relative intensity in
the calculations than in the XPS experiment. This finding hasbeen reported for numerous transition metals and has beenlinked to variations of the photoionization cross-section acrossthe d-band.88−92 Moreover, Nemoshkalenko et al. found thatelectrons with eg symmetry have higher transition probabilitythan those with t2g symmetry.
92 This explains the larger TDOSd-band center positions of Fe, Co, Ni, Pd, and Pt and showsthat theoretical calculations are necessary to obtain the correctintensity distribution in the VBS. For Ag and Au, the energyaxis of the TDOS appears to be compressed when compared tothe XPS VB. This is not surprising, as DFT is commonlyknown to underestimate and in some cases also to overestimatethe band widths (and band gaps).93−101 Therefore, experimentsare needed to be able to obtain the correct energy axis. Finally,in the case of Cu, the centroid values of XPS and TDOS arealmost identical mathematically, while the visual correlation isquite poor.Aside from the above-mentioned influences, we expect the
omission of surface effects in the TDOS calculations to lead toa slight upward shift of the d-band center, as it is typicallynarrower at the surface due to the reduced coordinationnumber. This in part explains why the TDOS d-band centervalues are higher than published DFT results, which takesurface effects into account. However, as mentioned earlier, this
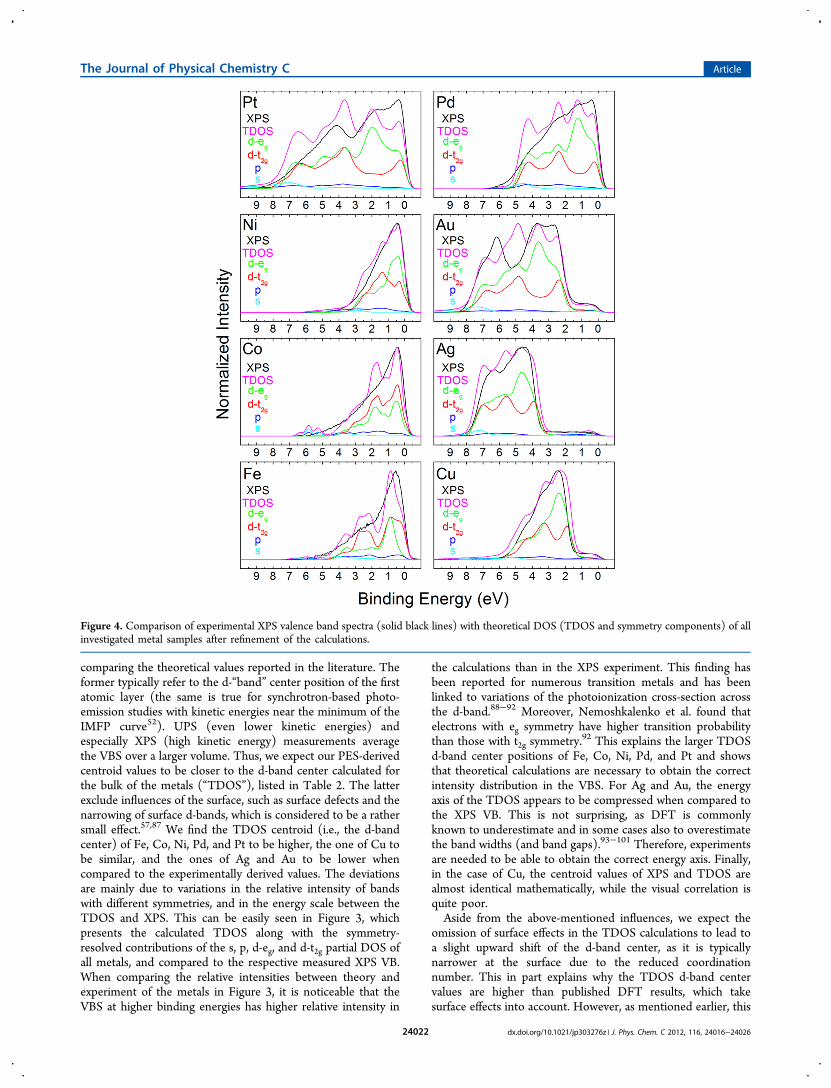
Figure 4. Comparison of experimental XPS valence band spectra (solid black lines) with theoretical DOS (TDOS and symmetry components) of allinvestigated metal samples after refinement of the calculations.
The Journal of Physical Chemistry C Article
dx.doi.org/10.1021/jp303276z | J. Phys. Chem. C 2012, 116, 24016−2402624022
effect is rather small, as a comparison of surface d-band centersand bulk d-band centers shows.86
3.3. Comparison of the Experimental Spectra withTheoretical DOS, Refinement of the Theoretical EnergyScale. To approximate the true d-band center of the groundstate, we have used the experimental energy axis to correct theenergy axis of the theoretical DOS. For this purpose, we haverefined the calculated DOS by variation of the eg to t2g ratio inorder to achieve the best visual agreement between experiment(after subtraction of a Shirley background) and theory (seeFigure 4; this procedure allows for variation in photoionizationcross-section between the two symmetries). Furthermore, theenergy axis of the DOS spectra was stretched or compressed tovisually reconcile the position of prominent features on thebinding energy axis. This is a commonly used approach tocorrect the above-mentioned shortcomings of DFT todetermine correct band widths and gaps.93−101 For Fe, Co,and Ni, we noticed a shift of the theoretical Fermi position ascompared to the experimentally observed position. In thesethree cases an offset correction was performed. In order to ruleout instrumental calibration errors, we have, in addition to ourstandard three point calibration of the XPS energy scale,verified the Fermi position of the Fe, Co, and Ni XPS VB byreferencing the binding energy scale to the position of the Au4f7/2 peak at 83.96 eV.33 No deviation between the twocalibration methods was found (within the error of themeasurement). We therefore believe that the deviation is dueto an upward shift of the theoretical DOS, as previouslyreported in the case of Fe.102 The various parameters used toadjust the theoretical DOS are outlined in Table S1 of theSupporting Information.Overall, the refined theoretical DOS of all metals (Figure 4)
fits reasonably well with the experimental spectra (note that thisapproach still does not include matrix elements and theirassociated variation of the absolute spectral intensities). The d-band center positions determined in the above-describedmanner are presented in Table 2 and will be discussed in thefollowing section.3.4. Comparison of d-Band Center Position with
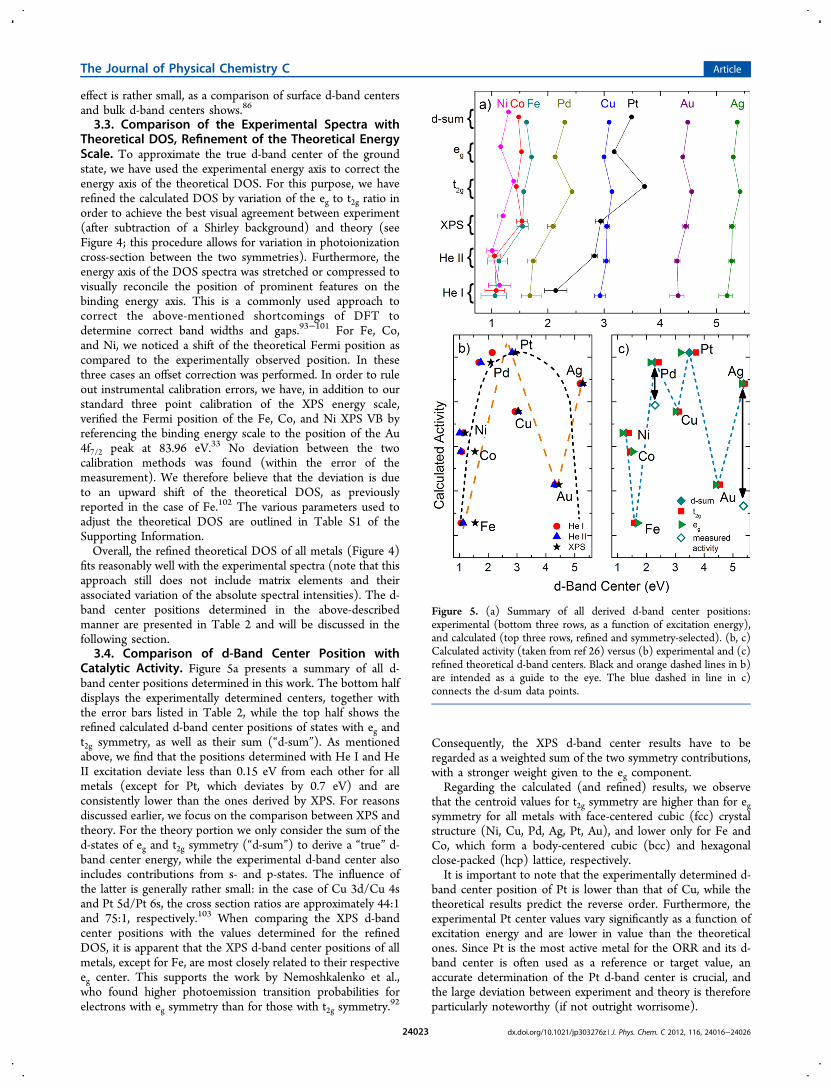
Catalytic Activity. Figure 5a presents a summary of all d-band center positions determined in this work. The bottom halfdisplays the experimentally determined centers, together withthe error bars listed in Table 2, while the top half shows therefined calculated d-band center positions of states with eg andt2g symmetry, as well as their sum (“d-sum”). As mentionedabove, we find that the positions determined with He I and HeII excitation deviate less than 0.15 eV from each other for allmetals (except for Pt, which deviates by 0.7 eV) and areconsistently lower than the ones derived by XPS. For reasonsdiscussed earlier, we focus on the comparison between XPS andtheory. For the theory portion we only consider the sum of thed-states of eg and t2g symmetry (“d-sum”) to derive a “true” d-band center energy, while the experimental d-band center alsoincludes contributions from s- and p-states. The influence ofthe latter is generally rather small: in the case of Cu 3d/Cu 4sand Pt 5d/Pt 6s, the cross section ratios are approximately 44:1and 75:1, respectively.103 When comparing the XPS d-bandcenter positions with the values determined for the refinedDOS, it is apparent that the XPS d-band center positions of allmetals, except for Fe, are most closely related to their respectiveeg center. This supports the work by Nemoshkalenko et al.,who found higher photoemission transition probabilities forelectrons with eg symmetry than for those with t2g symmetry.
92
Consequently, the XPS d-band center results have to beregarded as a weighted sum of the two symmetry contributions,with a stronger weight given to the eg component.Regarding the calculated (and refined) results, we observe
that the centroid values for t2g symmetry are higher than for egsymmetry for all metals with face-centered cubic (fcc) crystalstructure (Ni, Cu, Pd, Ag, Pt, Au), and lower only for Fe andCo, which form a body-centered cubic (bcc) and hexagonalclose-packed (hcp) lattice, respectively.It is important to note that the experimentally determined d-
band center position of Pt is lower than that of Cu, while thetheoretical results predict the reverse order. Furthermore, theexperimental Pt center values vary significantly as a function ofexcitation energy and are lower in value than the theoreticalones. Since Pt is the most active metal for the ORR and its d-band center is often used as a reference or target value, anaccurate determination of the Pt d-band center is crucial, andthe large deviation between experiment and theory is thereforeparticularly noteworthy (if not outright worrisome).
Figure 5. (a) Summary of all derived d-band center positions:experimental (bottom three rows, as a function of excitation energy),and calculated (top three rows, refined and symmetry-selected). (b, c)Calculated activity (taken from ref 26) versus (b) experimental and (c)refined theoretical d-band centers. Black and orange dashed lines in b)are intended as a guide to the eye. The blue dashed in line in c)connects the d-sum data points.
The Journal of Physical Chemistry C Article
dx.doi.org/10.1021/jp303276z | J. Phys. Chem. C 2012, 116, 24016−2402624023

Overall, we identify the d-band center values for the refinedDOS sum as the best approximation for the true ground-stated-band center, as it combines both the experimental energy axisand the theoretical ground state prediction. In the final section,we will now use these values for comparison with calculatedand experimental catalytic activities to provide an experiment-based analysis of the validity of the “d-band center model”. Asmentioned, commonly, the dependence of the activity onvarious parameters like the d-band center,78 oxygen bindingenergy,26,104 d-orbital vacancies,104 etc., yields volcano-shapedcurves (so-called “volcano plots”). The various catalytic modelsare not without controversy, as pointed out by several authors(e.g., Lu et al.,30 Hyman et al.,105 and Barteau et al.106).However, none of these studies critically assess the influence ofvariations in the d-band center. Here, we strive to examine theimpact of the refined d-band centers on the commonly usedvolcano curve dependency rather than to give a detaileddiscussion of volcano plots and their relevance to catalysis.Hence, we plotted the experimental and theoretical d-band
center positions in Figure 5 panels b and c, respectively, againstthe calculated ORR activity (taken from Nørskov et al.26). Inthe following we focus on addressing the correlation of activitywith the d-band band center based on a comparison of ourexperimental and refined theoretical results with published data.In our case, the dashed curve of a somewhat “flattish” volcano(at first sight) appears to give a good description (black, short-dashed line in Figure 5b). However, closer inspection revealsthat the trend of the XPS-derived data (black stars in Figure5b) for Ni, Co, and Fe is not well described, and likewise, thatAu and Ag show an inverted trend. Furthermore, the Cu valueis a complete outlier. In fact, an “N″-shaped (zigzag) curvegives a better description (orange, long-dashed line in Figure5b), with a (volcano-type) maximum at lower d-band centervalues and an additional increase in activity at the higher d-bandcenter value of Ag. Furthermore, by simply connecting the d-sum data points in order of their d-band center position (blue,short-dashed line in Figure 5c), a complex (apparently random)dependency emerges. The Pt−Cu discrepancy is notsurprisingboth exhibit similar d-band center values, but theoverall d-band structure (including the overall width and thedensity of states near the Fermi energy) is vastly different (seeFigure 2).To take into account possible differences on the activity scale
between theory and experiment, we have also includedexperimental activities measured in alkaline electrolyte byLima et al. on single crystal metals (Pd, Pt, Au, and Ag)78 inFigure 5c. To align the ordinate scales of the works by Nørskovet al.26 and Lima et al.,78 we have aligned the Pt and Au datapoints (for d-sum), assuming a linear relationship between thetheoretically determined and electrochemically observedactivities. Thus, only two experimental electrochemical datapoints are visible in Figure 5c (for Pd and Ag), while the Pt andAu data points coincide with the “d-sum” data points (perconstruction). With this additional modification, we find thatboth the Pd and the Ag experimental activities are lower thantheoretically predicted (compared to the Pt and Au referenceactivities indicated by double-headed arrows in Figure 5c), andthat modifications to the original volcano shape introduced byour d-band centers persist.Furthermore, as suggested by Hyman et al.105 in a theoretical
study, one would expect the DOS near the Fermi energy toinfluence the adsorption energy of the O species. They notedthat, in cases where there was a lack of correlation between
shifts of the d-band center energy and the binding energy of Ospecies, the cause was a lack of correlation between the d-bandcenters and the DOS near the Fermi energy. Indeed, based on areduction of intensity at the Fermi energy, previous studies(e.g., refs 46 and 107) suggest that t2g states located near theFermi energy are important for adsorption. This is corrobo-rated by our findings for almost all metals studied herein: the t2gstates clearly dominate this region of the DOS (see Figure 3).To gain improved insight into the correlation of the
electronic structure and activity, experimental and theoreticalefforts should be combined to extract catalytically active states.To summarize this discussion, we thus reason that there is nosimple direct relationship between the energy of the d-bandcenter and the ORR catalytic activity of transition metals. Inparticular the proximity of the d-band center positions of Fe,Co, and Ni, as well as of Pt and Cu (despite the largedifferences in activity of these metals) suggests that the positionof the d-band center alone is not a representative measure toevaluate the ORR activity.
4. CONCLUSIONS
To test the validity of models relating the catalytic activity andthe single parameter “d-band center position”, we haveinvestigated the valence band structure of various noble andtransition metals by photoelectron spectroscopy (PES) usingHe I, He II, and monochromatized Al Kα excitation. Ourresults show that final states effects, the photoionization cross-section, and adsorption of residual gas molecules in an ultrahighvacuum environment strongly influence the valence bandstructure. We find that valence bands recorded withmonochromatized Al Kα radiation are most closely comparableto the ground state density of states. We demonstrate that theXPS-derived energy scale can be used to correct the DOScalculations in order to draw conclusions about the trueground-state d-band structure. Our data show that thedependence of ORR activity on d-band center position ismore complex than a simple continuous (volcano-plot)distribution.
■ ASSOCIATED CONTENT
*S Supporting InformationRefinement parameters applied to the calculated DOS and UPSHe I valence band spectra of a polycrystalline Pd foilimmediately after Ar+ sputtering and after one day of storagein UHV. This material is available free of charge via the Internetat http://pubs.acs.org.
■ AUTHOR INFORMATION
Corresponding Author*E-mail: [email protected]; [email protected].
NotesThe authors declare no competing financial interest.
■ ACKNOWLEDGMENTS
We gratefully acknowledge funding by the U.S. Department ofEnergy, Prime Contract No. DE-AC02-06CH11357 (ANL)and ANL Subcontract Nos. 7F-01041 (UNLV) and 7F-01321(Caltech). M.B. acknowledges support by the Impuls- undVernetzungsfonds of the Helmholtz-Association (VH-NG-423).
The Journal of Physical Chemistry C Article
dx.doi.org/10.1021/jp303276z | J. Phys. Chem. C 2012, 116, 24016−2402624024

■ REFERENCES(1) Ertl, G. Angew. Chem., Int. Ed. 2008, 47, 3524−3535.(2) Bowker, M. The Basis and Applications of Heterogeneous Catalysis;Oxford University Press: New York, U.S.A., 1998.(3) Rothenberg, G. Catalysis: Concepts and Green Applications; Wiley-VCH: Weinheim, Germany, 2008.(4) Baer, Y.; Heden, P. F.; Hedman, J.; Klasson, M.; Nordling, C.;Siegbahn, K. Phys. Scr. 1970, 1, 55−65.(5) Battye, F. L.; Goldmann, A.; Kasper, L.; Hufner, S. Z. Phys. B1977, 27, 209−214.(6) Hufner, S.; Wertheim, G. K. Phys. Lett. A 1974, 47, 349−350.(7) Borup, R.; Meyers, J.; Pivovar, B.; Kim, Y. S.; Mukundan, R.;Garland, N.; Myers, D.; Wilson, M.; Garzon, F.; Wood, D.; et al. Chem.Rev. 2007, 107, 3904−3951.(8) Popov, B. N.; Li, X.; Liu, G.; Lee, J.-W. Int. J. Hydrogen Energy2011, 36, 1794−1802.(9) Carlson, E.; Kopf, P.; Sinha, J.; Sriramulu, S.; Yang, Y. PEM FuelCell Cost Status, Fuel Cell Seminar, Palm Springs, CA, 2005, AbstractNo. 392.(10) Costamagna, P.; Srinivasan, S. J. Power Sources 2001, 102, 242−252.(11) Gewirth, A. A.; Thorum, M. S. Inorg. Chem. 2011, 49, 3557−3566.(12) Morozan, A.; Jousselme, B.; Palacin, S. Energy Environ. Sci. 2011,4, 1238−1254.(13) Chen, Z.; Higgins, D.; Yu, A.; Zhang, L.; Zhang, J. EnergyEnviron. Sci. 2011, 4, 3167−3192.(14) Guo, S.; Wang, E. Nano Today 2011, 6, 240−264.(15) Wang, X.; Kariuki, N.; Niyogi, S.; Smith, M. C.; Myers, D. J.;Hofmann, T.; Zhang, Y.; Bar, M.; Heske, C. ECS Trans. 2008, 109−119.(16) Wang, X.; Kariuki, N.; Vaughey, J. T.; Goodpaster, J.; Kumar, R.;Myers, D. J. J. Electrochem. Soc. 2008, 155, B602−B609.(17) Bing, Y.; Liu, H.; Zhang, L.; Ghosh, D.; Zhang, J. Chem. Soc. Rev.2010, 39, 2184.(18) Hammer, B.; Nørskov, J. K. Surf. Sci. 1995, 343, 211−220.(19) Shao, M.; Liu, P.; Zhang, J.; Adzic, R. J. Phys. Chem. B 2007, 111,6772−6775.(20) Ruban, A.; Hammer, B.; Stoltze, P.; Skriver, H. .; Nørskov, J. . J.Mol. Catal. A-Chem. 1997, 115, 421−429.(21) Greeley, J.; Nørskov, J. K. Surf. Sci. 2005, 592, 104−111.(22) Hammer, B.; Nørskov, J. K. Adv. Catal. 2000, 45, 71−129.(23) Stamenkovic, V.; Mun, B. S.; Mayrhofer, K. J. J.; Ross, P. N.;Markovic, N. M.; Rossmeisl, J.; Greeley, J.; Nørskov, J. K. Angew.Chem., Int. Ed. 2006, 45, 2897−2901.(24) Kitchin, J. R.; Nørskov, J. K.; Barteau, M. A.; Chen, J. G. J. Chem.Phys. 2004, 120, 10240−10246.(25) Hyman, M. P.; Loveless, B. T.; Medlin, J. W. Surf. Sci. 2007, 601,5382−5393.(26) Nørskov, J. K.; Rossmeisl, J.; Logadottir, A.; Lindqvist, L.;Kitchin, J. R.; Bligaard, T.; Jonsson, H. J. Phys. Chem. B 2004, 108,17886−17892.(27) Mun, B. S.; Watanabe, M.; Rossi, M.; Stamenkovic, V.;Markovic, N. M.; Ross, P. N. J. Chem. Phys. 2005, 123, 204717.(28) Kibler, L. A.; El-Aziz, A. M.; Hoyer, R.; Kolb, D. M. Angew.Chem., Int. Ed. 2005, 44, 2080−2084.(29) Toyoda, E.; Jinnouchi, R.; Hatanaka, T.; Morimoto, Y.;Mitsuhara, K.; Visikovskiy, A.; Kido, Y. J. Phys. Chem. C 2011, 115,21236−21240.(30) Lu, C.; Lee, I. C.; Masel, R. I.; Wieckowski, A.; Rice, C. J. Phys.Chem. A 2002, 106, 3084−3091.(31) Xin, H.; Linic, S. J. Chem. Phys. 2010, 132, 221101.(32) Gajdo, M.; Eichler, A.; Hafner, J. J. Phys.: Condens. Matter 2004,16, 1141−1164.(33) Seah, M. P. Surf. Interface Anal. 2001, 31, 721−723.(34) Schultz, P. SeqQuest, Electronic Structure Code; Sandia NationalLaboratory, Albuquerque, NM: http://dft.sandia.gov/Quest/.
(35) Edwards, A. SeqQuest, Post Analysis Code; Sandia NationalLaboratory, Albuquerque, NM: http://dft.sandia.gov/Quest/SeqQ_Kudos.(36) Perdew, J. P.; Burke, K.; Ernzerhof, M. Phys. Rev. Lett. 1996, 77,3865−3868.(37) Ceperley, D. M.; Alder, B. J. Phys. Rev. Lett. 1980, 45, 566−569.(38) Perdew, J. P.; Zunger, A. Phys. Rev. B 1981, 23, 5048−5079.(39) Goddard, W. A. Phys. Rev. 1968, 174, 659−662.(40) Melius, C. F.; Goddard, W. A. Phys. Rev. A 1974, 10, 1528−1540.(41) Moulder, J. F.; Stickle, W. F.; Sobol, P. E. Handbook of X-RayPhotoelectron Spectroscopy; Perkin-Elmer, Physical Electronics Division:Eden Prairie, U.S.A., 1993.(42) Kuppers, J.; Conrad, H.; Ertl, G.; Latta, E. E. Jpn. J. Appl. Phys.1974, 2, 225−228.(43) Tran, I. C.; Felix, R.; Bar, M.; Weinhardt, L.; Zhang, Y.; Heske,C. J. Am. Chem. Soc. 2010, 132, 5789−5792.(44) Paal, Z.; Schlogl, R.; Ertl, G. Faraday Trans. 1992, 88, 1179−1189.(45) Conrad, H.; Ertl, G.; Koch, J.; Latta, E. E. Surf. Sci. 1974, 43,462−480.(46) Shirley, D. A.; Stohr, J.; Wehner, P. S.; Williams, R. S.; Apai, G.Phys. Scr. 1977, 16, 398−413.(47) Stohr, J.; McFeely, F. R.; Apai, G.; Wehner, P. S.; Shirley, D. A.Phys. Rev. B 1976, 14, 4431−4438.(48) Feibelman, P. J.; Eastman, D. E. Phys. Rev. B 1974, 10, 4932−4947.(49) Hufner, S. Photoelectron Spectroscopy: Principles and Applications;Springer: Heidelberg, Germany, 2003.(50) Markovic, N. M.; Gasteiger, H. A.; Ross, P. N. J. Phys. Chem.1995, 99, 3411−3415.(51) Wehner, P. S.; Stohr, J.; Apai, G.; McFeely, F. R.; Williams, R.S.; Shirley, D. A. Phys. Rev. B 1976, 14, 2411−2416.(52) Seah, M. P.; Dench, W. A. Surf. Interface Anal. 1979, 1, 2−11.(53) Powell, C. J. Surf. Sci. 1974, 44, 29−46.(54) Powell, C. J.; Jablonski, A. J. Phys. Chem. Ref. Data 1999, 28,19−62.(55) Tanuma, S.; Powell, C. J.; Penn, D. R. Surf. Interface Anal. 1993,20, 77−89.(56) Oura, K. Surface Science: An Introduction; Springer: New York,2003.(57) Zangwill, A. Physics at Surfaces; Cambridge University Press:Cambridge, UK, 1988.(58) Davison, S. G.; Steslicka, M. Basic Theory of Surface States;Clarendon Press: Oxford, UK, 1996.(59) Lloyd, D. R.; Quinn, C. M.; Richardson, N. V. In Surface andDefect Properties of Solids; Roberts, M. W., Thomas, J. M., Eds.; TheRoyal Society of Chemistry: London, UK, 1977; Vol. 6, pp 179−217.(60) Haydock, R.; Kelly, M. J. Surf. Sci. 1973, 38, 139−148.(61) Steiner, P.; Hufner, S.; Freeman, A. J.; Wang, D. Solid StateCommun. 1982, 44, 619−622.(62) Brundle, C. R. Surf. Sci. 1977, 66, 581−595.(63) Yu, K. Y.; Spicer, W. E.; Lindau, I.; Pianetta, P.; Lin, S. F. Surf.Sci. 1976, 57, 157−183.(64) Frerichs, M.; Schweiger, F. X.; Voigts, F.; Rudenkiy, S.; Maus-Friedrichs, W.; Kempter, V. Surf. Interface Anal. 2005, 37, 633−640.(65) Castro, G.; Hulse, J. E.; Kuppers, J.; Gonzalez-Elipe, A. R. Surf.Sci. 1982, 117, 621−628.(66) Joyner, R. W.; Roberts, M. W. J. Chem. Soc., Faraday Trans. 11974, 70, 1819−1824.(67) Page, P. J.; Trimm, D. L.; Williams, P. M. J. Chem. Soc., FaradayTrans. 1 1974, 70, 1769−1781.(68) Norton, P. .; Tapping, R. .; Goodale, J. . Surf. Sci. 1978, 72, 33−44.(69) Conrad, H.; Ertl, G.; Kuppers, J.; Latta, E. E. Solid StateCommun. 1975, 17, 613−616.(70) Gustafsson, T.; Plummer, E. W.; Eastman, D. E.; Freeouf, J. L.Solid State Commun. 1975, 17, 391−396.
The Journal of Physical Chemistry C Article
dx.doi.org/10.1021/jp303276z | J. Phys. Chem. C 2012, 116, 24016−2402624025
(71) Legare, P.; Hilaire, L.; Maire, G.; Krill, G.; Amamou, A. Surf. Sci.1981, 107, 533−546.(72) Conrad, H.; Ertl, G.; Kuppers, J.; Latta, E. E. Faraday Discuss.Chem. Soc. 1974, 58, 116−124.(73) Boronin, A. I.; Koscheev, S. V.; Zhidomirov, G. M. J. Electr.Spectrosc. Rel. Phenom. 1998, 96, 43−51.(74) Kiskinova, M.; Pirug, G.; Bonzel, H. P. Surf. Sci. 1983, 133,321−343.(75) Atkinson, S. J.; Brundle, C. R.; Roberts, M. W. Faraday Discuss.Chem. Soc. 1974, 58, 62−79.(76) Stamenkovic, V. R.; Fowler, B.; Mun, B. S.; Wang, G.; Ross, P.N.; Lucas, C. A.; Markovic, N. M. Science 2007, 315, 493−497.(77) Shao, M. H.; Huang, T.; Liu, P.; Zhang, J.; Sasaki, K.;Vukmirovic, M. B.; Adzic, R. R. Langmuir 2006, 22, 10409−10415.(78) Lima, F. H. B.; Zhang, J.; Shao, M. H.; Sasaki, K.; Vukmirovic,M. B.; Ticianelli, E. A.; Adzic, R. R. J. Phys. Chem. C 2007, 111, 404−410.(79) Ross, P. N.; Markovic, N. M. DOE Annual Hydrogen Review;Department of Energy: Washington, DC, 2004.(80) Hwang, S. J.; Yoo, S. J.; Jang, S.; Lim, T.-H.; Hong, S. A.; Kim,S.-K. J. Phys. Chem. C 2011, 115, 2483−2488.(81) Toyoda, E.; Hatanaka, T.; Takahashi, N.; Jinnouchi, R.;Morimoto, Y. ECS Trans. 2009, 25, 1057−1064.(82) Web of Science Search for keywords “d-band center” and“photoemission”, September 3, 2012.(83) Kim, Y. S.; Mun, B. S.; Ross, P. N. Curr. Appl. Phys. 2011, 11,1179−1182.(84) Visikovskiy, A.; Matsumoto, H.; Mitsuhara, K.; Nakada, T.;Akita, T.; Kido, Y. Phys. Rev. B 2011, 83, 165428.(85) Ziman, J. M.; Mott, S. N. F.; Hirsch, P. B. The Physics of Metals;Cambride University Press: Cambridge, UK, 1969.(86) Yu, T. H.; Hofmann, T.; Sha, Y.; Merinov, B. V.; Heske, C.;Goddard, W. A. to be published 2012.(87) Kokalj, A.; Causa, M. J. Phys.: Condens. Matter 1999, 11, 7463−7480.(88) Smith, N. V.; Wertheim, G. K.; Hufner, S.; Traum, M. M. Phys.Rev. B 1974, 10, 3197−3206.(89) Nemoshkalenko, V. V.; Aleshin, V. G.; Kucherenko, Y. N.;Sheludchenko, L. M. Solid State Commun. 1974, 15, 1745−1747.(90) Shevchik, N. J. Phys. Rev. B 1976, 13, 4217−4220.(91) Hochst, H.; Hufner, S.; Goldmann, A. Phys. Lett. A 1976, 57,265−266.(92) Nemoshkalenko, V. V.; Aleshin, V. G.; Kucherenko, Y. N.;Sheludchenko, L. M. J. Electr. Spectrosc. Rel. Phenom. 1975, 6, 145−150.(93) Weinhardt, L.; Fuchs, O.; Umbach, E.; Heske, C.; Fleszar, A.;Hanke, W.; Denlinger, J. D. Phys. Rev. B 2007, 75, 165207.(94) Heske, C.; Treusch, R.; Himpsel, F. J.; Kakar, S.; Terminello, L.J.; Weyer, H. J.; Shirley, E. L. Phys. Rev. B 1999, 59, 4680−4684.(95) Sashin, V. A.; Dorsett, H. E.; Bolorizadeh, M. A.; Ford, M. J. J.Chem. Phys. 2000, 113, 8175−8182.(96) Northrup, J. E.; Hybertsen, M. S.; Louie, S. G. Phys. Rev. Lett.1987, 59, 819−822.(97) Northrup, J. E.; Hybertsen, M. S.; Louie, S. G. Phys. Rev. B 1989,39, 8198−8208.(98) Mahan, G. D.; Sernelius, B. E. Phys. Rev. Lett. 1989, 62, 2718−2720.(99) Shirley, E. L. Phys. Rev. B 1996, 54, 7758−7764.(100) Jensen, E.; Plummer, E. W. Phys. Rev. Lett. 1985, 55, 1912−1915.(101) Lyo, I.-W.; Plummer, E. W. Phys. Rev. Lett. 1988, 60, 1558−1561.(102) Hochst, H.; Goldmann, A.; Hufner, S. Z. Phys. B 1976, 24,245−250.(103) Yeh, J. J.; Lindau, I. Atomic Data Nucl. Data Tables 1985, 32,1−155.(104) Appleby, A. J. Catal. Rev. 1971, 4, 221−224.(105) Hyman, M. P.; Medlin, J. W. J. Phys. Chem. C 2007, 111,17052−17060.(106) Barteau, M. A. Catal. Lett. 1991, 8, 175−183.
(107) Clarke, T. A.; Gay, I. D.; Mason, R. Chem. Phys. Lett. 1974, 27,172−174.(108) Hall, G. K.; Mee, C. H. B. Phys. Stat. Sol. (a) 1971, 5, 389−395.(109) Anderson, P. A. Phys. Rev. 1949, 76, 388−390.(110) White, K. Physical Properties of the Platinum Metals. PlatinumMet. Rev. 1972, 59.
The Journal of Physical Chemistry C Article
dx.doi.org/10.1021/jp303276z | J. Phys. Chem. C 2012, 116, 24016−2402624026