Embed Size (px)
Citation preview
Ultraviolet PhotoelectronUltraviolet PhotoelectronSpectroscopy Spectroscopy
(UPS)(UPS)
Louis ScudieroLouis Scudiero
http://http://www.wsu.edu/~scudierowww.wsu.edu/~scudiero; 5; 5--26692669
[email protected]@wsu.edu
Photoelectron spectroscopy is the most powerful and versatile technique to study the electronic structure of the valence bands in atoms, solids and molecules (ionization energy of molecules, HOMO). The PE process depends on parameters such as:
Emitted electron parametersKinetic energyEmission anglesSpin polarization
Incident photon parametersPhoton energy (hν)Angle of incidencePolarization
Photoemission from Valence Bands
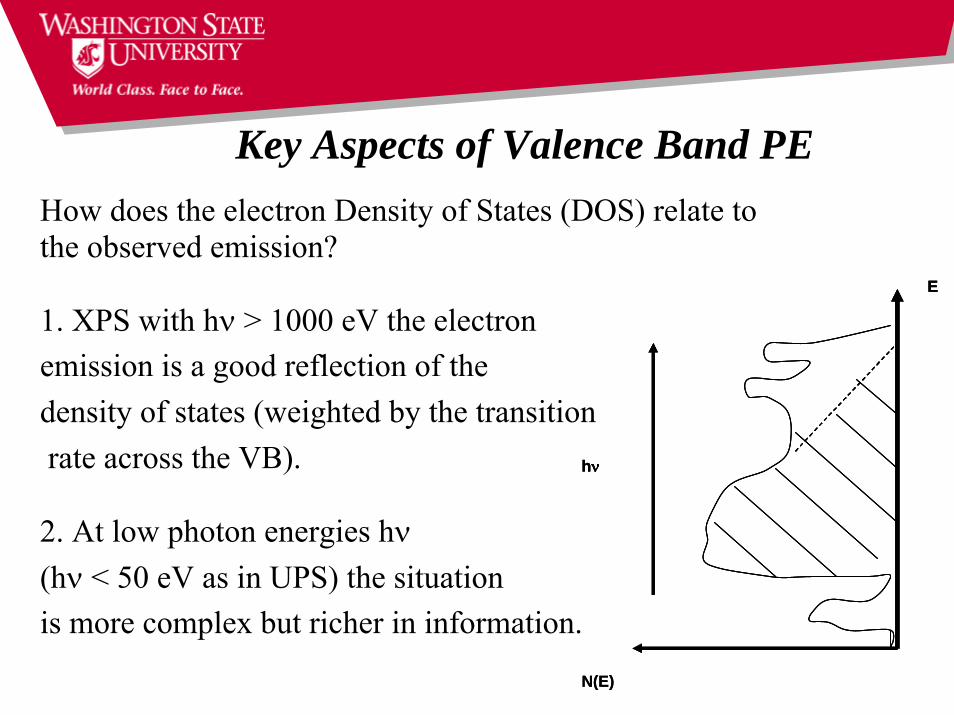
How does the electron Density of States (DOS) relate to the observed emission?
1. XPS with hν > 1000 eV the electron emission is a good reflection of the density of states (weighted by the transitionrate across the VB).
2. At low photon energies hν(hν < 50 eV as in UPS) the situation is more complex but richer in information.
N(E)
E
hν
N(E)
E
hν
E
hν
Key Aspects of Valence Band PE
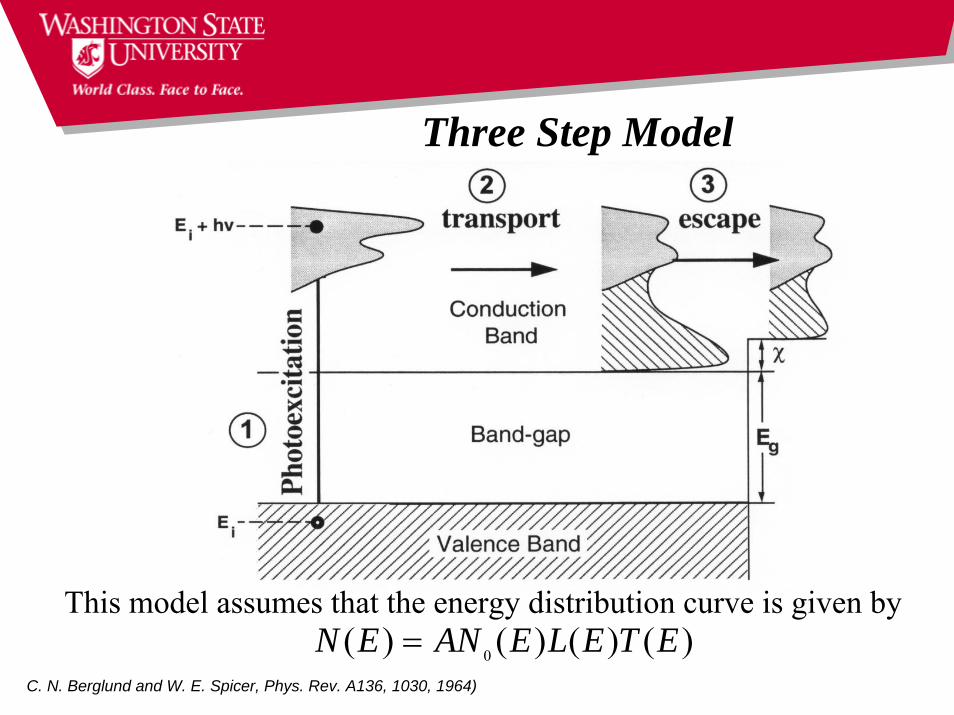
Three Step Model
This model assumes that the energy distribution curve is given by )()()()( 0 ETELEANEN =
C. N. Berglund and W. E. Spicer, Phys. Rev. A136, 1030, 1964)
N0(E): energy distribution of the electrons in the solid after photoexcitation.
L(E): characteristic transport length of the excited electrons describing the propagation to the surface (closely related to the electron mean free path).
L(E) ≈ l (E) / α(hν) (transport length of excited electron escaping into the vacuum without scattering)
α(hν): adsorption coefficient (incident photon intensity falls to 1/e value within a distance 1/α.l (E): electron escape depth.
T(E): probability for emission into vacuum (smooth function which does not introduce any structure to the spectra).
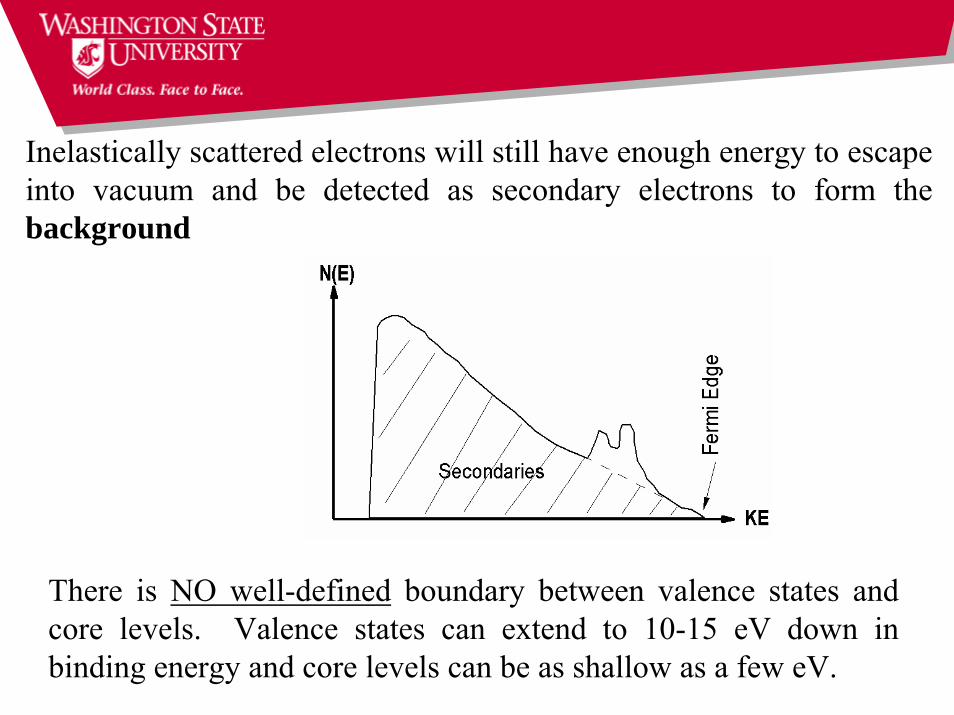
Inelastically scattered electrons will still have enough energy to escape into vacuum and be detected as secondary electrons to form the background
There is NO well-defined boundary between valence states and core levels. Valence states can extend to 10-15 eV down in binding energy and core levels can be as shallow as a few eV.
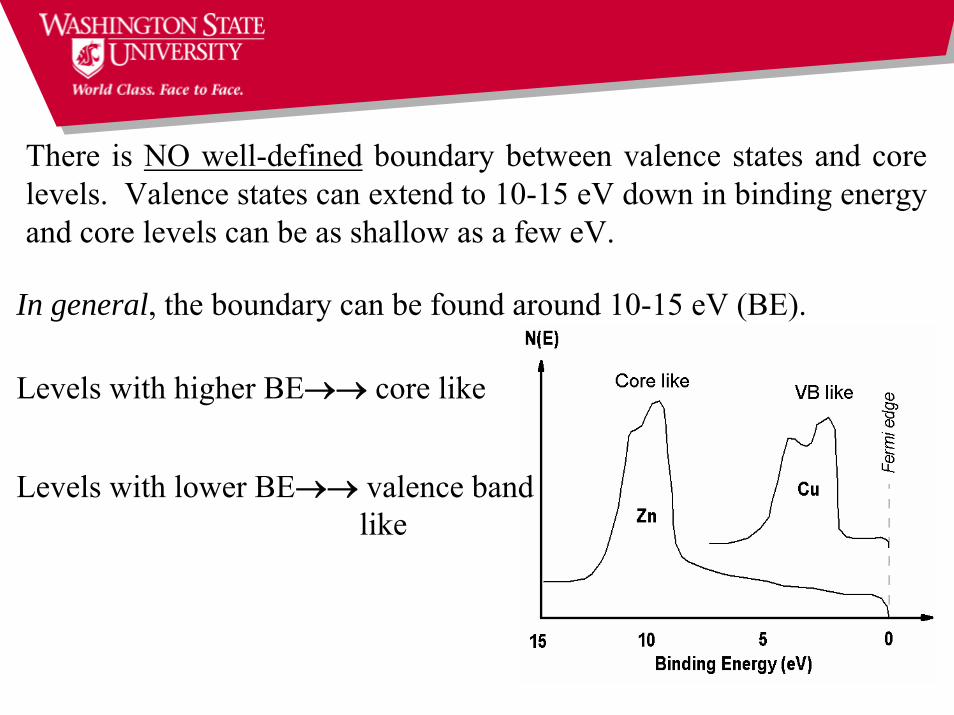
In general, the boundary can be found around 10-15 eV (BE).
Levels with higher BE→→ core like
Levels with lower BE→→ valence band like
There is NO well-defined boundary between valence states and core levels. Valence states can extend to 10-15 eV down in binding energy and core levels can be as shallow as a few eV.
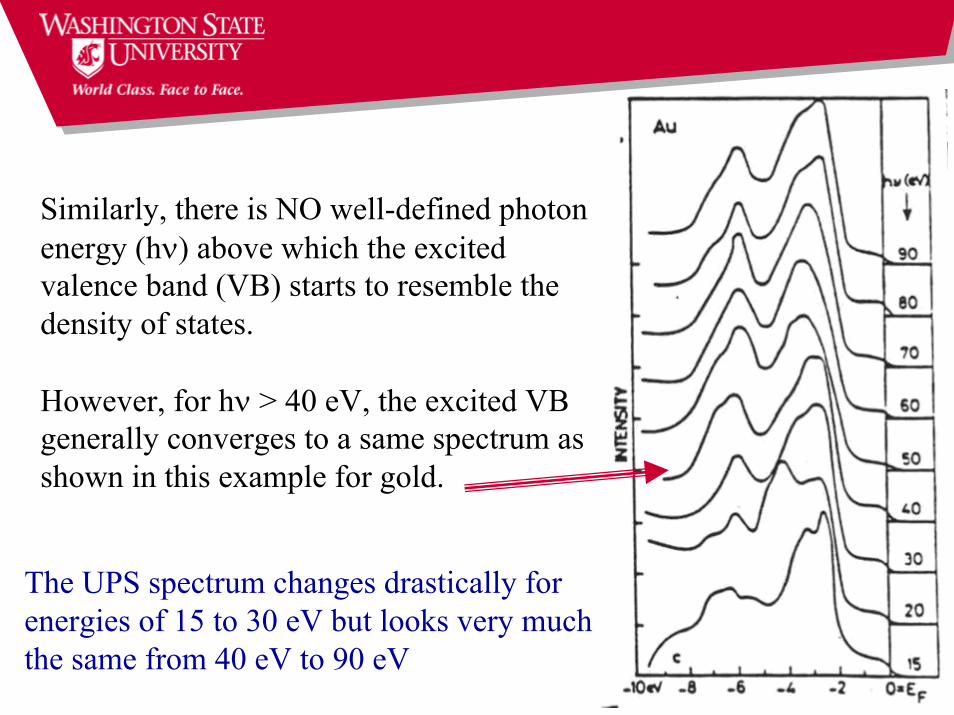
Similarly, there is NO well-defined photonenergy (hν) above which the excited valence band (VB) starts to resemble the density of states.
However, for hν > 40 eV, the excited VB generally converges to a same spectrum asshown in this example for gold.
The UPS spectrum changes drastically for energies of 15 to 30 eV but looks very much the same from 40 eV to 90 eV
Angle Resolved Photoemission• Angle resolved PE has found wide spread in electron
spectroscopy. The goal here is to determine the energy, E, and the electron momentum, ħk, of the emitted photoelectron outside the solid, and to relate to the energy dispersion, E vs k, inside the solid.
• Angle –resolved photoemission has emerged as the most direct technique to determine these relations experimentally.
• For PE we have very simple conservation laws:Energy conservation: Ei = Ef - hνMomentum conservation: ki// = kf//
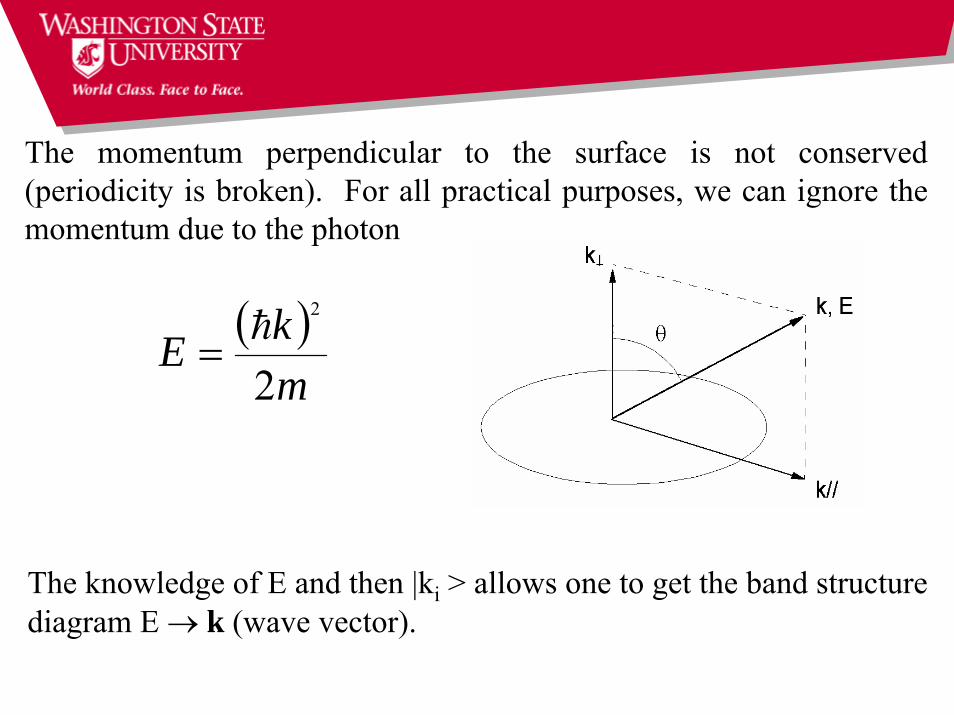
( )mkE
2
2h
=
The momentum perpendicular to the surface is not conserved (periodicity is broken). For all practical purposes, we can ignore the momentum due to the photon
The knowledge of E and then |ki > allows one to get the band structure diagram E → k (wave vector).
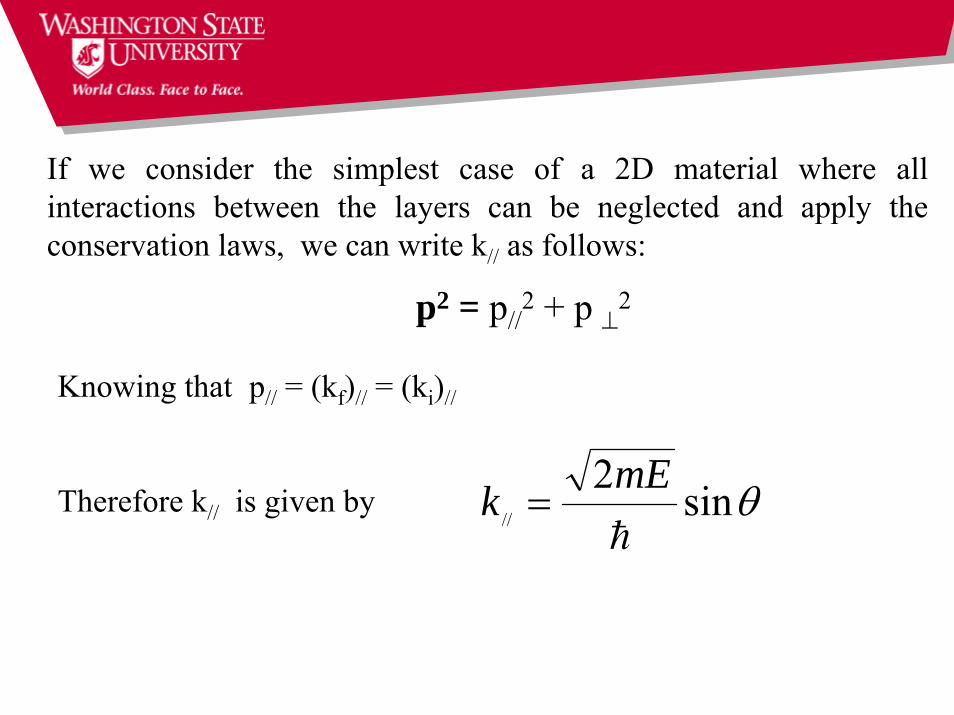
θsin2//
h
mEk =
p2 = p//2 + p ⊥2
Knowing that p// = (kf)// = (ki)//
Therefore k// is given by
If we consider the simplest case of a 2D material where all interactions between the layers can be neglected and apply the conservation laws, we can write k// as follows:
Γ
50
60
70
80
90
40
30
20
10
0Γ
Μ
E (eV)0 5 10 15 20
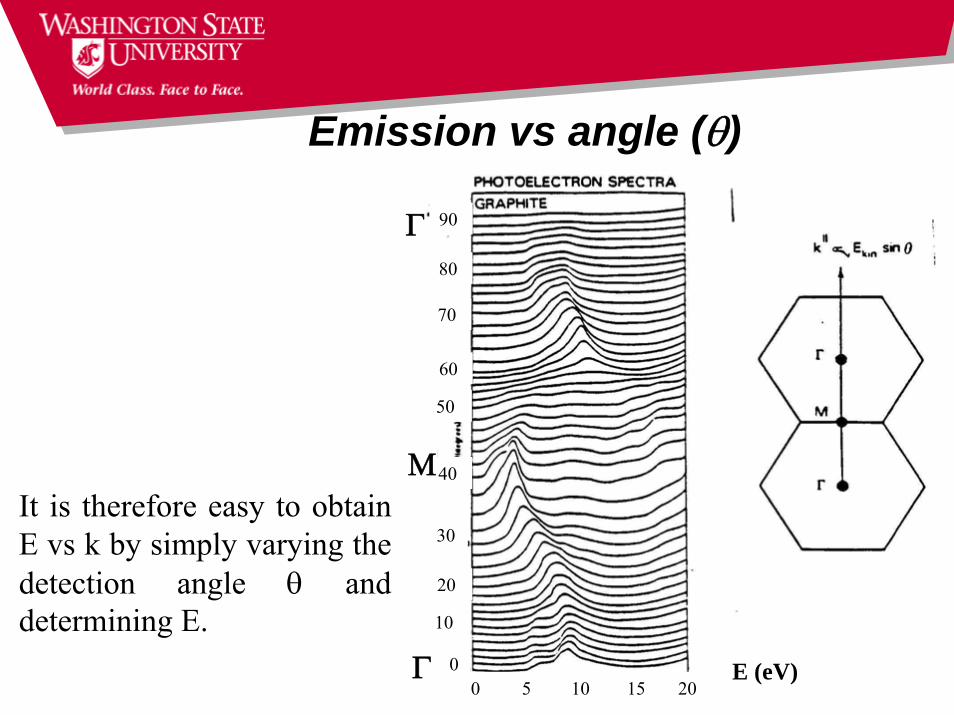
It is therefore easy to obtain E vs k by simply varying the detection angle θ and determining E.
Emission vs angle (θ)
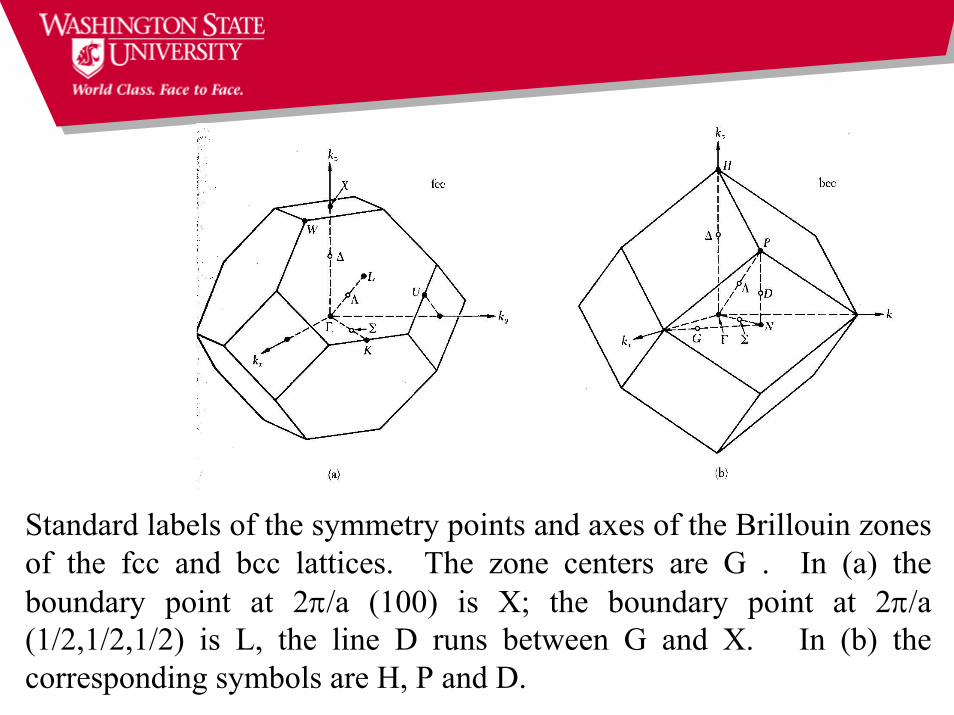
Standard labels of the symmetry points and axes of the Brillouin zones of the fcc and bcc lattices. The zone centers are G . In (a) the boundary point at 2π/a (100) is X; the boundary point at 2π/a (1/2,1/2,1/2) is L, the line D runs between G and X. In (b) the corresponding symbols are H, P and D.
Ionization sources are Ne I (16.6 eV), Ne II (26.8 eV) and He I (21.2 eV), He II (40.8 eV).He I and He II are produced by cold cathode capillary discharge.These lines represent resonance fluorescence produced when the gas is excited in the discharge and then decays back to its ground state.
I for light emitted from neutral atomsII for light emitted by singly ionized atoms
The resonance line produced by transition from the first excited state to the G.S is usually the most intense (called raie ultime).He I line is at 584Å or 21.22 eV and He II line at 304 Å or 40.8 eV.Turner and Jobory (J. Chem. Phys. 1962, 37, 3007) introduced the He I resonance line in 1962. He II line was first used by Price and co-workers in 1970 (Potts, A.W. Lenpka, H.J Streets D.G. and price, W.C. Phil. Trans Roy. Soc. London A, 1970, 268, 59).
Commonly Used Lines (16.6 to 40.8 eV)
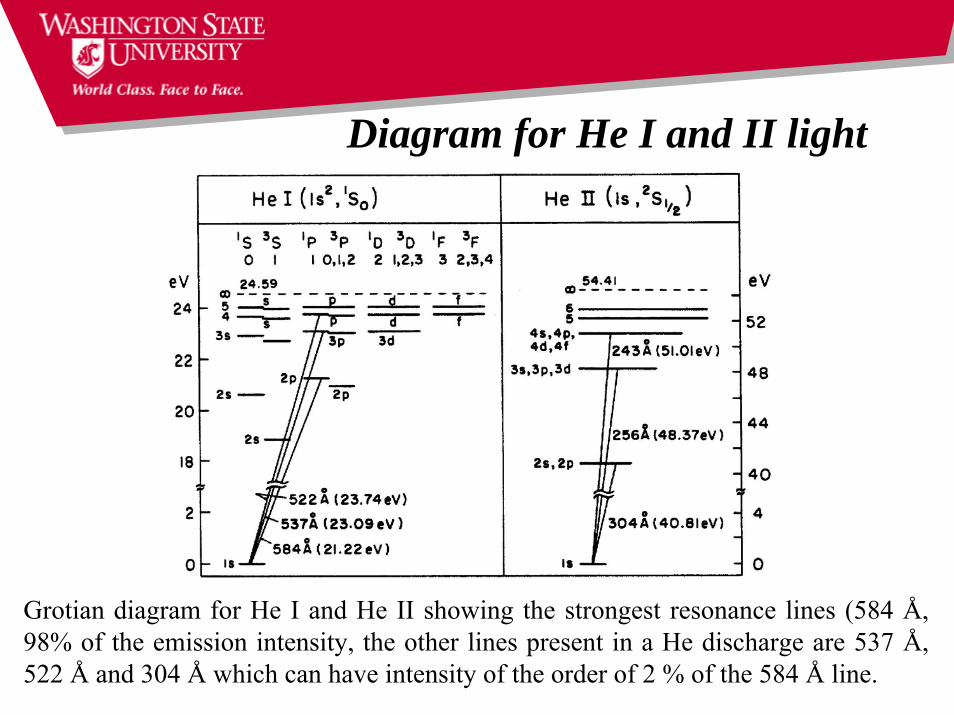
Diagram for He I and II light
Grotian diagram for He I and He II showing the strongest resonance lines (584 Å, 98% of the emission intensity, the other lines present in a He discharge are 537 Å, 522 Å and 304 Å which can have intensity of the order of 2 % of the 584 Å line.
Koopman’s TheoremThe binding energy of an electron in state i is equal to the negative of the orbital energy of the ith state.
(the ion is represented by (N-1) frozen orbitals)Koopman’s theorem makes possible the identification of calculated orbital energies with ionization potentials.
But it does not allow for electronic relaxation
The ionization energy for the removal of electrons from different orbitals in a molecule is given by the energy difference between the initial state of the neutral molecule (in the ground state) and the final state that is the state of the ionized molecule.
iiI ε−=
1.Intra-molecular relaxation (relaxation energy for a free molecule)
The N-1 electrons are rearranged around the hole, leading to lowering of the energy. The measured binding energy is always lower than the one calculated from Koopman’s theorem.Example: for the O 1s level in CO And for O 2s
BE (expt) = 542.3 eV BE (expt) = 38.9 eVBE (Koopman) = 562.4 eV BE (Koopman) = 41.1 eV
2. Extra-molecular Relaxation
When a gas is chemisorbed on a surface the energy levels of the chemisorbed molecule are shifted relative to those of the free gas.Effects: Bonding (initial state)
Relaxation (final state) or (polarization screening)
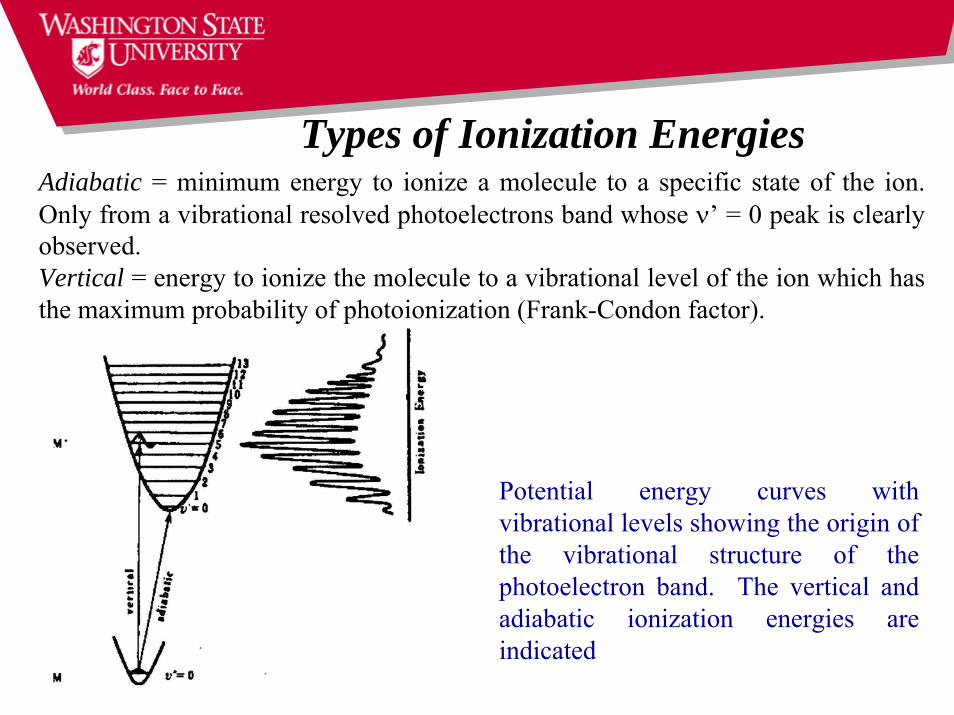
Adiabatic = minimum energy to ionize a molecule to a specific state of the ion. Only from a vibrational resolved photoelectrons band whose ν’ = 0 peak is clearly observed.Vertical = energy to ionize the molecule to a vibrational level of the ion which has the maximum probability of photoionization (Frank-Condon factor).
Types of Ionization Energies
Potential energy curves with vibrational levels showing the origin of the vibrational structure of the photoelectron band. The vertical and adiabatic ionization energies are indicated
Photoionization ProcessIn general, however the photoionization process to produce state i of the positive ion (M+) is described by the following expression:
ii KhI += υCase I: Metals
UPS could be used to determine the work function of metal. By measuring the width of the emitted electrons (W) from the onset of the secondary electrons up to the Fermi edge and subtracting W from the energy of the incident UV light, hν, the work function φm is then given by
Whm −= υϕ
I is the ionization energy
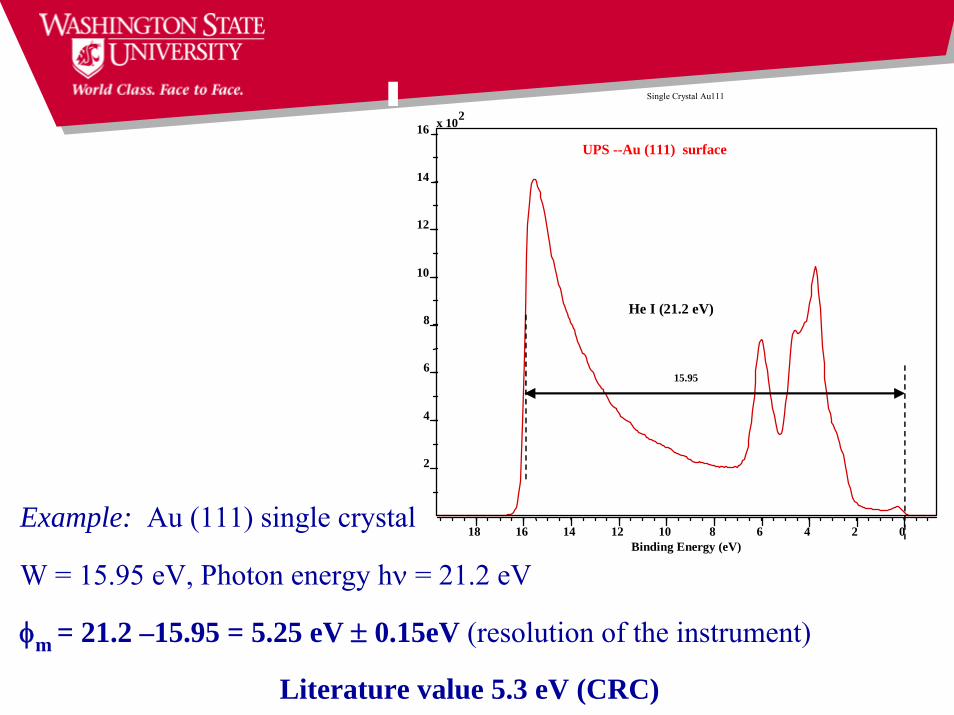
Example: Au (111) single crystal
W = 15.95 eV, Photon energy hν = 21.2 eV
φm = 21.2 –15.95 = 5.25 eV ± 0.15eV (resolution of the instrument)
Literature value 5.3 eV (CRC)
Single Crystal Au111
15.95
UPS --Au (111) surface
He I (21.2 eV)
x 102
2
4
6
8
10
12
14
16
18 16 14 12 10 8 6 4 2 0Binding Energy (eV)
Case II: Molecular systems
Not so simple in case of molecules Why?
1.Charge transfer across the interface (expected for the combination of strong acceptor-low work function or strong donor-high work function).
2.Redistribution of electron cloud (polarization of the electroncloud attracted by the image charge formed in the metal).
3.Interfacial chemical reactions (well known case for small molecules like CO and benzene on clean metal surfaces).
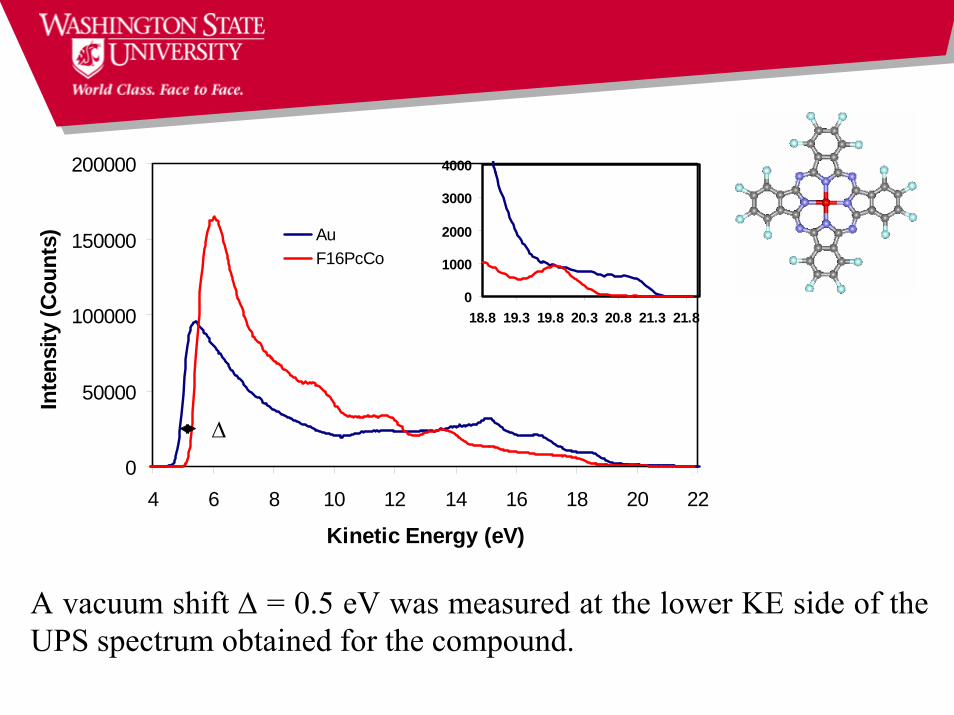
A vacuum shift Δ = 0.5 eV was measured at the lower KE side of the UPS spectrum obtained for the compound.
0
50000
100000
150000
200000
4 6 8 10 12 14 16 18 20 22
Kinetic Energy (eV)
Inte
nsity
(Cou
nts) Au
F16PcCo
∪
0
1000
2000
3000
4000
18.8 19.3 19.8 20.3 20.8 21.3 21.8
Δ
Au
F16CoPc
CoPc
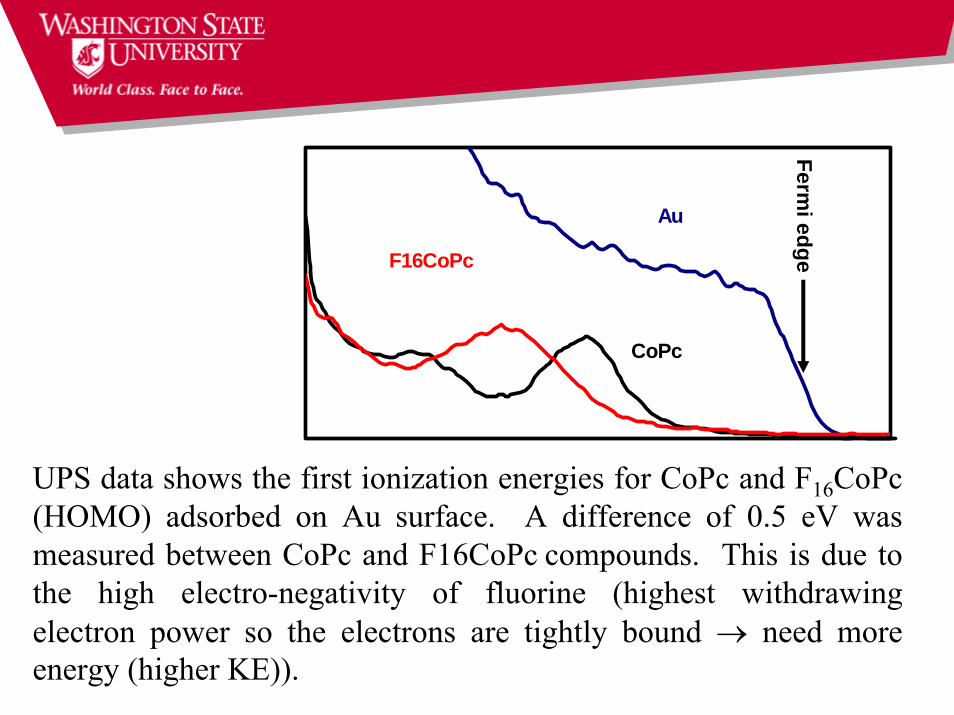
UPS data shows the first ionization energies for CoPc and F16CoPc (HOMO) adsorbed on Au surface. A difference of 0.5 eV was measured between CoPc and F16CoPc compounds. This is due to the high electro-negativity of fluorine (highest withdrawing electron power so the electrons are tightly bound → need more energy (higher KE)).
Fermi edge
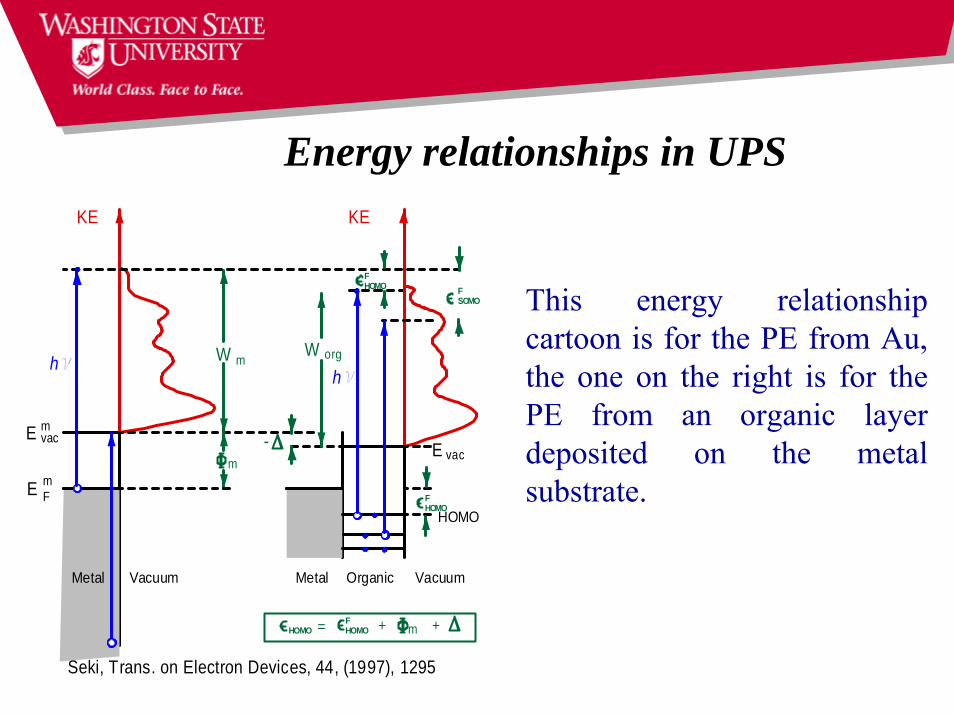
Energy relationships in UPSKE KE
h
m
W
HOMO
E F m
E vacE vac
m
Seki, Trans. on Electron Devices, 44, (1997), 1295
HOMOF
HOMOF
Metal Vacuum Metal Organic Vacuum
W org
hm
SOMOF
HOMOF=HOMO m+ +
-
This energy relationship cartoon is for the PE from Au, the one on the right is for the PE from an organic layer deposited on the metal substrate.
At the UV energies the background of degraded electrons severally distorts the spectrum near the work function cut-off.The cross-section of rare earth 4f and actinide 5f states are small.The shape of the PE spectrum is modulated by the unoccupied density of states.
XPS has a lower resolution and lower rates of data acquisition but it is insensitive to the empty density of states providing a clear view of the disposition of the occupied electronic orbital.
Behavior of an electronic orbital in different chemical state of the outer electrons of Au [Xe] 4f14 5d10 6s1 in two different systems.
Problems associated with UPS
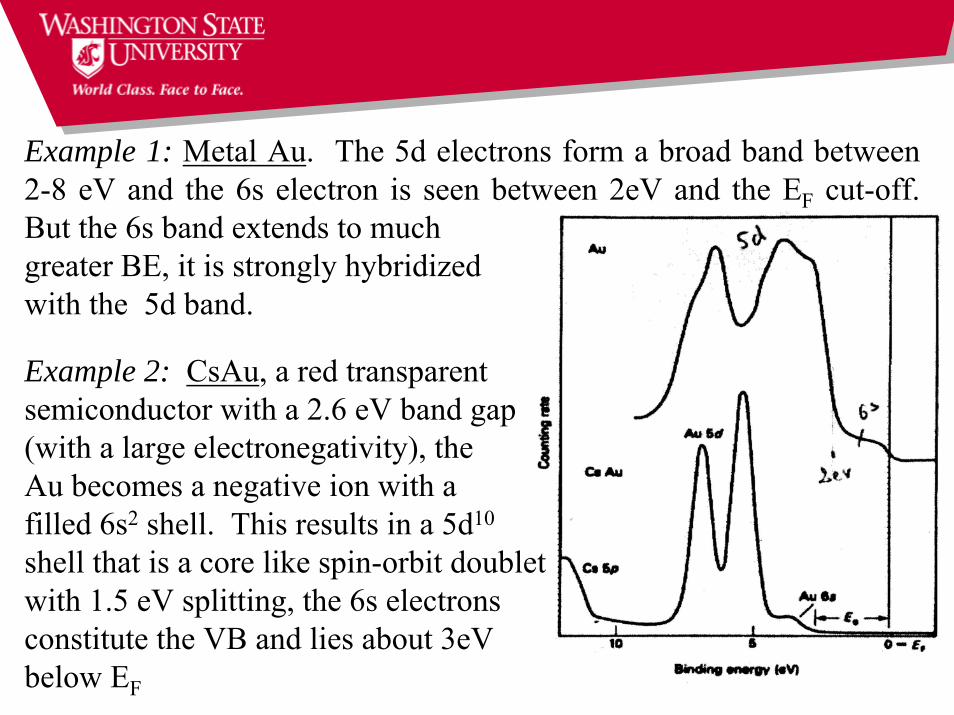
Example 1: Metal Au. The 5d electrons form a broad band between 2-8 eV and the 6s electron is seen between 2eV and the EF cut-off. But the 6s band extends to much greater BE, it is strongly hybridized with the 5d band.
Example 2: CsAu, a red transparent semiconductor with a 2.6 eV band gap (with a large electronegativity), the Au becomes a negative ion with a filled 6s2 shell. This results in a 5d10
shell that is a core like spin-orbit doublet with 1.5 eV splitting, the 6s electrons constitute the VB and lies about 3eV below EF
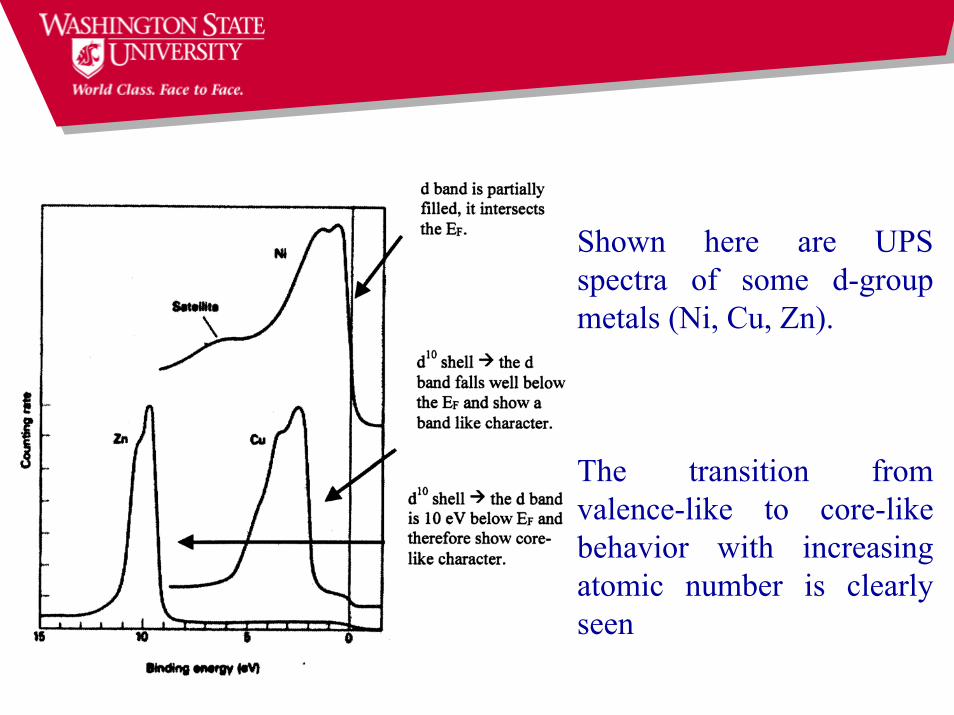
Shown here are UPS spectra of some d-group metals (Ni, Cu, Zn).
The transition from valence-like to core-like behavior with increasing atomic number is clearly seen
Photoelectron data do not correspond to the total one-electron density of states because: (1) Lifetime broadening, (2) Difference in cross-section and (3) Multi-electron excitations.
Lifetime broadeningThe VB spectrum is distorted by the hole-lifetime width which changes rapidly with BE. At EF no lifetime broadening is in evidence but at the bottom of the CB it may be substantial →→ Lorentzian tailing of the band edge coupled with a rising Plasmon loss-tail makes it difficult to define the bottom of the CB.Ex: the bottom of the 4s band in Cu is not detectable in PE (at 7.8 eV)
Difference in cross-sectionA good example is ReO3, a copper-colored conductor. The electronic configuration of Re 6+ is [Xe] 4f14 5d1. Experiment + theory agree on the 5d CB below EF well separated from the O 2p VB.
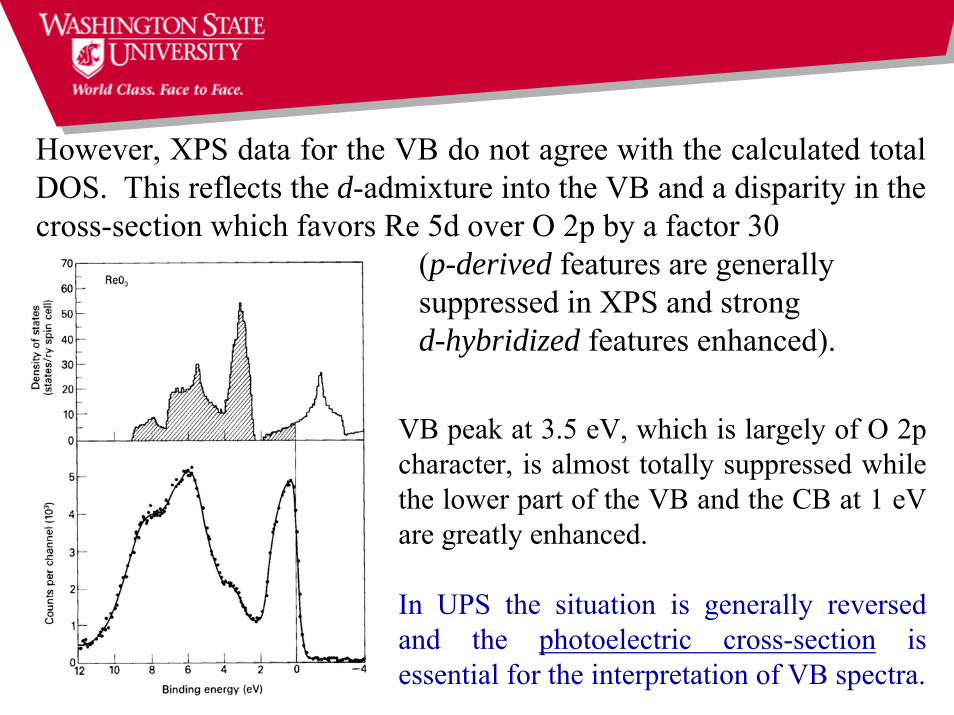
However, XPS data for the VB do not agree with the calculated total DOS. This reflects the d-admixture into the VB and a disparity in the cross-section which favors Re 5d over O 2p by a factor 30
(p-derived features are generally suppressed in XPS and strong d-hybridized features enhanced).
VB peak at 3.5 eV, which is largely of O 2p character, is almost totally suppressed while the lower part of the VB and the CB at 1 eV are greatly enhanced.
In UPS the situation is generally reversed and the photoelectric cross-section is essential for the interpretation of VB spectra.
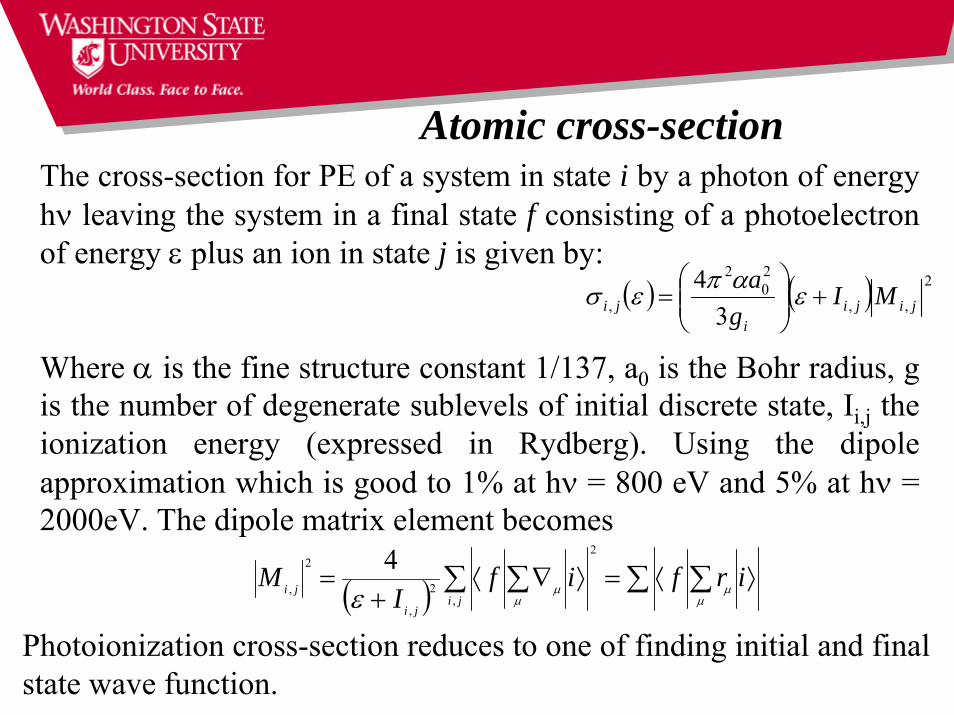
The cross-section for PE of a system in state i by a photon of energy hν leaving the system in a final state f consisting of a photoelectron of energy ε plus an ion in state j is given by:
Where α is the fine structure constant 1/137, a0 is the Bohr radius, g is the number of degenerate sublevels of initial discrete state, Ii,j the ionization energy (expressed in Rydberg). Using the dipole approximation which is good to 1% at hν = 800 eV and 5% at hν = 2000eV. The dipole matrix element becomes
( ) ∑ ∑∑ ∑ ⟩⟨=⟩∇⟨+
= irfifI
Mji
ji
jiμ
μμ
με
2
,2
,
2
,
4
( ) ( ) 2
,,0
, 34
jijii
ji MIg
a+⎟⎟
⎠
⎞⎜⎜⎝
⎛= εαπεσ
Atomic cross-section
22
Photoionization cross-section reduces to one of finding initial and final state wave function.
In the case of Xe and gold studied by Manson (Manson, S.T. Topics in Applied Physics V 26, p135), the εF wave function for Xe has a very small amplitude in the core region so that the overlap with the
Au 4d is quite small making very small. As the photon
energy hν increases, the εF wave function becomes more penetrating
and the dipole matrix element and σ increase.
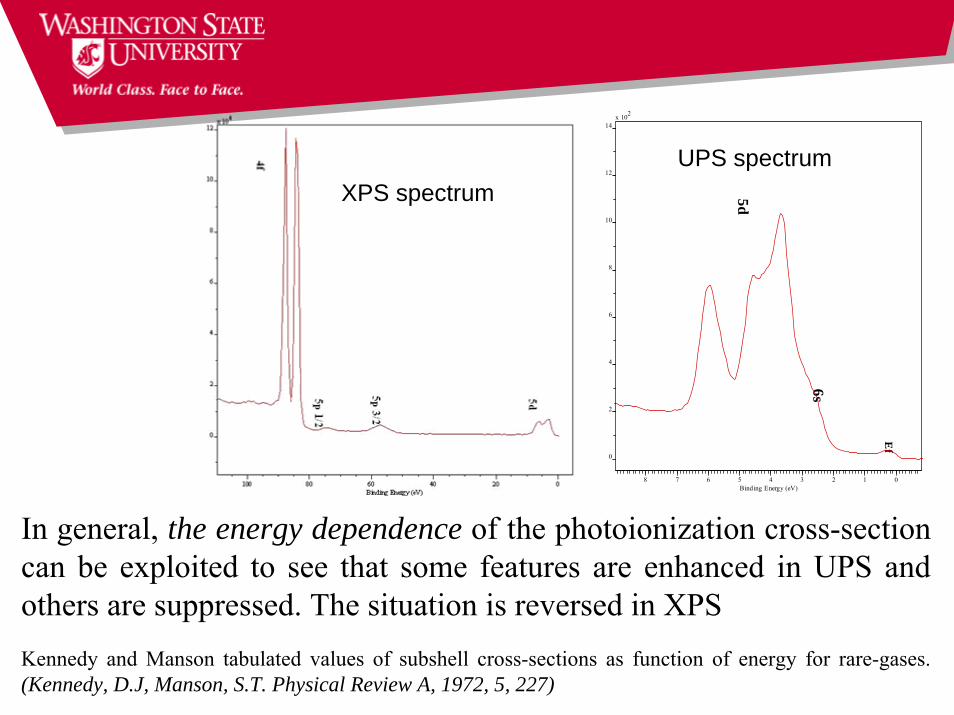
In the case of Au, the cross-section for the 5d- and 5p- states increase drastically for hν < 100 eV (UPS) and the cross-section for the 4f-state decreases. The situation is generally reversed at hν > 200 eV (XPS).
2
, jiM
2
, jiM
Ef
6s
5d
x 102
0
2
4
6
8
10
12
14
8 7 6 5 4 3 2 1 0Binding Energy (eV)
UPS spectrum
In general, the energy dependence of the photoionization cross-section can be exploited to see that some features are enhanced in UPS and others are suppressed. The situation is reversed in XPS Kennedy and Manson tabulated values of subshell cross-sections as function of energy for rare-gases. (Kennedy, D.J, Manson, S.T. Physical Review A, 1972, 5, 227)
XPS spectrum
Peaks may be introduced where none exist in the DOS as a result of multi-electron excitation. No guarantee that an observed feature in the VB region corresponds to a feature in the one-electron density of states.
Shake-up satellites are expected to be weak in the VB, because the relaxation energy associated with the outer shell is much smaller than a core level.
Strong coupling of electrons within a shell allows multiple holestates to be excited through configuration interaction or resonance process.
Multi-electron excitation
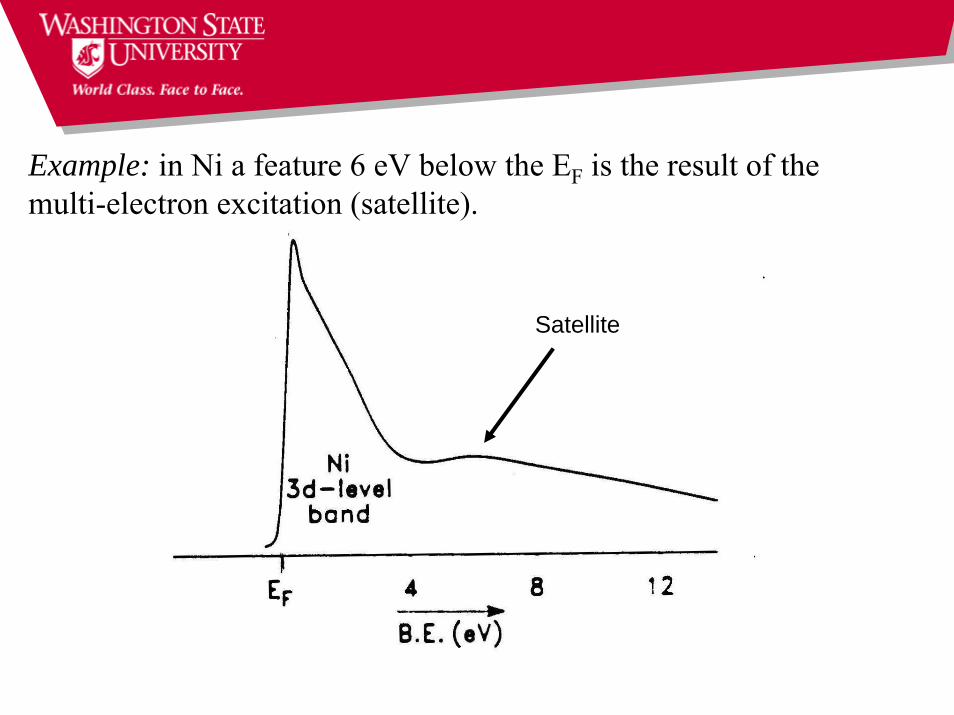
Example: in Ni a feature 6 eV below the EF is the result of the multi-electron excitation (satellite).
Satellite
Based upon a comparison between1. Electronic levels of gas phase spectra and2. Chemisorbed spectra.
Information can be obtained on1. Identification of species 2. Reaction products
Energy level positions can identify orbitals participating in gas substrate bonding
Polarization and photon energy dependence can provide1. Electron orbital identification2. Orientation of the chemisorbed species (structural information)
Chemisorption Studies
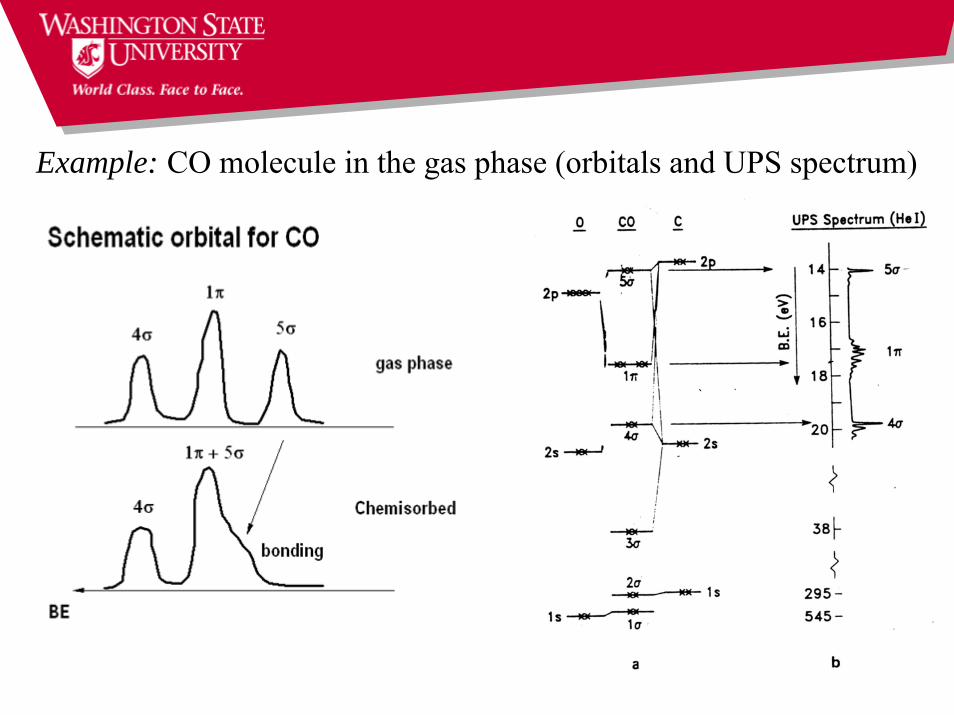
Example: CO molecule in the gas phase (orbitals and UPS spectrum)
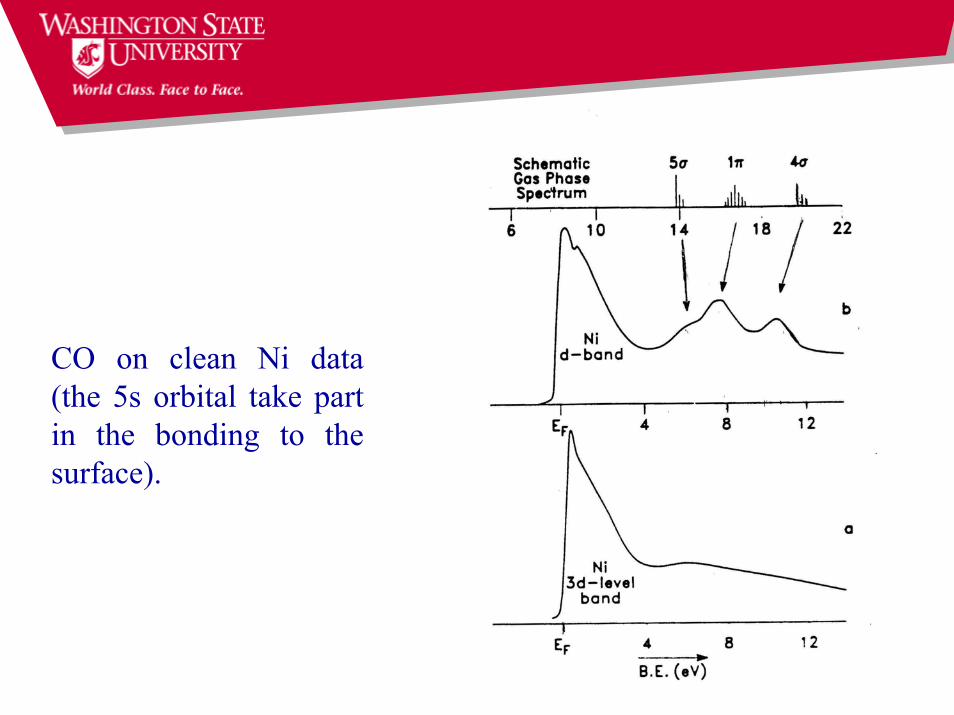
CO on clean Ni data (the 5s orbital take part in the bonding to the surface).


![Welcome [] · This X-ray Photoelectron Spectrometer (XPS) system with high resolution scanning field emission Auger system (AES), Ultraviolet Photoelectron Spectroscopy (UPS) and](https://img.pdfslide.us/doc/110x75/6112edfd9b5bbe153f6ae88c/welcome-this-x-ray-photoelectron-spectrometer-xps-system-with-high-resolution.jpg)