Embed Size (px)
Citation preview

1
Using MOVES for
Project-level PM Hot-Spot
Analyses

2
Statutory and Regulatory Requirements
CAA section 176(c) requires that federally supported transportation projects in nonattainment and maintenance areas cannot:» Cause or contribute to new air quality violations,» Worsen existing violations, or» Delay timely attainment of the national ambient air quality
standards (NAAQS) or interim milestones
Conformity rule requires a PM hot-spot analysis only for projects of local AQ concern » E.g., new or expanded highway/transit projects with a
significant # of diesel vehicles» Hot-spot analysis not required for other projects

What is a hot-spot analysis?
An estimation of likely future localized pollutant concentrations and a comparison to the relevant NAAQS» Required for certain projects in PM2.5, PM10, and CO
nonattainment and maintenance areas
Assesses air quality impacts on a scale smaller than an entire nonattainment or maintenance area» The area substantially affected by the project (the
“project area”)
MOVES is appropriate for quantifying vehicle emissions at the project-level
3

EPA’s Quantitative PM Hot-spot Conformity Guidance
Issued December 2010 How to model the local PM
air quality impacts of transportation projects:» modeling mobile source
emissions with MOVES
» modeling air quality concentrations with dispersion models: AERMOD and CAL3QHCR
Does not change existing conformity requirements
4www.epa.gov/otaq/stateresources/transconf/policy/420b10040.pdf

5
Step 1
Determine Need for
Analysis
Step 2
Determine Approach,
Models, and Data
Step 4
Estimate Emissions
from Road Dust,
Construction, and
Additional Sources
Step 9
Document Analysis
Step 7
Calculate Design
Values and
Determine
Conformity
Step 8
Consider Mitigation
or Control Measures
Step 5
Select Air Quality
Model, Data Inputs,
and Receptors
Step 6
Determine
Background
Concentrations
Step 3
Estimate On-Road Motor
Vehicle Emissions
Is project located in California?
Estimate using MOVES
Estimate using EMFAC
Yes
No
Quantitative PM Hot-spot Analysis Process

6
Running MOVES at the Project Scale
Define project links
Determine the number of
MOVES runs
Select parameters in
Run Specification (“RunSpec”)
Input project data into Project
Data Manager (PDM)
Run MOVES and generate
emission factors

PM Hot-Spot Example Project
7

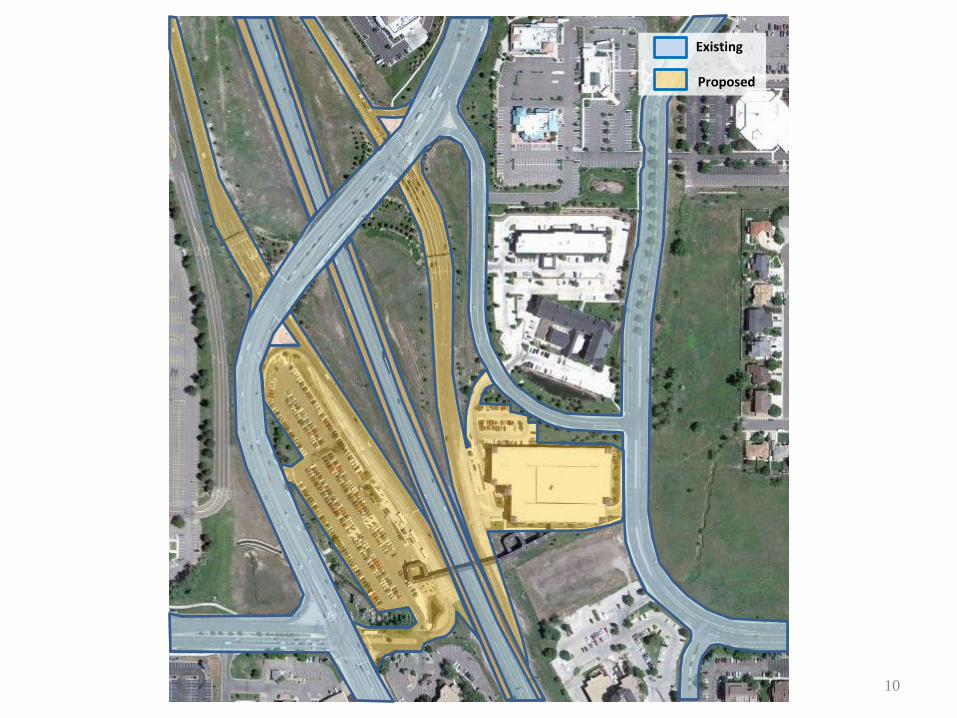
Project Details The project is a lane expansion of the existing
highway and the addition of an interchange (on/off ramps) to access two new park-and-ride lot and bus terminals
MOVES will be run to generate emission rates
The air quality analysis for the project will be done with AERMOD
8

9
10
Existing
Proposed

Project Details Location: Washtenaw County, MI
The project is expected to be completed in 2019» Year of expected peak emissions (analysis
year): 2020
Determined through interagency consultation to be a project of local air quality concern
The area surrounding the project is primarily residential and commercial, with no nearby sources that need to be included in modeling 11

Available Traffic Data Traffic estimates for all links
» Peak hour volume and average speed» Off-peak hour volume and average speedAverage speed approach will be used to define
activity
Expected bus volumes for peak and off-peak periods» Also average dwell time in bus bays
Expected start activity on parking lots for peak and off-peak periods» Also soak time distribution
12

Available Fleet Data
Age distribution provided by MPO» Light-duty from DMV data» Heavy-duty (long-haul trucks) from MOVES national
defaults
Fleet mix provided by state MPO» Arterial mix, Highway mix
Detailed bus roster (bus type and age distribution) provided by transit agency
13

A
B
C
14

15
A

4
5
6
7
10 9
8
11
13
20
19
16
A15
12
17
3
Queue
Acceleration
Cruise
12 Link Number
1
2
14

186 (404)
214 (465)
163 (355)
98 (213)
235 (511)
333 (724)
113 (245)
222 (573)
276 (600)
276 (600)
17
236(514)
A51
(110)
55(120)
29 (62)
88 (191)
189 (511)Queue
Acceleration
Cruise
113 Off-Peak Volume
(245) (Peak Volume)
113 (245)
143 (311)

18
B

87
21
25
24 22
27
31
23
29
30
32
34
35
36
19
38 40
B
28
26

165 (359)
165(359)
111 (241)
149(324)
69 (150)
69 (150)
276 (600)
377(819)
333 (724)
259(563)
184(400)
20
3456 (5786)
3780(5890)
333 (724)
B
118 (256)
112 (243)
148 (322)
277(602) 302
(656)

21

75
75
22

23
C

43
44
4645 53
50
49
51
54
565841
59
27
24
47
57
52
C55
42
36
48

302 (656)
157 (341)
22(48)
166 (360)
141 (307)253
(549)
199(431)
69 (150)
302 (656)
25
29(62) 83
(180)
83(180) 39
(85)
166(360)
C98
(213)
122(265)
69 (150)
277 (602)
297(644)
279 (606)
129 (280)

26

60
65
61
62
63
66
75
38
27
40
39
67
64

Starts55
(120)
35(75)
35(75)
342(744)
40(87)
28
40(87)
1971 (4285)
2519 (5476)
2775 (6032)
23(50)
365(794)
216(469)

29

68
65
66
67
75
30
72 70
6971
74
16 1873

216(469)
40(87)
40(87)
Starts259
(517)
31
40(87) 361
(787)184
(400)
257(558)
184(400)
315 (684)
64 (139)
111 (242)
203(442)

32

Traffic Data: Link Volumes/Speeds/Lengths
33

Traffic Data: Fleet Mix
34
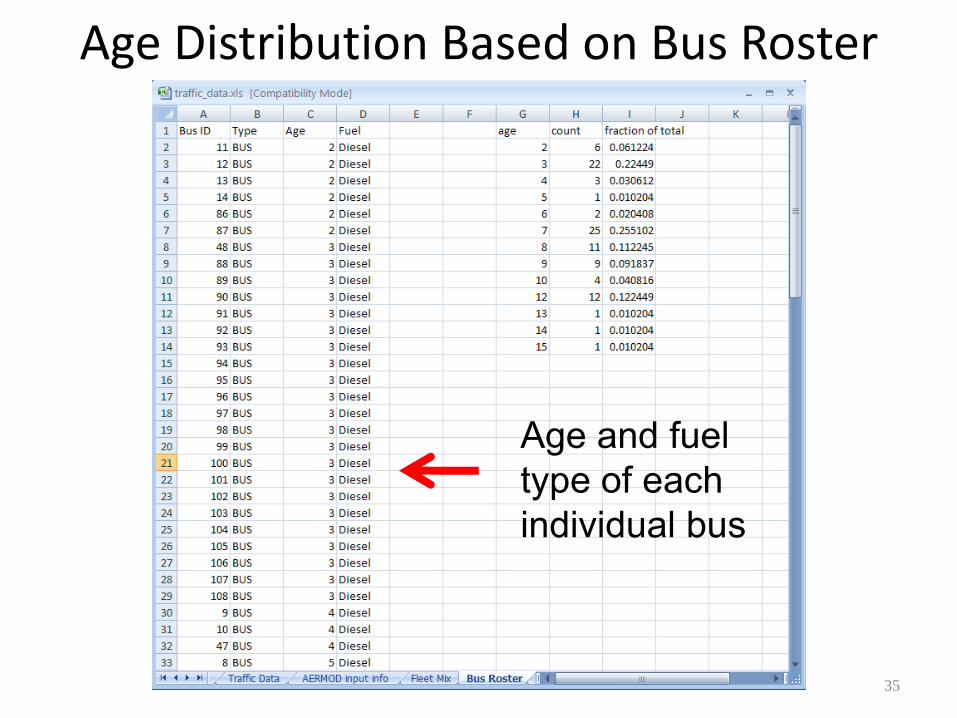
Age Distribution Based on Bus Roster
35
Age and fuel type of each individual bus

Importing Data
Browse and Import Data from Spreadsheet
Links: Links_offpeak.xls
Link Source Types: linksource.xls
Link Drive Schedule: not used
Fuel: fuels_jan.xls
Age Distribution: agedist.xls
Operating Mode Distribution: opmode.xls
Off-Network: offnetwork.xls
Meteorology Data: met_jan12am.xls
I/M Programs: not used
Generic: not used
36

Deriving Links Table from Traffic Data
37

Links Input (links_offpeak.xls)
38

Link Source Type Input (linksource.xls)
Arterial and Highway Fleet Mix from MPO county-level analysis
Bus-only links are entirely sourcetype 42
39
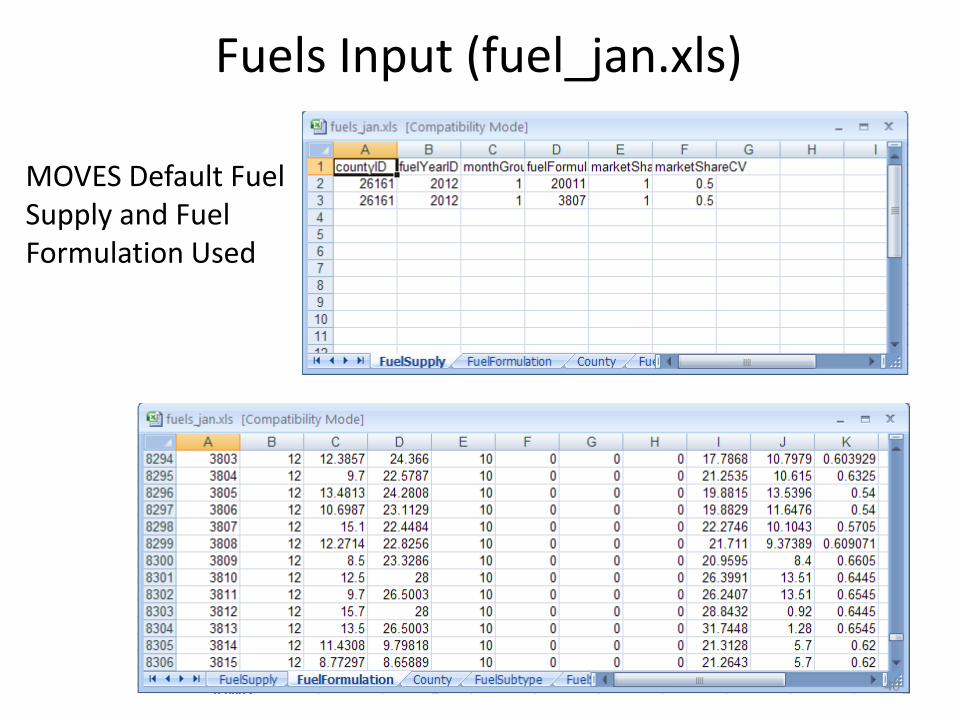
Fuels Input (fuel_jan.xls)
MOVES Default Fuel Supply and Fuel Formulation Used
40

Age Distribution Input (agedist.xls)
Provided by MPO
Local Data for Transit Buses (sourcetype 42) Obtained from Bus Roster
41

Off-network Input (offnetwork.xls)
Expected use of park-and-ride facility (ratio of source types 21 vs. 31 correct, but numbers are only a placeholder… actual grams/start emission rates will be calculated in a post-processing step) 42

Deriving OpMode Distribution from Traffic Data
Expected use of park-and-ride facility
43

OpMode Distribution Input (opmode.xls)
44

Meteorology Input (met_jan12am.xls)
Temperature and humidity data taken from nearby met station (same dataset used for air quality analysis)
45

All Files Imported
46

Execute RunSpec
47

Run Script on Output
In MOVES, select from Post Processing Menu > Run MySQLScript on Output Databse
48

Gram per Hour Emission RatesIn MySQL output database “Transit_Exercise_Out” new table was created called pm25_grams_per_hour that includes a single emission rate for each link and MOVES run
49

For More Information See EPA’s conformity website for:
» Regulations, policy guidance, FR notices, training» http://www.epa.gov/otaq/stateresources/transconf/policy.htm#project
See EPA’s MOVES website for:» Software, MOVES MySQL scripts, technical documentation, and
other helpful background materials» www.epa.gov/otaq/models/moves/
Questions? » General questions on PM hot-spot guidance
» General questions on CO project-level MOVES guidance– [email protected]
» Technical questions about both guidance documents:– [email protected]
50