Embed Size (px)
Citation preview
8/11/2019 Using molecular marker technology in studies on plant genetic diversity
http://slidepdf.com/reader/full/using-molecular-marker-technology-in-studies-on-plant-genetic-diversity 1/374
Using molecular marker technologyin studies on plant genetic
diversity
M. Carmen de Vicente (IPGRI)and Theresa Fulton (Institutefor Genomic Diversity,Cornell University)
8/11/2019 Using molecular marker technology in studies on plant genetic diversity
http://slidepdf.com/reader/full/using-molecular-marker-technology-in-studies-on-plant-genetic-diversity 2/374
8/11/2019 Using molecular marker technology in studies on plant genetic diversity
http://slidepdf.com/reader/full/using-molecular-marker-technology-in-studies-on-plant-genetic-diversity 3/374
vi
Acknowledgements
The production of Using Molecular Marker Technology in Studies on Plant Genetic Diversity was made possible through a collaborative effort between International PlantGenetic Resources Institute (IPGRI) and Institute for Genomic Diversity (IGD of CornellUniversity). The authors especially thank the following contributors:
The IPGRI-Asia, the Pacific and Oceania Regional Office who, through its Tropical Fruit
Trees Project, itself funded by the Asian Development Bank (ADB), partly funded thedevelopment of this material.
Félix Alberto Guzmán (IPGRI-Americas Regional Office), for his help in gatheringinformation for the modules, especially in choosing good examples of application oftechnologies to real genetic diversity studies, and also for his judgement in making themodules clear and comprehensible.
Brian V. Ford-Lloyd (University of Birmingham, UK), who authored the earlier trainingmodule produced by IPGRI in 1996 ( Measuring genetic variation using molecular markers ), which helped in the preparation of this extended and updated module. Indeed,we have retained his text in appropriate places.
Pere Arús (Institut de Recerca i Tecnologia Agroalimentàries, IRTA, Spain), for his helpwith the slides for interpreting isozymes, and for his willingness to lend a series ofpictures on laboratory procedures for detecting isozymes. These pictures were includedin the respective submodule.
Andrzej Kilian (Centre for the Application of Molecular Biology to InternationalAgriculture, CAMBIA, Australia), for agreeing to our using the schematic illustrations ofDArT as they appear on CAMBIA's Web page.
Steve Tanksley (Cornell University, NY), for lending us slides on microsatellites from histeaching collection so we could use them in our modules; and Rebecca Nelson, alsofrom Cornell, for sharing information on simplifying AFLP protocols.
Humberto Gómez Paniagua (Centro Internacional de Agricultura Tropical, CIAT-Colombiaand International Crops Research Institute for the Semi-Arid Tropics, ICRISAT-Colombia),for sharing pictures of RAPD profiles for use as examples of good and bad results withthis technology; and for giving us plenty of ideas on how to improve the didacticpresentation of this product.
Helmer Ayala (Universidad de San Carlos, Guatemala), for the example of AFLPdetection with silver staining; Xiaoming Pang (Guizhou University, China), for a picture ofmicrosatellites with silver staining; and Kamel Chabane (International Center forAgricultural Research in Dry Areas, ICARDA, Syria) and Martin Fregene (CIAT,Colombia), for sharing pictures of the application of different molecular markers for useas background in different submodules.
The staff at the Genetic Resources Unit, CIAT (Colombia), for allowing us to takepictures of the isozyme procedures in their laboratory.
Professor Heiber Cárdenas (Biology Department, Universidad del Valle, Cali, Colombia),for testing the training module with five of his students (Iván Andrés González, OlgaLucía Agudelo Henao, Martha Nora Moyano, Fernando Rondón González and DiegoMauricio Villamarín Miranda), and for providing valuable comments for the module'simprovement.
Luigi Guarino, Ramanatha Rao, Issiaka Zoungrana, Margarita Baena, Toby Hodgkin, JanEngels and Elisabeth Goldberg (different IPGRI offices), for their comments and

8/11/2019 Using molecular marker technology in studies on plant genetic diversity
http://slidepdf.com/reader/full/using-molecular-marker-technology-in-studies-on-plant-genetic-diversity 4/374
vii
suggestions on how to improve this product and hopefully make it more useful to ourpartners.
W. H. Freeman and Company/Wor th Publishers (New York) for the permission granted toreproduce modified versions of Figures 4-3, 11-12, 12-3 (a), 12-6, 12-7 (c), 12-7 (d), 14-20, 14-24, 14-29 and 17-10 (a) from the book published by them in 1996 with the titleIntroduction to Genetic Analysis (written by Griffiths et al .).
Elizabeth L. McAdam for her help in manuscript editing and her good suggestions to
improve the format of this product.
8/11/2019 Using molecular marker technology in studies on plant genetic diversity
http://slidepdf.com/reader/full/using-molecular-marker-technology-in-studies-on-plant-genetic-diversity 5/374
iv
Foreword
Plant genetic resources are a key component in the sustainable development ofagriculture and forestry. They contribute to development by helping to increase foodproduction, eradicate poverty and protect the environment. The loss of genetic resourcesand, as a consequence, the genetic diversity they represent, is a widespread reality. It istherefore vitally important that we develop adequate and effective strategies to conserve
these genetic resources. We need to build further on our knowledge of genetic diversityand introduce novel and powerful approaches that will eventually lead to a cost-effectiveidentification of useful genes in germplasm. An effective use of genetic resources will bean important prerequisite for their sustainable conservation.
Molecular marker technologies are the most advanced and, possibly, the most effectivemeans for understanding the basis of genetic diversity. They are efficient and accuratetools with which genetic variation can ultimately be identified and assessed in a rapidand thorough manner. By applying molecular technologies to approach the biologicalquestions underlying the understanding of genetic diversity, we can make significantprogress in the speed and depth at which we attain adequate and appropriateconservation and, thus, genetic resources made available for its use in cropimprovement. However, the use of molecular markers is expensive and limited financial
resources mean that they should be used in the most judicious way possible.
This set of training modules aims to facilitate capacity building in the use of molecularmarker technologies, as it recognises that skilled human resources and institutionscapable of "keeping pace with scientific progress" are key to the conservation of geneticresources. The authors are keenly aware of this need, and have therefore developed thisset of training modules, of which Using Molecular Marker Technology in Studies on Plant Genetic Diversity is the first, to help build capacity in the use of molecular technologies.With this module, workers in plant genetic resources should be able to makebetter-informed decisions on the methods to use so they may more readily understandand, therefore, more effectively safeguard the genetic resources that underlie our veryexistence.
Jan EngelsDirectorGenetic Resources Science and Technology GroupIPGRI
8/11/2019 Using molecular marker technology in studies on plant genetic diversity
http://slidepdf.com/reader/full/using-molecular-marker-technology-in-studies-on-plant-genetic-diversity 6/374
Using molecular marker technologyin studies on plant geneticdiversity
About this module Objectives I Introduction II Protein-based technologies III DNA-based technologies IV PCR-based technologies V Complementary technologies VI Final considerations VII Glossary
VIII Feedback form
8/11/2019 Using molecular marker technology in studies on plant genetic diversity
http://slidepdf.com/reader/full/using-molecular-marker-technology-in-studies-on-plant-genetic-diversity 7/374
viii
What you should know about the module
We feel strongly that when you study plant genetic diversity, you need to know whatyour goals are, what your limitations are, and what you must accomplish.
We have therefore taken care to discuss:
• The fundamental principles of genetic diversity,• The qualities of the markers used to measure it and• The most widely used technologies, including those based on proteins, DNA and
the polymerase chain reaction.
Explanatory graphics and photographs illustrate key experimental procedures, andreal-life examples are given of applications to particular cases of genetic diversitystudies and/or germplasm management. These should help in the use of the module asa useful educational resource, whether as a self-tutorial or incorporated into a universitycurriculum.
We also compare the various techniques—their advantages and disadvantages, andrelative costs of each procedure to help the beginning scientist understand the key
components for selecting those procedures most appropriate for a given research.
Because this module was designed for use as a training aid or reference tool, lists ofkey references, references to extra applications and equipment lists are also given.
The module is intended for scientists with a minimal background in genetics and plantmolecular biology, but with a working knowledge of plant genetic resources and issuesconcerning their conservation and management. We hope that the module will beparticularly useful to scientists in developing countries, for whom print materials may beunavailable, expensive, or too quickly outdated. We also hope that it will be useful forscience educators who wish to have access to a general overview of current DNAtechnologies and their possible uses in biodiversity conservation and use.
So that users may select only those sections of relevance or interest to them, weorganised the module into complementary yet independent submodules. The exceptionis the Introduction, which is relevant to all sections and should always be included. Inthis way, the module, as a whole, can be used as reference for particular protocols, as arefresher or update for the scientist needing to make new research decisions or as aguide for short technical workshops.
Updating and feedback are of critical importance in the very fast evolving fields ofmolecular genetics (and their associated technologies) and plant genetic resources. Weexpect to update this product at relatively frequent intervals. To effectively respond toour partners and other users' needs, we would greatly appreciate your giving usfeedback on the organisation, content and usefulness of this tool. You can write to us [email protected]; [email protected] or at our mail addresses:
International Plant Genetic Institute for Genomic DiversityResources Institute 130 Biotechnology BuildingVia dei Tre Denari 472/a Cornell University00057 Maccarese Ithaca, NY 14583Rome, Italy

8/11/2019 Using molecular marker technology in studies on plant genetic diversity
http://slidepdf.com/reader/full/using-molecular-marker-technology-in-studies-on-plant-genetic-diversity 8/374
ix
We most wish that the module will be used in diverse ways and that it will, together witha companion module on the analysis of marker data for genetic diversity studies,expected to be out by the end of 2003, bring to many readers, especially those indeveloping countries with limited access to state-of-the-art technologies, a chance toconduct advanced research in plant genetic diversity, thereby contributing to the world'sknowledge of these valuable resources.
M. Carmen de Vicente Theresa FultonIPGRI IGD, Cornell University

8/11/2019 Using molecular marker technology in studies on plant genetic diversity
http://slidepdf.com/reader/full/using-molecular-marker-technology-in-studies-on-plant-genetic-diversity 9/374
x
Objectives of the module
Our goals for the module are that users:
• Understand the basic scientific concepts underlying molecular marker and DNAsequence technologies, and their use with reference to plant genetic resources
• Develop the ability to compare and contrast the advantages and limitations ofeach technology, and thus make the most appropriate decisions relevant to theusers' specific research situations
• Have available a current list of bibliographical resources for each technology
8/11/2019 Using molecular marker technology in studies on plant genetic diversity
http://slidepdf.com/reader/full/using-molecular-marker-technology-in-studies-on-plant-genetic-diversity 10/374
Using molecular marker technology in
studies on plant genetic diversity
Introduction
Copyright: IPGRI and Cornell University, 2003 Introduction 1
8/11/2019 Using molecular marker technology in studies on plant genetic diversity
http://slidepdf.com/reader/full/using-molecular-marker-technology-in-studies-on-plant-genetic-diversity 11/374
Copyright: IPGRI and Cornell University, 2003 Introduction 2
2
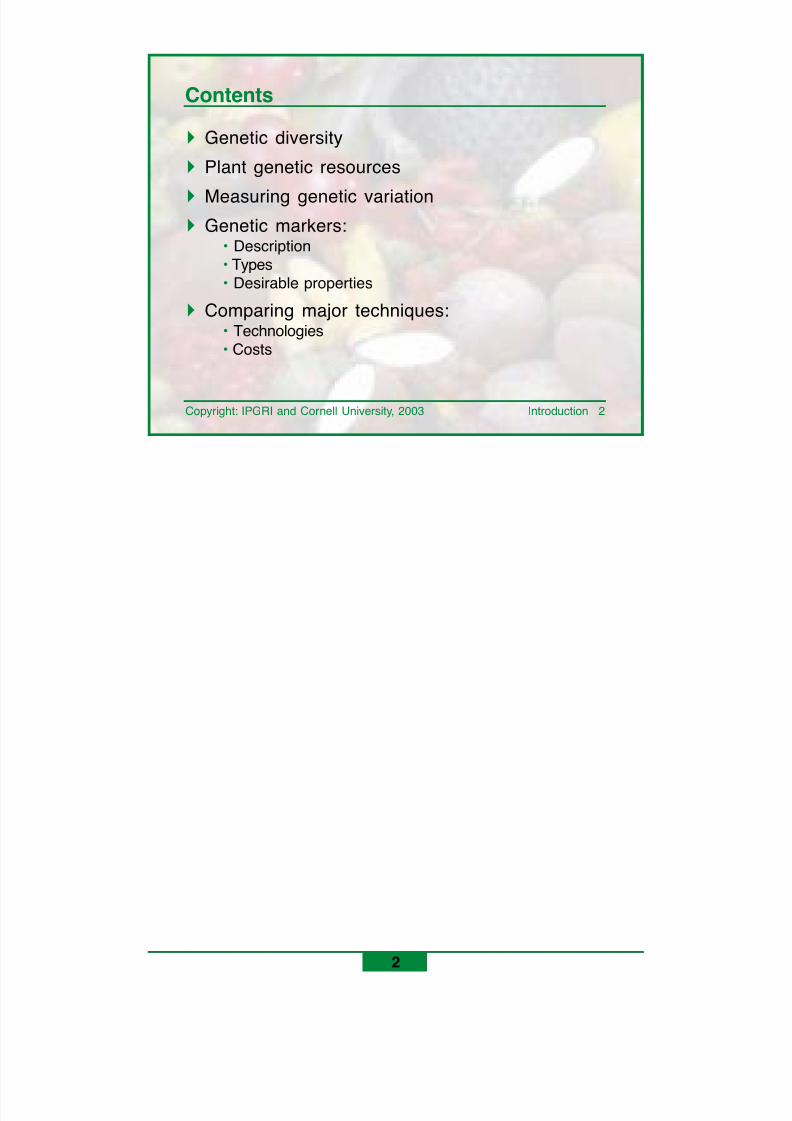
Contents
! Genetic diversity! Plant genetic resources
! Measuring genetic variation! Genetic markers:
• Description• Types• Desirable properties
! Comparing major techniques:• Technologies• Costs
8/11/2019 Using molecular marker technology in studies on plant genetic diversity
http://slidepdf.com/reader/full/using-molecular-marker-technology-in-studies-on-plant-genetic-diversity 12/374
Copyright: IPGRI and Cornell University, 2003 Introduction 3
3
! Genetic diversity refers to variation in the:• DNA sequence,
• Amount of DNA per cell or• Number and structure of chromosomes
! Genetic diversity is the result of selection,mutation, migration, genetic drift and/orrecombination. All these phenomena causechanges in gene and allele frequencies, leadingto the evolution of populations
Genetic diversity
Genetic diversity refers to the variation of genes within species, that is, the heritablevariation within and between populations of organisms. In the end, all variation resides inthe sequence of the four base pairs that compose the DNA molecule and, as such,constitute the genetic code. Other kinds of genetic diversity can also be identified at alllevels of organisation in the nucleus, including the amount of DNA per cell, chromosomenumber and DNA structure.
The generation of new genetic variation occurs continuously in individuals throughchromosomal and gene mutations, which, in organisms with sexual reproduction, arepropagated by recombination. Genetic variation is also influenced by selection. Theconsequences of these phenomena are changes in gene and allele frequencies thataccount for the evolution of populations. Similar situations can occur through artificialselection such as breeding.
8/11/2019 Using molecular marker technology in studies on plant genetic diversity
http://slidepdf.com/reader/full/using-molecular-marker-technology-in-studies-on-plant-genetic-diversity 13/374
Copyright: IPGRI and Cornell University, 2003 Introduction 4
4
! Plant genetic resources comprise the presentgenetic variation that is potentially useful for thefuture of humankind
! Plant genetic resources include:• Wild relatives of crops• Wild species• Traditional varieties and/or landraces• Commercial cultivars, hybrids or breeding lines
! We must conserve plant genetic resources fortheir eventual use
Plant genetic resources
Plant genetic resources comprise the present genetic variation that is potentially usefulfor the future of humankind. These resources include traditional varieties, landraces,commercial cultivars, hybrids, and other plant materials developed through breeding;wild relatives of crop species; and others that could be used in the future for eitheragriculture or environmental benefits. Hence, plant genetic resources should beconserved, with the ultimate reason being to eventually use them as a source ofpotentially useful genetic variation.
8/11/2019 Using molecular marker technology in studies on plant genetic diversity
http://slidepdf.com/reader/full/using-molecular-marker-technology-in-studies-on-plant-genetic-diversity 14/374
Copyright: IPGRI and Cornell University, 2003 Introduction 5
5
Measuring genetic variation
! Efficient conservation and use of plant geneticresources require thorough assessment of thegenetic variation they comprise
! Genetic variation can be measured at two levels:
• Phenotype—the combination of individual traitsresulting from a genotype and its interaction with theenvironment
• Genotype—the particular genetic make-up of anorganism
To conserve and use genetic variation, it should first be assessed, that is, the extentand its distribution need to be determined. Variation can be evaluated on the phenotypicand genotypic levels. Assessment of phenotypic variation focuses on morphologicaltraits—those characteristics that define the shape and appearance of a set ofindividuals. Some of these traits can be considered as ‘genetic’ if their presence inrelated individuals is heritable and not dependent on the environment, meaning that theyare associated with a particular DNA sequence.
Assessment of genotypic variation is at the level of the DNA molecule responsible fortransmitting genetic information. The DNA molecule is composed of nucleotides, whichare organised in a double-helix configuration in increasing levels of complexity up to thechromosomal units.
8/11/2019 Using molecular marker technology in studies on plant genetic diversity
http://slidepdf.com/reader/full/using-molecular-marker-technology-in-studies-on-plant-genetic-diversity 15/374
Copyright: IPGRI and Cornell University, 2003 Introduction 6
6
Genetic markers: description
! Genetic markers identify characteristics of thephenotype and/or genotype of an individual
! Their inheritance can be followed throughgenerations
A genetic marker is a measurable character that can detect variation in either a proteinor DNA sequence. A difference, whether phenotypic or genotypic, may act as a geneticmarker if it identifies characteristics of an individual’s genotype and/or phenotype, and ifits inheritance can be followed through different generations.
A genetic trait may not have necessarily observable consequences on an individual’sperformance. Sometimes, however, this trait may be linked to, or correlated with, other
traits that are more difficult to measure and do affect the individual’s performance. Insuch cases, these unobservable genetic traits may be used as genetic markers for thelinked traits because they indirectly indicate the presence of the characteristics ofinterest. The two measures can be correlated, using an analysis of inheritance andstudying the distribution of the characteristics in both parents and offspring.
8/11/2019 Using molecular marker technology in studies on plant genetic diversity
http://slidepdf.com/reader/full/using-molecular-marker-technology-in-studies-on-plant-genetic-diversity 16/374
Copyright: IPGRI and Cornell University, 2003 Introduction 7
7
Genetic markers: types
! Morphological traits
! Protein (biochemical) markers
! DNA (molecular) markers
8/11/2019 Using molecular marker technology in studies on plant genetic diversity
http://slidepdf.com/reader/full/using-molecular-marker-technology-in-studies-on-plant-genetic-diversity 17/374
Copyright: IPGRI and Cornell University, 2003 Introduction 8
8
Morphological traits
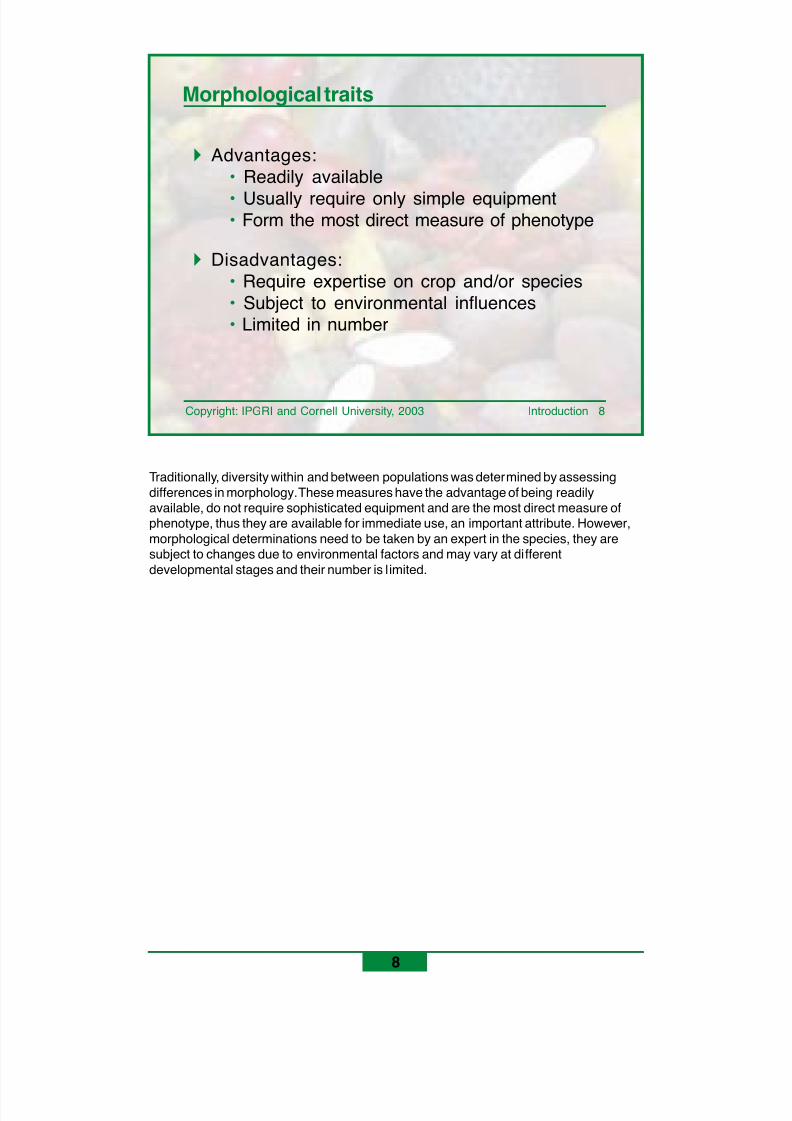
! Advantages:• Readily available• Usually require only simple equipment• Form the most direct measure of phenotype
! Disadvantages:• Require expertise on crop and/or species• Subject to environmental influences• Limited in number
Traditionally, diversity within and between populations was determined by assessingdifferences in morphology. These measures have the advantage of being readilyavailable, do not require sophisticated equipment and are the most direct measure ofphenotype, thus they are available for immediate use, an important attribute. However,morphological determinations need to be taken by an expert in the species, they aresubject to changes due to environmental factors and may vary at differentdevelopmental stages and their number is limited.
8/11/2019 Using molecular marker technology in studies on plant genetic diversity
http://slidepdf.com/reader/full/using-molecular-marker-technology-in-studies-on-plant-genetic-diversity 18/374
Copyright: IPGRI and Cornell University, 2003 Introduction 9
9
Protein (biochemical) markers
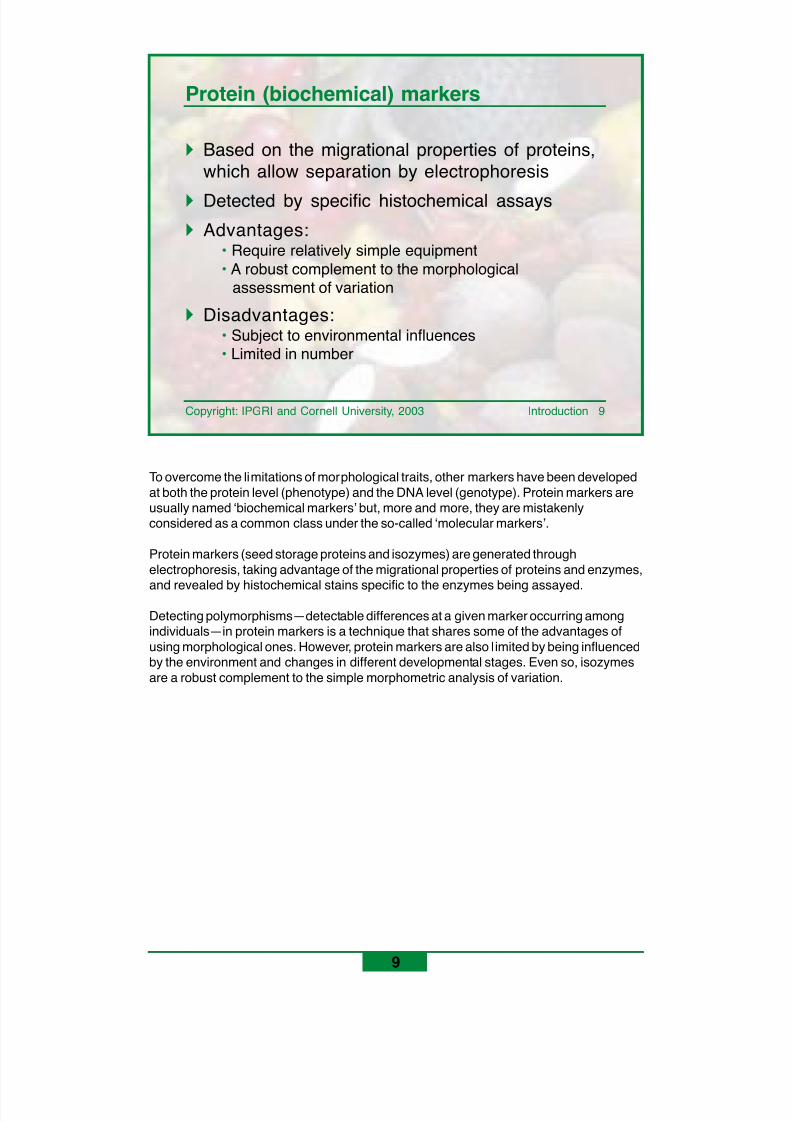
! Based on the migrational properties of proteins,which allow separation by electrophoresis
! Detected by specific histochemical assays! Advantages:
• Require relatively simple equipment• A robust complement to the morphological
assessment of variation
! Disadvantages:• Subject to environmental influences• Limited in number
To overcome the limitations of morphological traits, other markers have been developedat both the protein level (phenotype) and the DNA level (genotype). Protein markers areusually named ‘biochemical markers’ but, more and more, they are mistakenlyconsidered as a common class under the so-called ‘molecular markers’.
Protein markers (seed storage proteins and isozymes) are generated throughelectrophoresis, taking advantage of the migrational properties of proteins and enzymes,
and revealed by histochemical stains specific to the enzymes being assayed.
Detecting polymorphisms—detectable differences at a given marker occurring amongindividuals—in protein markers is a technique that shares some of the advantages ofusing morphological ones. However, protein markers are also limited by being influencedby the environment and changes in different developmental stages. Even so, isozymesare a robust complement to the simple morphometric analysis of variation.
8/11/2019 Using molecular marker technology in studies on plant genetic diversity
http://slidepdf.com/reader/full/using-molecular-marker-technology-in-studies-on-plant-genetic-diversity 19/374
Copyright: IPGRI and Cornell University, 2003 Introduction 10
10
DNA (molecular) markers
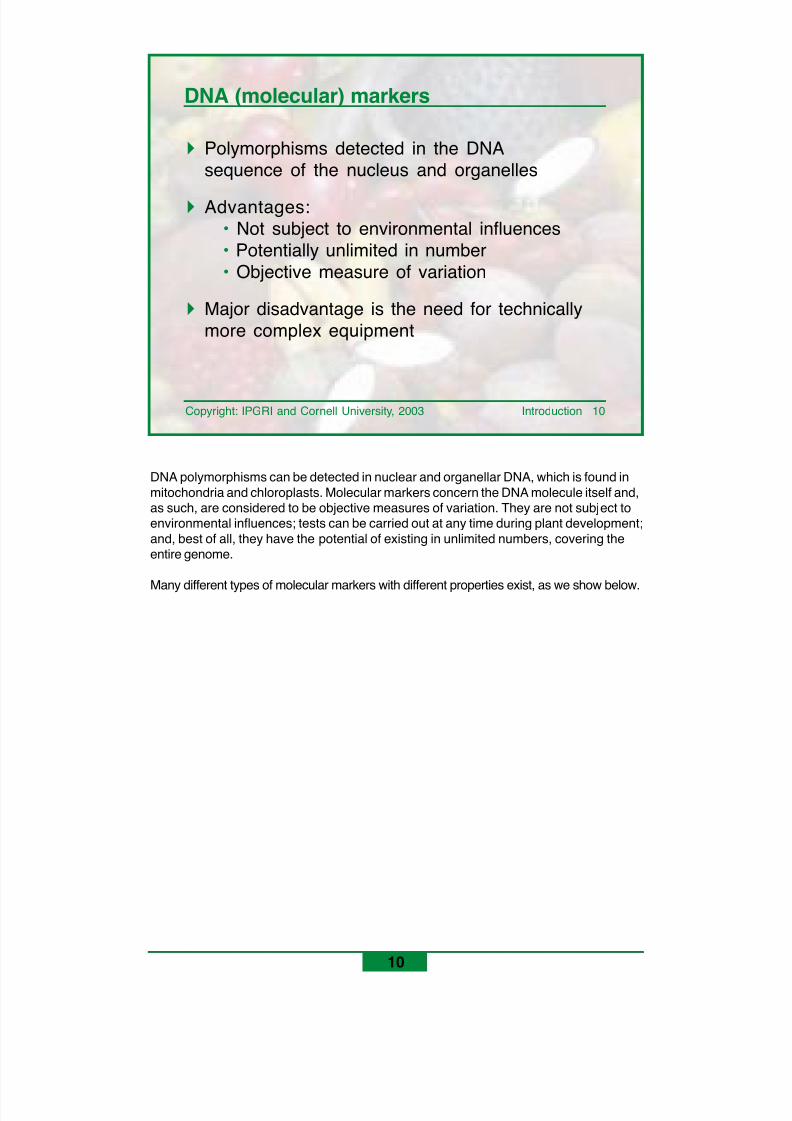
! Polymorphisms detected in the DNAsequence of the nucleus and organelles
! Advantages:• Not subject to environmental influences• Potentially unlimited in number• Objective measure of variation
! Major disadvantage is the need for technicallymore complex equipment
DNA polymorphisms can be detected in nuclear and organellar DNA, which is found inmitochondria and chloroplasts. Molecular markers concern the DNA molecule itself and,as such, are considered to be objective measures of variation. They are not subject toenvironmental influences; tests can be carried out at any time during plant development;and, best of all, they have the potential of existing in unlimited numbers, covering theentire genome.
Many different types of molecular markers with different properties exist, as we show below.
8/11/2019 Using molecular marker technology in studies on plant genetic diversity
http://slidepdf.com/reader/full/using-molecular-marker-technology-in-studies-on-plant-genetic-diversity 20/374
Copyright: IPGRI and Cornell University, 2003 Introduction 11
11
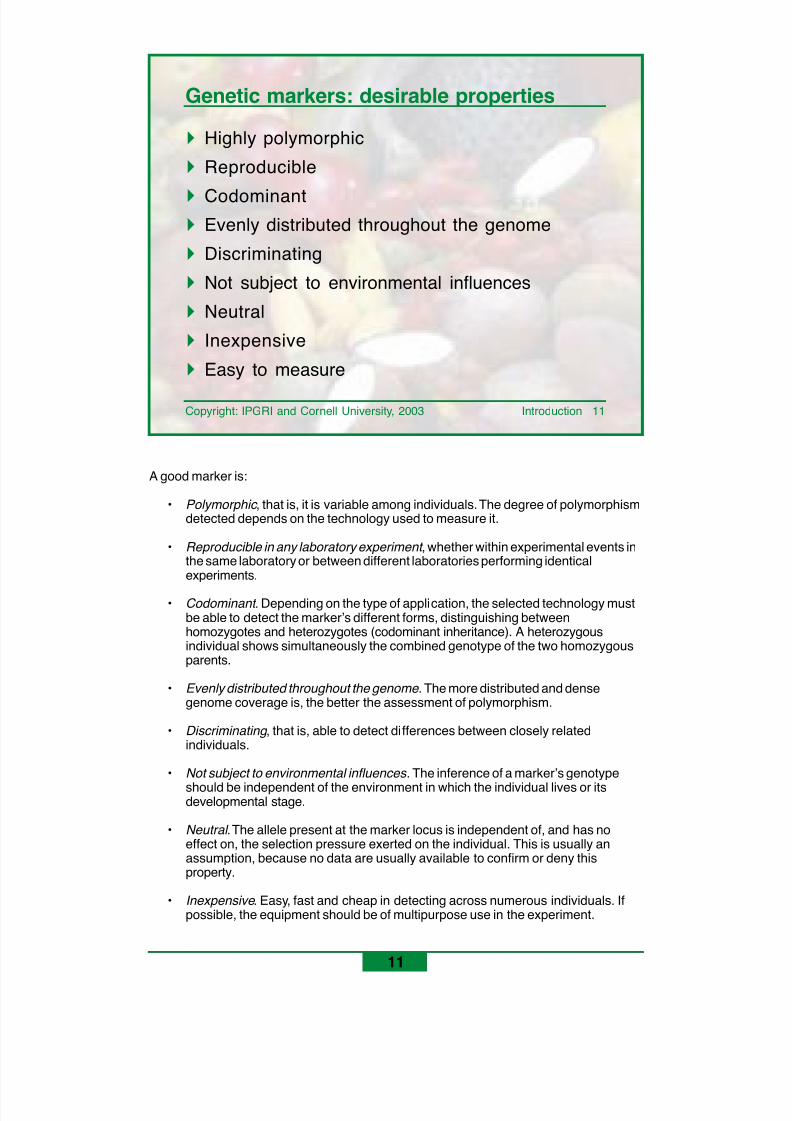
Genetic markers: desirable properties
! Highly polymorphic! Reproducible
! Codominant! Evenly distributed throughout the genome! Discriminating! Not subject to environmental influences! Neutral! Inexpensive! Easy to measure
A good marker is:
• Polymorphic , that is, it is variable among individuals. The degree of polymorphismdetected depends on the technology used to measure it.
• Reproducible in any laboratory experiment , whether within experimental events inthe same laboratory or between different laboratories performing identicalexperiments.
• Codominant . Depending on the type of application, the selected technology mustbe able to detect the marker’s different forms, distinguishing betweenhomozygotes and heterozygotes (codominant inheritance). A heterozygousindividual shows simultaneously the combined genotype of the two homozygousparents.
• Evenly distributed throughout the genome . The more distributed and densegenome coverage is, the better the assessment of polymorphism.
• Discriminating , that is, able to detect differences between closely relatedindividuals.
• Not subject to environmental influences . The inference of a marker’s genotypeshould be independent of the environment in which the individual lives or itsdevelopmental stage.
• Neutral . The allele present at the marker locus is independent of, and has noeffect on, the selection pressure exerted on the individual. This is usually anassumption, because no data are usually available to confirm or deny thisproperty.
• Inexpensive . Easy, fast and cheap in detecting across numerous individuals. Ifpossible, the equipment should be of multipurpose use in the experiment.
8/11/2019 Using molecular marker technology in studies on plant genetic diversity
http://slidepdf.com/reader/full/using-molecular-marker-technology-in-studies-on-plant-genetic-diversity 21/374
Copyright: IPGRI and Cornell University, 2003 Introduction 12
12
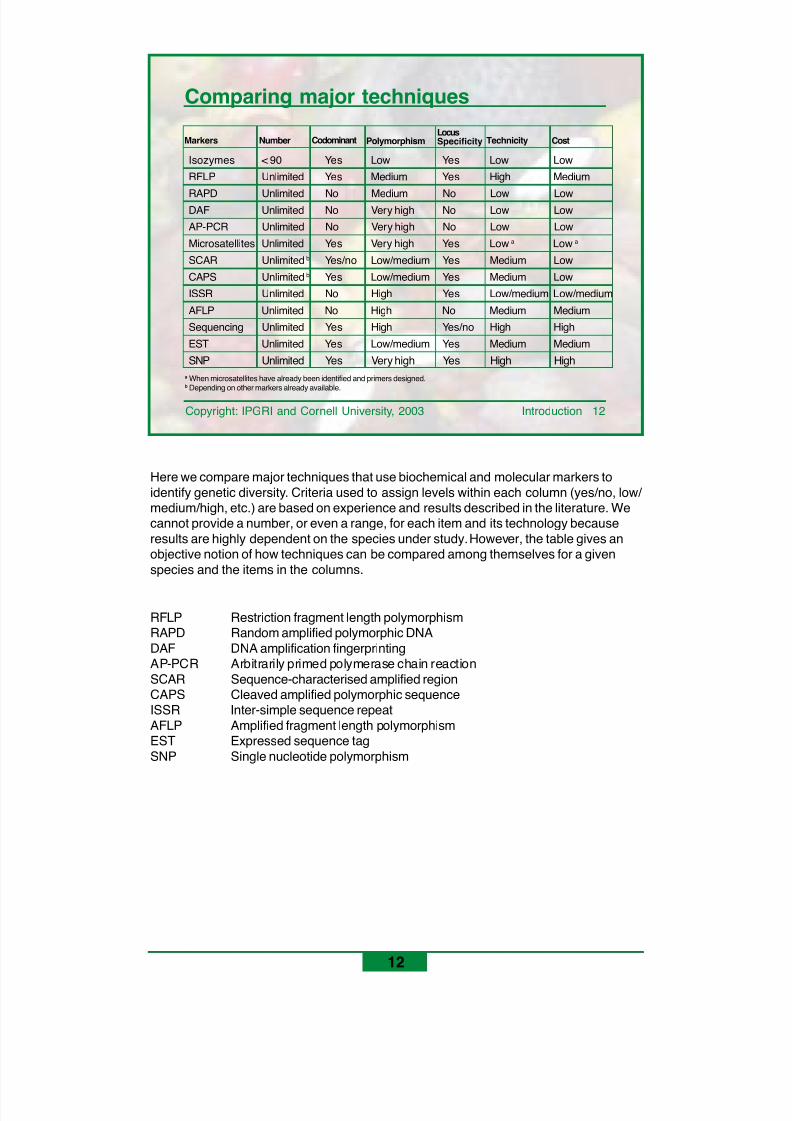
Comparing major techniques
Here we compare major techniques that use biochemical and molecular markers toidentify genetic diversity. Criteria used to assign levels within each column (yes/no, low/ medium/high, etc.) are based on experience and results described in the literature. Wecannot provide a number, or even a range, for each item and its technology becauseresults are highly dependent on the species under study. However, the table gives anobjective notion of how techniques can be compared among themselves for a givenspecies and the items in the columns.
RFLP Restriction fragment length polymorphismRAPD Random amplified polymorphic DNADAF DNA amplification fingerprintingAP-PCR Arbitrarily primed polymerase chain reactionSCAR Sequence-characterised amplified regionCAPS Cleaved amplified polymorphic sequenceISSR Inter-simple sequence repeatAFLP Amplified fragment length polymorphismEST Expressed sequence tagSNP Single nucleotide polymorphism
Isozymes < 90 Yes Low Yes Low Low
RFLP Unlimited Yes Medium Yes High Medium
RAPD Unlimited No Medium No Low LowDAF Unlimited No Very high No Low Low
AP-PCR Unlimited No Very high No Low Low
Microsatellites Unlimited Yes Very high Yes Low a Low a
SCAR Unlimited b Yes/no Low/medium Yes Medium Low
CAPS Unlimited b Yes Low/medium Yes Medium Low
ISSR Unlimited No High Yes Low/medium Low/medium
AFLP Unlimited No High No Medium Medium
Sequencing Unlimited Yes High Yes/no High High
EST Unlimited Yes Low/medium Yes Medium Medium
SNP Unlimited Yes Very high Yes High High
Markers Number Codominant PolymorphismLocusSpecificity Technicity Cost
a When microsatellites have already been identified and primers designed.b Depending on other markers already available.
8/11/2019 Using molecular marker technology in studies on plant genetic diversity
http://slidepdf.com/reader/full/using-molecular-marker-technology-in-studies-on-plant-genetic-diversity 22/374
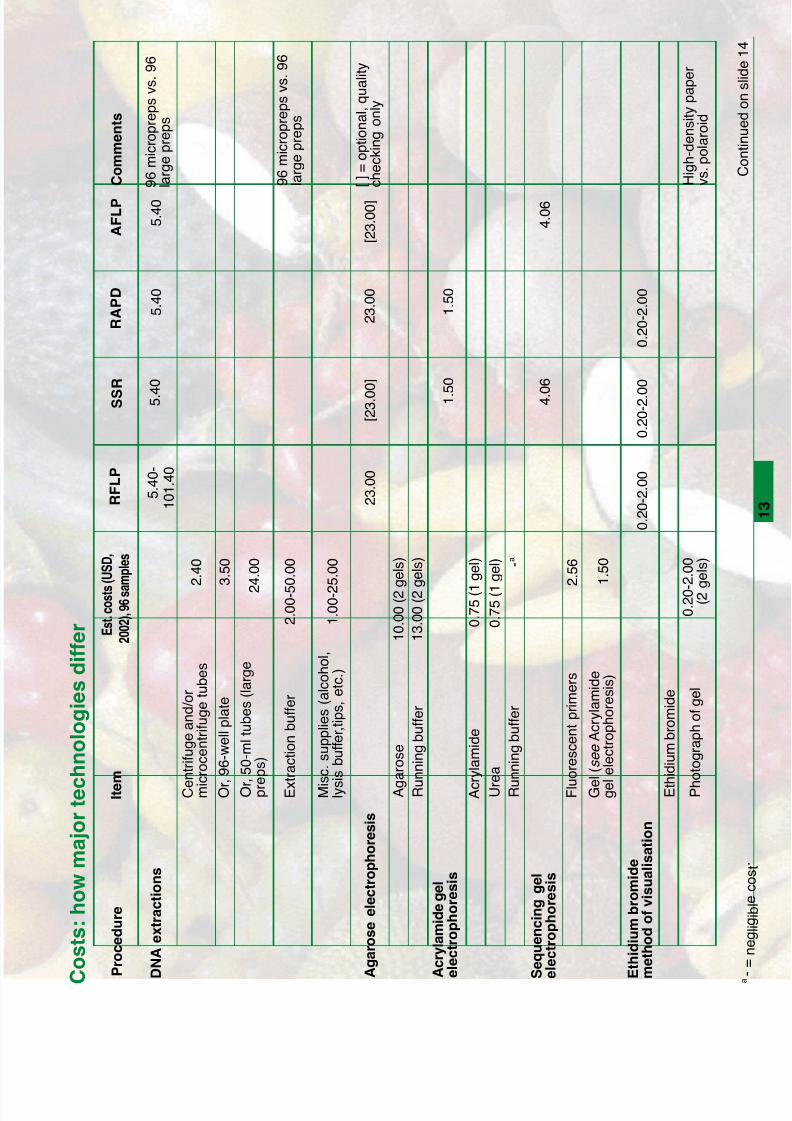
P r o c e
d u r e
I t e m
E s t . c o s t s
( U S D
,
2 0 0 2 ) , 9 6 s a m p l e s
R F L P
S S R
R A P D
A F L P
C o m m e n
t s
D N A e x
t r a c
t i o n s
5 . 4 0 -
1 0 1 . 4 0
5 . 4 0
5 . 4 0
5 . 4 0
9 6 m
i c r o p r e p s v s .
9 6
l a r g e p r e p s
C e n t r i f u g e a n d / o r
m i c r o c e n t r i f u g e
t u b e s
2 . 4 0
O r , 9 6 - w
e l l p l a t e
3 . 5 0
O r , 5 0 - m
l t u b e s ( l a r g e
p r e p s )
2 4 . 0 0
E x t r a c t i o n b u f f e r
2 . 0 0 - 5 0 . 0 0
9 6 m
i c r o p r e p s v s .
9 6
l a r g e p r e p s
M i s c . s u p p l i e s
( a l c o h o l ,
l y s i s b u f f e r , t i p s , e t c .
)
1 . 0 0 - 2 5 . 0 0
A g a r o s e e
l e c
t r o p
h o r e s
i s
2 3 . 0 0
[ 2 3 . 0 0 ]
2 3 . 0 0
[ 2 3 . 0 0 ]
[ ] = o p t i o n a l , q u a l i t y
c h e c k i n g o n l y
A g a r o s e
1 0 . 0 0 ( 2 g e l s )
R u n n i n g
b u f f e r
1 3 . 0 0 ( 2 g e l s )
A c r y l a m
i d e g e
l
e l e c
t r o p
h o r e s
i s
1 . 5 0
1 . 5 0
A c r y l a m
i d e
0 . 7 5 ( 1 g e l )
U r e a
R u n n i n g
b u f f e r
0 . 7 5 ( 1 g e l ) - a
S e q u e n c
i n g g e
l
e l e c
t r o p
h o r e s
i s
4 . 0 6
4 . 0 6
F l u o r e s c e n t p r i m e r s
2 . 5 6
G e l ( s
e e
A c r y l a m
i d e
g e l e l e c t r o p h o r e s i s )
1 . 5 0
E t h i d i u m
b r o m
i d e
m e
t h o
d o
f v
i s u a
l i s a
t i o n
E t h i d i u m b r o m i d e
P h o t o g r a p h o f g e l
0 . 2 0 - 2 . 0 0
( 2 g e l s )
H i g h - d e n s i t y p a p e r
v s . p o l a r o i d
0 . 2 0 - 2 . 0 0
0 . 2 0 - 2 . 0 0
0 . 2 0 - 2 . 0 0
C
o s
t s :
h o w m a
j o r
t e c h n o
l o g
i e s
d i f f e r
8/11/2019 Using molecular marker technology in studies on plant genetic diversity
http://slidepdf.com/reader/full/using-molecular-marker-technology-in-studies-on-plant-genetic-diversity 23/374
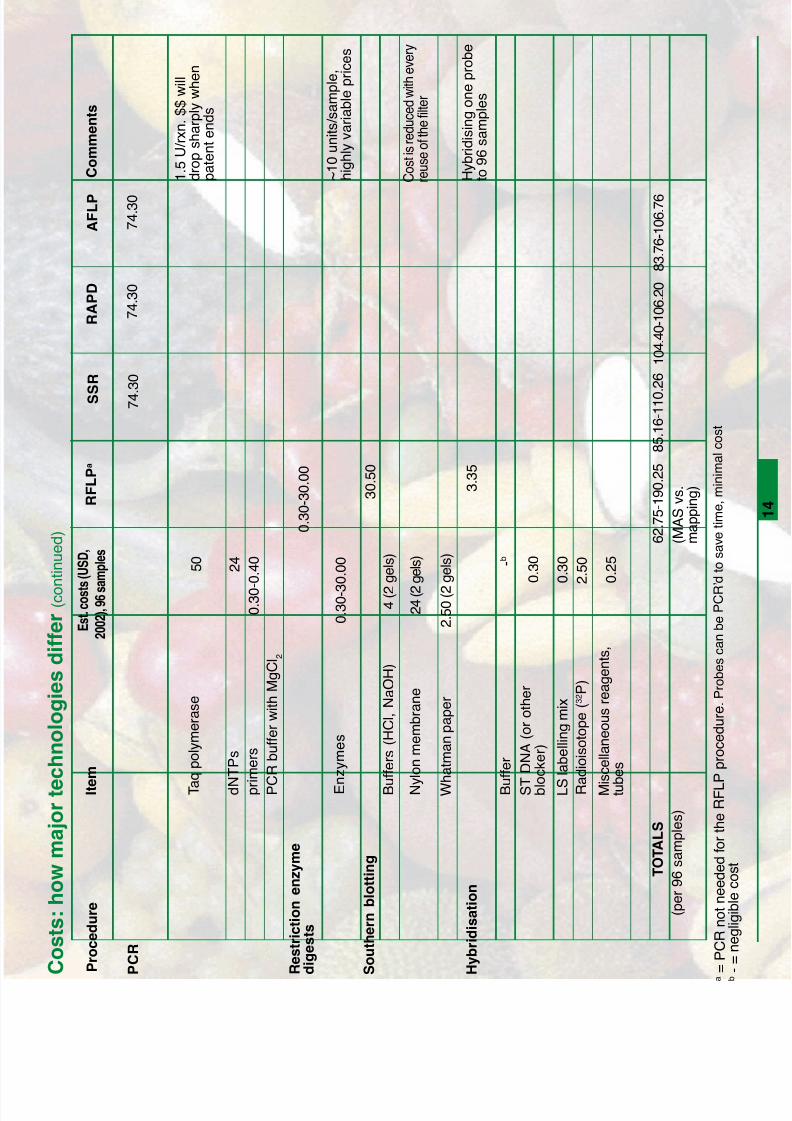
C o s t i s r e d u c e d w
i t h e v
e r y
r e u s e o f t h e f i l t e r
P r o c e
d u r e
I t e m
E s t . c o s t s ( U S D
,
2 0 0 2 ) , 9 6 s a m p l e s
R F L P a
S S
R
R A P D
A F L P
C o m m e n
t s
P C R
7 4 . 3 0
7 4 . 3 0
7 4 . 3 0
T a q p o l y m e r a s e
5 0
1 . 5 U / r x n . $ $ w
i l l
d r o p s h a r p l y w
h e n
p a t e n t e n d s
d N
T P s
2 4
p r i m e r s
0 . 3 0 - 0 .
4 0
P C
R b u f f e r w i t h M g C
l 2
R e s
t r i c t i o n e n z y m e
d i g e s
t s
0 . 3 0 - 3 0 . 0 0
E n z y m e s
0 . 3 0 - 3 0 . 0 0
~ 1 0 u n i t s / s a m p l e ,
h i g h l y v a r i a b l e p r i c e s
S o u
t h e r n
b l o t t i n g
3 0 . 5 0
B u f f e r s ( H C l , N a O
H )
4 ( 2 g e l s )
N y l o n m e m
b r a n e
2 4 ( 2 g e l s )
W h a t m a n p a p e r
2 . 5 0 ( 2 g e l s )
H y
b r i d
i s a
t i o n
3 . 3 5
B u f f e r
S T
D N A ( o r o t h e r
b l o c k e r )
L S
l a b e l l i n g m
i x
- b
0 . 3 0
0 . 3 0
2 . 5 0
R a d i o i s o t o p e
( 3 2 P )
M i s c e l l a n e o u s r e a g e n t s ,
t u b e s
0 . 2 5
H y b r i d i s i n g o n e p r o b e
t o 9 6 s a m p l e s
T O T A L S
6 2 . 7 5 - 1 9 0 . 2 5 8 5 . 1 6 - 1 1 0
. 2 6 1 0 4 . 4 0 - 1 0 6 . 2 0 8 3 . 7 6 - 1 0 6 . 7 6
( p e r 9 6 s a m p l e s )
( M A S v s .
m a p p i n g )
a
= P C R n o
t n e e
d e
d f o r
t h e
R F L P p r o c e
d u r e . P
r o b e s c a n
b e
P C R ’ d t o s a v e
t i m e ,
m i n i m a
l c o s
t
b
- = n e g
l i g i b l e c o s t
C o s
t s :
h o w m a
j o r t e c
h n o
l o g
i e s
d i f f e r ( c o n t i n u e
d )
8/11/2019 Using molecular marker technology in studies on plant genetic diversity
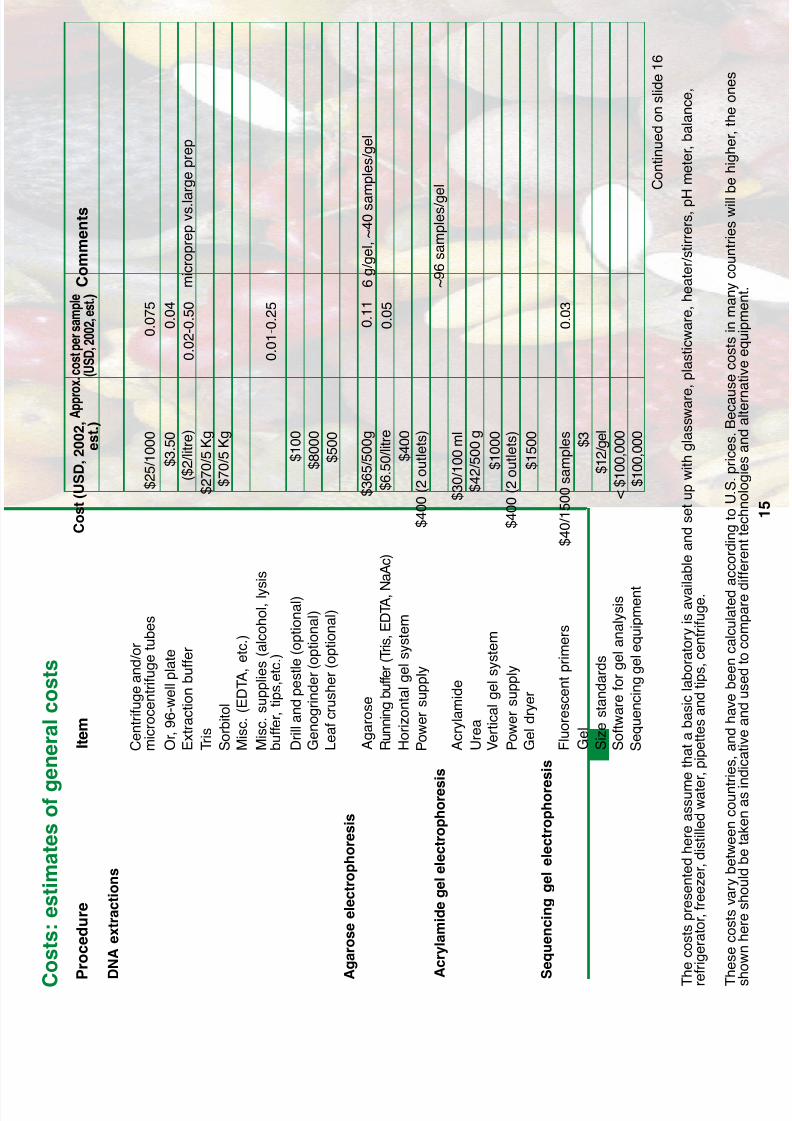
http://slidepdf.com/reader/full/using-molecular-marker-technology-in-studies-on-plant-genetic-diversity 24/374 T h e c o s t s p r e s e n t e d
h e r e a s s u m e
t h a t a b a s i c l a b o r a t o r y i s a v a
i l a b l e a n d s e t u p w
i t h g l a s s w a r e , p l a s t i c w
a r e , h e a t e r / s t i r r e r s , p H
m e t e r ,
b a l a n c e ,
r e f r i g e r a t o r ,
f r e e z e r , d i s t i l l e d w a t e r , p i p e t t e s a n d
t i p s , c e n t r i f u g e .
T h e s e c o s t s v a r y
b e t w e e n c o u n t r i e s , a n d
h a v e b e e n c a l c u l a t e d a c c o r d i n g
t o U
. S . p r i c e s .
B e c a u s e c o s t s
i n m a n y c o u n t r i e s w i l l
b e h i g h e r , t h e o n e s
P r o c e
d u r e
I t e m
C o s
t ( U S D
, 2 0 0 2
,
e s
t . )
D N A e x
t r a c
t i o n s
$ 2 5 / 1 0 0 0
C e n t r i f u g e a n d / o r
m i c r o c e n t r i f u g e t u b e s
A p p r o
x . c o s t p e r s a m p l e
( U S D
, 2 0 0 2 , e s t . )
C o m m e n
t s
0 . 0 7 5
O r ,
9 6 - w e l l p l a t e
$ 3 . 5 0
0 . 0 4
E x t r a c t i o n
b u f f e r
( $ 2 / l i t r e )
0 . 0 2 - 0 . 5 0 m
i c r o p r e p v s . l a r g e p r e p
T r i s S o r b i t o l
M i s c . ( E D T A
, e t c .
)
$ 2 7 0 / 5 K g
$ 7 0 / 5 K g
M i s c . s u p p l i e s
( a l c o h o l , l y s i s
b u f f e r , t i p s , e t c .
)
D r i l l a n d p e s t l e
( o p t i o n a l )
G e n o g r i n d e r ( o p t i o n a l )
L e a f c r u s h e r ( o p t i o n a l )
0 . 0 1 - 0 . 2 5
$ 1 0 0
$ 8 0 0 0
$ 5 0 0
A g a r o s e e
l e c
t r o p
h o r e s
i s
A g a r o s e
R u n n i n g
b u f f e r ( T r i s , E D T A , N a A c )
H o r i z o n t a l g e l s y s t e m
P o w e r s u p p l y
$ 3 6 5 / 5 0 0 g
$ 6 . 5 0 / l i t r e
$ 4 0 0
$ 4 0 0 ( 2 o u t l e t s )
0 . 1 1 6 g / g e l , ~ 4 0 s a m p l e s / g e l
A c r y
l a m
i d e g e
l e
l e c
t r o p
h o r e s
i s
A c r y l a m
i d e
U r e a
V e r t i c a l g e l s y s t e m
~ 9 6 s a m p l e s / g e l
P o w e r s u p p l y
G e l d r y e r
$ 3 0 / 1 0 0 m
l
$ 4 2 / 5 0 0 g
$ 1 0 0 0
$ 4 0 0 ( 2 o u t l e t s )
$ 1 5 0 0
S e q u e n c
i n g g e
l e
l e c
t r o p
h o r e s
i s F l u o r e s c e n t p r i m e r s
G e l
$ 4 0 / 1 5 0 0 s a m p l e s $ 3
0 . 0 3
$ 1 2 / g e l
S e q u e n c i n g g e l e q u i p m e n t
< $ 1 0 0 , 0 0 0
S o f t w a r e
f o r g e l a n a l y s i s
$ 1 0 0 , 0 0 0
0 . 0 5
C o s
t s : e s
t i m a
t e s o
f g e n e r a
l c o s
t s
C o n t i n u e d o n s l i d e
1 6
S i z e s t a n d a r d s
8/11/2019 Using molecular marker technology in studies on plant genetic diversity
http://slidepdf.com/reader/full/using-molecular-marker-technology-in-studies-on-plant-genetic-diversity 25/374
P r o c e
d u r e
I t e m
C o s
t ( U S D
, 2 0 0 2
,
e s
t . )
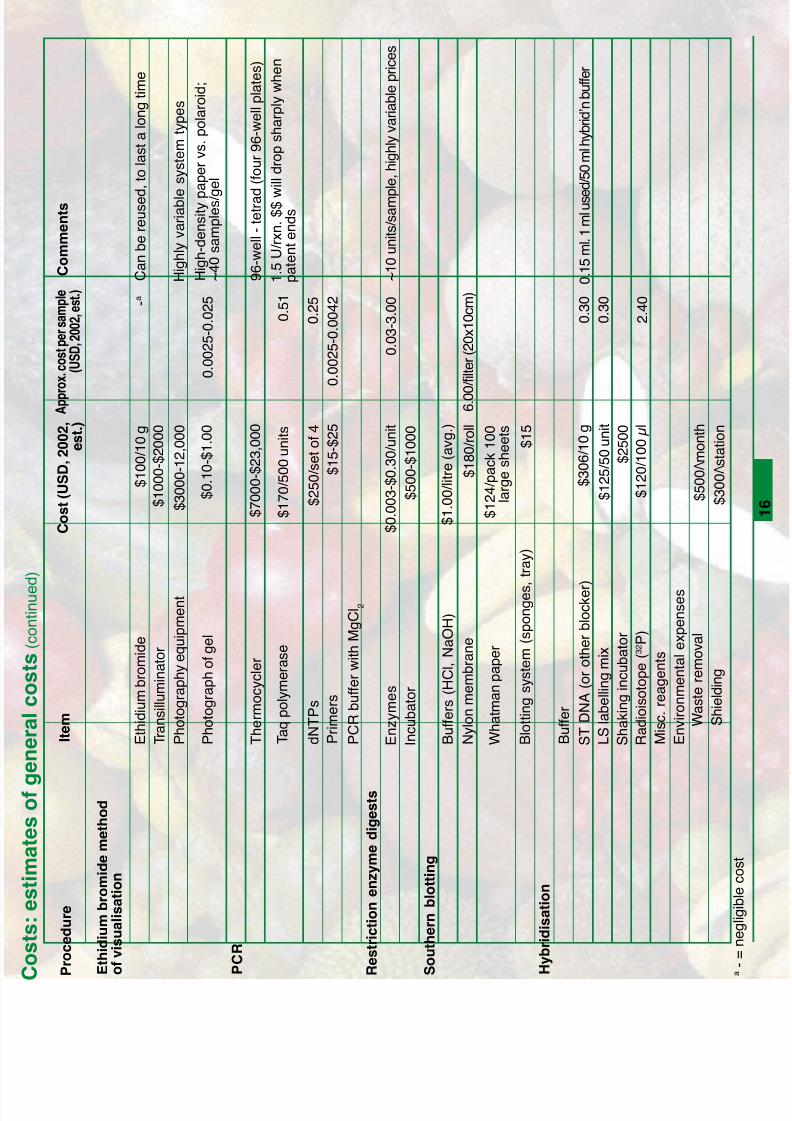
E t h i d i u m
b r o m
i d e m e
t h o
d
o f v
i s u a
l i s a
t i o n
E t h i d i u m b r o m i d e
A p p r o x . c o s t p e r s a m p l e
( U S D
, 2 0 0 2 , e s t . )
C o m m e n
t s
T r a n s i l l u m i n a t o r
P h o t o g r a p h y e q u i p m e n t
P h o t o g r a p h o f g e l
$ 1 0 0 / 1 0 g
- a
C a n
b e r e u s e d , t o
l a s t a l o n g t i m e
$ 1 0 0 0 - $ 2 0 0 0
$ 3 0 0 0 - 1 2 , 0 0 0
$ 0 . 1 0 - $ 1 . 0 0
0 . 0 0 2 5 - 0 . 0 2 5
H i g h - d e n s i t y p a p e r v s . p o l a r o i d ;
~ 4 0 s a m p l e s / g e l
R e s
t r i c t i o n e n z y m e
d i g e s
t s
T h e r m o c y c l e r
T a q p o l y m e r a s e
d N T P s
P r i m e r s
P C R b u f f e r w i t h M g C
l 2
$ 7 0 0 0 - $ 2 3 , 0 0 0
$ 1 7 0 / 5 0 0 u n i t s
$ 2 5 0 / s e t o f 4
$ 1 5 - $ 2 5
0 . 0 0 2 5 - 0 . 0 0 4 2
0 . 2 5
0 . 5 1
9 6 - w e l l - t e t r a d
( f o u r 9 6 - w e l l p l a t e s )
1 . 5 U / r x n . $ $ w
i l l d r o p s h a r p l y w
h e n
p a t e n t e n d s
P C R
E n z y m e s
I n c u b a t o r
$ 0 . 0 0 3 - $ 0 . 3 0 / u n i t
$ 5 0 0 - $ 1 0 0 0
0 . 0 3 - 3 . 0 0
~ 1 0 u n i t s / s a m p
l e , h i g h l y v a r i a b l e p r i c e s
S o u
t h e r n
b l o t t i n g
B u f f e r s
( H C l , N a O
H )
N y l o n m e m
b r a n e
W h a t m a n p a p e r
B l o t t i n g s y s t e m
( s p o n g e s , t r a y )
$ 1 . 0 0 / l i t r e ( a v g . )
$ 1 8 0 / r o l l
$ 1 2 4 / p a c k 1 0 0
l a r g e s h e e t s
$ 1 5
H y
b r i d
i s a
t i o n
B u f f e r
S T D N A ( o r o t h e r
b l o c k e r )
L S l a b e l l i n g m
i x
S h a k i n g i n c u b a t o r
R a d i o i s o t o p e
( 3 2 P )
M i s c . r e a g e n t s
E n v i r o n m e n t a l e x p e n s e s
W a s t e r e m o v a l
S h i e l d i n g
$ 3 0 6 / 1 0 g
$ 1 2 5 / 5 0 u n i t
$ 2 5 0 0
$ 1 2 0 / 1 0 0 µ l
$ 5 0 0 / \ m o n t h
$ 3 0 0 / \ s t a t i o n
0 . 3 0 0 . 1 5 m
l . 1 m
l u s e d / 5 0 m
l h y b r i d ’ n b u f f e r
0 . 3 0
2 . 4 0
H i g h l y v a r i a b l e
s y s t e m t y p e s
6 . 0 0 / f i l t e r ( 2 0 x 1 0 c m )
Costs:estimatesofgeneralcosts(continued)
a
8/11/2019 Using molecular marker technology in studies on plant genetic diversity
http://slidepdf.com/reader/full/using-molecular-marker-technology-in-studies-on-plant-genetic-diversity 26/374
Copyright: IPGRI and Cornell University, 2003 Introduction 17
17
In summary
! Defining strategies for good conservation anduse requires assessing the variation found ingenetic resources
! Plant genetic diversity can be measured throughgenetic markers—morphological, biochemicaland molecular
! No single marker meets all the desired properties
! Choice of technique depends on the nature ofthe biological question being addressed
8/11/2019 Using molecular marker technology in studies on plant genetic diversity
http://slidepdf.com/reader/full/using-molecular-marker-technology-in-studies-on-plant-genetic-diversity 27/374
Copyright: IPGRI and Cornell University, 2003 Introduction 18
18
By now you should know
! What genetic variation is and how it can bemeasured
! The main advantages and disadvantagesof the different types of genetic markers
! What constitutes the desirable properties ofgenetic markers
8/11/2019 Using molecular marker technology in studies on plant genetic diversity
http://slidepdf.com/reader/full/using-molecular-marker-technology-in-studies-on-plant-genetic-diversity 28/374
Basic references
Ayad, W.G., T. Hodgkin, A. Jaradat and V. Ramanatha Rao. 1997. Molecular genetictechniques for plant genetic resources. Report of an IPGRI workshop, 9-11 October 1995, Rome. IPGRI, Rome.
Brown, S.M. and S. Kresovich. 1996. Molecular characterization for plant genetic
resources conservation. Pp. 85-93 in Genome Mapping in Plants (H. Paterson, ed.).R.G. Landes Company, Georgetown, TX.
Karp, A., K.J. Edwards, M. Bruford, S. Funk, B. Vosman, M. Morgante, O. Seberg, A.Kremer, P. Boursot, P. Arctander, D. Tautz and G.M. Hewitt. 1997. Molecular tech-nologies for biodiversity evaluation: opportunities and challenges. Nature Biotechnol.15:625-628.
Karp, A., S. Kresovich, K.V. Bhat, W.G. Ayad and T. Hodgkin. 1997. Molecular tools inplant genetics resources conservation: a guide to the technologies. Technical BulletinNo. 2. IPGRI, Rome.
19
8/11/2019 Using molecular marker technology in studies on plant genetic diversity
http://slidepdf.com/reader/full/using-molecular-marker-technology-in-studies-on-plant-genetic-diversity 29/374
Copyright: IPGRI and Cornell University, 2003 Introduction 20
20
Protein-based technologiesProtein basics
! Protein-based technologies• Isozymes
! DNA-based technologies
! Complementary technologies
! Final considerations
! Glossary
Next
8/11/2019 Using molecular marker technology in studies on plant genetic diversity
http://slidepdf.com/reader/full/using-molecular-marker-technology-in-studies-on-plant-genetic-diversity 30/374
Using molecular marker technologyin studies on plant geneticdiversity
II Protein-based technologies
j~áå ãÉåì
8/11/2019 Using molecular marker technology in studies on plant genetic diversity
http://slidepdf.com/reader/full/using-molecular-marker-technology-in-studies-on-plant-genetic-diversity 31/374
Copyright: IPGRI and Cornell University, 2003 Protein basics 1
Using molecular marker technology instudies on plant genetic diversity
Protein-based technologiesProtein basics
8/11/2019 Using molecular marker technology in studies on plant genetic diversity
http://slidepdf.com/reader/full/using-molecular-marker-technology-in-studies-on-plant-genetic-diversity 32/374
2
Copyright: IPGRI and Cornell University, 2003 Protein basics 2
Contents
! Protein basics
! Protein structures:
• Primary• Secondary• Tertiary• Quaternary
! Protein functions
! Enzymes:• Description• Allozymes and isozymes
8/11/2019 Using molecular marker technology in studies on plant genetic diversity
http://slidepdf.com/reader/full/using-molecular-marker-technology-in-studies-on-plant-genetic-diversity 33/374
3
Copyright: IPGRI and Cornell University, 2003 Protein basics 3
! The DNA’s base sequence instructs the cell onhow to make the different proteins it needs to
function as part of the organism in which it exists! Proteins have many different functions, both
structural and functional
! Proteins are complicated molecules madeby assembling simple building blocks (aminoacids) together in a chain (polypeptide chain)
Protein basics
The information carried by the DNA bases translates into proteins. The DNA molecule iscopied into a different type of nucleic acid—the RNA or ribonucleic acid. The RNAmoves to the ‘ribosome’, an organelle in charge of making proteins. Every set of threebases in the RNA determines which amino acid is added to the protein molecule inprogress. The RNA chain passes through the ribosome until the protein is complete.
This process has been called ‘the central dogma’, as it is the basis of all biological life.
Amino acids are bi-functional organic compounds that contain a basic amino group(-NH 2) and an acidic carboxyl group (-COOH). In proteins, 20 different amino acids arecommonly found, varying in function and property according to the nature of the R-group.For instance, in alanine, the R-group is (-CH 3), whereas, in cysteine, it is (-CH 2-SH).
8/11/2019 Using molecular marker technology in studies on plant genetic diversity
http://slidepdf.com/reader/full/using-molecular-marker-technology-in-studies-on-plant-genetic-diversity 34/374
4
Copyright: IPGRI and Cornell University, 2003 Protein basics 4
Protein structures: primary
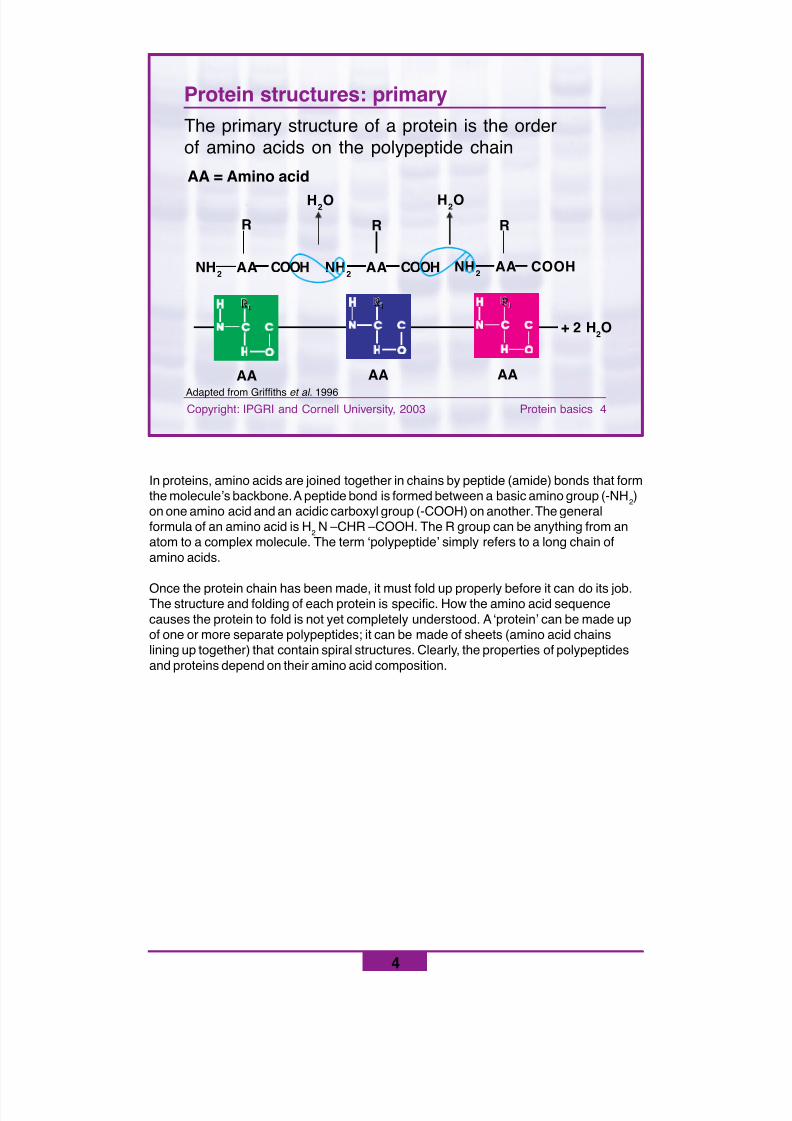
In proteins, amino acids are joined together in chains by peptide (amide) bonds that formthe molecule’s backbone. A peptide bond is formed between a basic amino group (-NH 2)on one amino acid and an acidic carboxyl group (-COOH) on another. The generalformula of an amino acid is H 2 N –CHR –COOH. The R group can be anything from anatom to a complex molecule. The term ‘polypeptide’ simply refers to a long chain ofamino acids.
Once the protein chain has been made, it must fold up properly before it can do its job.The structure and folding of each protein is specific. How the amino acid sequencecauses the protein to fold is not yet completely understood. A ‘protein’ can be made upof one or more separate polypeptides; it can be made of sheets (amino acid chainslining up together) that contain spiral structures. Clearly, the properties of polypeptidesand proteins depend on their amino acid composition.
The primary structure of a protein is the orderof amino acids on the polypeptide chain
AA = Amino acid
AA AAAA
NH 2 AA COOH NH 2 AA COOH
H2O
R
H2O
R
2 H 2O+
R1
N
H O
R1
N
H O
R1
N
H O
NH 2 AA COOH
R
Adapted from Griffiths et al. 1996
8/11/2019 Using molecular marker technology in studies on plant genetic diversity
http://slidepdf.com/reader/full/using-molecular-marker-technology-in-studies-on-plant-genetic-diversity 35/374
5
Copyright: IPGRI and Cornell University, 2003 Protein basics 5
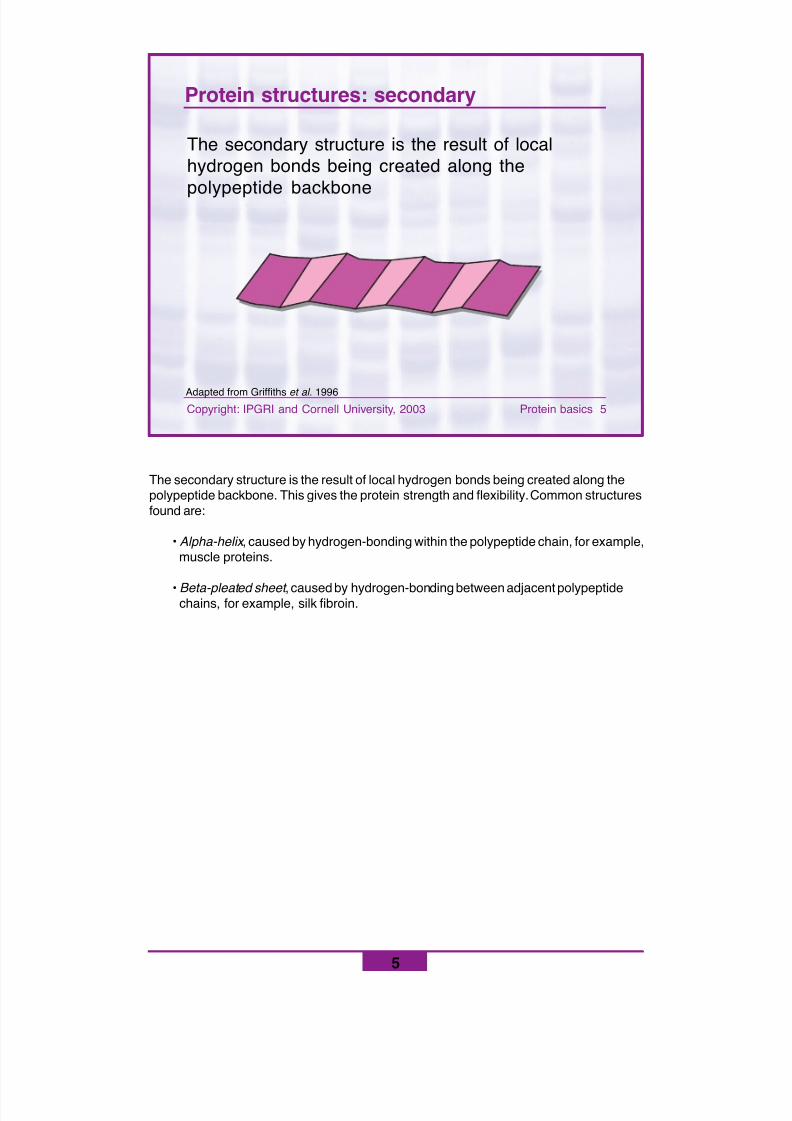
Protein structures: secondary
The secondary structure is the result of localhydrogen bonds being created along the
polypeptide backbone
The secondary structure is the result of local hydrogen bonds being created along thepolypeptide backbone. This gives the protein strength and flexibility. Common structuresfound are:
• Alpha-helix , caused by hydrogen-bonding within the polypeptide chain, for example, muscle proteins.
• Beta-pleated sheet , caused by hydrogen-bonding between adjacent polypeptide chains, for example, silk fibroin.
Adapted from Griffiths et al. 1996
8/11/2019 Using molecular marker technology in studies on plant genetic diversity
http://slidepdf.com/reader/full/using-molecular-marker-technology-in-studies-on-plant-genetic-diversity 36/374
6
Copyright: IPGRI and Cornell University, 2003 Protein basics 6
Protein structures: tertiary
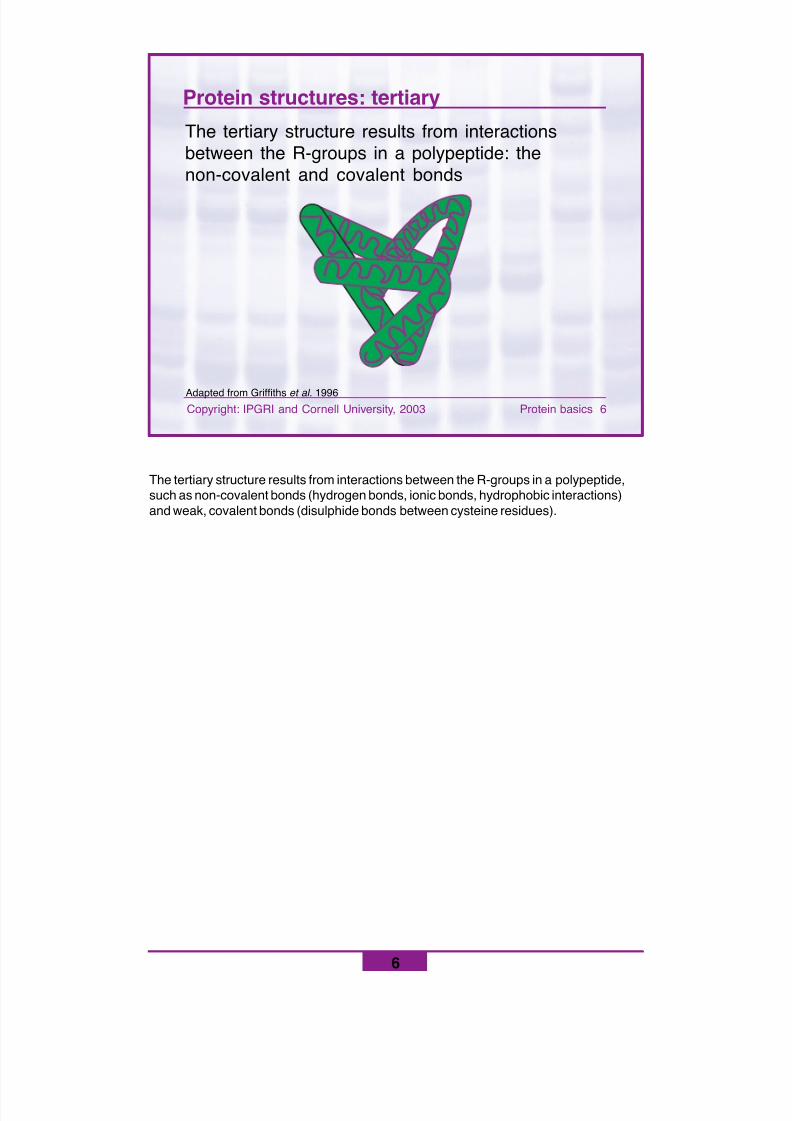
The tertiary structure results from interactionsbetween the R-groups in a polypeptide: thenon-covalent and covalent bonds
The tertiary structure results from interactions between the R-groups in a polypeptide,such as non-covalent bonds (hydrogen bonds, ionic bonds, hydrophobic interactions)and weak, covalent bonds (disulphide bonds between cysteine residues).
Adapted from Griffiths et al. 1996
8/11/2019 Using molecular marker technology in studies on plant genetic diversity
http://slidepdf.com/reader/full/using-molecular-marker-technology-in-studies-on-plant-genetic-diversity 37/374
7
Copyright: IPGRI and Cornell University, 2003 Protein basics 7
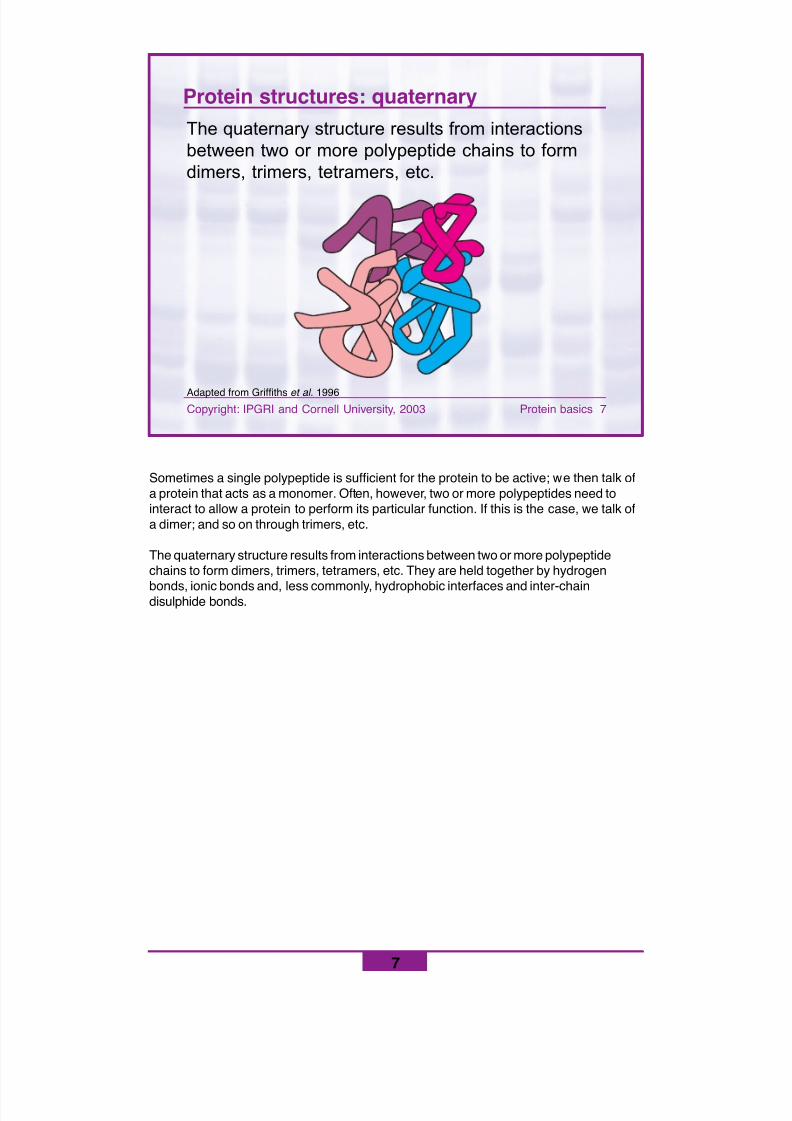
Protein structures: quaternaryThe quaternary structure results from interactionsbetween two or more polypeptide chains to formdimers, trimers, tetramers, etc.
Sometimes a single polypeptide is sufficient for the protein to be active; we then talk ofa protein that acts as a monomer. Often, however, two or more polypeptides need tointeract to allow a protein to perform its particular function. If this is the case, we talk ofa dimer; and so on through trimers, etc.
The quaternary structure results from interactions between two or more polypeptidechains to form dimers, trimers, tetramers, etc. They are held together by hydrogen
bonds, ionic bonds and, less commonly, hydrophobic interfaces and inter-chaindisulphide bonds.
Adapted from Griffiths et al. 1996
8/11/2019 Using molecular marker technology in studies on plant genetic diversity
http://slidepdf.com/reader/full/using-molecular-marker-technology-in-studies-on-plant-genetic-diversity 38/374
8
Copyright: IPGRI and Cornell University, 2003 Protein basics 8
Proteins functions
The three-dimensional structure that proteins have is a direct result of interactions withits internal environment. As a consequence, knowing how proteins are structured tells usa lot about how they perform their tasks in the cell.
For instance, in aqueous environments, the hydrophobic R-groups are positionedtowards the protein’s interior. Changes in temperature or pH can interfere with the non-covalent bonding, causing disruption in the three-dimensional structure and loss of
activity. This process is called ‘denaturation’. Denatured proteins can also clump togetherto become insoluble in a process called coagulation.
The diversity of protein function, as facilitated by the complexities of protein structure,include (with examples):
• Structural (collagen, muscle fibres)• Storage (wheat gliadins, barley hordeins)• Enzymes (hydrolases, transferases, isomerases, polymerases, ligases)• Transport (oxygen transfer with haemoglobin)• Messengers (insulin and certain other hormones)• Antibodies (proteins that bind to specific foreign particles)• Regulation (proteins involved in regulating DNA synthesis)
! The three-dimensional structure of proteins is adirect result of interactions with their internalenvironment
! Diversity of protein function is a result of thecomplexity of protein structure
8/11/2019 Using molecular marker technology in studies on plant genetic diversity
http://slidepdf.com/reader/full/using-molecular-marker-technology-in-studies-on-plant-genetic-diversity 39/374
9
Copyright: IPGRI and Cornell University, 2003 Protein basics 9
Enzymes: description
! Enzymes are a particular type of protein that actas catalysts
! Each enzyme is highly specific with regard to thetype of chemical reaction that it will catalyse andto the substances (called substrates) on which itwill act
8/11/2019 Using molecular marker technology in studies on plant genetic diversity
http://slidepdf.com/reader/full/using-molecular-marker-technology-in-studies-on-plant-genetic-diversity 40/374
10
Copyright: IPGRI and Cornell University, 2003 Protein basics 10
The multiple forms that enzymes take fall into twomain classes according to how they are coded:
• Allozymes —enzymes coded by differentalleles at one gene locus
• Isozymes —enzymes coded by alleles atmore than one gene locus
Usually, the term ‘isozymes’ refers to both classes
Enzymes: allozymes and isozymes
Polymorphisms are generated by changes in the amino acids that may result in changesin the primary structure of the enzyme.
8/11/2019 Using molecular marker technology in studies on plant genetic diversity
http://slidepdf.com/reader/full/using-molecular-marker-technology-in-studies-on-plant-genetic-diversity 41/374
11
Copyright: IPGRI and Cornell University, 2003 Protein basics 11
In summary
! Proteins are the primary product of genes
! Proteins may have different structures, whichare closely related to the tasks they perform inthe cell
! Enzymes are a particular type of protein thatact as catalysts
! Enzymes may have multiple forms, belonging toeither allozymes or isozymes
8/11/2019 Using molecular marker technology in studies on plant genetic diversity
http://slidepdf.com/reader/full/using-molecular-marker-technology-in-studies-on-plant-genetic-diversity 42/374
12
Copyright: IPGRI and Cornell University, 2003 Protein basics 12
By now you should know
! What a protein is
! The mechanisms involved in shaping proteinsinto different structures
! What an enzyme is
! The difference between allozymes and isozymes

8/11/2019 Using molecular marker technology in studies on plant genetic diversity
http://slidepdf.com/reader/full/using-molecular-marker-technology-in-studies-on-plant-genetic-diversity 43/374
Basic reference
Griffiths, A.J.F., J.H. Miller, D.T. Suzuki, R.C. Lewontin and W.M. Gelbart. 1996.The nature of the gene. Pp. 345-358 in An Introduction to Genetic Analysis (6thedn.). W.H. Freeman and Co., NY.
13
8/11/2019 Using molecular marker technology in studies on plant genetic diversity
http://slidepdf.com/reader/full/using-molecular-marker-technology-in-studies-on-plant-genetic-diversity 44/374
14
Copyright: IPGRI and Cornell University, 2003 Protein basics 14
Protein-based technologiesIsozymes
! DNA-based technologies
! Complementary technologies
! Final considerations
! Glossary
Next
8/11/2019 Using molecular marker technology in studies on plant genetic diversity
http://slidepdf.com/reader/full/using-molecular-marker-technology-in-studies-on-plant-genetic-diversity 45/374
Copyright: IPGRI and Cornell University, 2003 Isozymes 1
Using molecular marker technology instudies on plant genetic diversity
Protein-based technologiesIsozymes
8/11/2019 Using molecular marker technology in studies on plant genetic diversity
http://slidepdf.com/reader/full/using-molecular-marker-technology-in-studies-on-plant-genetic-diversity 46/374
2
Copyright: IPGRI and Cornell University, 2003 Isozymes 2
Contents
! Detecting isozymes• Methodology• Gel electrophoresis
! Equipment! Isozymes in pictures! Interpreting banding patterns! Advantages and disadvantages! Applications
• Lysimachia sp.• Lima bean• Onion
8/11/2019 Using molecular marker technology in studies on plant genetic diversity
http://slidepdf.com/reader/full/using-molecular-marker-technology-in-studies-on-plant-genetic-diversity 47/374
3
Copyright: IPGRI and Cornell University, 2003 Isozymes 3
Detecting isozymes: methodology
! Pre-treating plant material
! Starch or acrylamide gel electrophoresis
! Histochemical staining
! Analysing banding patterns
Crude tissue extracts are subjected to gel electrophoresis and probed with enzyme-specific stains, resulting in a simple banding pattern.
Variation in banding patterns between individuals can be interpreted genetically, as wouldbe done with any other phenotypic marker.
8/11/2019 Using molecular marker technology in studies on plant genetic diversity
http://slidepdf.com/reader/full/using-molecular-marker-technology-in-studies-on-plant-genetic-diversity 48/374
4
Copyright: IPGRI and Cornell University, 2003 Isozymes 4
Detecting isozymes: gel electrophoresis (1)
! This process combines the separation ofmolecules by charge with that by size byapplying an electric current
! The current makes the molecules move throughpores in a layer of gel
! The substance that makes up the gel isselected so its pores are of the right size toseparate a specific range of molecule sizesand shapes
Electrophoresis is a chromatographic technique for separating mixtures of ioniccompounds. It has been adapted as a common tool for biochemical analysis.
8/11/2019 Using molecular marker technology in studies on plant genetic diversity
http://slidepdf.com/reader/full/using-molecular-marker-technology-in-studies-on-plant-genetic-diversity 49/374
5
Copyright: IPGRI and Cornell University, 2003 Isozymes 5
-
+
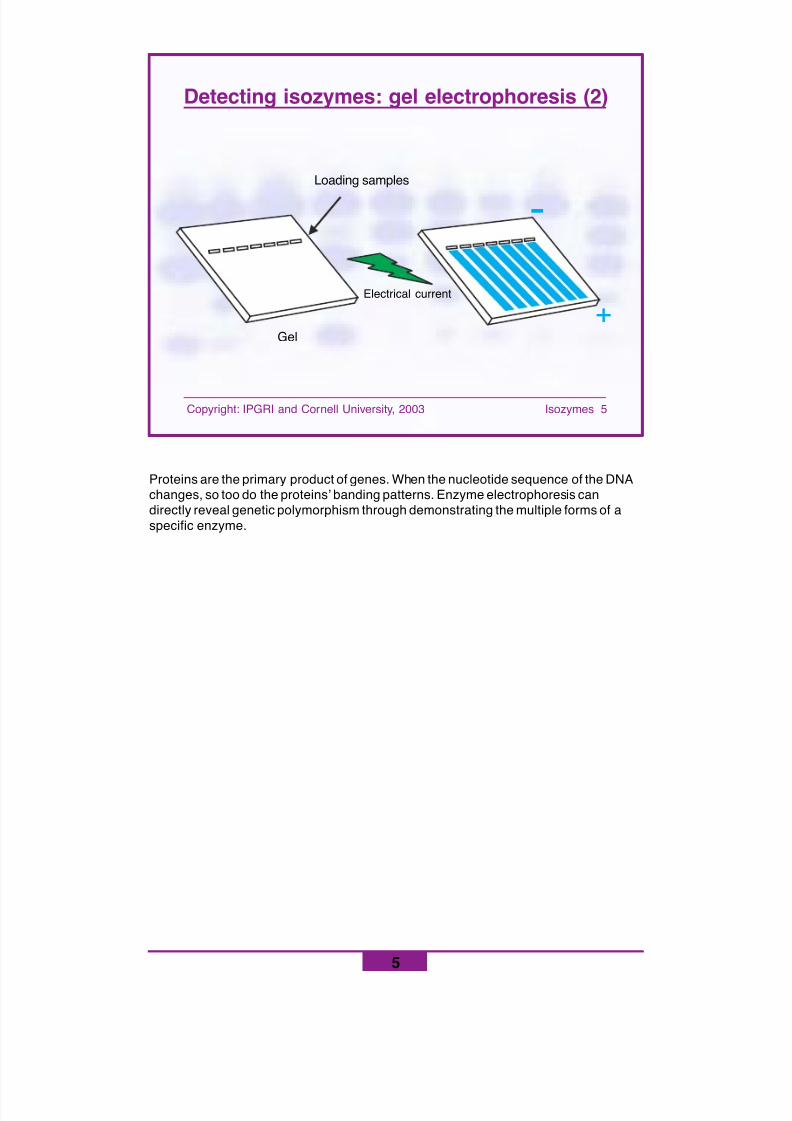
Proteins are the primary product of genes. When the nucleotide sequence of the DNAchanges, so too do the proteins’ banding patterns. Enzyme electrophoresis candirectly reveal genetic polymorphism through demonstrating the multiple forms of aspecific enzyme.
Detecting isozymes: gel electrophoresis (2)
Loading samples
Electrical current
Gel
8/11/2019 Using molecular marker technology in studies on plant genetic diversity
http://slidepdf.com/reader/full/using-molecular-marker-technology-in-studies-on-plant-genetic-diversity 50/374
6
Copyright: IPGRI and Cornell University, 2003 Isozymes 6
Equipment
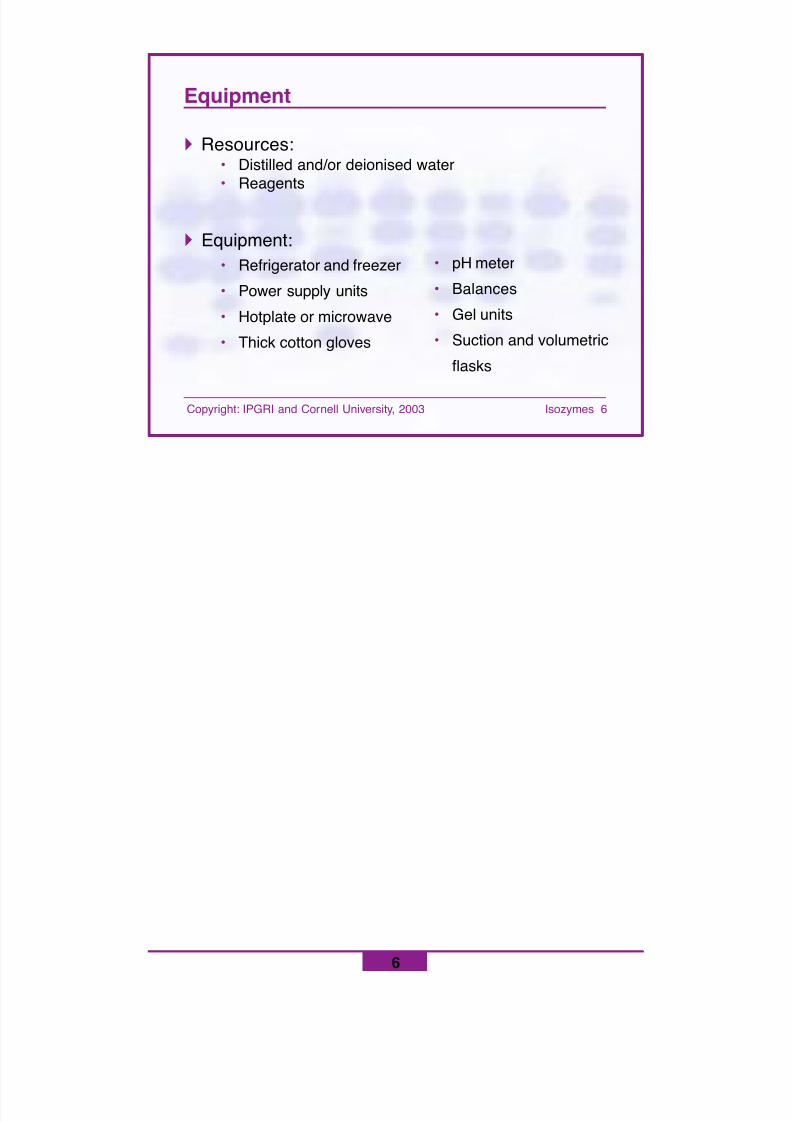
! Resources:• Distilled and/or deionised water• Reagents
! Equipment:• Refrigerator and freezer
• Power supply units
• Hotplate or microwave
• Thick cotton gloves
• pH meter
• Balances
• Gel units
• Suction and volumetric
flasks

8/11/2019 Using molecular marker technology in studies on plant genetic diversity
http://slidepdf.com/reader/full/using-molecular-marker-technology-in-studies-on-plant-genetic-diversity 51/374
7
Copyright: IPGRI and Cornell University, 2003 Isozymes 7
Isozymes in pictures
The following photographs illustrate the laboratory
steps involved in detecting isozymes
8/11/2019 Using molecular marker technology in studies on plant genetic diversity
http://slidepdf.com/reader/full/using-molecular-marker-technology-in-studies-on-plant-genetic-diversity 52/374
8
Copyright: IPGRI and Cornell University, 2003 Isozymes 8
Courtesy of Dr. Pere Arús, IRTA, Spain
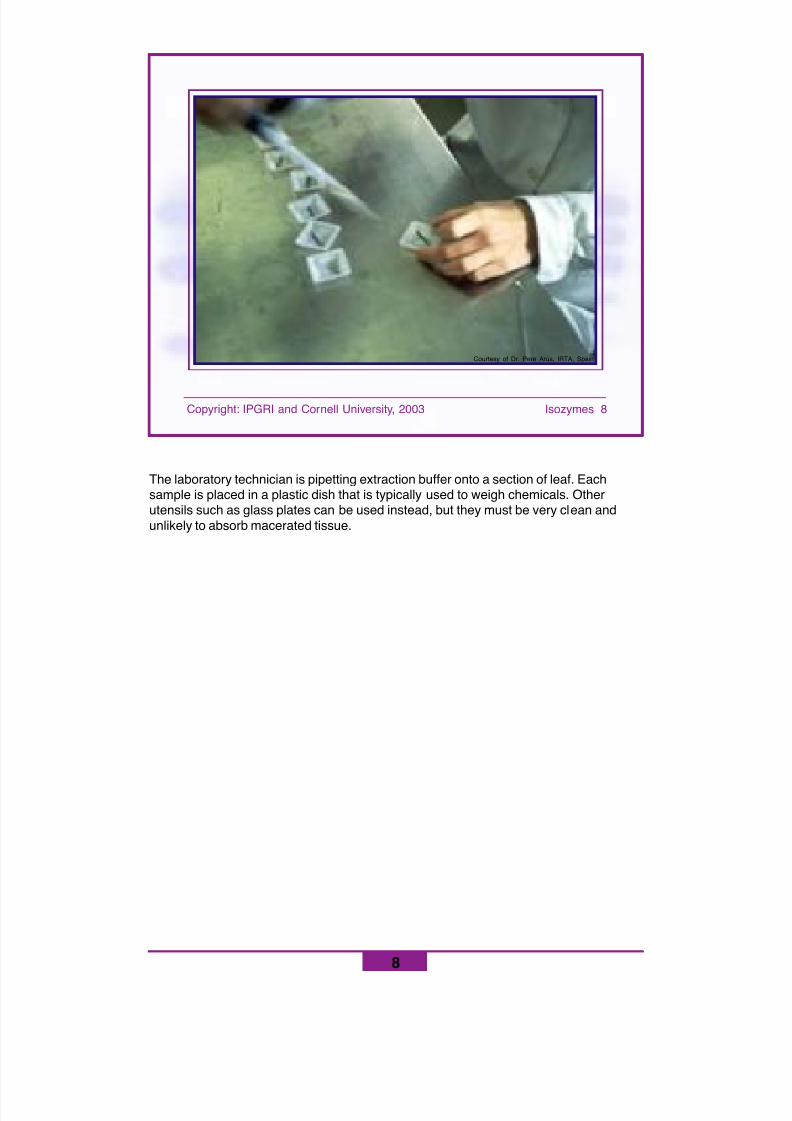
The laboratory technician is pipetting extraction buffer onto a section of leaf. Eachsample is placed in a plastic dish that is typically used to weigh chemicals. Otherutensils such as glass plates can be used instead, but they must be very clean andunlikely to absorb macerated tissue.
8/11/2019 Using molecular marker technology in studies on plant genetic diversity
http://slidepdf.com/reader/full/using-molecular-marker-technology-in-studies-on-plant-genetic-diversity 53/374
9
Copyright: IPGRI and Cornell University, 2003 Isozymes 9
Courtesy of Dr. Pere Arús, IRTA, Spain
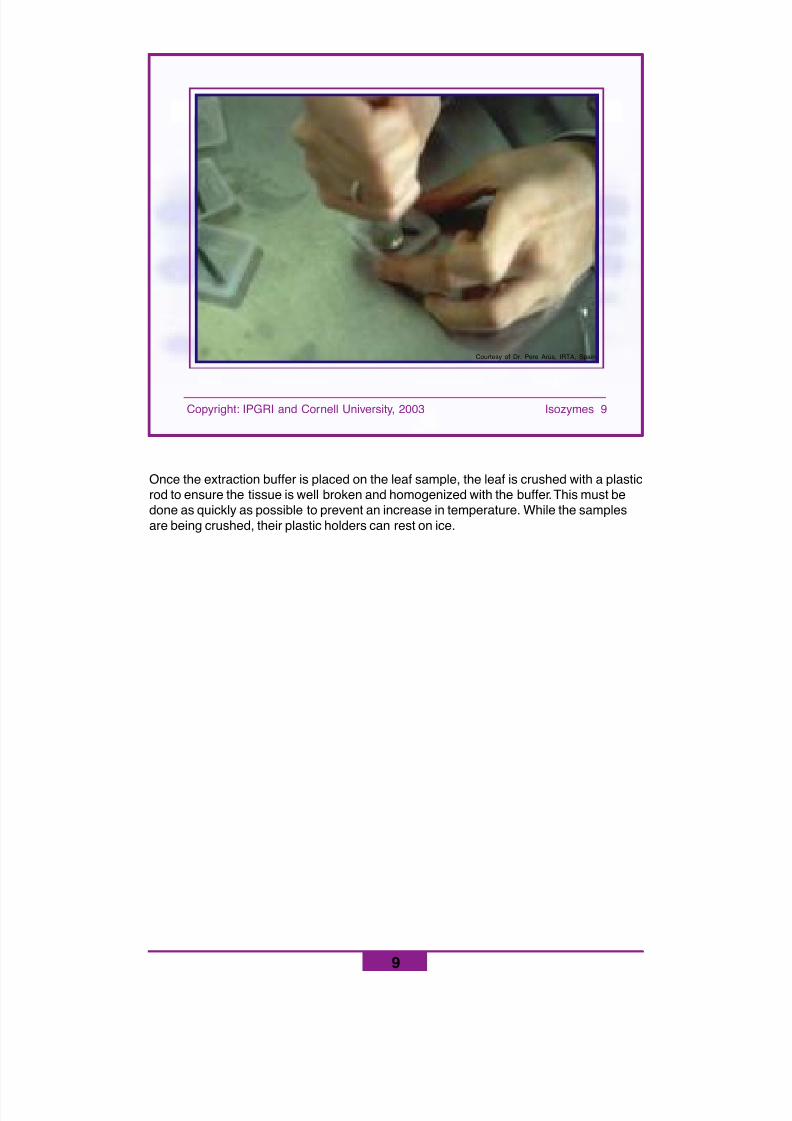
Once the extraction buffer is placed on the leaf sample, the leaf is crushed with a plasticrod to ensure the tissue is well broken and homogenized with the buffer. This must bedone as quickly as possible to prevent an increase in temperature. While the samplesare being crushed, their plastic holders can rest on ice.
8/11/2019 Using molecular marker technology in studies on plant genetic diversity
http://slidepdf.com/reader/full/using-molecular-marker-technology-in-studies-on-plant-genetic-diversity 54/374
10
Copyright: IPGRI and Cornell University, 2003 Isozymes 10
Courtesy of Dr. Pere Arús, IRTA, Spain
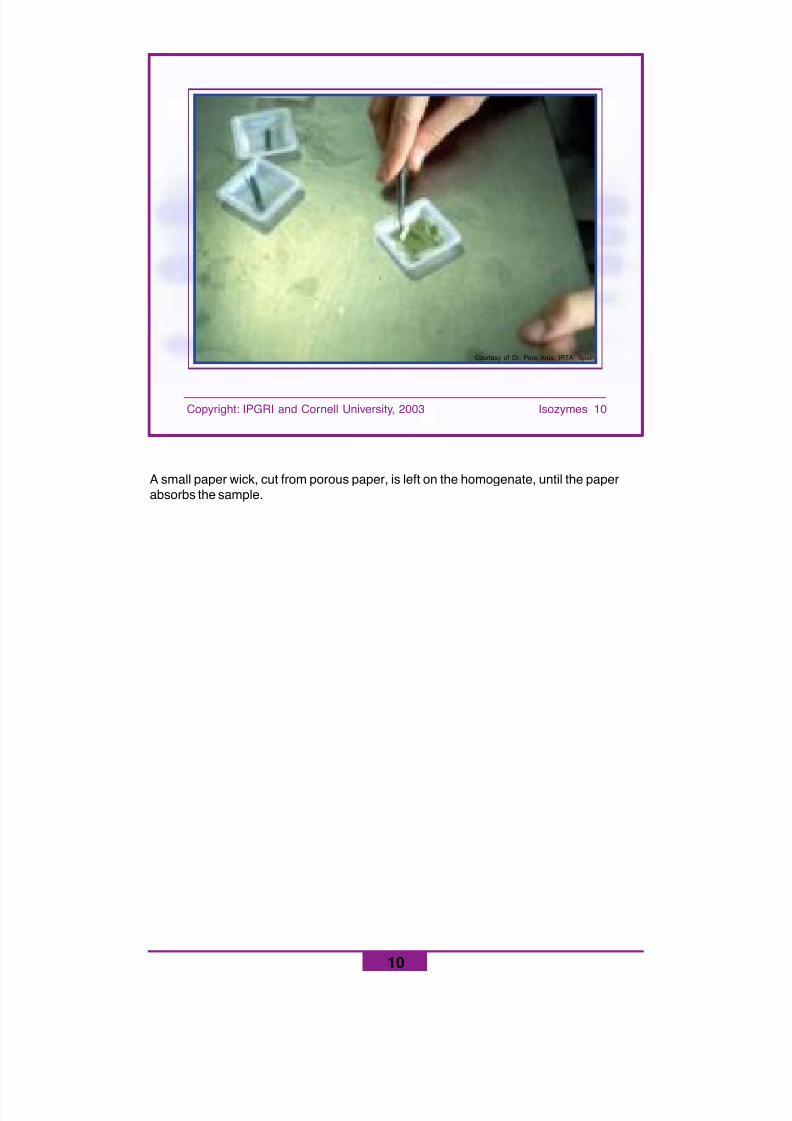
A small paper wick, cut from porous paper, is left on the homogenate, until the paperabsorbs the sample.
8/11/2019 Using molecular marker technology in studies on plant genetic diversity
http://slidepdf.com/reader/full/using-molecular-marker-technology-in-studies-on-plant-genetic-diversity 55/374
11
Copyright: IPGRI and Cornell University, 2003 Isozymes 11
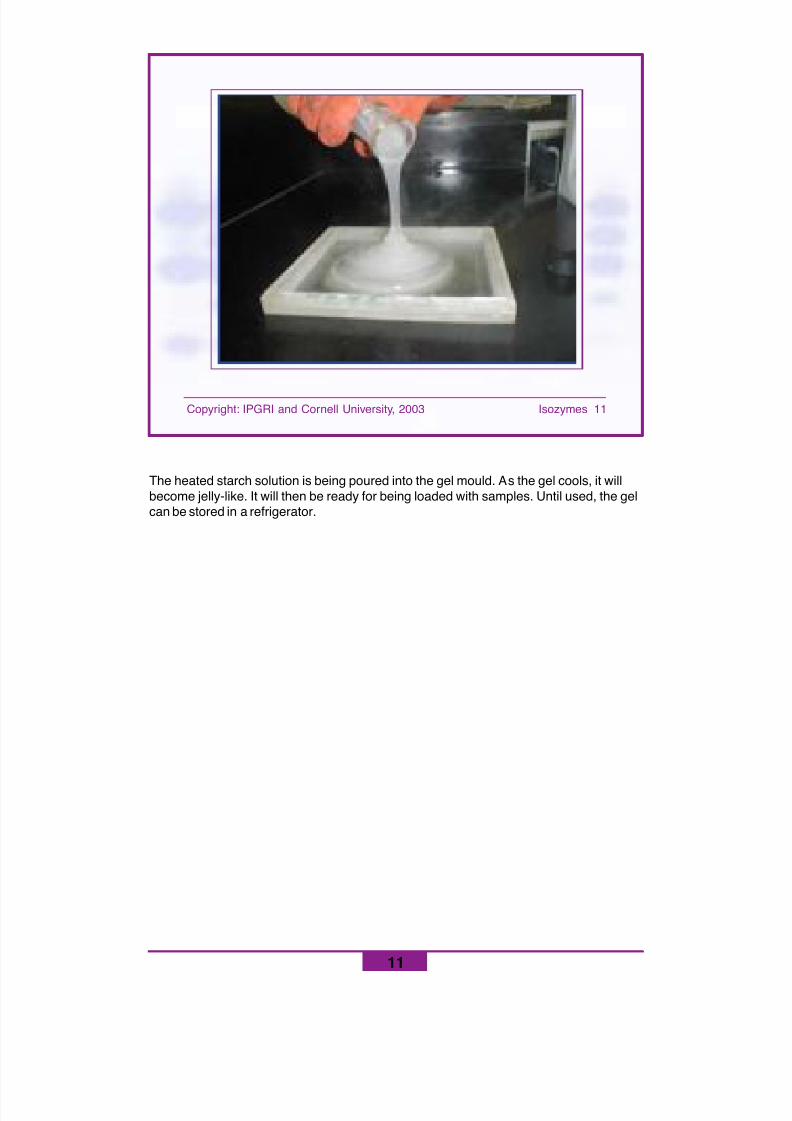
The heated starch solution is being poured into the gel mould. As the gel cools, it willbecome jelly-like. It will then be ready for being loaded with samples. Until used, the gelcan be stored in a refrigerator.
8/11/2019 Using molecular marker technology in studies on plant genetic diversity
http://slidepdf.com/reader/full/using-molecular-marker-technology-in-studies-on-plant-genetic-diversity 56/374
12
Copyright: IPGRI and Cornell University, 2003 Isozymes 12
Courtesy of Dr. Pere Arús, IRTA, Spain
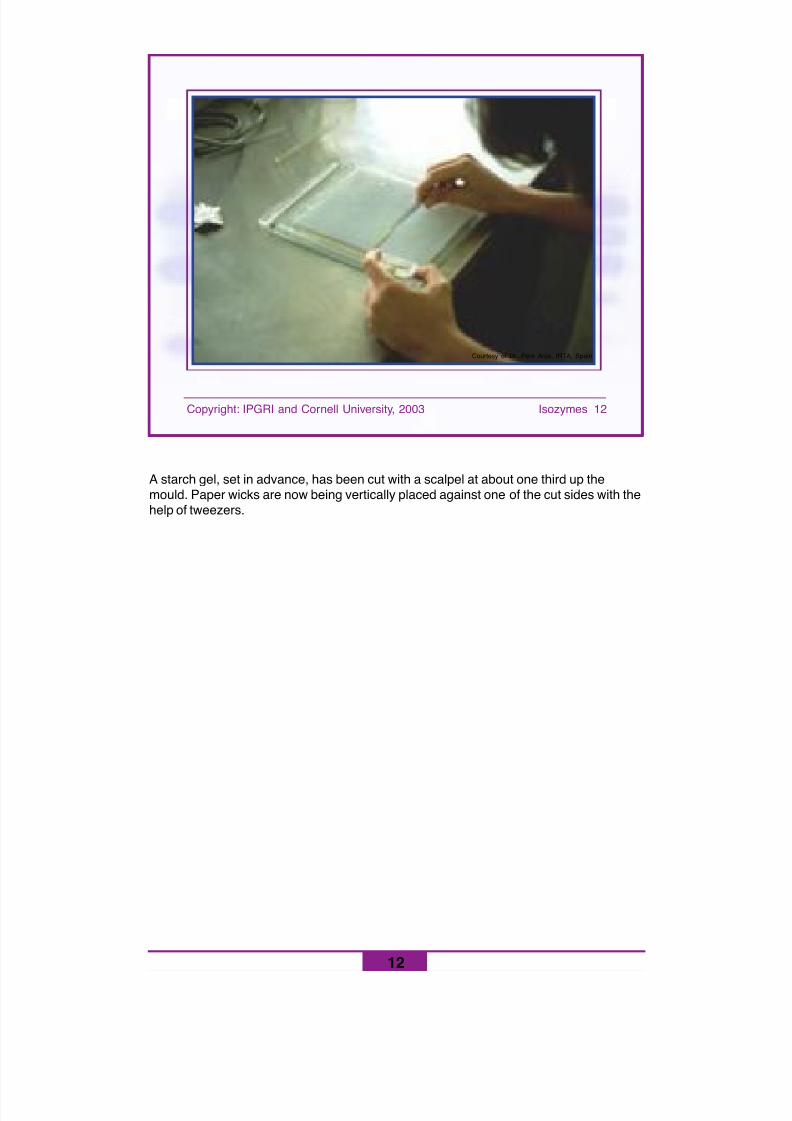
A starch gel, set in advance, has been cut with a scalpel at about one third up themould. Paper wicks are now being vertically placed against one of the cut sides with thehelp of tweezers.
8/11/2019 Using molecular marker technology in studies on plant genetic diversity
http://slidepdf.com/reader/full/using-molecular-marker-technology-in-studies-on-plant-genetic-diversity 57/374
13
Copyright: IPGRI and Cornell University, 2003 Isozymes 13
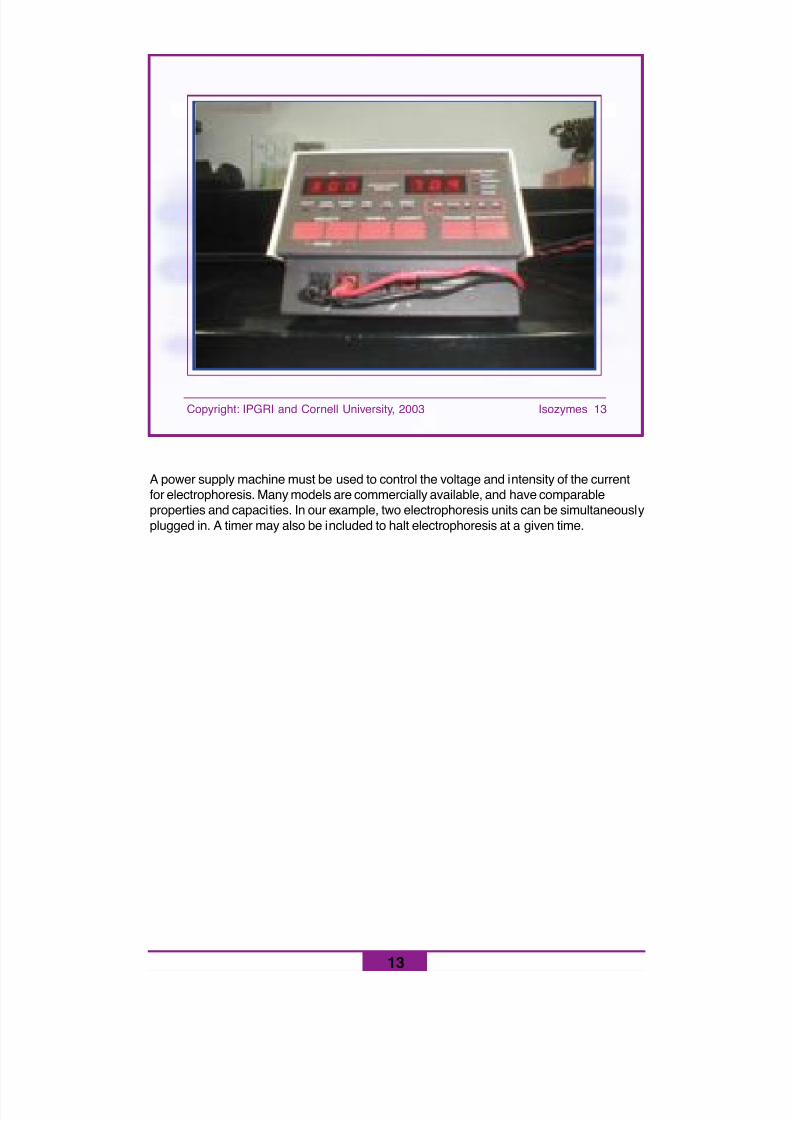
A power supply machine must be used to control the voltage and intensity of the currentfor electrophoresis. Many models are commercially available, and have comparableproperties and capacities. In our example, two electrophoresis units can be simultaneouslyplugged in. A timer may also be included to halt electrophoresis at a given time.
8/11/2019 Using molecular marker technology in studies on plant genetic diversity
http://slidepdf.com/reader/full/using-molecular-marker-technology-in-studies-on-plant-genetic-diversity 58/374
14
Copyright: IPGRI and Cornell University, 2003 Isozymes 14
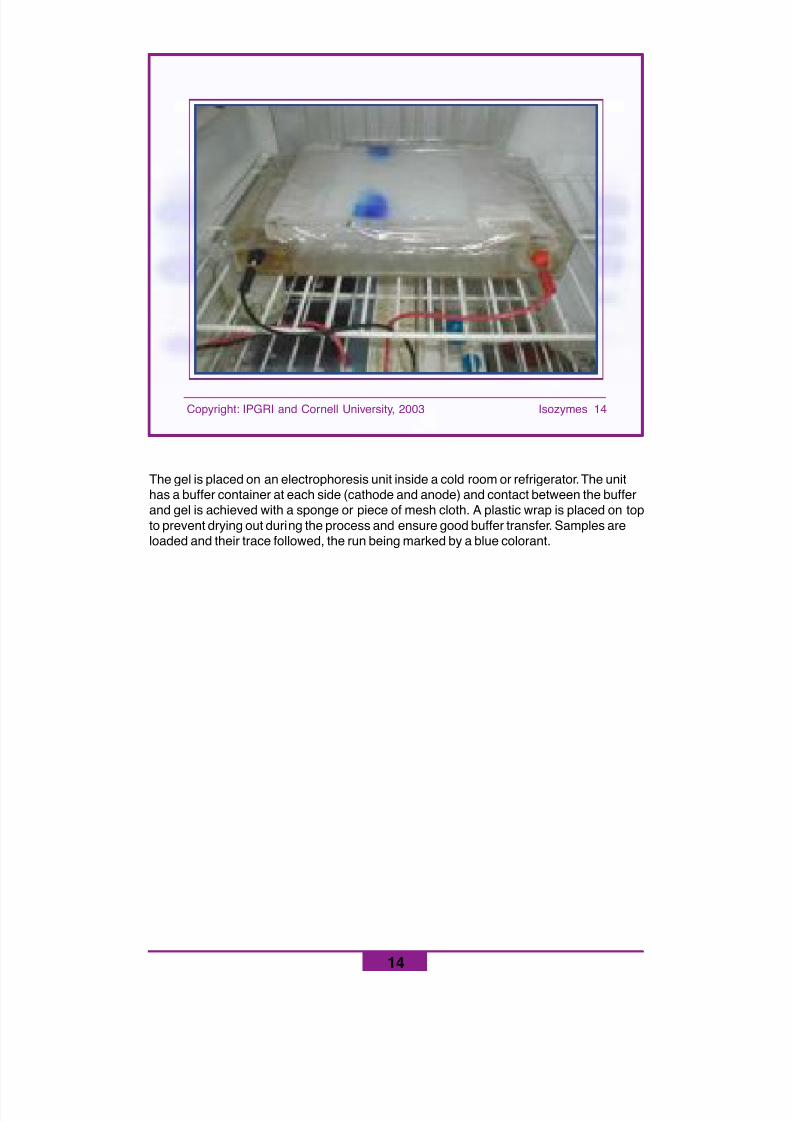
The gel is placed on an electrophoresis unit inside a cold room or refrigerator. The unithas a buffer container at each side (cathode and anode) and contact between the bufferand gel is achieved with a sponge or piece of mesh cloth. A plastic wrap is placed on topto prevent drying out during the process and ensure good buffer transfer. Samples areloaded and their trace followed, the run being marked by a blue colorant.
8/11/2019 Using molecular marker technology in studies on plant genetic diversity
http://slidepdf.com/reader/full/using-molecular-marker-technology-in-studies-on-plant-genetic-diversity 59/374
15
Copyright: IPGRI and Cornell University, 2003 Isozymes 15
Courtesy of Dr. Pere Arús, IRTA, Spain
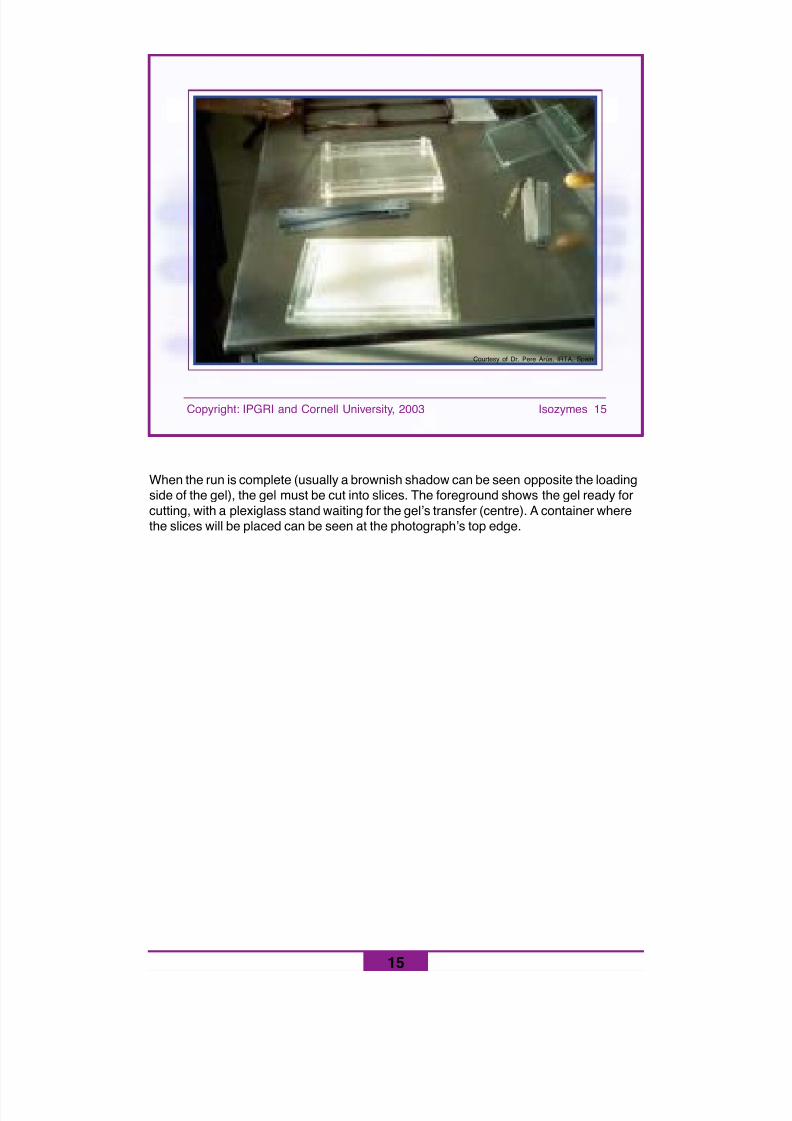
When the run is complete (usually a brownish shadow can be seen opposite the loadingside of the gel), the gel must be cut into slices. The foreground shows the gel ready forcutting, with a plexiglass stand waiting for the gel’s transfer (centre). A container wherethe slices will be placed can be seen at the photograph’s top edge.
8/11/2019 Using molecular marker technology in studies on plant genetic diversity
http://slidepdf.com/reader/full/using-molecular-marker-technology-in-studies-on-plant-genetic-diversity 60/374
16
Copyright: IPGRI and Cornell University, 2003 Isozymes 16
Courtesy of Dr. Pere Arús, IRTA, Spain
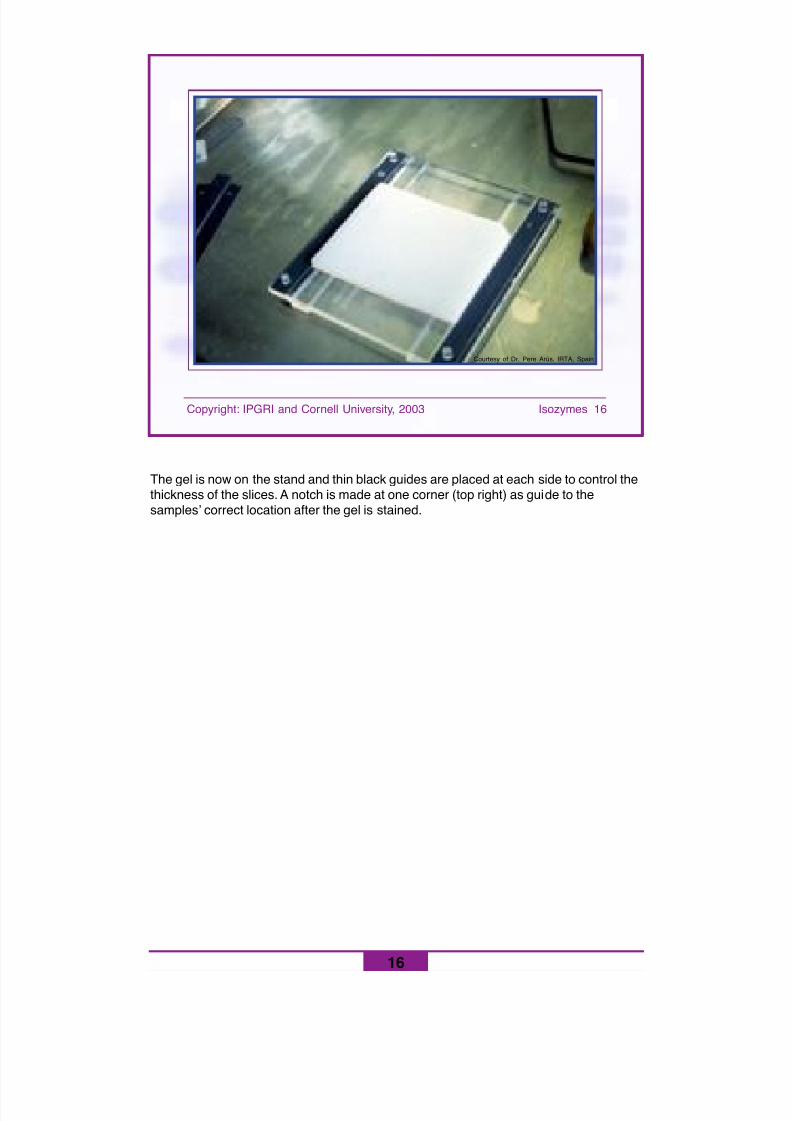
The gel is now on the stand and thin black guides are placed at each side to control thethickness of the slices. A notch is made at one corner (top right) as guide to thesamples’ correct location after the gel is stained.
8/11/2019 Using molecular marker technology in studies on plant genetic diversity
http://slidepdf.com/reader/full/using-molecular-marker-technology-in-studies-on-plant-genetic-diversity 61/374
17
Copyright: IPGRI and Cornell University, 2003 Isozymes 17
Courtesy of Dr. Pere Arús, IRTA, Spain
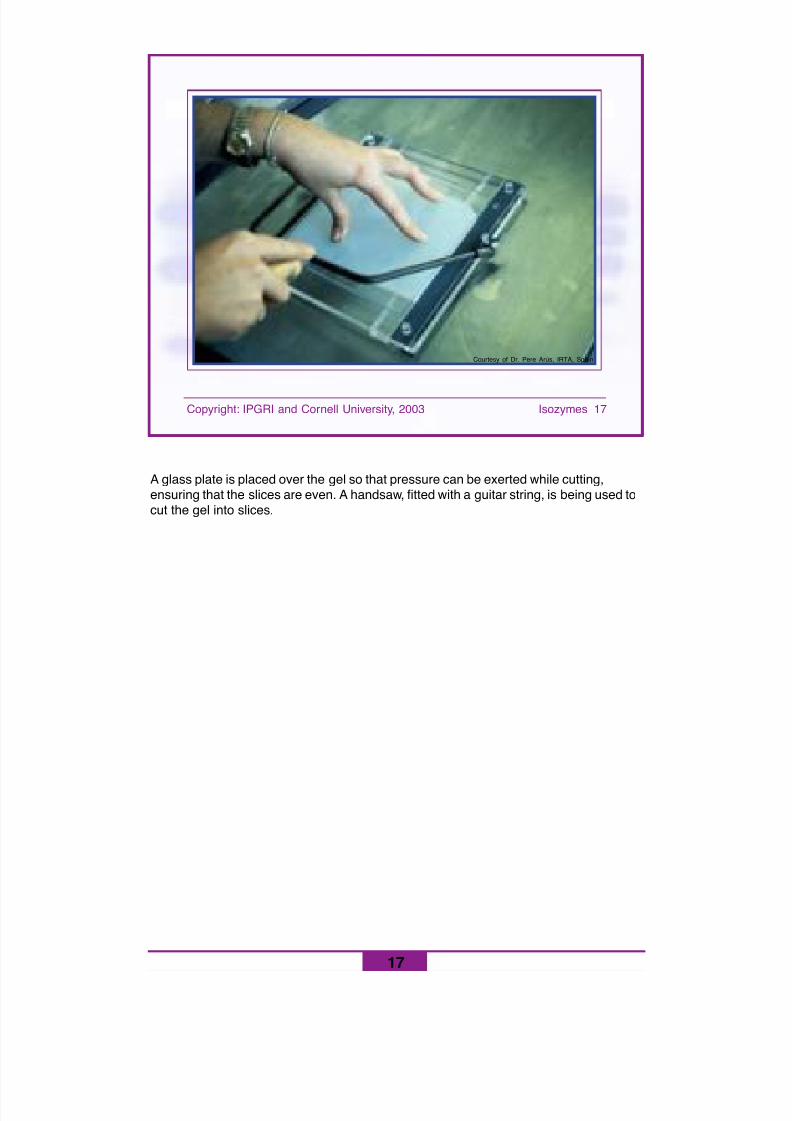
A glass plate is placed over the gel so that pressure can be exerted while cutting,ensuring that the slices are even. A handsaw, fitted with a guitar string, is being used tocut the gel into slices.
8/11/2019 Using molecular marker technology in studies on plant genetic diversity
http://slidepdf.com/reader/full/using-molecular-marker-technology-in-studies-on-plant-genetic-diversity 62/374
18
Copyright: IPGRI and Cornell University, 2003 Isozymes 18
Courtesy of Dr. Pere Arús, IRTA, Spain
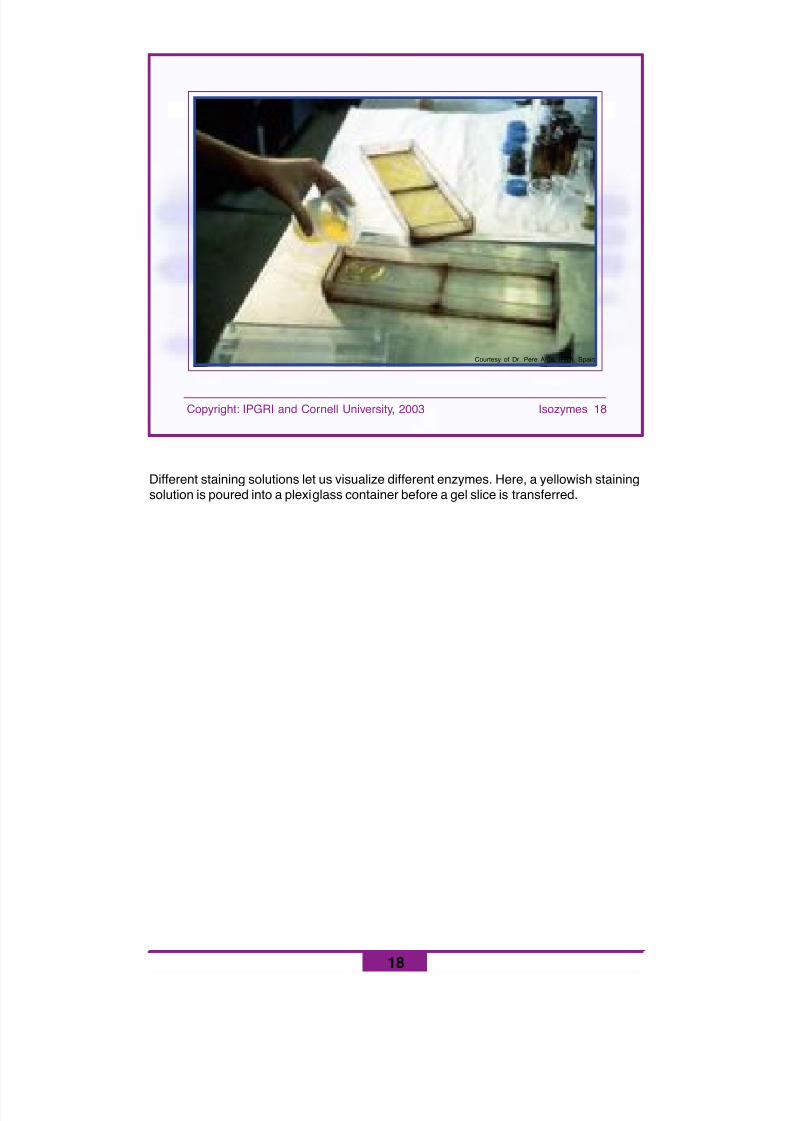
Different staining solutions let us visualize different enzymes. Here, a yellowish stainingsolution is poured into a plexiglass container before a gel slice is transferred.
8/11/2019 Using molecular marker technology in studies on plant genetic diversity
http://slidepdf.com/reader/full/using-molecular-marker-technology-in-studies-on-plant-genetic-diversity 63/374
19
Copyright: IPGRI and Cornell University, 2003 Isozymes 19
Courtesy of Dr. Pere Arús, IRTA, Spain
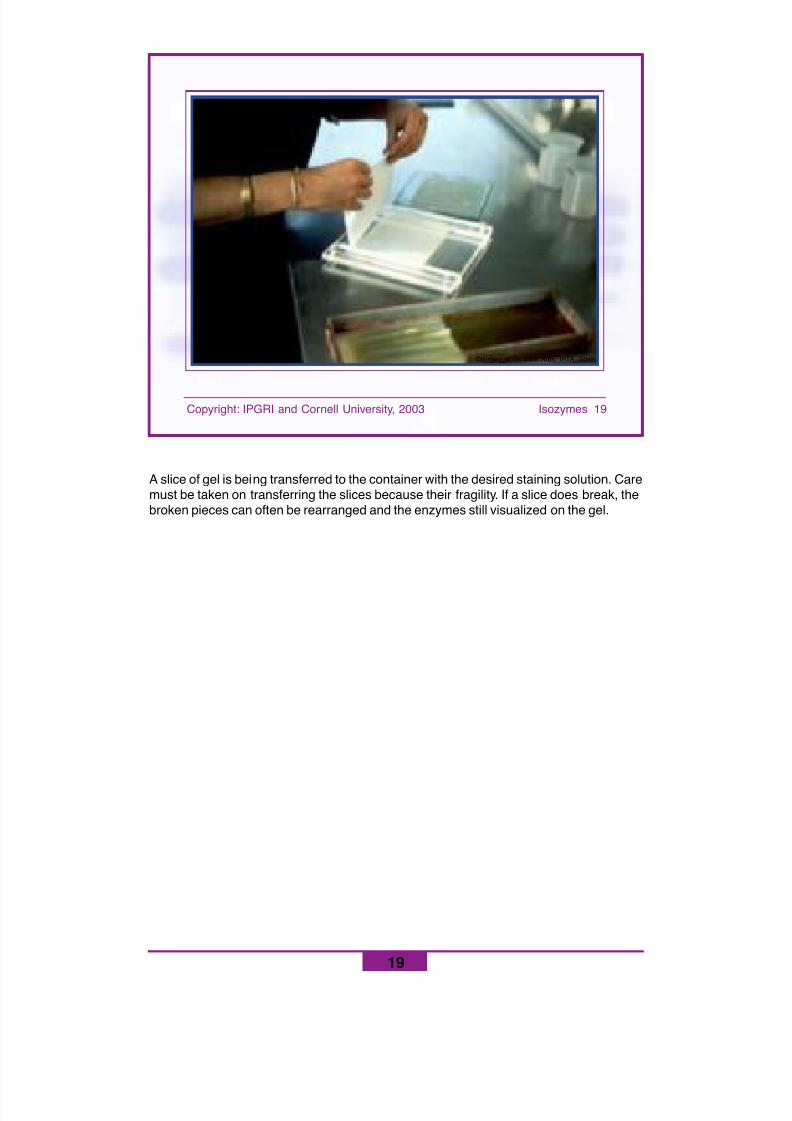
A slice of gel is being transferred to the container with the desired staining solution. Caremust be taken on transferring the slices because their fragility. If a slice does break, thebroken pieces can often be rearranged and the enzymes still visualized on the gel.
8/11/2019 Using molecular marker technology in studies on plant genetic diversity
http://slidepdf.com/reader/full/using-molecular-marker-technology-in-studies-on-plant-genetic-diversity 64/374
20
Copyright: IPGRI and Cornell University, 2003 Isozymes 20
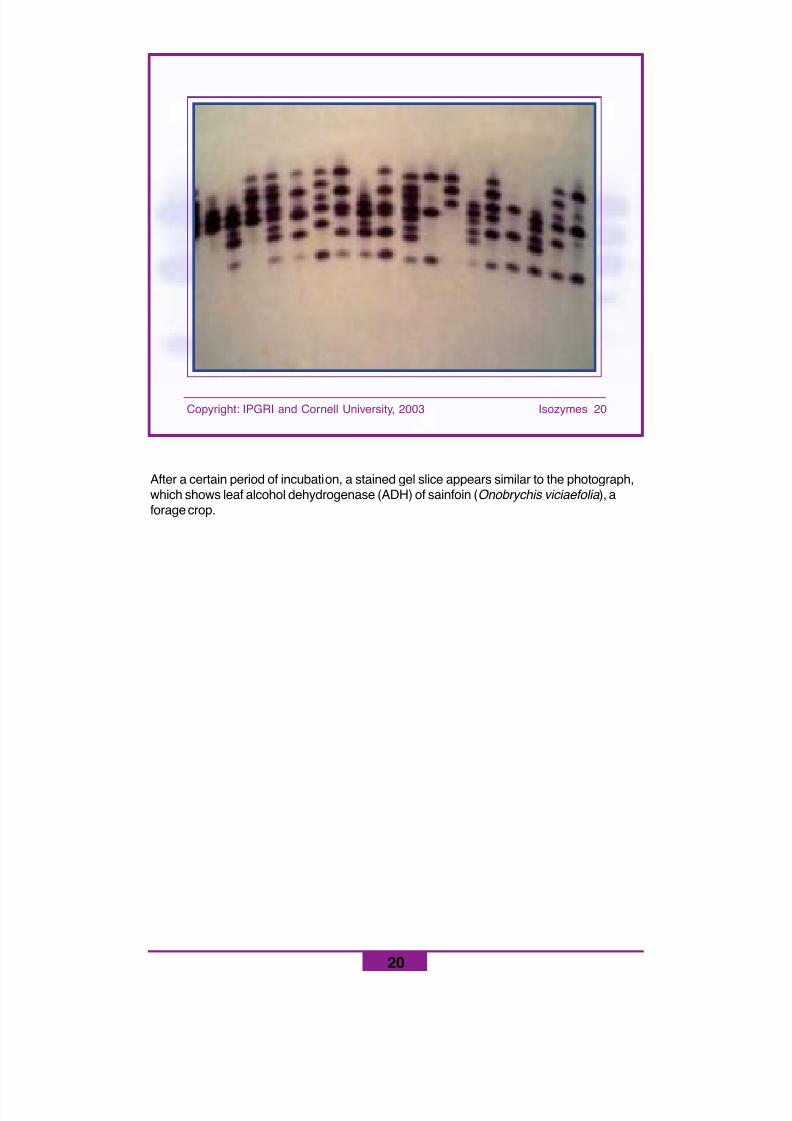
After a certain period of incubation, a stained gel slice appears similar to the photograph,which shows leaf alcohol dehydrogenase (ADH) of sainfoin ( Onobrychis viciaefolia ), aforage crop.
8/11/2019 Using molecular marker technology in studies on plant genetic diversity
http://slidepdf.com/reader/full/using-molecular-marker-technology-in-studies-on-plant-genetic-diversity 65/374
21
Copyright: IPGRI and Cornell University, 2003 Isozymes 21
Interpreting banding patterns
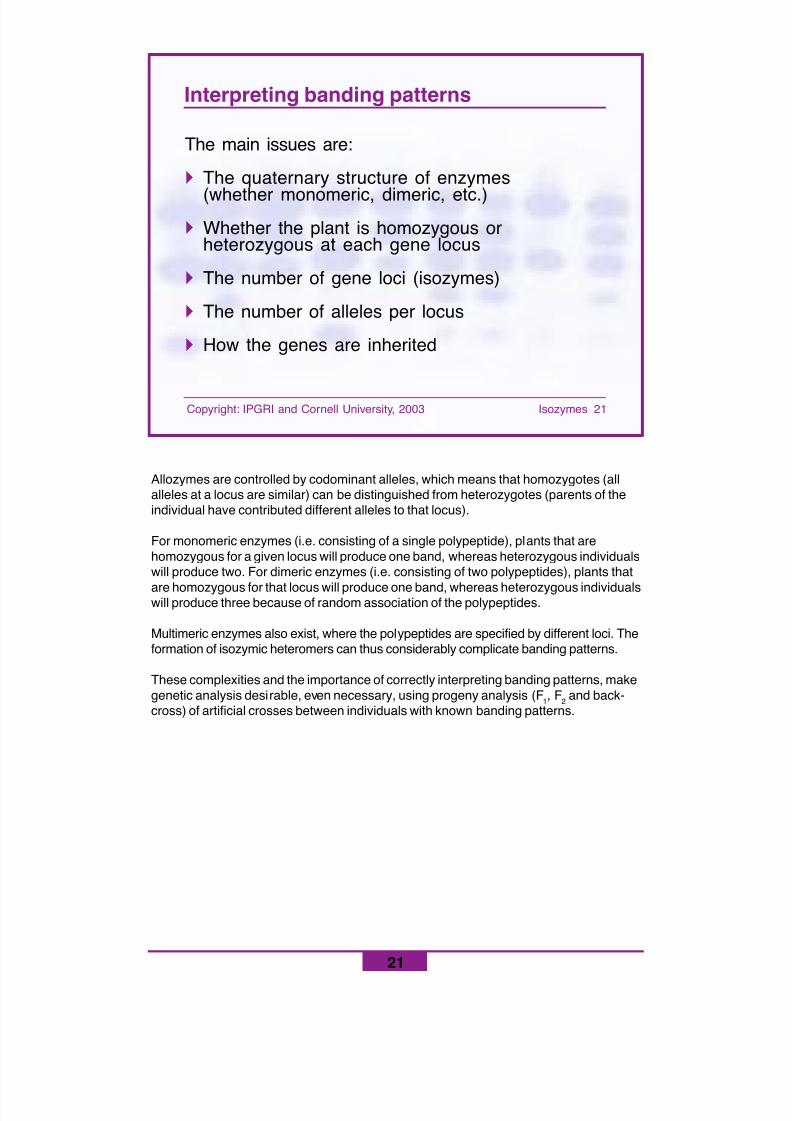
The main issues are:
! The quaternary structure of enzymes(whether monomeric, dimeric, etc.)
! Whether the plant is homozygous orheterozygous at each gene locus
! The number of gene loci (isozymes)
! The number of alleles per locus
! How the genes are inherited
Allozymes are controlled by codominant alleles, which means that homozygotes (allalleles at a locus are similar) can be distinguished from heterozygotes (parents of theindividual have contributed different alleles to that locus).
For monomeric enzymes (i.e. consisting of a single polypeptide), plants that arehomozygous for a given locus will produce one band, whereas heterozygous individualswill produce two. For dimeric enzymes (i.e. consisting of two polypeptides), plants that
are homozygous for that locus will produce one band, whereas heterozygous individualswill produce three because of random association of the polypeptides.
Multimeric enzymes also exist, where the polypeptides are specified by different loci. Theformation of isozymic heteromers can thus considerably complicate banding patterns.
These complexities and the importance of correctly interpreting banding patterns, makegenetic analysis desirable, even necessary, using progeny analysis (F 1, F 2 and back-cross) of artificial crosses between individuals with known banding patterns.
8/11/2019 Using molecular marker technology in studies on plant genetic diversity
http://slidepdf.com/reader/full/using-molecular-marker-technology-in-studies-on-plant-genetic-diversity 66/374
22
Copyright: IPGRI and Cornell University, 2003 Isozymes 22
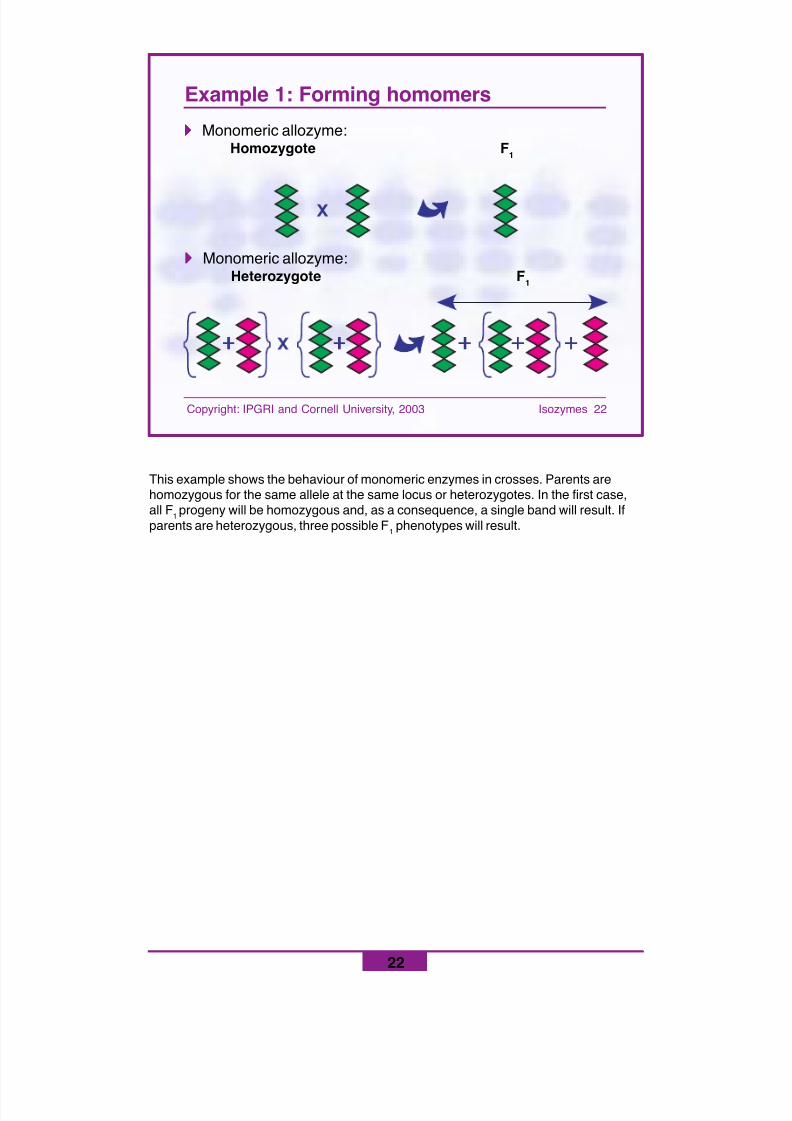
Example 1: Forming homomers
This example shows the behaviour of monomeric enzymes in crosses. Parents arehomozygous for the same allele at the same locus or heterozygotes. In the first case,all F 1 progeny will be homozygous and, as a consequence, a single band will result. Ifparents are heterozygous, three possible F 1 phenotypes will result.
!!!!! Monomeric allozyme:Homozygote F 1
!!!!! Monomeric allozyme:Heterozygote F 1
8/11/2019 Using molecular marker technology in studies on plant genetic diversity
http://slidepdf.com/reader/full/using-molecular-marker-technology-in-studies-on-plant-genetic-diversity 67/374
23
Copyright: IPGRI and Cornell University, 2003 Isozymes 23
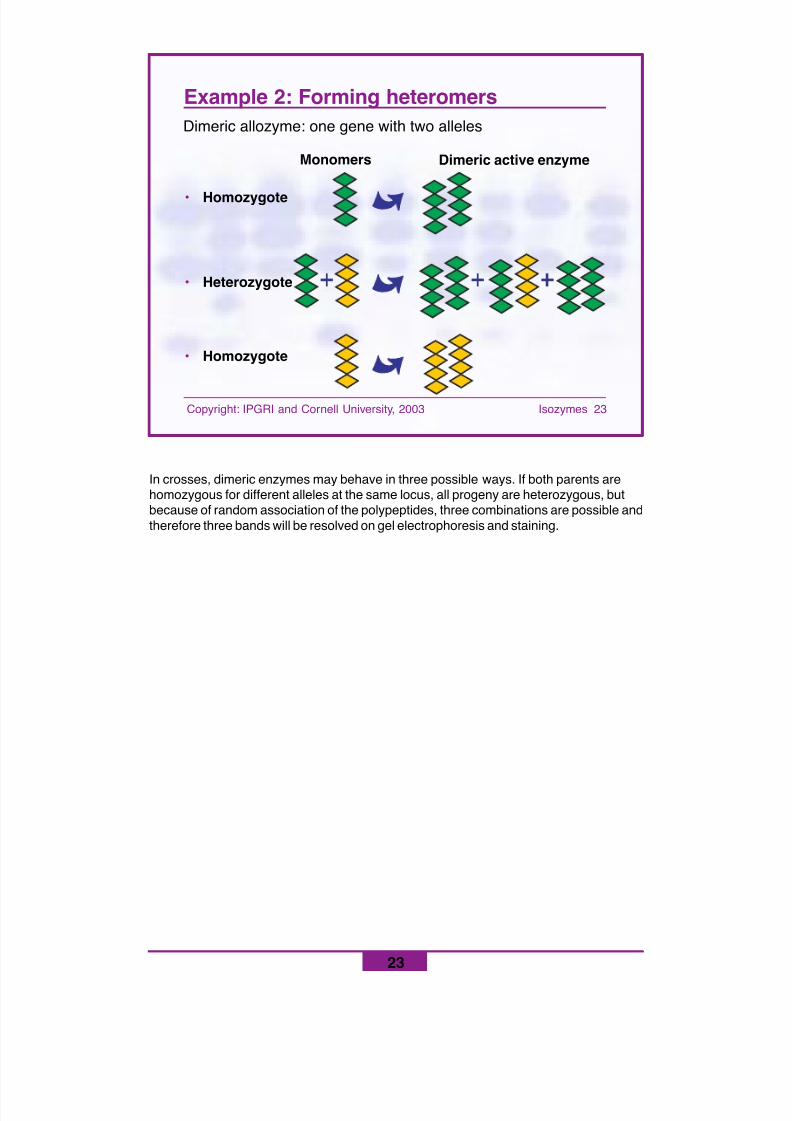
In crosses, dimeric enzymes may behave in three possible ways. If both parents arehomozygous for different alleles at the same locus, all progeny are heterozygous, butbecause of random association of the polypeptides, three combinations are possible andtherefore three bands will be resolved on gel electrophoresis and staining.
Example 2: Forming heteromersDimeric allozyme: one gene with two alleles
Monomers Dimeric active enzyme
• Homozygote
• Heterozygote
• Homozygote
8/11/2019 Using molecular marker technology in studies on plant genetic diversity
http://slidepdf.com/reader/full/using-molecular-marker-technology-in-studies-on-plant-genetic-diversity 68/374
24
Copyright: IPGRI and Cornell University, 2003 Isozymes 24
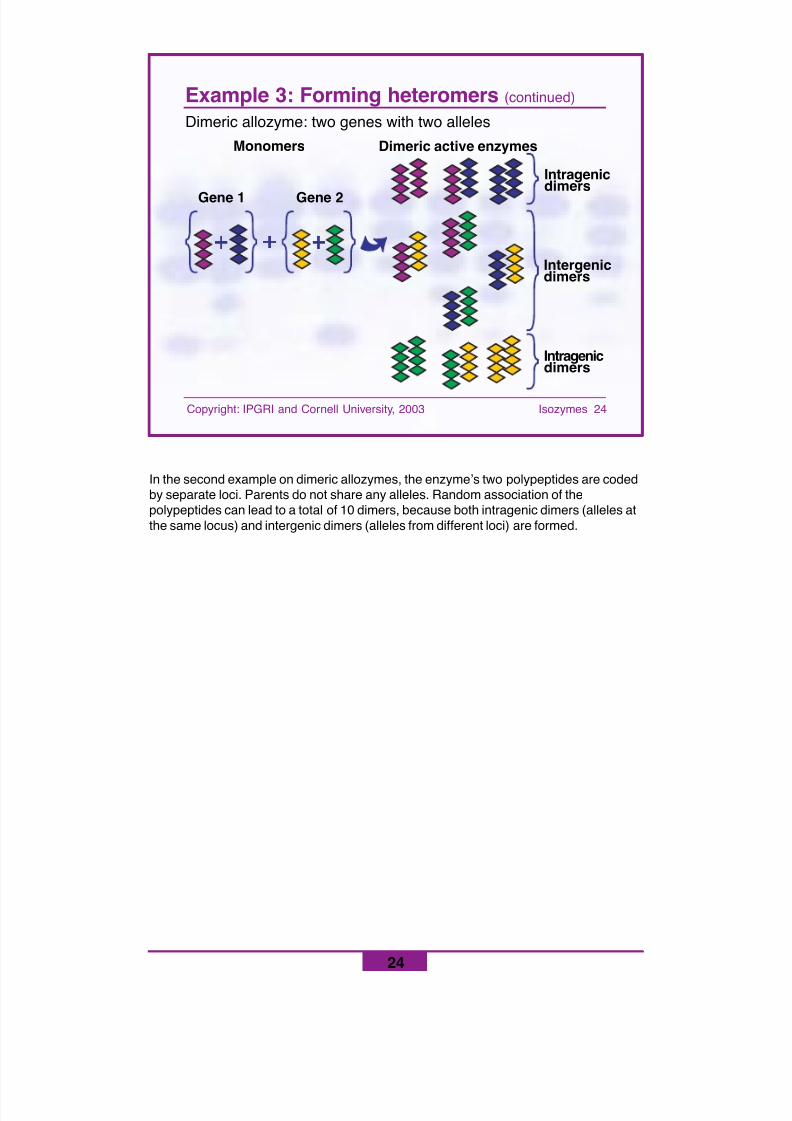
Example 3: Forming heteromers (continued)
In the second example on dimeric allozymes, the enzyme’s two polypeptides are codedby separate loci. Parents do not share any alleles. Random association of thepolypeptides can lead to a total of 10 dimers, because both intragenic dimers (alleles atthe same locus) and intergenic dimers (alleles from different loci) are formed.
Dimeric allozyme: two genes with two allelesMonomers
Gene 1 Gene 2
Dimeric active enzymes
Intragenicdimers
Intergenicdimers
Intragenicdimers
8/11/2019 Using molecular marker technology in studies on plant genetic diversity
http://slidepdf.com/reader/full/using-molecular-marker-technology-in-studies-on-plant-genetic-diversity 69/374
25
Copyright: IPGRI and Cornell University, 2003 Isozymes 25
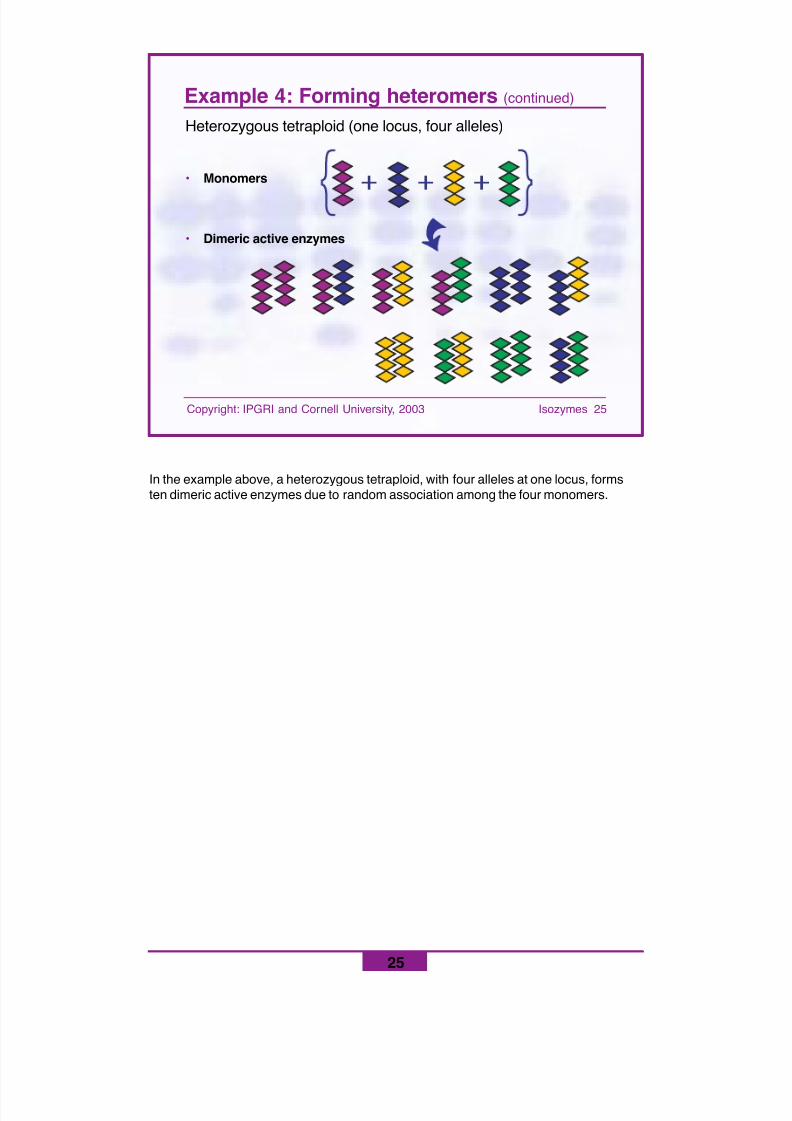
Example 4: Forming heteromers (continued)
Heterozygous tetraploid (one locus, four alleles)
In the example above, a heterozygous tetraploid, with four alleles at one locus, formsten dimeric active enzymes due to random association among the four monomers.
• Monomers
• Dimeric active enzymes
8/11/2019 Using molecular marker technology in studies on plant genetic diversity
http://slidepdf.com/reader/full/using-molecular-marker-technology-in-studies-on-plant-genetic-diversity 70/374
26
Copyright: IPGRI and Cornell University, 2003 Isozymes 26
Advantages and disadvantages
! Advantages• Robust and highly reproducible
• Codominant, i.e. suitable for estimating a wide rangeof population genetics parameters and for geneticmapping
! Disadvantages• Relatively few biochemical assays available to detect
enzymes• Phenotype-based analysis
Isozyme analysis is, in principle, a robust and reproducible method. In addition,isozymes are codominant markers and are suitable for estimating all populationgenetics parameters and for genetic mapping.
About 90 isozyme systems have been used for plants, with isozyme loci being mappedin many cases.
The major limitation of isozyme analysis is the low number of markers it provides,because the number of biochemical assays available to detect them is small.Consequently, the percentage of genome coverage is inadequate for a thorough study ofgenetic diversity.
Another disadvantage of isozyme analysis lies in the markers being based onphenotype. As such, they may be influenced by environmental factors, with differencesin expression confounding the interpretation of results. Because differential expressionof the genes may occur at different developmental stages or in different tissues, thesame type of material must be used for all experiments.
8/11/2019 Using molecular marker technology in studies on plant genetic diversity
http://slidepdf.com/reader/full/using-molecular-marker-technology-in-studies-on-plant-genetic-diversity 71/374
27
Copyright: IPGRI and Cornell University, 2003 Isozymes 27
Applications
!!!!! Gene flow and/or introgression
!!!!! Genetics of populations
!!!!! Strategies for ex situ conservation
!!!!! Crop evolution
!!!!! Germplasm evaluation and characterization
!!!!! Genetic erosion
!!!!! Genetic stability of conserved material
References in purple are explained in detail in the following slides.
Bartsch, D., M. Lehnen, J. Clegg, M. Pohl-Orf, I. Schuphan and N.C. Ellstrand. 1999.Impact of gene flow from cultivated beet on genetic diversity of wild sea beetpopulations. Mol. Ecol. 8:1733-1741.
Finkeldey, R. and O. Murillo. 1999. Contributions of subpopulations to total gene diversity.Theor. Appl. Genet. 98:664-668.
Ibáñez, O., C. Calero, M. Mayol and A. Rosello. 1999. Isozyme uniformity in a wildextinct insular plant, Lysimachia minoricensis J.J. Rodr. (Primulaceae). Mol. Ecol.8:813-817.
Ledig, F.T. 2000. Founder effects and the genetic structure of Coulter pine. J. Hered.91(4):307-315.
Li, Z. and J.N. Rutger. 2000. Geographic distribution and multilocus organization ofisozyme variation of rice ( Oryza sativa L.). Theor. Appl. Genet. 101:379-387.
Liu, F., R. Von Bothmer and B. Salomon. 1999. Genetic diversity among East Asianaccessions of the barley core collection as revealed by six isozyme loci. Theor. Appl.Genet. 98:1226-1233.
Maquet, A., I. Zoro Bi, M. Delvaux, B. Wathelet and J.P. Baudoin. 1997. Geneticstructure of a Lima bean base collection using allozyme markers. Theor. Appl. Genet.95:980-991.
Ortiz, R. and Z. Huaman. 2001. Allozyme polymorphisms in tetraploid potato gene poolsand the effect on human selection. Theor. Appl. Genet. 103:792-796.
Rouamba, A., M. Sandmeier, A. Sarr and A. Ricroch. 2001. Allozyme variation within andamong populations of onion ( Allium cepa L.) from West Africa. Theor. Appl. Genet.103:855-861.
Shapcott, A. 1998. The patterns of genetic diversity in Carpentaria acuminata (Arecaceae) and rainforest history in northern Australia. Mol. Ecol. 7:833-847.
8/11/2019 Using molecular marker technology in studies on plant genetic diversity
http://slidepdf.com/reader/full/using-molecular-marker-technology-in-studies-on-plant-genetic-diversity 72/374
28
Copyright: IPGRI and Cornell University, 2003 Isozymes 28
Example: Lysimachia sp.
! Title:Isozyme uniformity in a wild extinct insular plant,Lysimachia minoricensis J.J. Rodr. (Primulaceae).Mol. Ecol. 1999. 8: 813-817
! Objective:To evaluate the genetic diversity of seed accessions ofLysimachia minoricensis conserved and provided by10 European botanical gardens
! Materials and methods:A total of 158 plants were analysed for 13 enzymes(22 loci)
(continued on next slide)
8/11/2019 Using molecular marker technology in studies on plant genetic diversity
http://slidepdf.com/reader/full/using-molecular-marker-technology-in-studies-on-plant-genetic-diversity 73/374
29
Copyright: IPGRI and Cornell University, 2003 Isozymes 29
Example: Lysimachia sp. (continued)
! Results:No electrophoretic variation was detected for any ofthe enzymes assayed (22 loci)
! Discussion on lack of variation:• Electrophoretic techniques resolve only a small
portion of genetic variation
• Low sample size? The sample offers a 95.6%probability of detecting any variant allele that existedat an overall frequency of at least 1%
• Is this lack of detectable variation unexpected?Results address more the question of the amount ofgenetic variation preserved ex situ than what the level
was before extinction
(continued on next slide)
8/11/2019 Using molecular marker technology in studies on plant genetic diversity
http://slidepdf.com/reader/full/using-molecular-marker-technology-in-studies-on-plant-genetic-diversity 74/374
30
Copyright: IPGRI and Cornell University, 2003 Isozymes 30
Example: Lysimachia sp. (continued)
Conclusions:The exchange system among botanicalgardens is not adequate for effectiveconservation if the genetic variation within aspecies is underrepresented in the plantcollections
8/11/2019 Using molecular marker technology in studies on plant genetic diversity
http://slidepdf.com/reader/full/using-molecular-marker-technology-in-studies-on-plant-genetic-diversity 75/374
31
Copyright: IPGRI and Cornell University, 2003 Isozymes 31
Example: Lima bean! Title:
Genetic structure of a Lima bean base collectionusing allozyme markers. Theor. Appl. Genet 1997.
95:980-991! Objective:
To evaluate genetic diversity and structure within alima bean ( Phaseolus lunatus L.) base collection,involving several, widely distributed, wild accessionsand landraces
! Materials and methods:Ten enzyme systems were used to analyse 235 limabean accessions (1-5 seeds each) collected in Latin
America and the Caribbean
(continued on next slide)
8/11/2019 Using molecular marker technology in studies on plant genetic diversity
http://slidepdf.com/reader/full/using-molecular-marker-technology-in-studies-on-plant-genetic-diversity 76/374
32
Copyright: IPGRI and Cornell University, 2003 Isozymes 32
Example: Lima bean (continued)
Results and discussion:• Thirteen loci (32 alleles) were found for 10 enzyme systems• Specific alleles were identified in each gene pool. The
dendrogram clearly showed two main clusters:• Accessions from the Andes with an Andean seed-protein
pattern• Mesoamerican and Andean accessions with a Mesoamerican
seed-protein pattern
• Both Andean and Mesoamerican landraces weregrouped with their respective relatives
• On average, the lima bean showed 76% and 24% of thetotal diversity, respectively, among and within accessions.Reasons are selfing, occurrence of small populations,
and low gene flow
(continued on next slide)
8/11/2019 Using molecular marker technology in studies on plant genetic diversity
http://slidepdf.com/reader/full/using-molecular-marker-technology-in-studies-on-plant-genetic-diversity 77/374
33
Copyright: IPGRI and Cornell University, 2003 Isozymes 33
Example: Lima bean (continued)
Conclusions:• A conservation programme of P. lunatus must
include wild and cultivated forms from both genepools
• As the genetic diversity is distributed mainlyamong accessions, more populations oraccessions should be preserved to ensure theretention of allelic and genotypic diversity for bothgene pools and botanical forms
8/11/2019 Using molecular marker technology in studies on plant genetic diversity
http://slidepdf.com/reader/full/using-molecular-marker-technology-in-studies-on-plant-genetic-diversity 78/374
34
Copyright: IPGRI and Cornell University, 2003 Isozymes 34
Example: Onion
! Title:Allozyme variation within and among populationsof onion ( Allium cepa L.) from West Africa. Theor.Appl. Genet. 2001. 103: 855-861
! Objective:To evaluate genetic diversity in local populationsof onion, using isozymes
! Materials and methods:• Sixteen local cultivated populations sampled from
five countries of West Africa were studied• Nine enzyme systems were assayed
(continued on next slide)
8/11/2019 Using molecular marker technology in studies on plant genetic diversity
http://slidepdf.com/reader/full/using-molecular-marker-technology-in-studies-on-plant-genetic-diversity 79/374
35
Copyright: IPGRI and Cornell University, 2003 Isozymes 35
Example: Onion (continued)
Results:• Four systems were polymorphic (ADH, MDH,
6-PGDH, PGI), with a total of nine alleles• The mean number of alleles found per polymorphic
locus was 2.25. In addition, 66.6% of alleles were present in all populations
• Allele adh-a2 was absent in the five populationsoriginating from Burkina Faso. Allele 6-pgdh-a2 waspresent only in two populations, one from southernNiger and the other from northern Nigeria
(continued on next slide)
8/11/2019 Using molecular marker technology in studies on plant genetic diversity
http://slidepdf.com/reader/full/using-molecular-marker-technology-in-studies-on-plant-genetic-diversity 80/374
36
Copyright: IPGRI and Cornell University, 2003 Isozymes 36
Example: Onion (continued)
! Discussion:• Weak geographical differentiation between
populations may have resulted from commercialexchange between countries of the same language
• Overall, heterozygotes were few, maybe because ofautogamy in the populations sampled or genetic driftresulting from seed production involving tinyquantities of bulbs as progenitors
! Conclusions:Similar studies on a continental scale over Africawould be advisable to better understand the species’svariability
8/11/2019 Using molecular marker technology in studies on plant genetic diversity
http://slidepdf.com/reader/full/using-molecular-marker-technology-in-studies-on-plant-genetic-diversity 81/374
37
Copyright: IPGRI and Cornell University, 2003 Isozymes 37
In summary
! Isozyme technology is based on proteinextraction, separation by gel electrophoresis and
histo-chemical staining! The equipment needed is simple
! The interpretation of banding patterns is typicallycodominant and, because of its complexity, mayrequire genetic analysis
! Isozymes as genetic markers are highlyreproducible
8/11/2019 Using molecular marker technology in studies on plant genetic diversity
http://slidepdf.com/reader/full/using-molecular-marker-technology-in-studies-on-plant-genetic-diversity 82/374
38
Copyright: IPGRI and Cornell University, 2003 Isozymes 38
By now you should know
! Main steps involved in isozyme technology
! Main points for consideration when interpretingbanding patterns
! Advantages and disadvantages of isozymes asgenetic markers for diversity studies
8/11/2019 Using molecular marker technology in studies on plant genetic diversity
http://slidepdf.com/reader/full/using-molecular-marker-technology-in-studies-on-plant-genetic-diversity 83/374
Basic references
Hamrick, J.L. and M.J. Godt. 1989. Allozyme diversity in plant species. Pp. 43-63 inPlant Population Genetics, Breeding, and Genetic Resources (A.H.D. Brown, M.T.Cleg, A.L. Kahler and B.S. Weir, eds.). Sinauer Associates, Sunderland, MA.
Manchenko, G.P. 1994. Handbook of detection of enzymes on electrophoretic gels. CRCPress, Boca Raton, FL.
Murphy, R.W., J.W. Sites, D.G. Buth and C.H. Haufler. 1996. Proteins: isozymeelectrophoresis. Pp. 51-20 in Molecular Systematics (2nd edn.). (D.M. Hillis, C. Moritzand B.K. Mable, eds.). Sinauer Associates, Sunderland, MA.
Soltis, D.E. and P. Soltis (eds.). 1989. Isozymes in plant biology. Dioscorides Press,Portland, OR.
Tanksley, S.D. and T.J. Orton (eds.). 1983. Isozymes in plant genetics and breeding,parts A and B. Elsevier Science, Amsterdam, Netherlands.
39
8/11/2019 Using molecular marker technology in studies on plant genetic diversity
http://slidepdf.com/reader/full/using-molecular-marker-technology-in-studies-on-plant-genetic-diversity 84/374
40
Copyright: IPGRI and Cornell University, 2003 Isozymes 40
Next
DNA-based technologies DNA basics
! DNA-based technologies• Restriction fragment length polymorphisms
(RFLPs)• PCR-based technologies
! Complementary technologies
! Final considerations
! Glossary
8/11/2019 Using molecular marker technology in studies on plant genetic diversity
http://slidepdf.com/reader/full/using-molecular-marker-technology-in-studies-on-plant-genetic-diversity 85/374
Using molecular marker technologyin studies on plant geneticdiversity
III DNA-based technologies
j~áå ãÉåì
8/11/2019 Using molecular marker technology in studies on plant genetic diversity
http://slidepdf.com/reader/full/using-molecular-marker-technology-in-studies-on-plant-genetic-diversity 86/374
Using molecular marker technology instudies on plant genetic diversity
DNA-based technologiesDNA basics
Copyright: IPGRI and Cornell University, 2003 DNA basics 1
8/11/2019 Using molecular marker technology in studies on plant genetic diversity
http://slidepdf.com/reader/full/using-molecular-marker-technology-in-studies-on-plant-genetic-diversity 87/374
Copyright: IPGRI and Cornell University, 2003 DNA basics 2
2
Contents! The DNA molecule:
• Structure and features• Replication
• Squeezing into the chromosome• Sequence organization• Cytoplasmic DNA
! DNA technology• Restriction enzymes• Nucleic acid electrophoresis• DNA polymorphism
! DNA isolation procedures in pictures
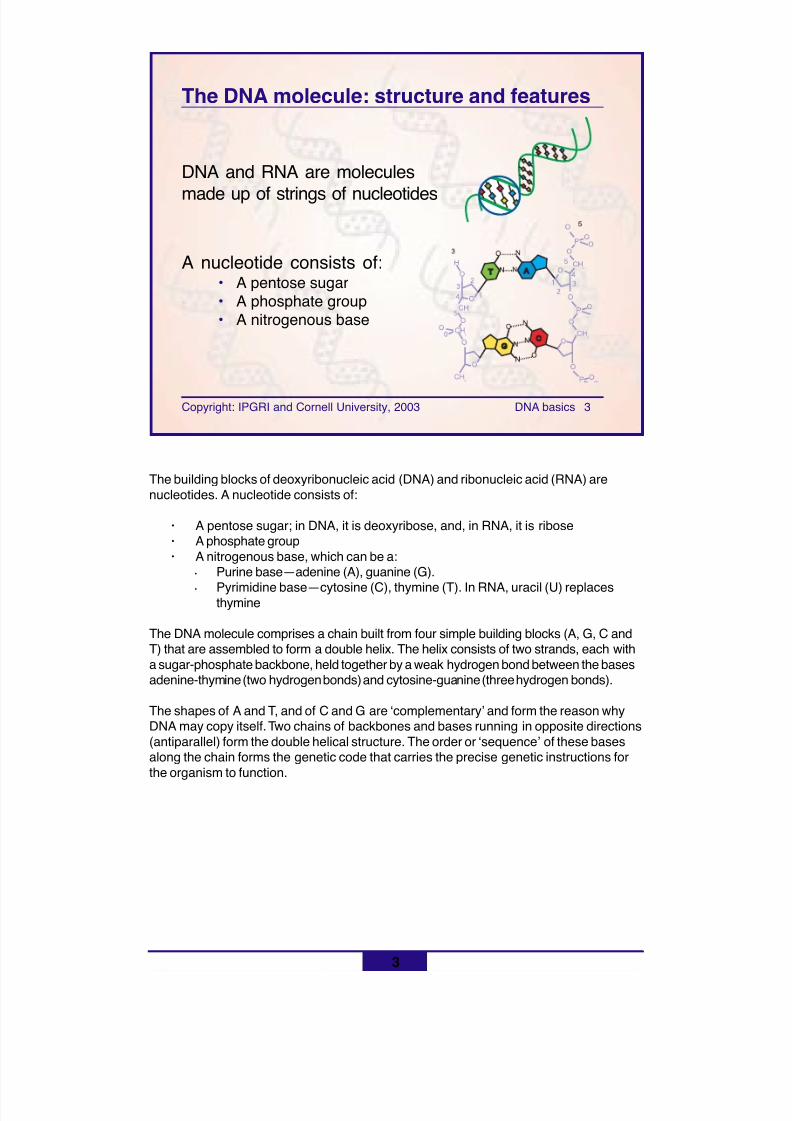
8/11/2019 Using molecular marker technology in studies on plant genetic diversity
http://slidepdf.com/reader/full/using-molecular-marker-technology-in-studies-on-plant-genetic-diversity 88/374
Copyright: IPGRI and Cornell University, 2003 DNA basics 3
3
DNA and RNA are molecules
made up of strings of nucleotides
A nucleotide consists of:• A pentose sugar• A phosphate group• A nitrogenous base
The DNA molecule: structure and features
The building blocks of deoxyribonucleic acid (DNA) and ribonucleic acid (RNA) arenucleotides. A nucleotide consists of:
· A pentose sugar; in DNA, it is deoxyribose, and, in RNA, it is ribose· A phosphate group· A nitrogenous base, which can be a:
• Purine base—adenine (A), guanine (G).• Pyrimidine base—cytosine (C), thymine (T). In RNA, uracil (U) replaces
thymine
The DNA molecule comprises a chain built from four simple building blocks (A, G, C andT) that are assembled to form a double helix. The helix consists of two strands, each witha sugar-phosphate backbone, held together by a weak hydrogen bond between the basesadenine-thymine (two hydrogen bonds) and cytosine-guanine (three hydrogen bonds).
The shapes of A and T, and of C and G are ‘complementary’ and form the reason whyDNA may copy itself. Two chains of backbones and bases running in opposite directions(antiparallel) form the double helical structure. The order or ‘sequence’ of these basesalong the chain forms the genetic code that carries the precise genetic instructions forthe organism to function.
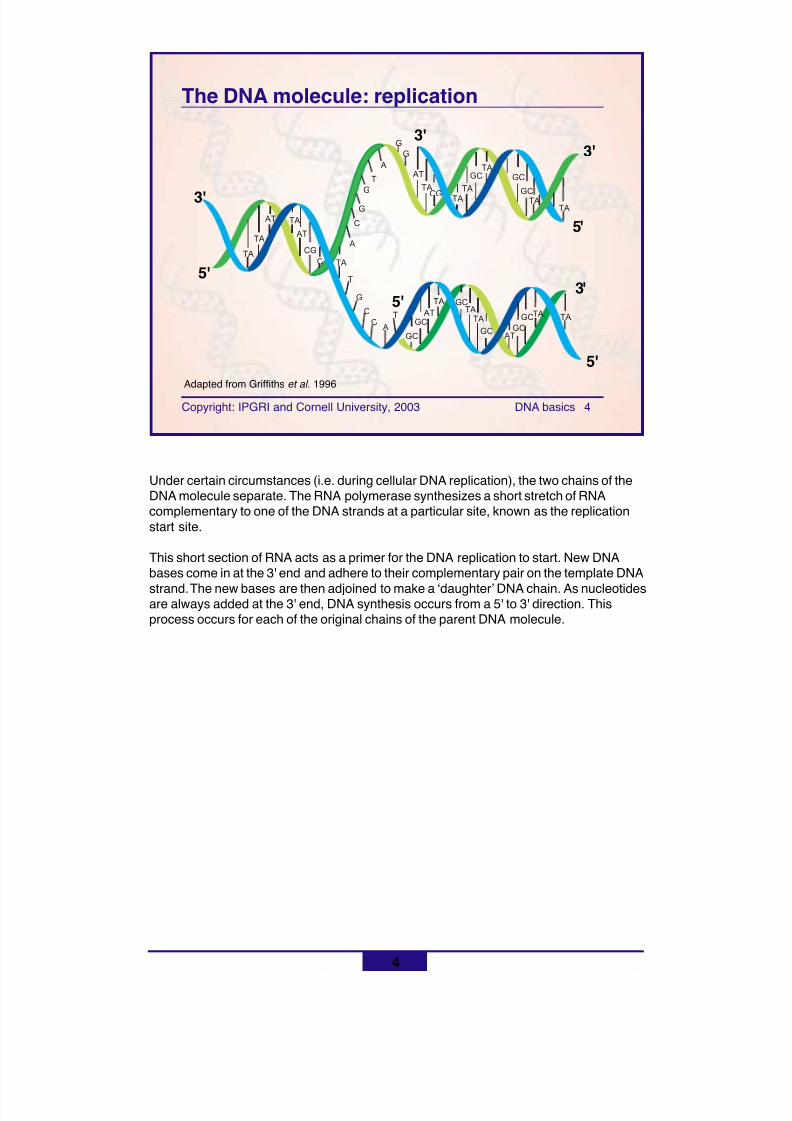
8/11/2019 Using molecular marker technology in studies on plant genetic diversity
http://slidepdf.com/reader/full/using-molecular-marker-technology-in-studies-on-plant-genetic-diversity 89/374
Copyright: IPGRI and Cornell University, 2003 DNA basics 4
4
The DNA molecule: replication
Under certain circumstances (i.e. during cellular DNA replication), the two chains of theDNA molecule separate. The RNA polymerase synthesizes a short stretch of RNAcomplementary to one of the DNA strands at a particular site, known as the replicationstart site.
This short section of RNA acts as a primer for the DNA replication to start. New DNAbases come in at the 3' end and adhere to their complementary pair on the template DNA
strand. The new bases are then adjoined to make a ‘daughter’ DNA chain. As nucleotidesare always added at the 3' end, DNA synthesis occurs from a 5' to 3' direction. Thisprocess occurs for each of the original chains of the parent DNA molecule.
A
A
A
TA
T
T
G
G
G
C
C
C
T
AT
TA
CG
TA
GCTA
TA
GC
GCTA
TAGC
GC AT
GC
TATA
GCTA
ATGC
GC
C
CG
AT
TA AT
TA
TA
G
G
TA
TA
3'
3'3'
5'
5'5'
5'
3'
Adapted from Griffiths et al. 1996
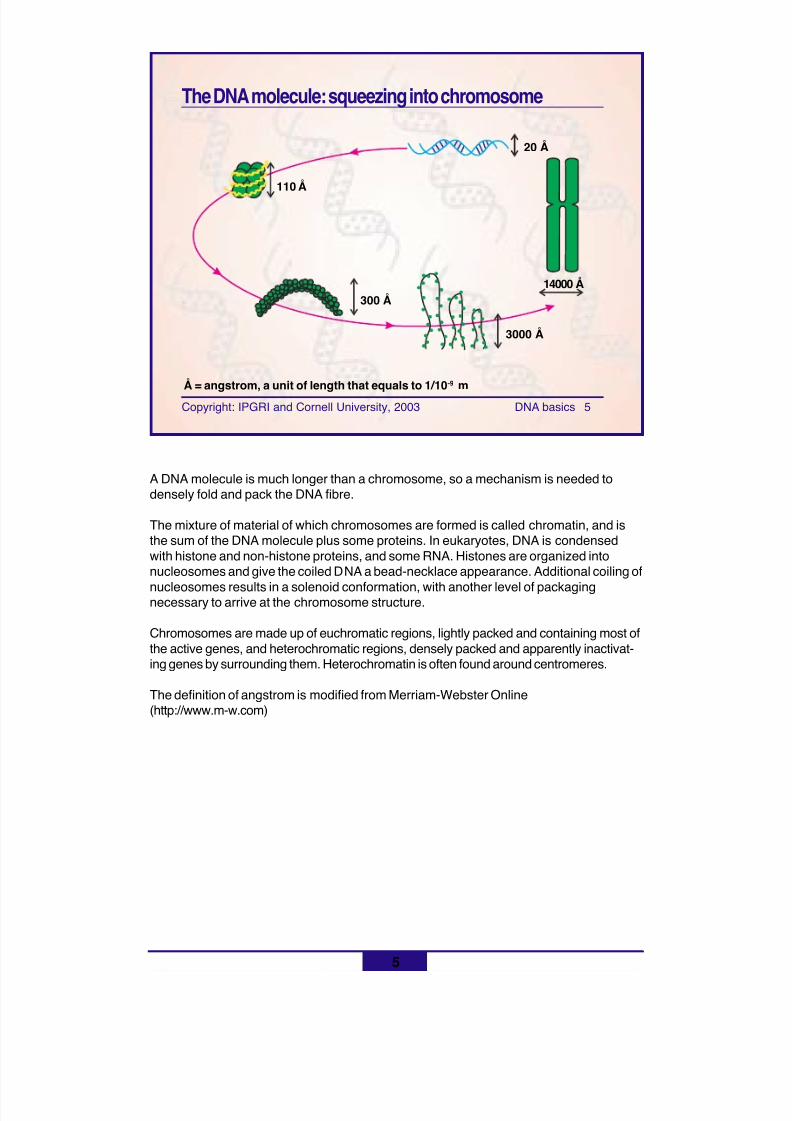
8/11/2019 Using molecular marker technology in studies on plant genetic diversity
http://slidepdf.com/reader/full/using-molecular-marker-technology-in-studies-on-plant-genetic-diversity 90/374
Copyright: IPGRI and Cornell University, 2003 DNA basics 5
5
The DNA molecule: squeezing into chromosome
A DNA molecule is much longer than a chromosome, so a mechanism is needed todensely fold and pack the DNA fibre.
The mixture of material of which chromosomes are formed is called chromatin, and isthe sum of the DNA molecule plus some proteins. In eukaryotes, DNA is condensedwith histone and non-histone proteins, and some RNA. Histones are organized intonucleosomes and give the coiled DNA a bead-necklace appearance. Additional coiling of
nucleosomes results in a solenoid conformation, with another level of packagingnecessary to arrive at the chromosome structure.
Chromosomes are made up of euchromatic regions, lightly packed and containing most ofthe active genes, and heterochromatic regions, densely packed and apparently inactivat-ing genes by surrounding them. Heterochromatin is often found around centromeres.
The definition of angstrom is modified from Merriam-Webster Online(http://www.m-w.com)
Å = angstrom, a unit of length that equals to 1/10-9 m
110 Å
300 Å
3000 Å
14000 Å
20 Å
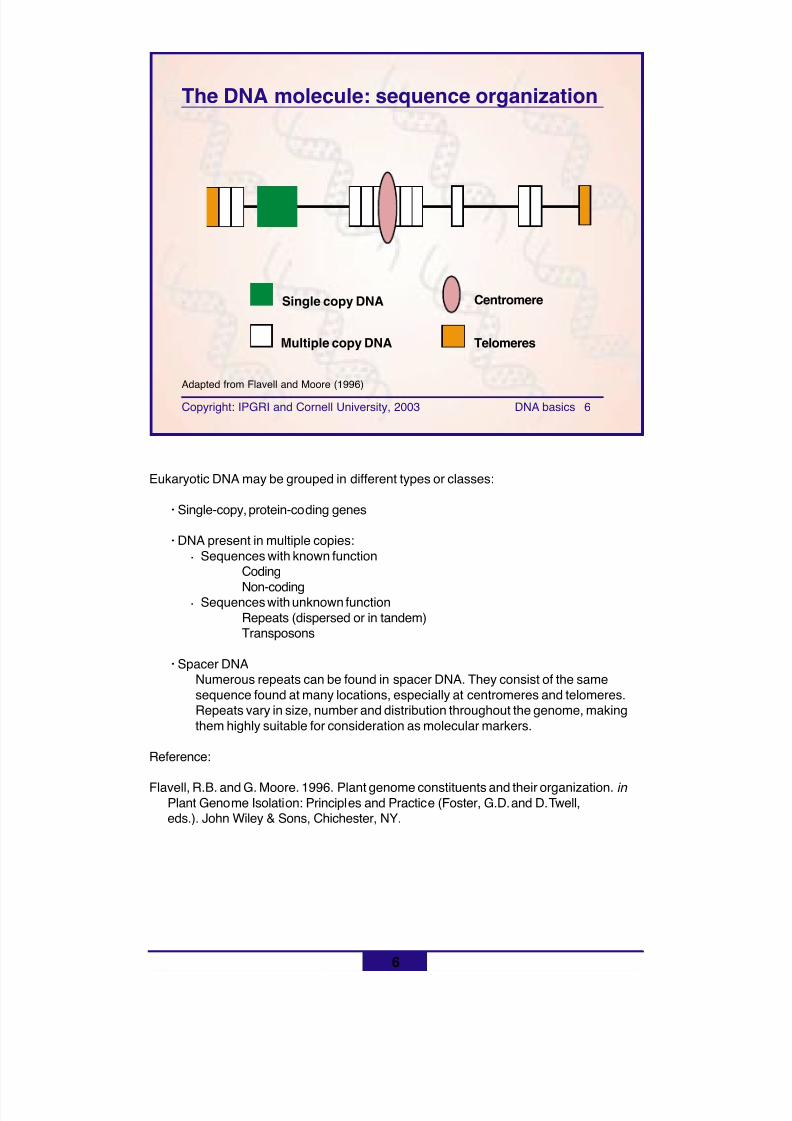
8/11/2019 Using molecular marker technology in studies on plant genetic diversity
http://slidepdf.com/reader/full/using-molecular-marker-technology-in-studies-on-plant-genetic-diversity 91/374
Copyright: IPGRI and Cornell University, 2003 DNA basics 6
6
The DNA molecule: sequence organization
Eukaryotic DNA may be grouped in different types or classes:
· Single-copy, protein-coding genes
· DNA present in multiple copies:• Sequences with known function
Coding
Non-coding• Sequences with unknown function
Repeats (dispersed or in tandem)Transposons
· Spacer DNANumerous repeats can be found in spacer DNA. They consist of the samesequence found at many locations, especially at centromeres and telomeres.Repeats vary in size, number and distribution throughout the genome, makingthem highly suitable for consideration as molecular markers.
Reference:
Flavell, R.B. and G. Moore. 1996. Plant genome constituents and their organization. in Plant Genome Isolation: Principles and Practice (Foster, G.D. and D. Twell,eds.). John Wiley & Sons, Chichester, NY.
Single copy DNA
Multiple copy DNA
Centromere
Telomeres
Adapted from Flavell and Moore (1996)
8/11/2019 Using molecular marker technology in studies on plant genetic diversity
http://slidepdf.com/reader/full/using-molecular-marker-technology-in-studies-on-plant-genetic-diversity 92/374
Copyright: IPGRI and Cornell University, 2003 DNA basics 7
7
The DNA molecule: cytoplasmatic DNA
! Cytoplasmic DNA• Chloroplast DNA (cpDNA)• Mitochondrial DNA (mtDNA)
! Features:• Maternal inheritance• Differing rates of evolution (gene order vs.
nucleotide sequence)• Slow accumulation of mutations
Smaller amounts of DNA are found in the cytoplasm outside the nucleus—in thechloroplasts (cpDNA) and mitochondria (mtDNA). Chloroplasts and mitochondria eachhave their own unique ‘chromosome’, with several copies. These genes also code for theirown translation and transcription of organellar components, and play highly specializedroles in the expression of the phenotype of the organism to which they belong.
Organellar DNA is commonly, but not always, inherited only through the maternal parent,
a pattern known as maternal inheritance.
The DNA sequences of cpDNA and mtDNA have their own peculiarities. Plant mtDNAappears to evolve rapidly with respect to gene order, but slowly in nucleotide sequence.Why the accumulation of mutations is slow is not properly understood, but may be a resultof the presence of either a highly efficient DNA damage repair mechanism or a relativelyerror-free DNA replication system. Conversely, the rate of cpDNA evolution usuallyappears slow, in terms of both primary nucleotide sequence and gene rearrangement.
8/11/2019 Using molecular marker technology in studies on plant genetic diversity
http://slidepdf.com/reader/full/using-molecular-marker-technology-in-studies-on-plant-genetic-diversity 93/374
Copyright: IPGRI and Cornell University, 2003 DNA basics 8
8
DNA technology
DNA technology involves the concepts of:
! Restriction enzymes
! Nucleic acid electrophoresis
! DNA polymorphism
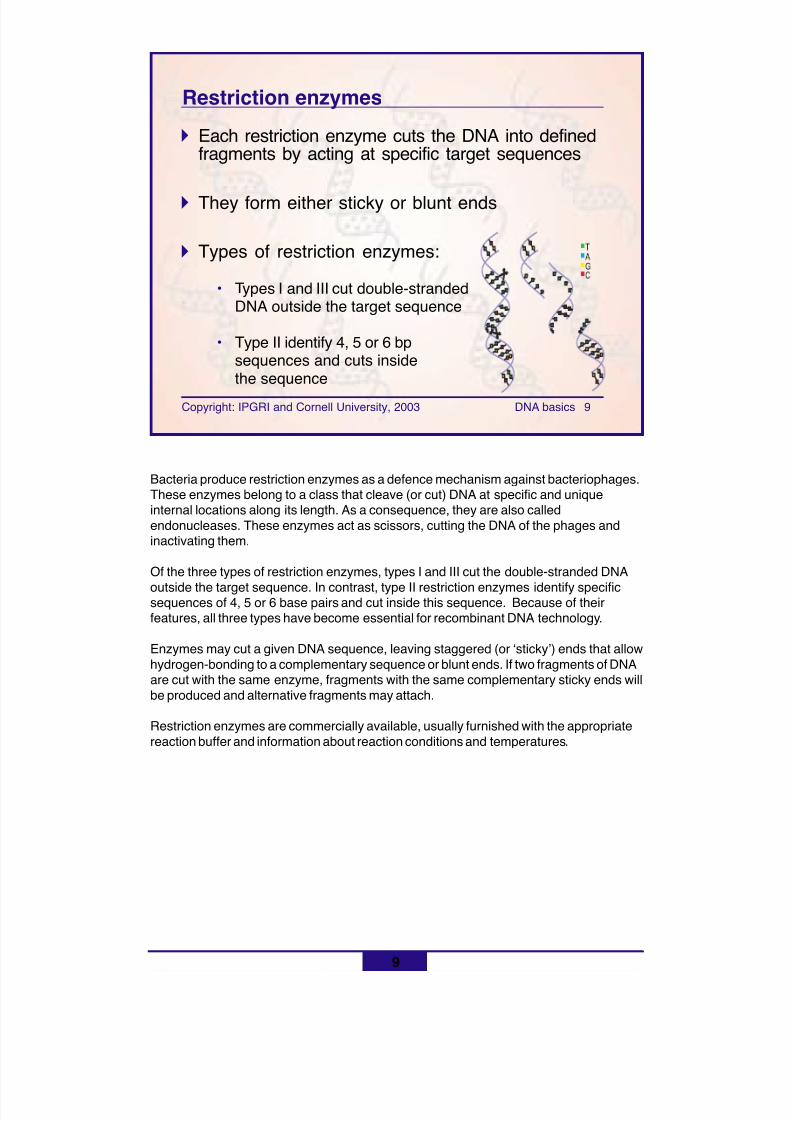
8/11/2019 Using molecular marker technology in studies on plant genetic diversity
http://slidepdf.com/reader/full/using-molecular-marker-technology-in-studies-on-plant-genetic-diversity 94/374
Copyright: IPGRI and Cornell University, 2003 DNA basics 9
9
Restriction enzymes! Each restriction enzyme cuts the DNA into defined
fragments by acting at specific target sequences
! They form either sticky or blunt ends
! Types of restriction enzymes:
• Types I and III cut double-strandedDNA outside the target sequence
• Type II identify 4, 5 or 6 bpsequences and cuts insidethe sequence
Bacteria produce restriction enzymes as a defence mechanism against bacteriophages.These enzymes belong to a class that cleave (or cut) DNA at specific and uniqueinternal locations along its length. As a consequence, they are also calledendonucleases. These enzymes act as scissors, cutting the DNA of the phages andinactivating them.
Of the three types of restriction enzymes, types I and III cut the double-stranded DNA
outside the target sequence. In contrast, type II restriction enzymes identify specificsequences of 4, 5 or 6 base pairs and cut inside this sequence. Because of theirfeatures, all three types have become essential for recombinant DNA technology.
Enzymes may cut a given DNA sequence, leaving staggered (or ‘sticky’) ends that allowhydrogen-bonding to a complementary sequence or blunt ends. If two fragments of DNAare cut with the same enzyme, fragments with the same complementary sticky ends willbe produced and alternative fragments may attach.
Restriction enzymes are commercially available, usually furnished with the appropriatereaction buffer and information about reaction conditions and temperatures.
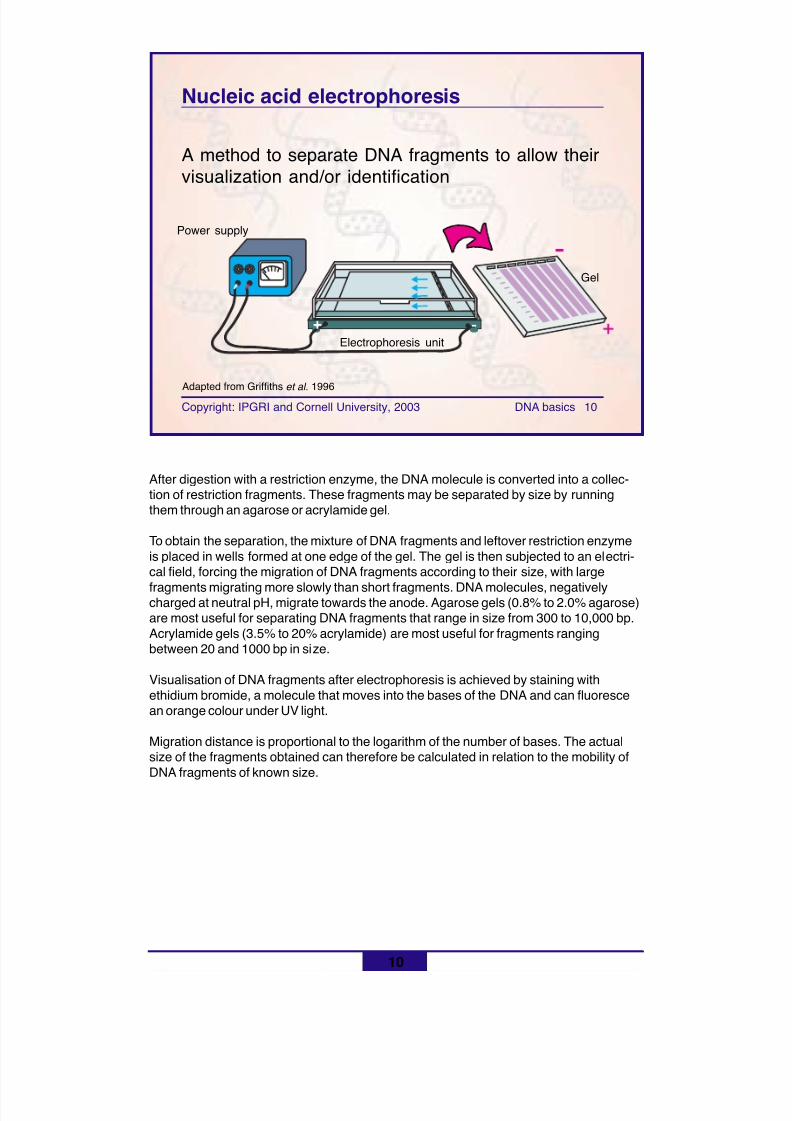
8/11/2019 Using molecular marker technology in studies on plant genetic diversity
http://slidepdf.com/reader/full/using-molecular-marker-technology-in-studies-on-plant-genetic-diversity 95/374
Copyright: IPGRI and Cornell University, 2003 DNA basics 10
10
Nucleic acid electrophoresis
A method to separate DNA fragments to allow theirvisualization and/or identification
After digestion with a restriction enzyme, the DNA molecule is converted into a collec-tion of restriction fragments. These fragments may be separated by size by runningthem through an agarose or acrylamide gel.
To obtain the separation, the mixture of DNA fragments and leftover restriction enzymeis placed in wells formed at one edge of the gel. The gel is then subjected to an electri-cal field, forcing the migration of DNA fragments according to their size, with large
fragments migrating more slowly than short fragments. DNA molecules, negativelycharged at neutral pH, migrate towards the anode. Agarose gels (0.8% to 2.0% agarose)are most useful for separating DNA fragments that range in size from 300 to 10,000 bp.Acrylamide gels (3.5% to 20% acrylamide) are most useful for fragments rangingbetween 20 and 1000 bp in size.
Visualisation of DNA fragments after electrophoresis is achieved by staining withethidium bromide, a molecule that moves into the bases of the DNA and can fluorescean orange colour under UV light.
Migration distance is proportional to the logarithm of the number of bases. The actualsize of the fragments obtained can therefore be calculated in relation to the mobility ofDNA fragments of known size.
Power supply
Gel
Electrophoresis unit
Adapted from Griffiths et al. 1996
8/11/2019 Using molecular marker technology in studies on plant genetic diversity
http://slidepdf.com/reader/full/using-molecular-marker-technology-in-studies-on-plant-genetic-diversity 96/374
Copyright: IPGRI and Cornell University, 2003 DNA basics 11
11
DNA polymorphism! Various events may give rise to variants, more or
less complex, in the DNA sequence. Suchvariants are usually described as polymorphisms
! Polymorphism is translated into differences ingenotype—as evidenced in diverse bandprofiles when detected with an appropriateprocedure—and perhaps phenotype
! Several events can produce polymorphisms:• Point mutations• Insertions or deletions• Rearrangements
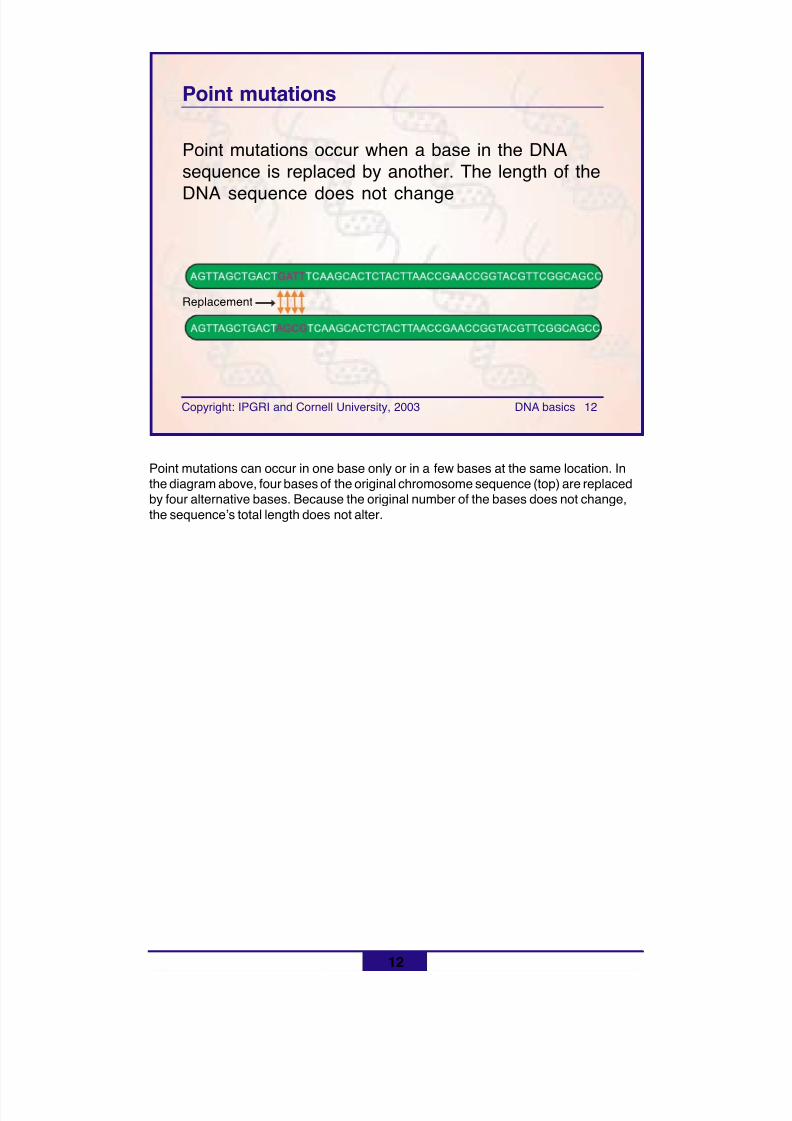
8/11/2019 Using molecular marker technology in studies on plant genetic diversity
http://slidepdf.com/reader/full/using-molecular-marker-technology-in-studies-on-plant-genetic-diversity 97/374
Copyright: IPGRI and Cornell University, 2003 DNA basics 12
12
Point mutations
Point mutations occur when a base in the DNAsequence is replaced by another. The length of the
DNA sequence does not change
Replacement
Point mutations can occur in one base only or in a few bases at the same location. Inthe diagram above, four bases of the original chromosome sequence (top) are replacedby four alternative bases. Because the original number of the bases does not change,the sequence’s total length does not alter.
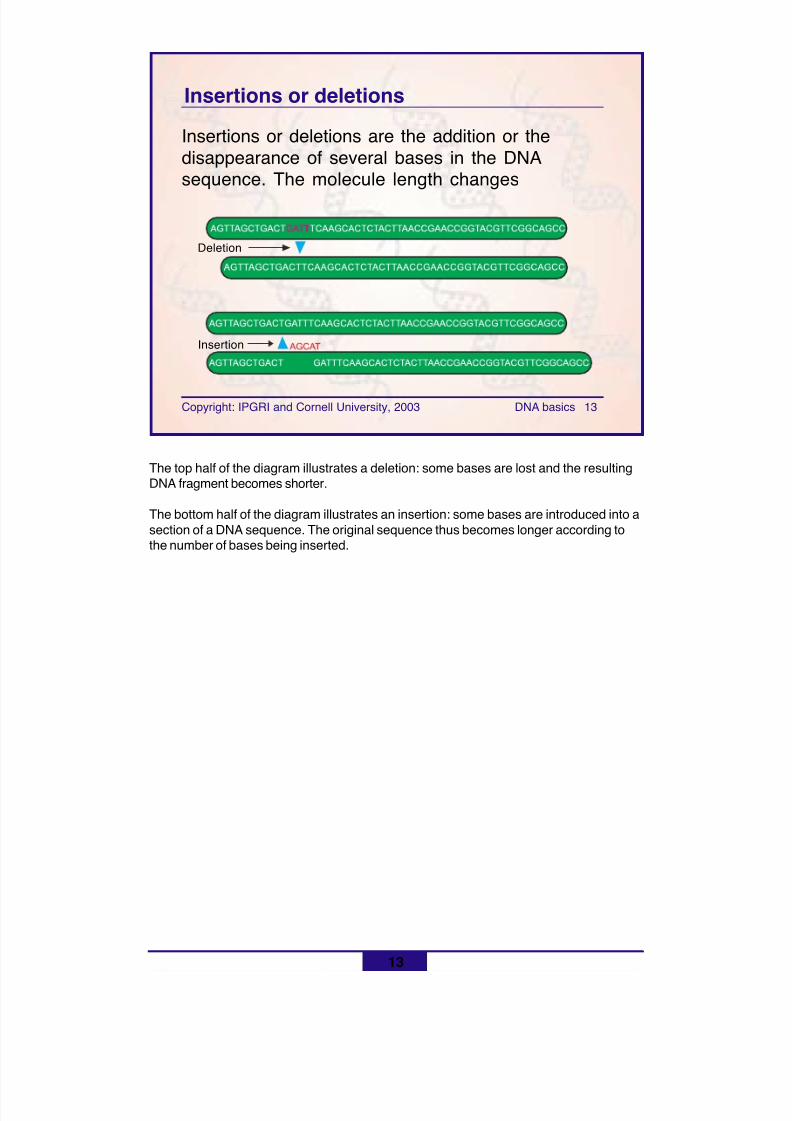
8/11/2019 Using molecular marker technology in studies on plant genetic diversity
http://slidepdf.com/reader/full/using-molecular-marker-technology-in-studies-on-plant-genetic-diversity 98/374
Copyright: IPGRI and Cornell University, 2003 DNA basics 13
13
Insertions or deletions are the addition or thedisappearance of several bases in the DNAsequence. The molecule length changes
Insertions or deletions
Deletion
Insertion
The top half of the diagram illustrates a deletion: some bases are lost and the resultingDNA fragment becomes shorter.
The bottom half of the diagram illustrates an insertion: some bases are introduced into asection of a DNA sequence. The original sequence thus becomes longer according tothe number of bases being inserted.
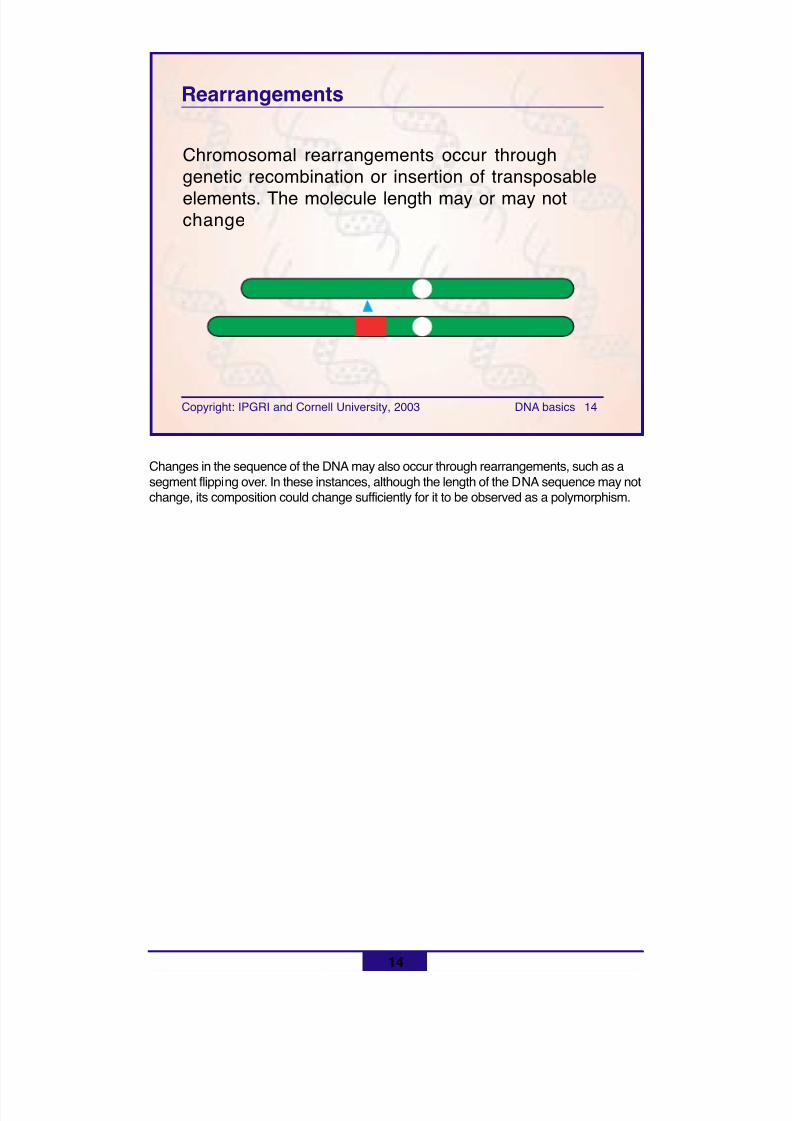
8/11/2019 Using molecular marker technology in studies on plant genetic diversity
http://slidepdf.com/reader/full/using-molecular-marker-technology-in-studies-on-plant-genetic-diversity 99/374
Copyright: IPGRI and Cornell University, 2003 DNA basics 14
14
Rearrangements
Chromosomal rearrangements occur throughgenetic recombination or insertion of transposableelements. The molecule length may or may notchange
Changes in the sequence of the DNA may also occur through rearrangements, such as asegment flipping over. In these instances, although the length of the DNA sequence may notchange, its composition could change sufficiently for it to be observed as a polymorphism.
8/11/2019 Using molecular marker technology in studies on plant genetic diversity
http://slidepdf.com/reader/full/using-molecular-marker-technology-in-studies-on-plant-genetic-diversity 100/374
Copyright: IPGRI and Cornell University, 2003 DNA basics 15
15
DNA isolation procedure in pictures
The following photographs illustrate various stepsof the procedures for isolating DNA
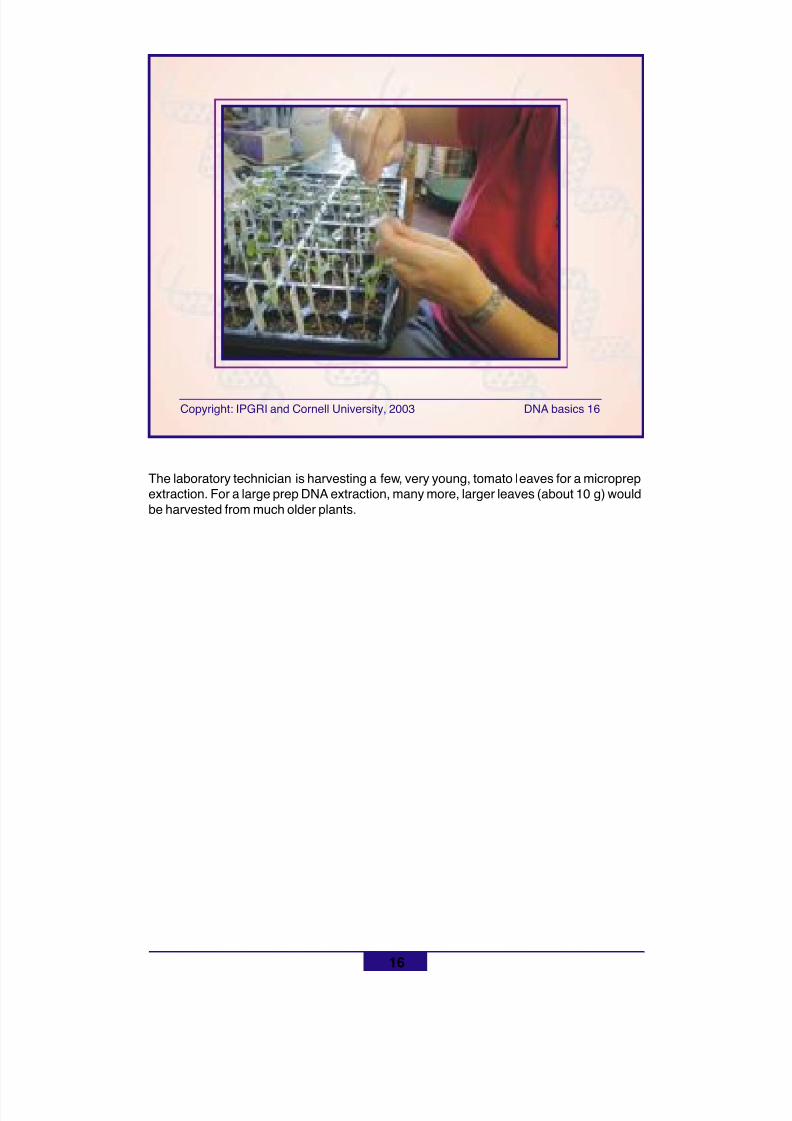
8/11/2019 Using molecular marker technology in studies on plant genetic diversity
http://slidepdf.com/reader/full/using-molecular-marker-technology-in-studies-on-plant-genetic-diversity 101/374
Copyright: IPGRI and Cornell University, 2003 DNA basics 16
16
The laboratory technician is harvesting a few, very young, tomato leaves for a microprepextraction. For a large prep DNA extraction, many more, larger leaves (about 10 g) wouldbe harvested from much older plants.
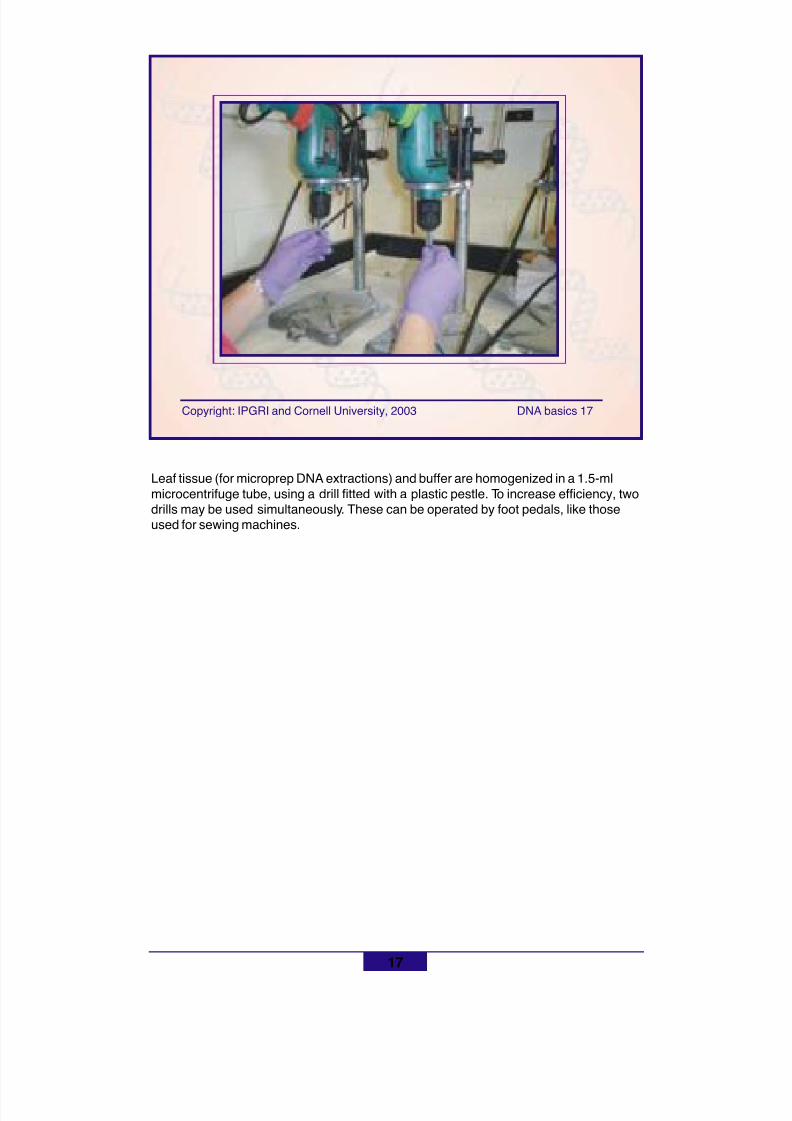
8/11/2019 Using molecular marker technology in studies on plant genetic diversity
http://slidepdf.com/reader/full/using-molecular-marker-technology-in-studies-on-plant-genetic-diversity 102/374
Copyright: IPGRI and Cornell University, 2003 DNA basics 17
17
Leaf tissue (for microprep DNA extractions) and buffer are homogenized in a 1.5-mlmicrocentrifuge tube, using a drill fitted with a plastic pestle. To increase efficiency, twodrills may be used simultaneously. These can be operated by foot pedals, like thoseused for sewing machines.
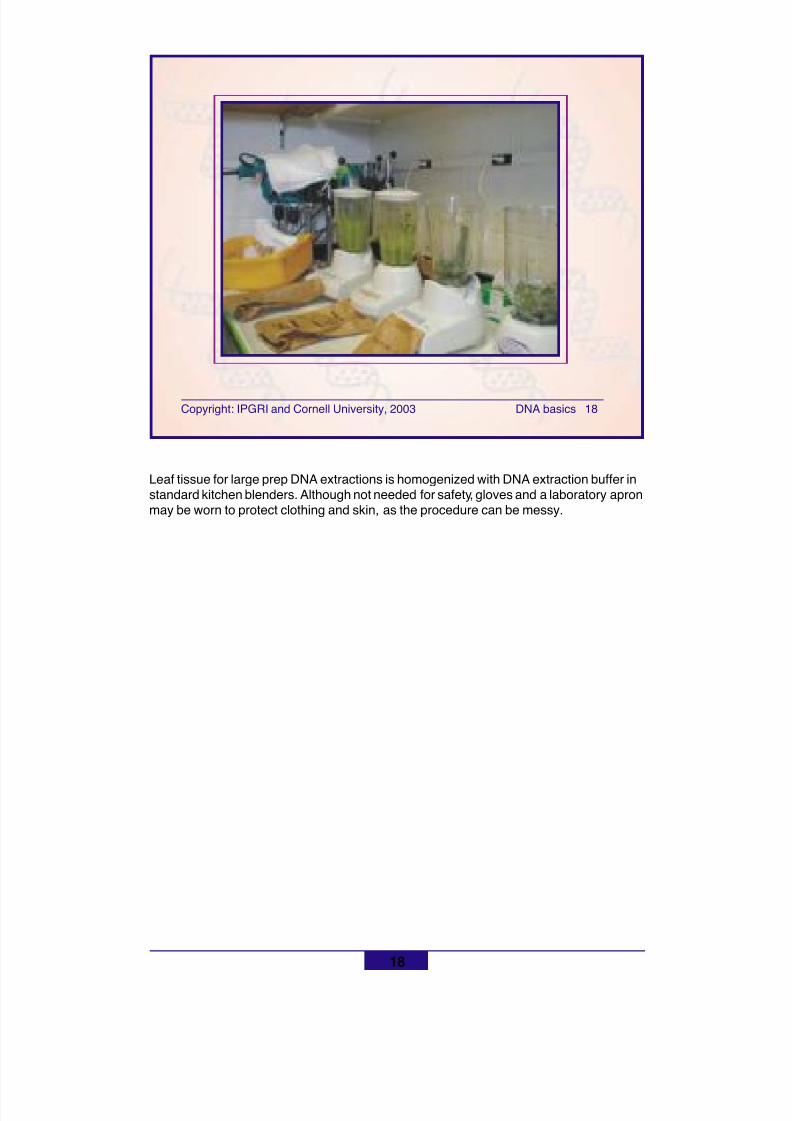
8/11/2019 Using molecular marker technology in studies on plant genetic diversity
http://slidepdf.com/reader/full/using-molecular-marker-technology-in-studies-on-plant-genetic-diversity 103/374
Copyright: IPGRI and Cornell University, 2003 DNA basics 18
18
Leaf tissue for large prep DNA extractions is homogenized with DNA extraction buffer instandard kitchen blenders. Although not needed for safety, gloves and a laboratory apronmay be worn to protect clothing and skin, as the procedure can be messy.
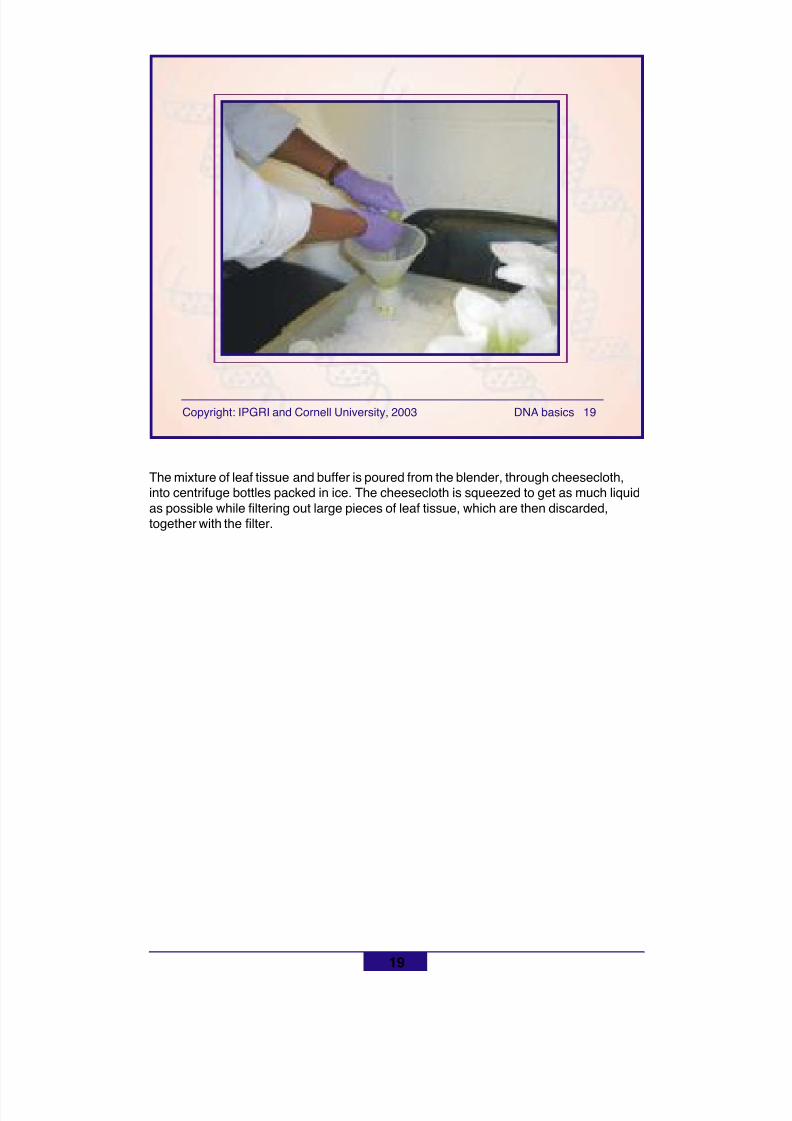
8/11/2019 Using molecular marker technology in studies on plant genetic diversity
http://slidepdf.com/reader/full/using-molecular-marker-technology-in-studies-on-plant-genetic-diversity 104/374
Copyright: IPGRI and Cornell University, 2003 DNA basics 19
19
The mixture of leaf tissue and buffer is poured from the blender, through cheesecloth,into centrifuge bottles packed in ice. The cheesecloth is squeezed to get as much liquidas possible while filtering out large pieces of leaf tissue, which are then discarded,together with the filter.
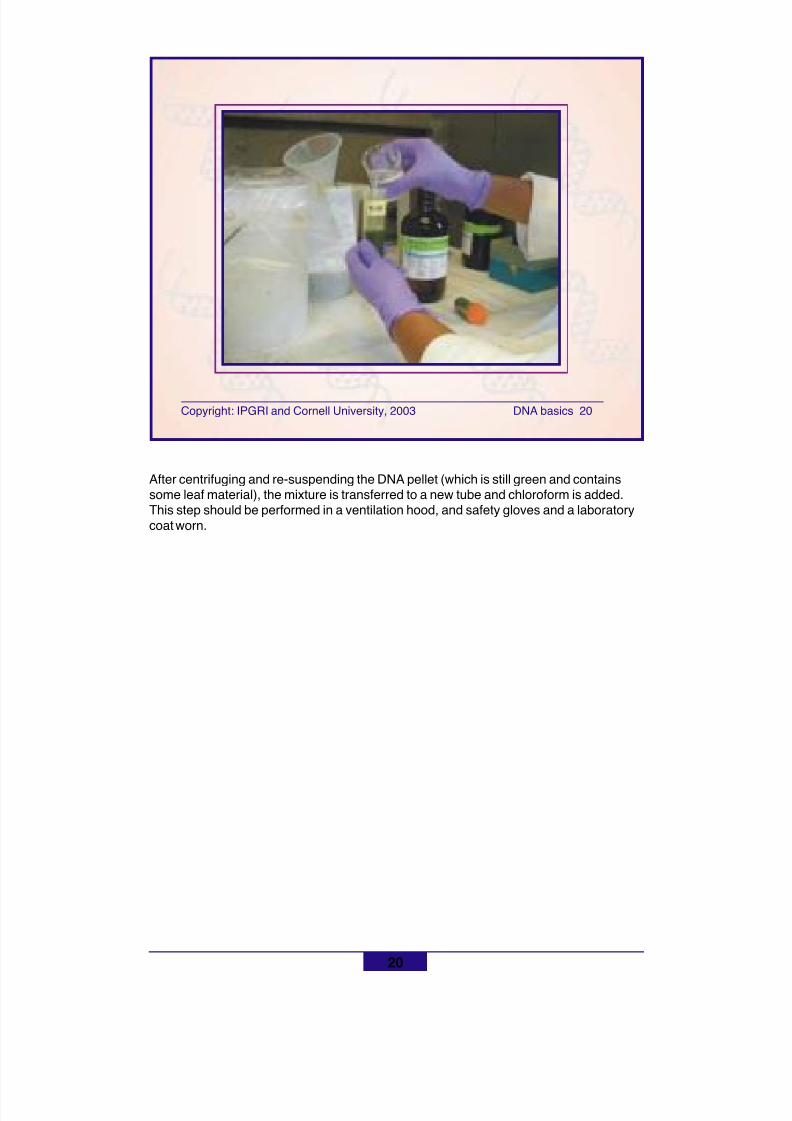
8/11/2019 Using molecular marker technology in studies on plant genetic diversity
http://slidepdf.com/reader/full/using-molecular-marker-technology-in-studies-on-plant-genetic-diversity 105/374
Copyright: IPGRI and Cornell University, 2003 DNA basics 20
20
After centrifuging and re-suspending the DNA pellet (which is still green and containssome leaf material), the mixture is transferred to a new tube and chloroform is added.This step should be performed in a ventilation hood, and safety gloves and a laboratorycoat worn.
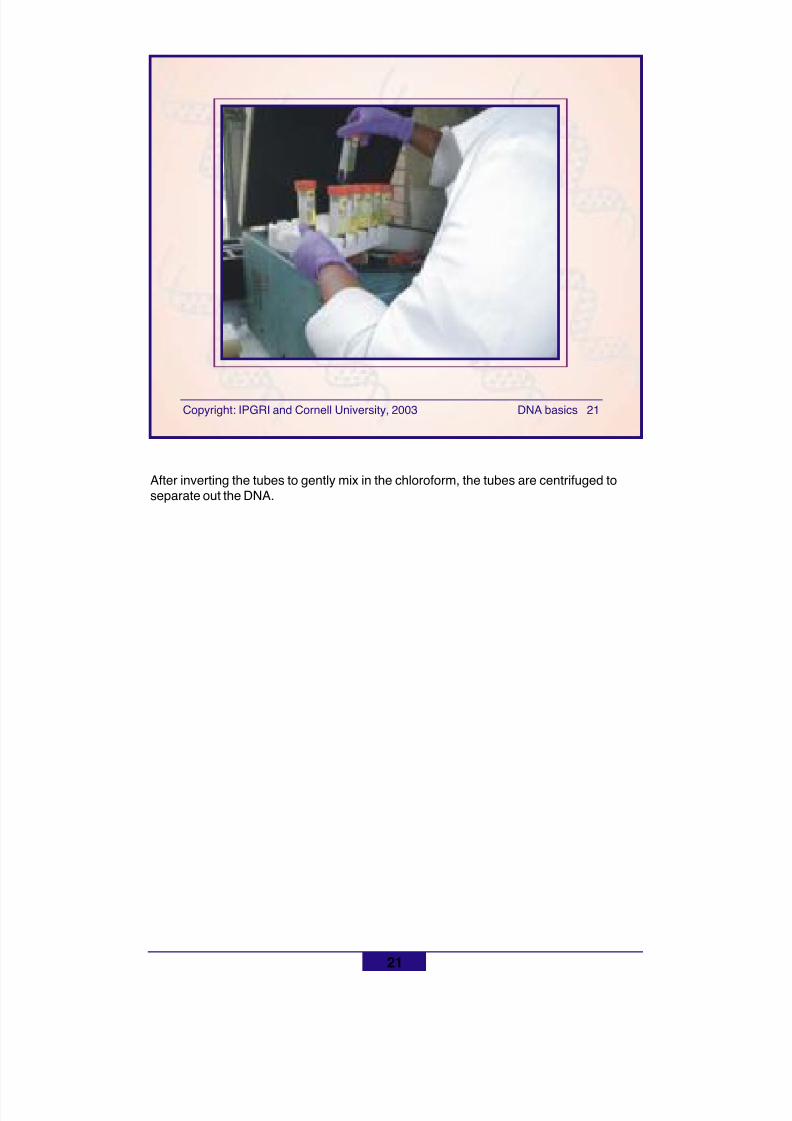
8/11/2019 Using molecular marker technology in studies on plant genetic diversity
http://slidepdf.com/reader/full/using-molecular-marker-technology-in-studies-on-plant-genetic-diversity 106/374
Copyright: IPGRI and Cornell University, 2003 DNA basics 21
21
After inverting the tubes to gently mix in the chloroform, the tubes are centrifuged toseparate out the DNA.
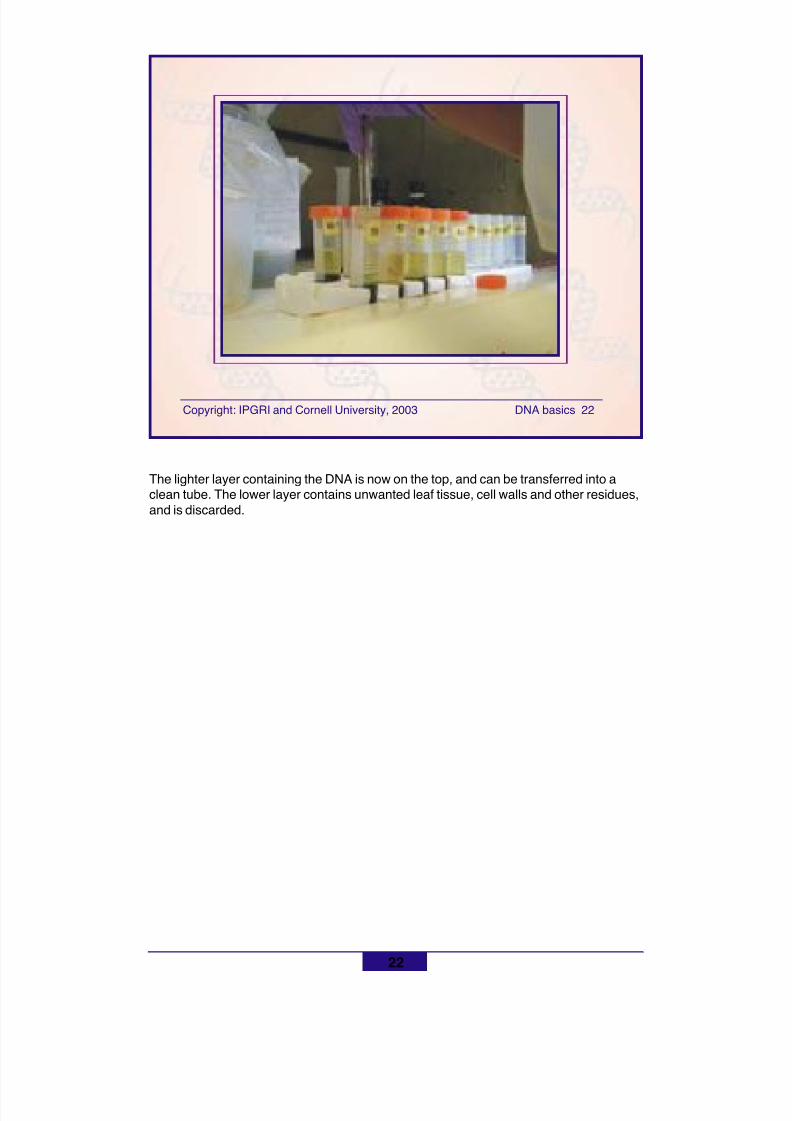
8/11/2019 Using molecular marker technology in studies on plant genetic diversity
http://slidepdf.com/reader/full/using-molecular-marker-technology-in-studies-on-plant-genetic-diversity 107/374
Copyright: IPGRI and Cornell University, 2003 DNA basics 22
22
The lighter layer containing the DNA is now on the top, and can be transferred into aclean tube. The lower layer contains unwanted leaf tissue, cell walls and other residues,and is discarded.
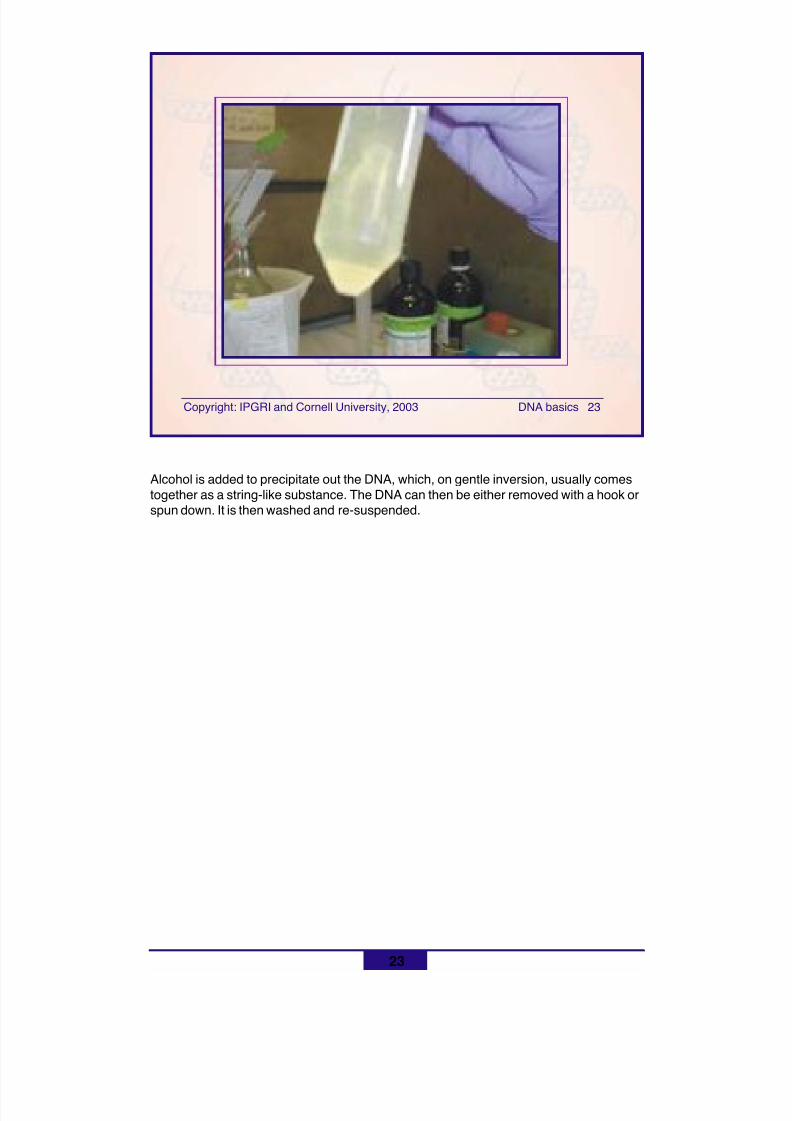
8/11/2019 Using molecular marker technology in studies on plant genetic diversity
http://slidepdf.com/reader/full/using-molecular-marker-technology-in-studies-on-plant-genetic-diversity 108/374
Copyright: IPGRI and Cornell University, 2003 DNA basics 23
23
Alcohol is added to precipitate out the DNA, which, on gentle inversion, usually comestogether as a string-like substance. The DNA can then be either removed with a hook orspun down. It is then washed and re-suspended.
8/11/2019 Using molecular marker technology in studies on plant genetic diversity
http://slidepdf.com/reader/full/using-molecular-marker-technology-in-studies-on-plant-genetic-diversity 109/374
Copyright: IPGRI and Cornell University, 2003 DNA basics 24
24
In summary! The bricks of DNA are nucleotides, assembled in
a double helix to form the DNA chain
! The DNA molecule becomes increasingly morefolded as the nucleotide sequence forms thechromosome
! DNA is organized in different classes: singlecopy, multiple copy and spacer
! Mitochondria and chloroplasts have their ownDNA molecule
! Several events give rise to polymorphisms in theDNA molecule: point mutations, insertions,deletions and rearrangements
8/11/2019 Using molecular marker technology in studies on plant genetic diversity
http://slidepdf.com/reader/full/using-molecular-marker-technology-in-studies-on-plant-genetic-diversity 110/374
Copyright: IPGRI and Cornell University, 2003 DNA basics 25
25
By now you should know
! The components of a nucleotide
! How nucleotides form the DNA double helix
! The different classes of DNA
! The main features of cytoplasmic DNA
! What a restriction enzyme is
! How polymorphisms in the DNA chain are produced

8/11/2019 Using molecular marker technology in studies on plant genetic diversity
http://slidepdf.com/reader/full/using-molecular-marker-technology-in-studies-on-plant-genetic-diversity 111/374
Basic references
Griffiths, A.J.F., J.H. Miller, D.T. Suzuki, R.C. Lewontin and W.M. Gelbart. 1996. Anintroduction to genetic analysis (6th edn.). W.H. Freeman and Co., NY.
Lewin, B. 1994. Genes V. Oxford University Press.
Schleif, R. 1993. Genetics and molecular biology (2nd edn.). Johns Hopkins UniversityPress, Baltimore, MD.
Singer, M. and P. Berg. 1991. Genes and genomes. University Science Books, MillValley, CA.
Watson, J.D., N.H. Hopkins, J.W. Roberts, J.A. Steitz and A.M. Weiner. 1987.Molecular biology of the gene (4th edn.), vol. I: General principles. Benjamin/ Cummings Publishing, Menlo Park, CA.
26
8/11/2019 Using molecular marker technology in studies on plant genetic diversity
http://slidepdf.com/reader/full/using-molecular-marker-technology-in-studies-on-plant-genetic-diversity 112/374
Copyright: IPGRI and Cornell University, 2003 DNA basics 27
27
Next
DNA-based technologiesRestriction fragment length polymorphisms
(RFLPs)
! DNA-based technologies• PCR-based technologies
! Complementary technologies
! Final considerations
! Glossary
8/11/2019 Using molecular marker technology in studies on plant genetic diversity
http://slidepdf.com/reader/full/using-molecular-marker-technology-in-studies-on-plant-genetic-diversity 113/374
Using molecular marker technology instudies on plant genetic diversity
DNA-based technologiesRestriction fragment length
polymorphisms
Copyright: IPGRI and Cornell University, 2003 RFLPs 1
8/11/2019 Using molecular marker technology in studies on plant genetic diversity
http://slidepdf.com/reader/full/using-molecular-marker-technology-in-studies-on-plant-genetic-diversity 114/374
2
Copyright: IPGRI and Cornell University, 2003 RFLPs 2
Contents! RFLP technology
• Isolating DNA• Restriction digestion and gel electrophoresis• DNA transfer by Southern blotting• DNA hybridisation• Equipment
! RFLP technology in pictures! Interpreting RFLP bands! Advantages and disadvantages of RFLPs! Applications
• Maize• Wheat• Scots pine
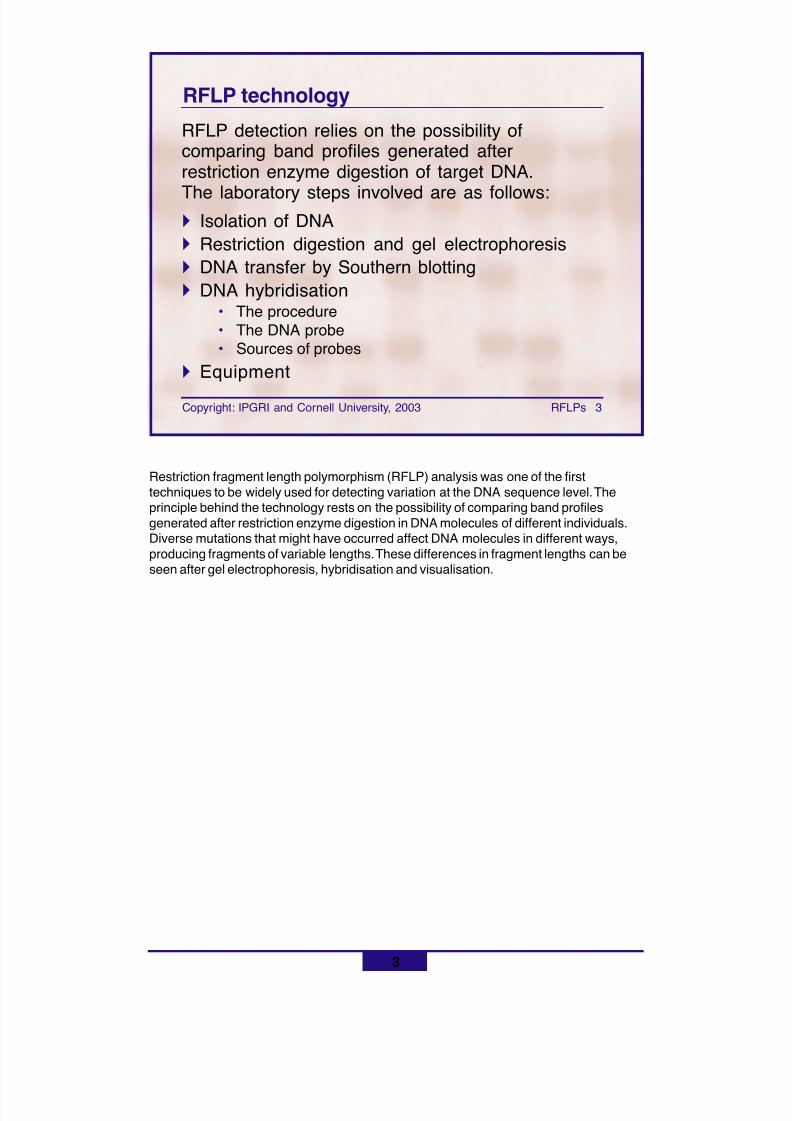
8/11/2019 Using molecular marker technology in studies on plant genetic diversity
http://slidepdf.com/reader/full/using-molecular-marker-technology-in-studies-on-plant-genetic-diversity 115/374
3
Copyright: IPGRI and Cornell University, 2003 RFLPs 3
RFLP detection relies on the possibility ofcomparing band profiles generated afterrestriction enzyme digestion of target DNA.
The laboratory steps involved are as follows:! Isolation of DNA! Restriction digestion and gel electrophoresis! DNA transfer by Southern blotting! DNA hybridisation
• The procedure• The DNA probe• Sources of probes
! Equipment
RFLP technology
Restriction fragment length polymorphism (RFLP) analysis was one of the firsttechniques to be widely used for detecting variation at the DNA sequence level. Theprinciple behind the technology rests on the possibility of comparing band profilesgenerated after restriction enzyme digestion in DNA molecules of different individuals.Diverse mutations that might have occurred affect DNA molecules in different ways,producing fragments of variable lengths. These differences in fragment lengths can beseen after gel electrophoresis, hybridisation and visualisation.
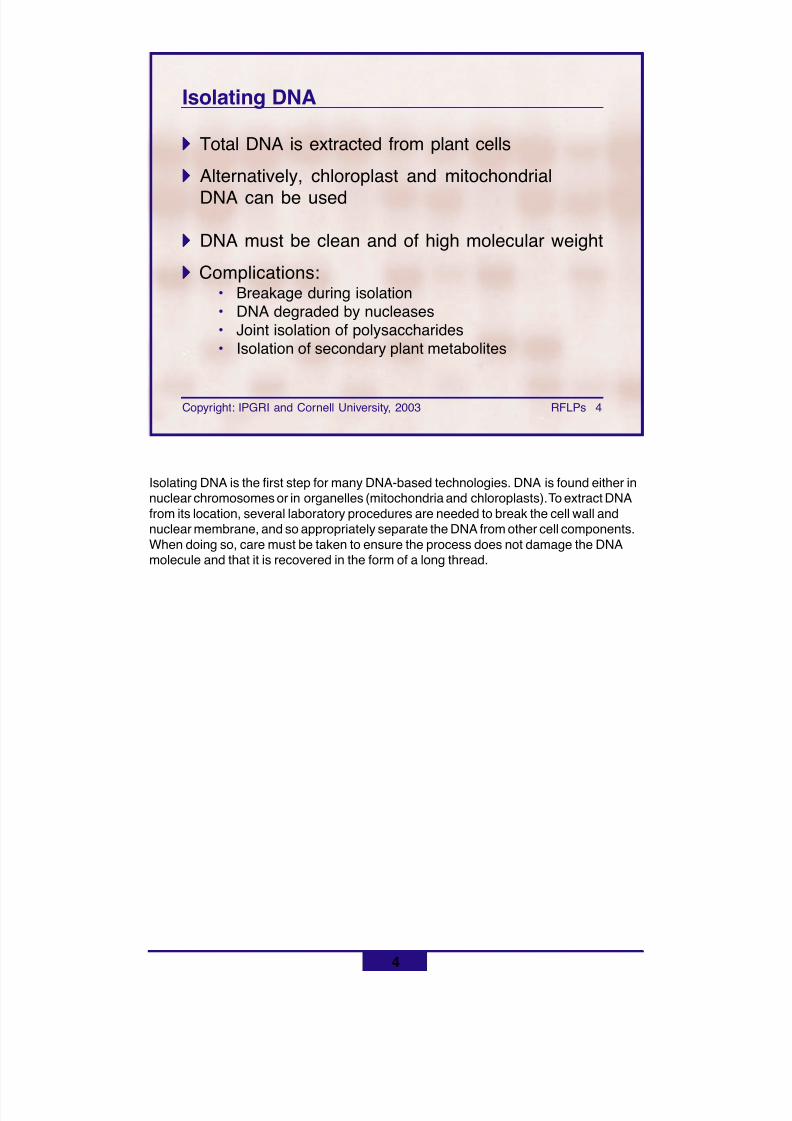
8/11/2019 Using molecular marker technology in studies on plant genetic diversity
http://slidepdf.com/reader/full/using-molecular-marker-technology-in-studies-on-plant-genetic-diversity 116/374
4
Copyright: IPGRI and Cornell University, 2003 RFLPs 4
Isolating DNA
!!!!! Total DNA is extracted from plant cells
!!!!! Alternatively, chloroplast and mitochondrialDNA can be used
!!!!! DNA must be clean and of high molecular weight
!!!!! Complications:• Breakage during isolation• DNA degraded by nucleases• Joint isolation of polysaccharides• Isolation of secondary plant metabolites
Isolating DNA is the first step for many DNA-based technologies. DNA is found either innuclear chromosomes or in organelles (mitochondria and chloroplasts). To extract DNAfrom its location, several laboratory procedures are needed to break the cell wall andnuclear membrane, and so appropriately separate the DNA from other cell components.When doing so, care must be taken to ensure the process does not damage the DNAmolecule and that it is recovered in the form of a long thread.
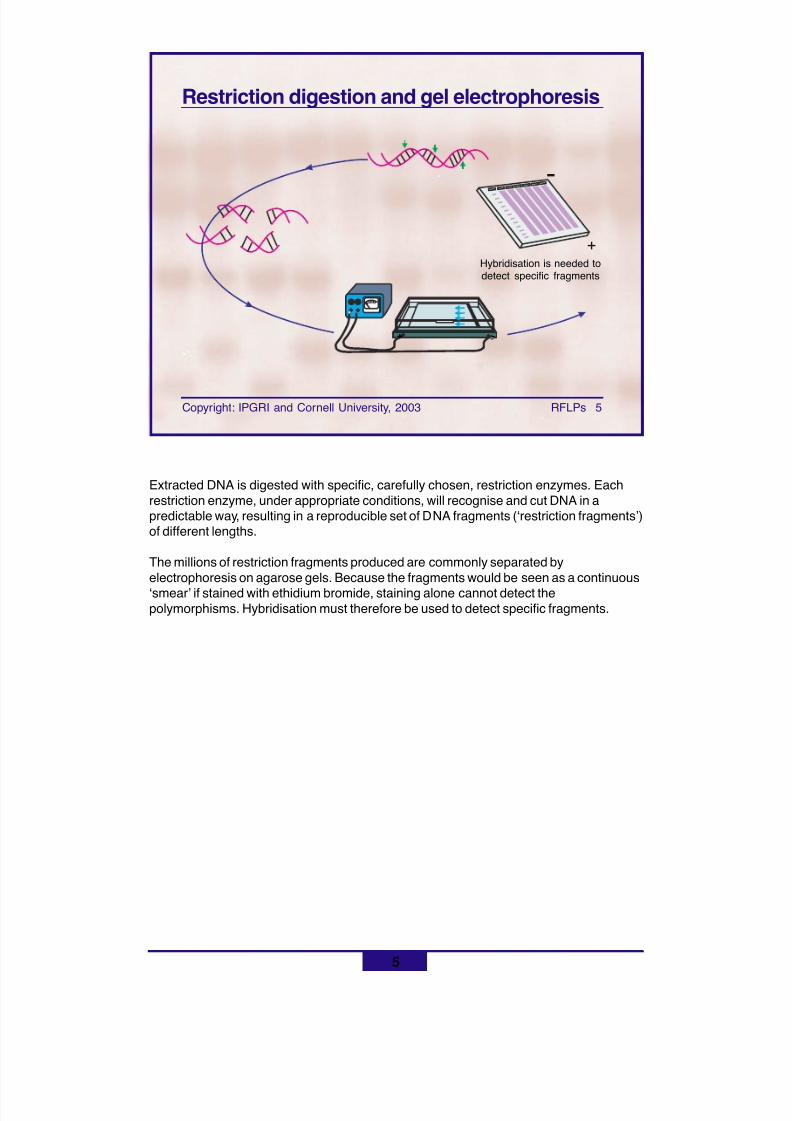
8/11/2019 Using molecular marker technology in studies on plant genetic diversity
http://slidepdf.com/reader/full/using-molecular-marker-technology-in-studies-on-plant-genetic-diversity 117/374
5
Copyright: IPGRI and Cornell University, 2003 RFLPs 5
Restriction digestion and gel electrophoresis
Extracted DNA is digested with specific, carefully chosen, restriction enzymes. Eachrestriction enzyme, under appropriate conditions, will recognise and cut DNA in apredictable way, resulting in a reproducible set of DNA fragments (‘restriction fragments’)of different lengths.
The millions of restriction fragments produced are commonly separated byelectrophoresis on agarose gels. Because the fragments would be seen as a continuous‘smear’ if stained with ethidium bromide, staining alone cannot detect thepolymorphisms. Hybridisation must therefore be used to detect specific fragments.
+ -
-
+
Hybridisation is needed todetect specific fragments
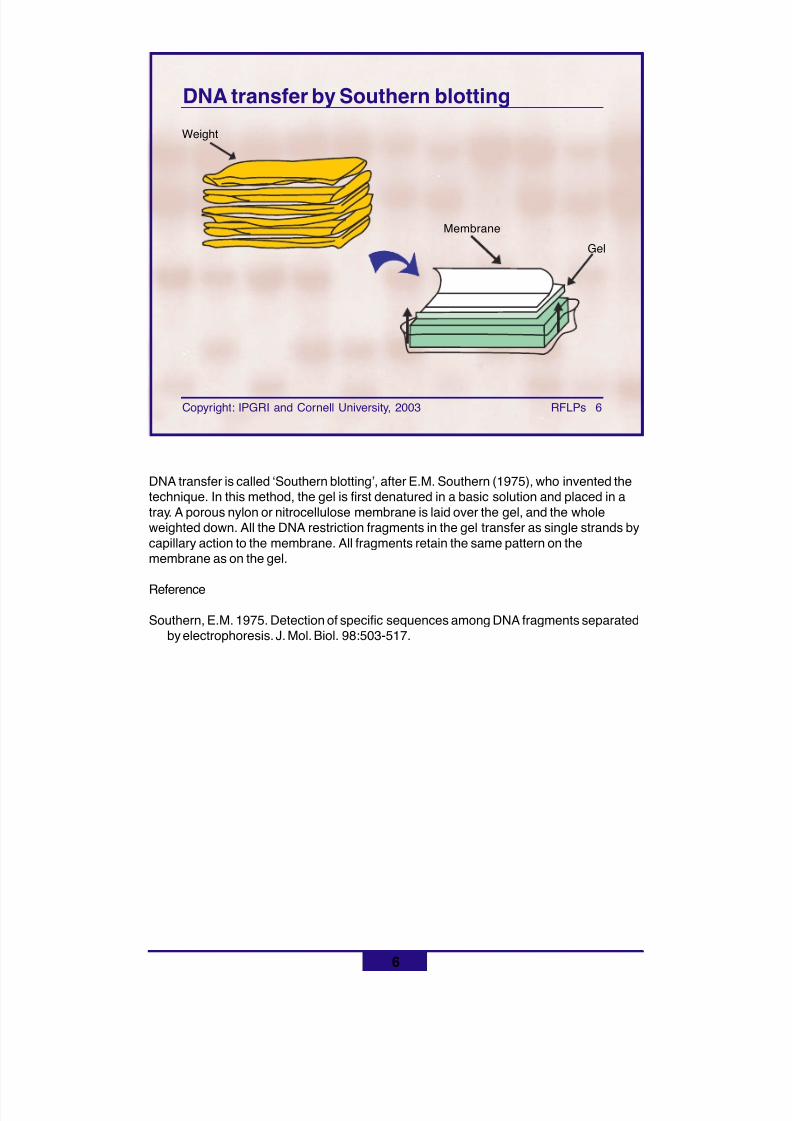
8/11/2019 Using molecular marker technology in studies on plant genetic diversity
http://slidepdf.com/reader/full/using-molecular-marker-technology-in-studies-on-plant-genetic-diversity 118/374
6
Copyright: IPGRI and Cornell University, 2003 RFLPs 6
DNA transfer by Southern blotting
DNA transfer is called ‘Southern blotting’, after E.M. Southern (1975), who invented thetechnique. In this method, the gel is first denatured in a basic solution and placed in atray. A porous nylon or nitrocellulose membrane is laid over the gel, and the wholeweighted down. All the DNA restriction fragments in the gel transfer as single strands bycapillary action to the membrane. All fragments retain the same pattern on themembrane as on the gel.
Reference
Southern, E.M. 1975. Detection of specific sequences among DNA fragments separatedby electrophoresis. J. Mol. Biol. 98:503-517.
Weight
Membrane
Gel
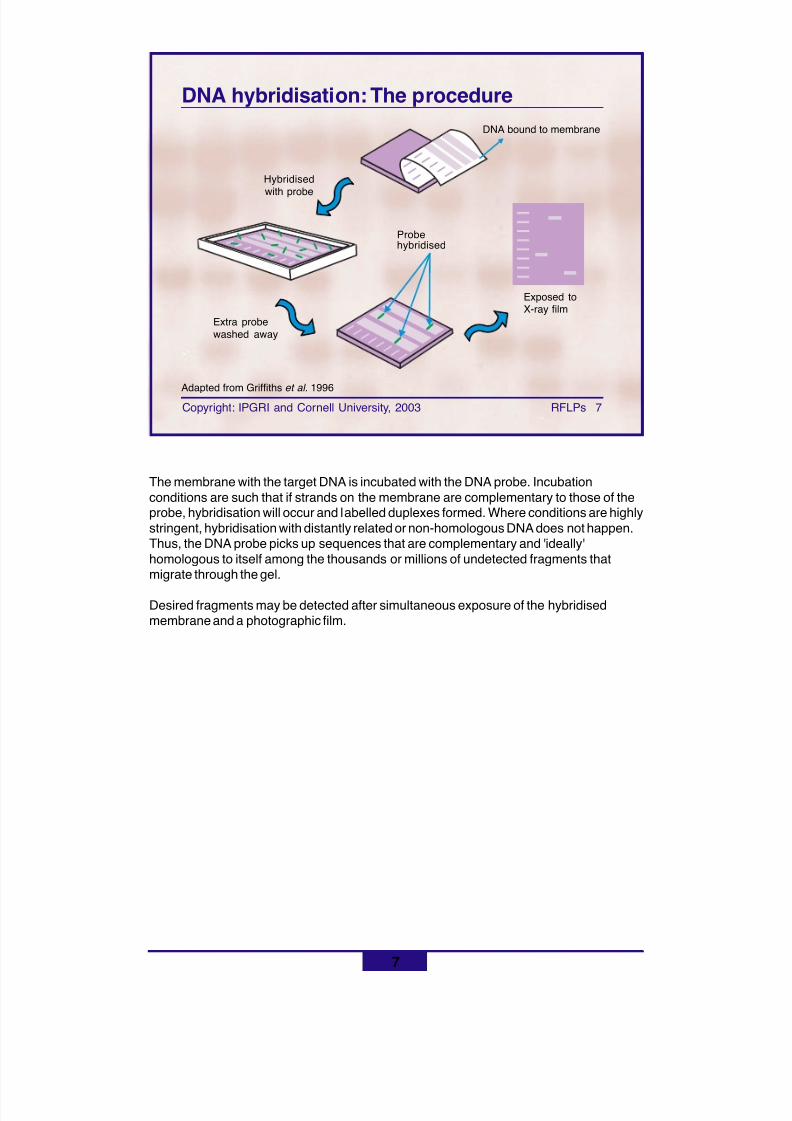
8/11/2019 Using molecular marker technology in studies on plant genetic diversity
http://slidepdf.com/reader/full/using-molecular-marker-technology-in-studies-on-plant-genetic-diversity 119/374
7
Copyright: IPGRI and Cornell University, 2003 RFLPs 7
DNA hybridisation: The procedure
The membrane with the target DNA is incubated with the DNA probe. Incubationconditions are such that if strands on the membrane are complementary to those of theprobe, hybridisation will occur and labelled duplexes formed. Where conditions are highlystringent, hybridisation with distantly related or non-homologous DNA does not happen.Thus, the DNA probe picks up sequences that are complementary and 'ideally'homologous to itself among the thousands or millions of undetected fragments thatmigrate through the gel.
Desired fragments may be detected after simultaneous exposure of the hybridisedmembrane and a photographic film.
Hybridised
with probe
DNA bound to membrane
Extra probewashed away
Probehybridised
Exposed toX-ray film
Adapted from Griffiths et al. 1996
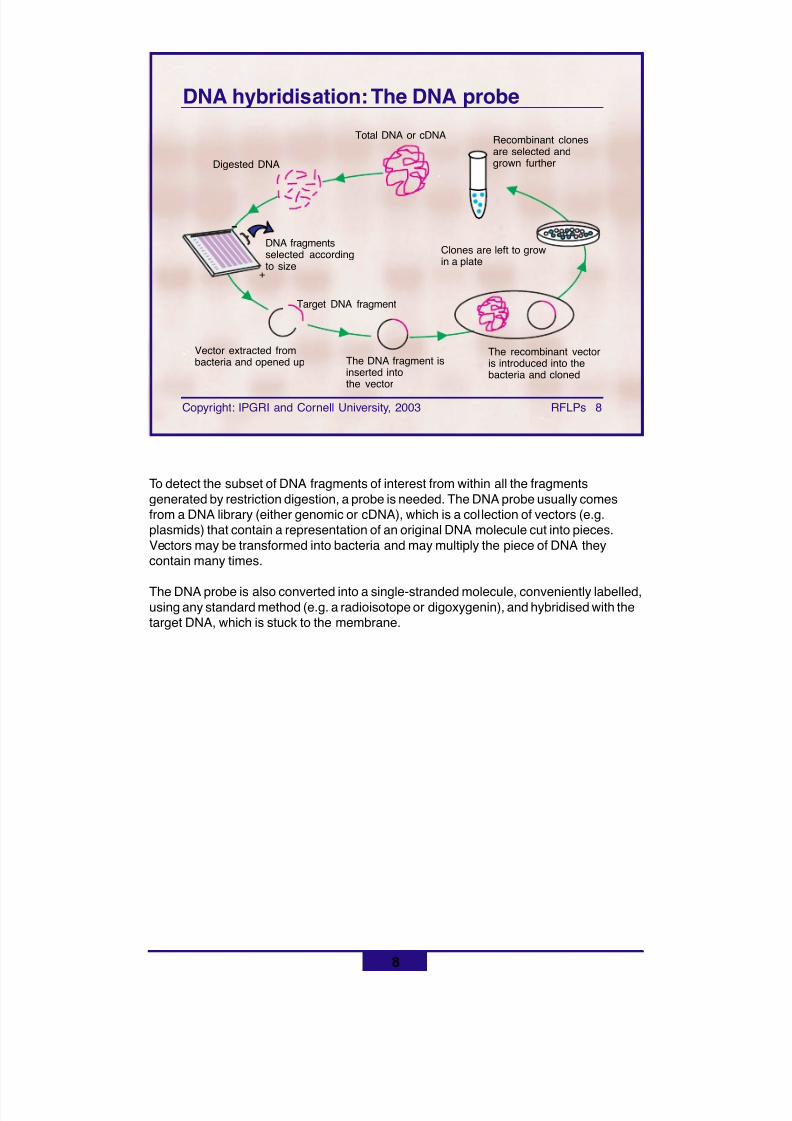
8/11/2019 Using molecular marker technology in studies on plant genetic diversity
http://slidepdf.com/reader/full/using-molecular-marker-technology-in-studies-on-plant-genetic-diversity 120/374
8
Copyright: IPGRI and Cornell University, 2003 RFLPs 8
DNA hybridisation: The DNA probe
To detect the subset of DNA fragments of interest from within all the fragmentsgenerated by restriction digestion, a probe is needed. The DNA probe usually comesfrom a DNA library (either genomic or cDNA), which is a collection of vectors (e.g.plasmids) that contain a representation of an original DNA molecule cut into pieces.Vectors may be transformed into bacteria and may multiply the piece of DNA theycontain many times.
The DNA probe is also converted into a single-stranded molecule, conveniently labelled,using any standard method (e.g. a radioisotope or digoxygenin), and hybridised with thetarget DNA, which is stuck to the membrane.
-
+
Total DNA or cDNA Recombinant clonesare selected andgrown further
Clones are left to growin a plate
The recombinant vectoris introduced into thebacteria and cloned
The DNA fragment isinserted intothe vector
Vector extracted frombacteria and opened up
Target DNA fragment
DNA fragmentsselected accordingto size
Digested DNA
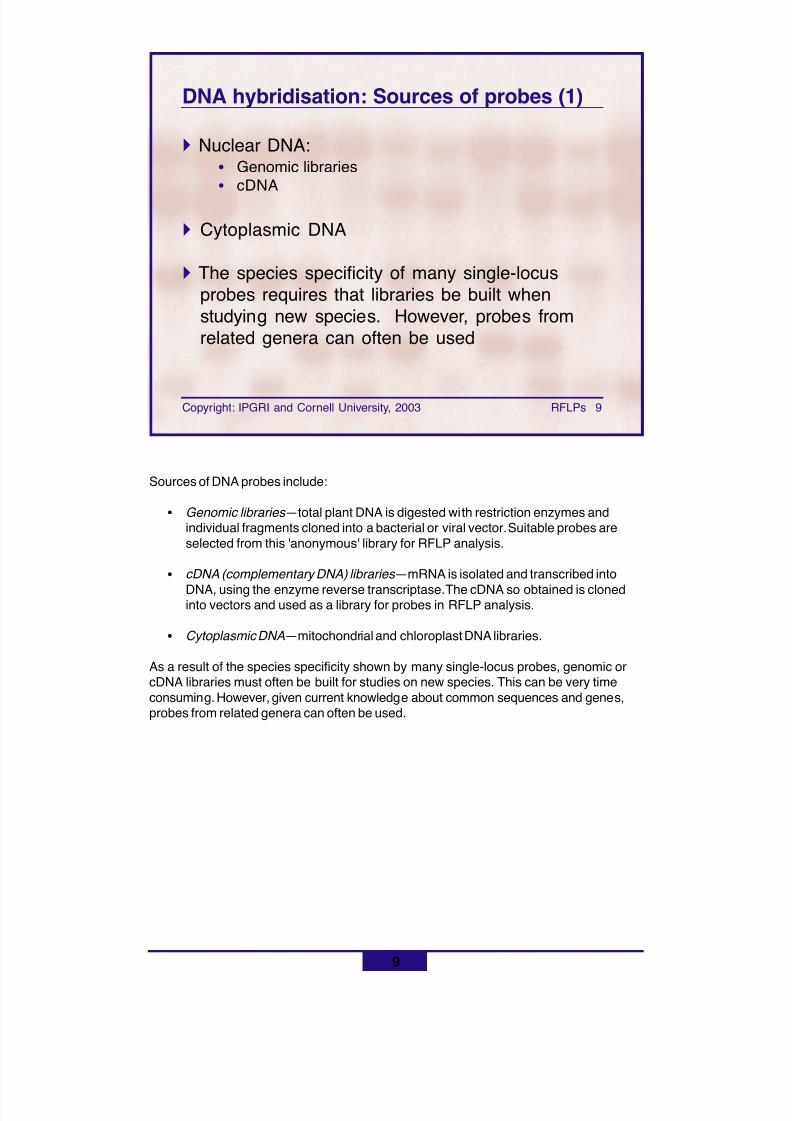
8/11/2019 Using molecular marker technology in studies on plant genetic diversity
http://slidepdf.com/reader/full/using-molecular-marker-technology-in-studies-on-plant-genetic-diversity 121/374
9
Copyright: IPGRI and Cornell University, 2003 RFLPs 9
DNA hybridisation: Sources of probes (1)
! Nuclear DNA:• Genomic libraries• cDNA
! Cytoplasmic DNA
! The species specificity of many single-locusprobes requires that libraries be built whenstudying new species. However, probes fromrelated genera can often be used
Sources of DNA probes include:
• Genomic libraries —total plant DNA is digested with restriction enzymes andindividual fragments cloned into a bacterial or viral vector. Suitable probes areselected from this 'anonymous' library for RFLP analysis.
• cDNA (complementary DNA) libraries —mRNA is isolated and transcribed into
DNA, using the enzyme reverse transcriptase. The cDNA so obtained is clonedinto vectors and used as a library for probes in RFLP analysis.
• Cytoplasmic DNA —mitochondrial and chloroplast DNA libraries.
As a result of the species specificity shown by many single-locus probes, genomic orcDNA libraries must often be built for studies on new species. This can be very timeconsuming. However, given current knowledge about common sequences and genes,probes from related genera can often be used.
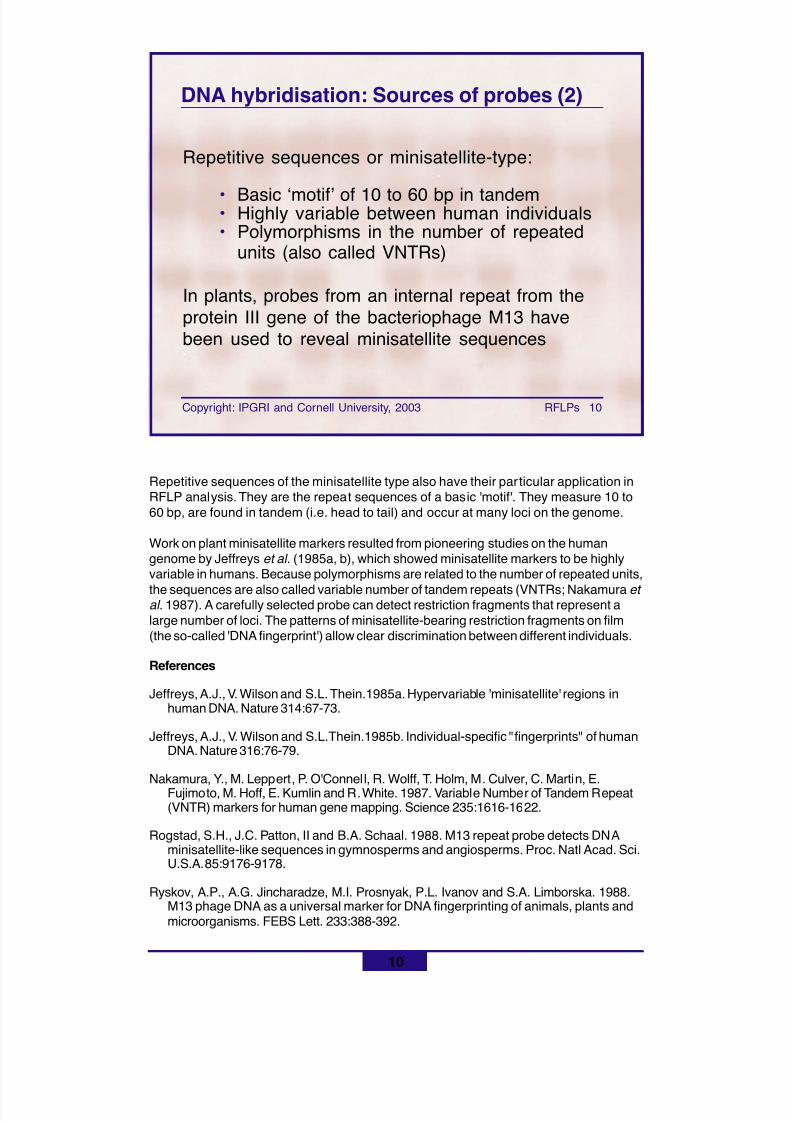
8/11/2019 Using molecular marker technology in studies on plant genetic diversity
http://slidepdf.com/reader/full/using-molecular-marker-technology-in-studies-on-plant-genetic-diversity 122/374
10
Copyright: IPGRI and Cornell University, 2003 RFLPs 10
DNA hybridisation: Sources of probes (2)
Repetitive sequences or minisatellite-type:
• Basic ‘motif’ of 10 to 60 bp in tandem• Highly variable between human individuals• Polymorphisms in the number of repeated
units (also called VNTRs)
In plants, probes from an internal repeat from theprotein III gene of the bacteriophage M13 havebeen used to reveal minisatellite sequences
Repetitive sequences of the minisatellite type also have their par ticular application inRFLP analysis. They are the repeat sequences of a basic 'motif'. They measure 10 to60 bp, are found in tandem (i.e. head to tail) and occur at many loci on the genome.
Work on plant minisatellite markers resulted from pioneering studies on the humangenome by Jeffreys et al . (1985a, b), which showed minisatellite markers to be highlyvariable in humans. Because polymorphisms are related to the number of repeated units,
the sequences are also called variable number of tandem repeats (VNTRs; Nakamura et al . 1987). A carefully selected probe can detect restriction fragments that represent alarge number of loci. The patterns of minisatellite-bearing restriction fragments on film(the so-called 'DNA fingerprint') allow clear discrimination between different individuals.
References
Jeffreys, A.J., V. Wilson and S.L. Thein.1985a. Hypervariable 'minisatellite' regions inhuman DNA. Nature 314:67-73.
Jeffreys, A.J., V. Wilson and S.L.Thein.1985b. Individual-specific "fingerprints" of humanDNA. Nature 316:76-79.
Nakamura, Y., M. Leppert, P. O'Connell, R. Wolff, T. Holm, M. Culver, C. Martin, E.Fujimoto, M. Hoff, E. Kumlin and R. White. 1987. Variable Number of Tandem Repeat(VNTR) markers for human gene mapping. Science 235:1616-1622.
Rogstad, S.H., J.C. Patton, II and B.A. Schaal. 1988. M13 repeat probe detects DNAminisatellite-like sequences in gymnosperms and angiosperms. Proc. Natl Acad. Sci.U.S.A. 85:9176-9178.
Ryskov, A.P., A.G. Jincharadze, M.I. Prosnyak, P.L. Ivanov and S.A. Limborska. 1988.M13 phage DNA as a universal marker for DNA fingerprinting of animals, plants andmicroorganisms. FEBS Lett. 233:388-392.
8/11/2019 Using molecular marker technology in studies on plant genetic diversity
http://slidepdf.com/reader/full/using-molecular-marker-technology-in-studies-on-plant-genetic-diversity 123/374
11
Copyright: IPGRI and Cornell University, 2003 RFLPs 11
Equipment
! Resources:• Distilled and/or deionised water•
Reagents
! Equipment:• Refrigerator and freezer• Laminar flow hood• Centrifuge• Power supply units• Hotplate or microwave
• pH meter• Standard balance• Gel electrophoresis units• Dark room• UV transilluminator
8/11/2019 Using molecular marker technology in studies on plant genetic diversity
http://slidepdf.com/reader/full/using-molecular-marker-technology-in-studies-on-plant-genetic-diversity 124/374
12
Copyright: IPGRI and Cornell University, 2003 RFLPs 12
RFLP technology in pictures
The following slides illustrate the procedures of
the RFLP technique
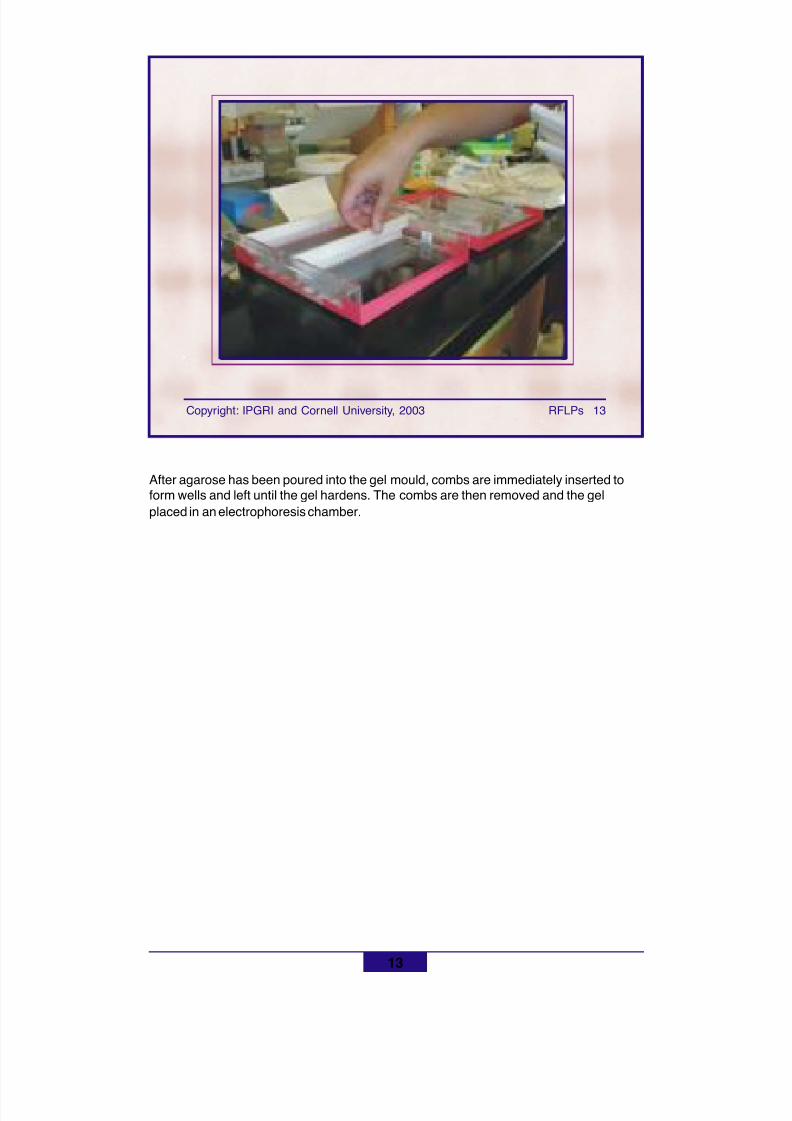
8/11/2019 Using molecular marker technology in studies on plant genetic diversity
http://slidepdf.com/reader/full/using-molecular-marker-technology-in-studies-on-plant-genetic-diversity 125/374
Copyright: IPGRI and Cornell University, 2003 RFLPs 13
13
After agarose has been poured into the gel mould, combs are immediately inserted toform wells and left until the gel hardens. The combs are then removed and the gelplaced in an electrophoresis chamber.
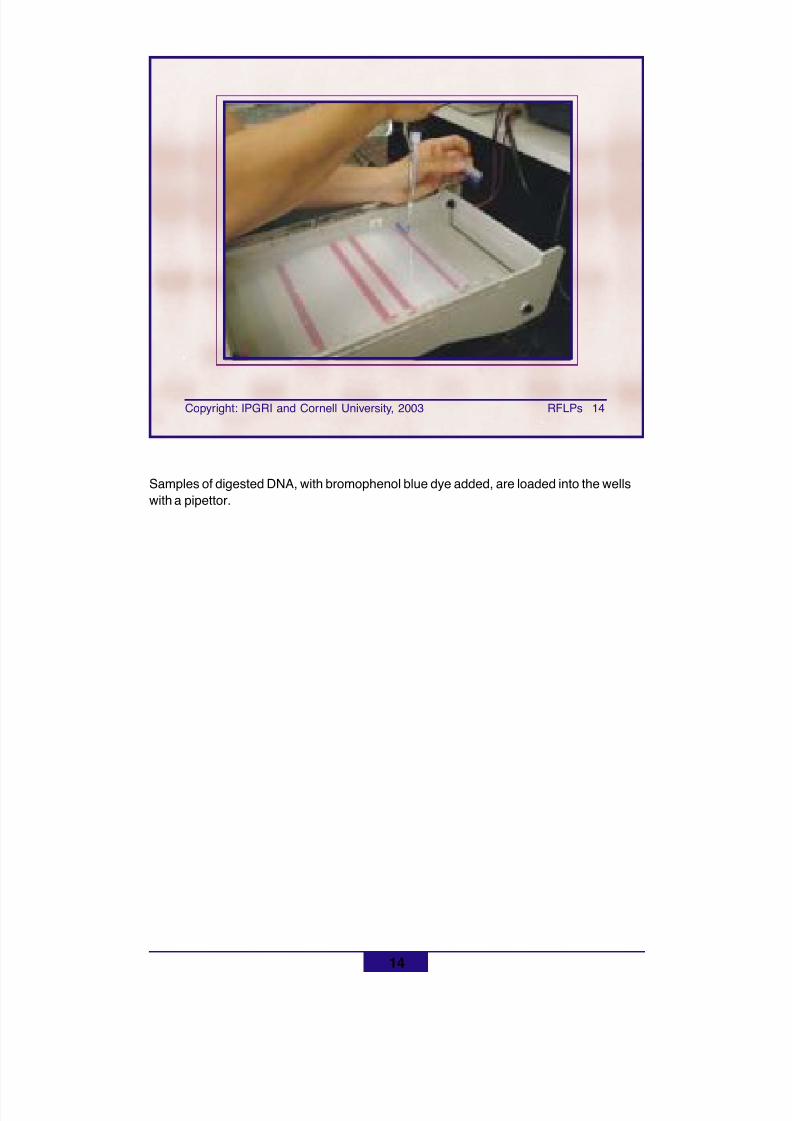
8/11/2019 Using molecular marker technology in studies on plant genetic diversity
http://slidepdf.com/reader/full/using-molecular-marker-technology-in-studies-on-plant-genetic-diversity 126/374
Copyright: IPGRI and Cornell University, 2003 RFLPs 14
14
Samples of digested DNA, with bromophenol blue dye added, are loaded into the wellswith a pipettor.
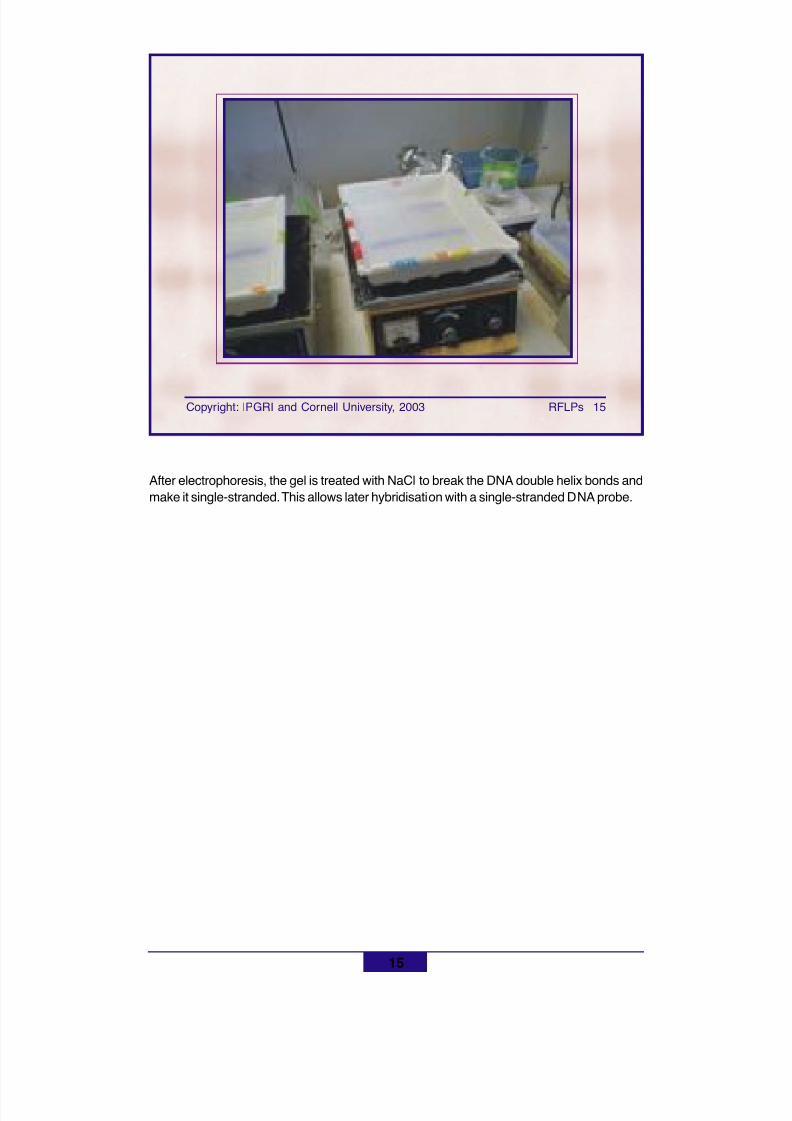
8/11/2019 Using molecular marker technology in studies on plant genetic diversity
http://slidepdf.com/reader/full/using-molecular-marker-technology-in-studies-on-plant-genetic-diversity 127/374
Copyright: IPGRI and Cornell University, 2003 RFLPs 15
15
After electrophoresis, the gel is treated with NaCl to break the DNA double helix bonds andmake it single-stranded. This allows later hybridisation with a single-stranded DNA probe.
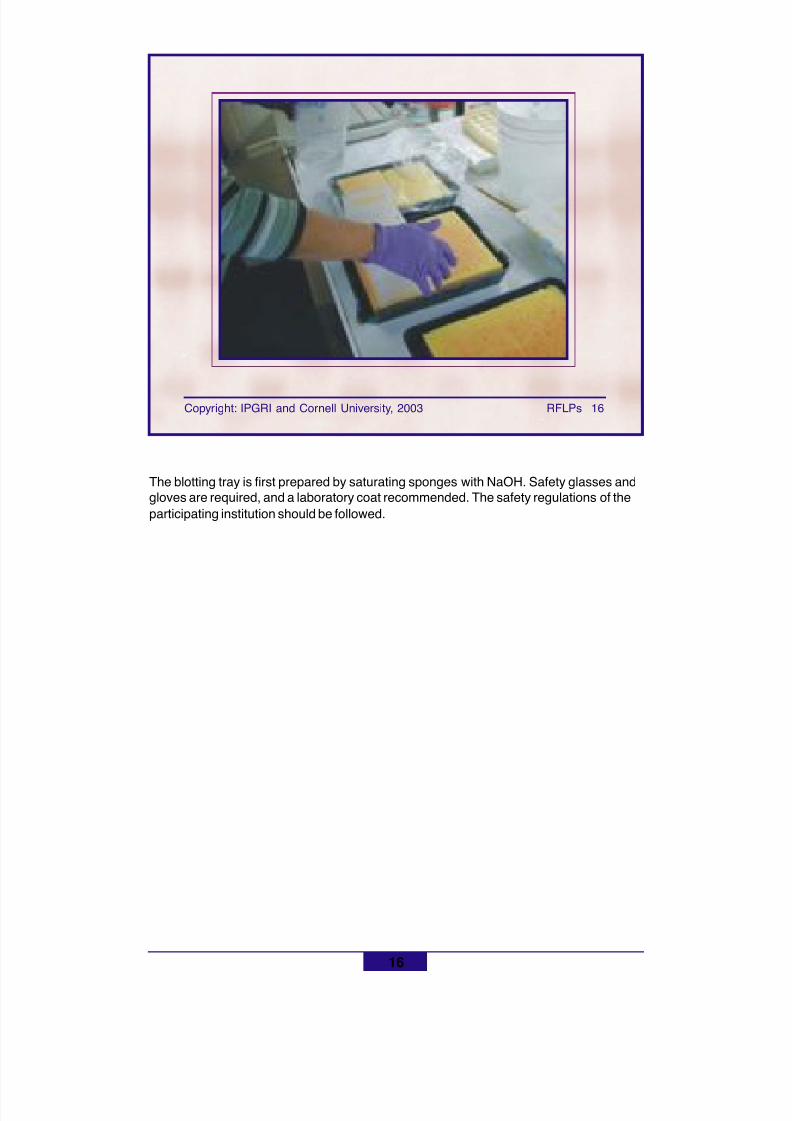
8/11/2019 Using molecular marker technology in studies on plant genetic diversity
http://slidepdf.com/reader/full/using-molecular-marker-technology-in-studies-on-plant-genetic-diversity 128/374
Copyright: IPGRI and Cornell University, 2003 RFLPs 16
16
The blotting tray is first prepared by saturating sponges with NaOH. Safety glasses andgloves are required, and a laboratory coat recommended. The safety regulations of theparticipating institution should be followed.
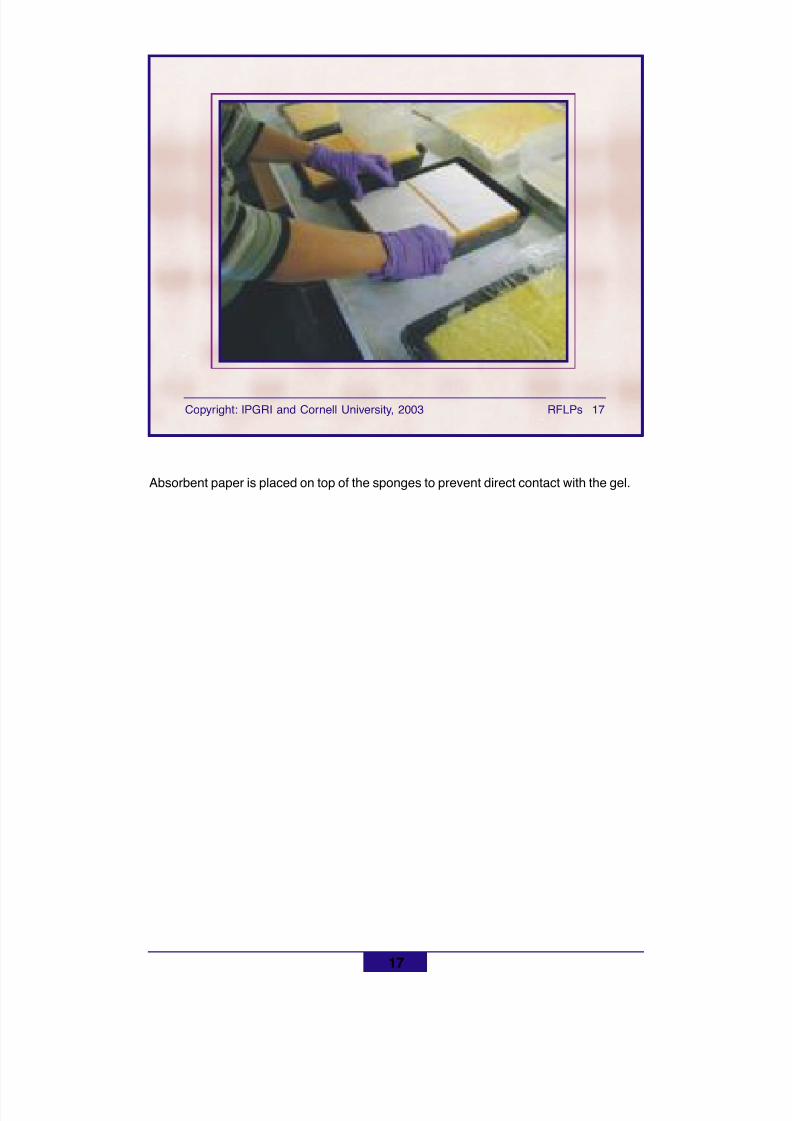
8/11/2019 Using molecular marker technology in studies on plant genetic diversity
http://slidepdf.com/reader/full/using-molecular-marker-technology-in-studies-on-plant-genetic-diversity 129/374
Copyright: IPGRI and Cornell University, 2003 RFLPs 17
17
Absorbent paper is placed on top of the sponges to prevent direct contact with the gel.
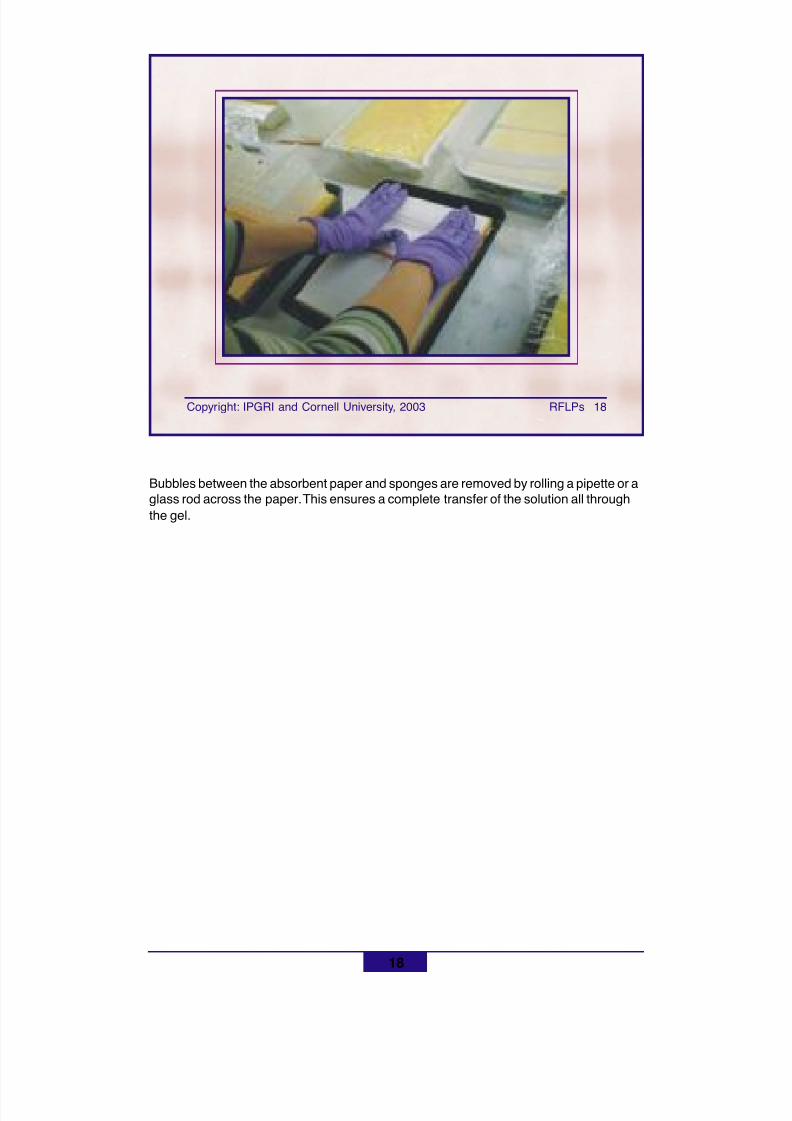
8/11/2019 Using molecular marker technology in studies on plant genetic diversity
http://slidepdf.com/reader/full/using-molecular-marker-technology-in-studies-on-plant-genetic-diversity 130/374
Copyright: IPGRI and Cornell University, 2003 RFLPs 18
18
Bubbles between the absorbent paper and sponges are removed by rolling a pipette or aglass rod across the paper. This ensures a complete transfer of the solution all throughthe gel.
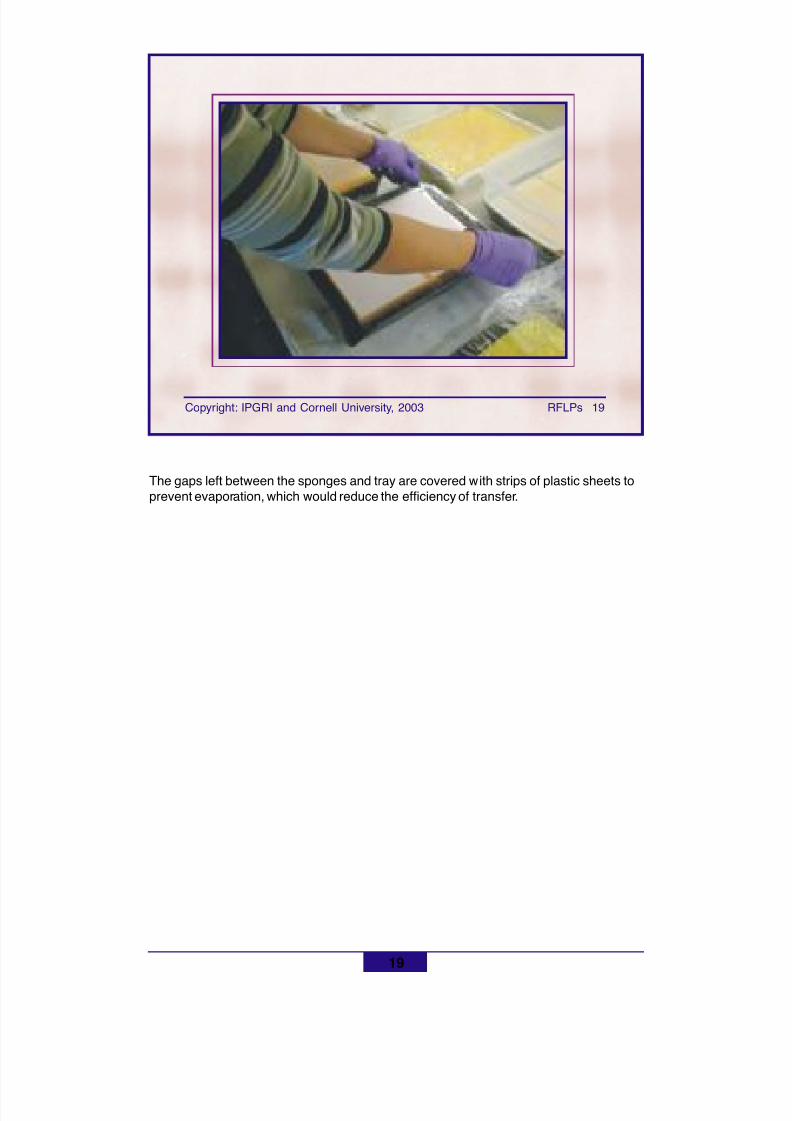
8/11/2019 Using molecular marker technology in studies on plant genetic diversity
http://slidepdf.com/reader/full/using-molecular-marker-technology-in-studies-on-plant-genetic-diversity 131/374
Copyright: IPGRI and Cornell University, 2003 RFLPs 19
19
The gaps left between the sponges and tray are covered with strips of plastic sheets toprevent evaporation, which would reduce the efficiency of transfer.
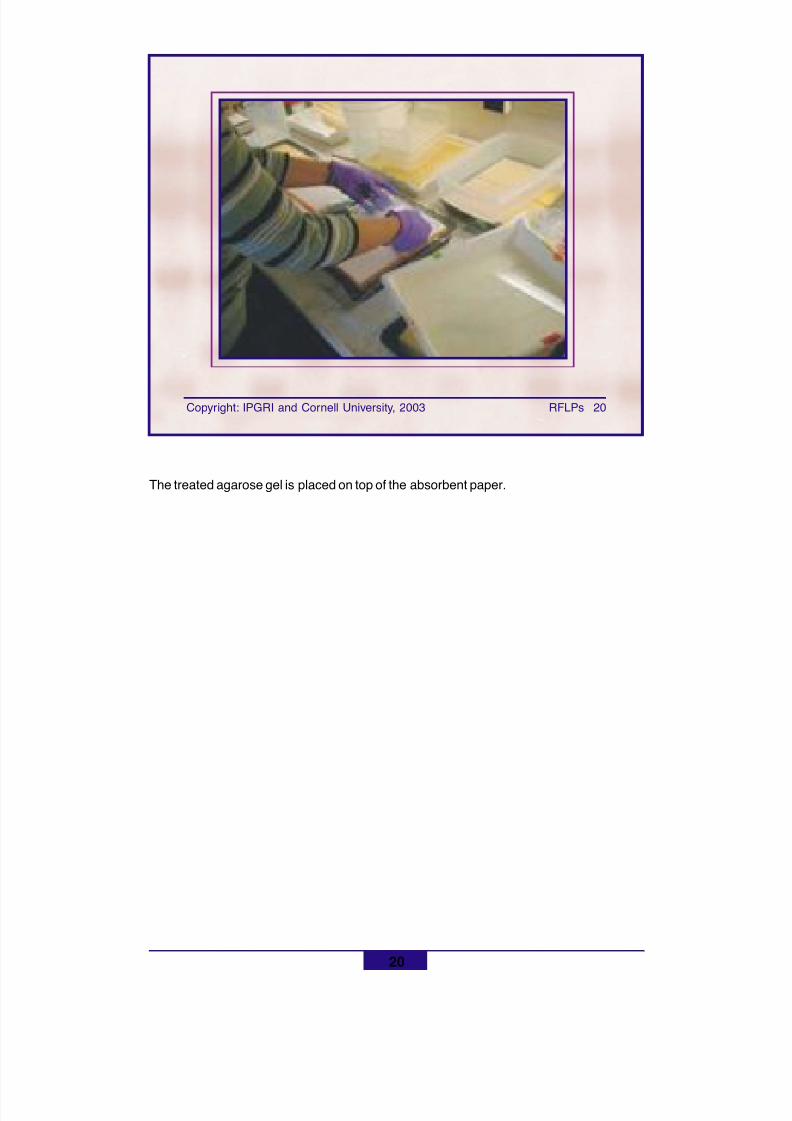
8/11/2019 Using molecular marker technology in studies on plant genetic diversity
http://slidepdf.com/reader/full/using-molecular-marker-technology-in-studies-on-plant-genetic-diversity 132/374
Copyright: IPGRI and Cornell University, 2003 RFLPs 20
20
The treated agarose gel is placed on top of the absorbent paper.
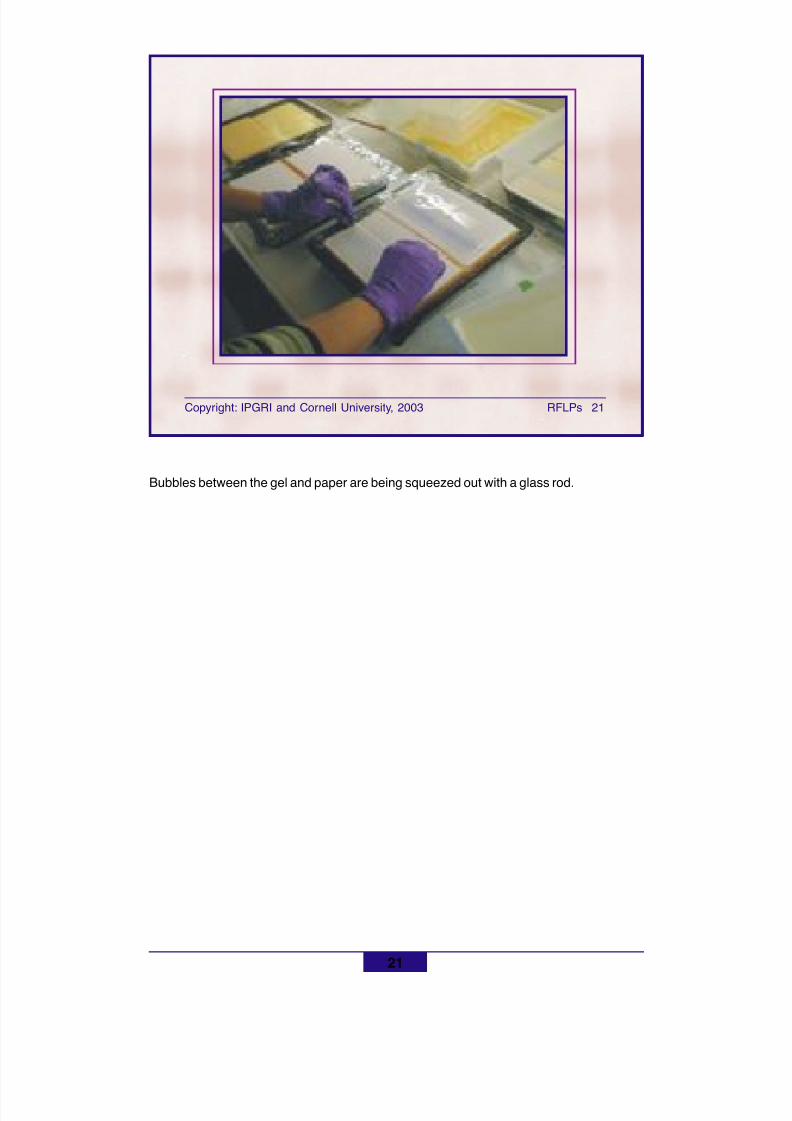
8/11/2019 Using molecular marker technology in studies on plant genetic diversity
http://slidepdf.com/reader/full/using-molecular-marker-technology-in-studies-on-plant-genetic-diversity 133/374
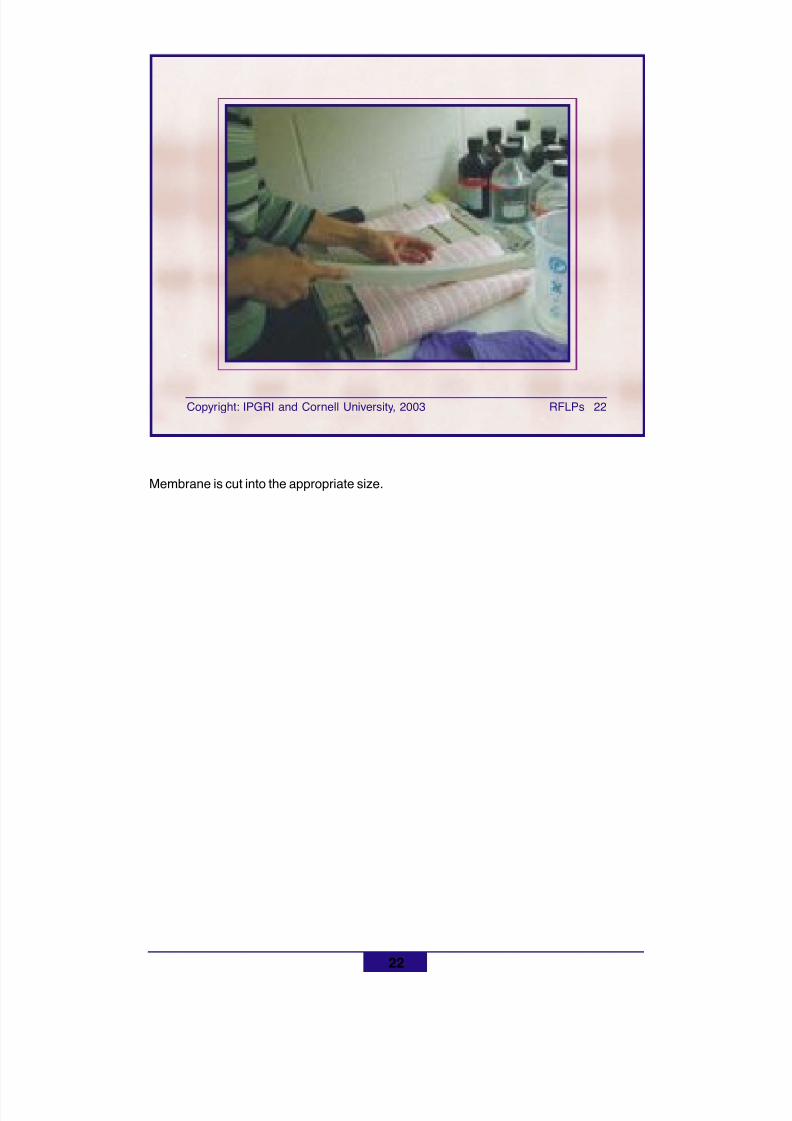
8/11/2019 Using molecular marker technology in studies on plant genetic diversity
http://slidepdf.com/reader/full/using-molecular-marker-technology-in-studies-on-plant-genetic-diversity 134/374
Copyright: IPGRI and Cornell University, 2003 RFLPs 22
22
Membrane is cut into the appropriate size.
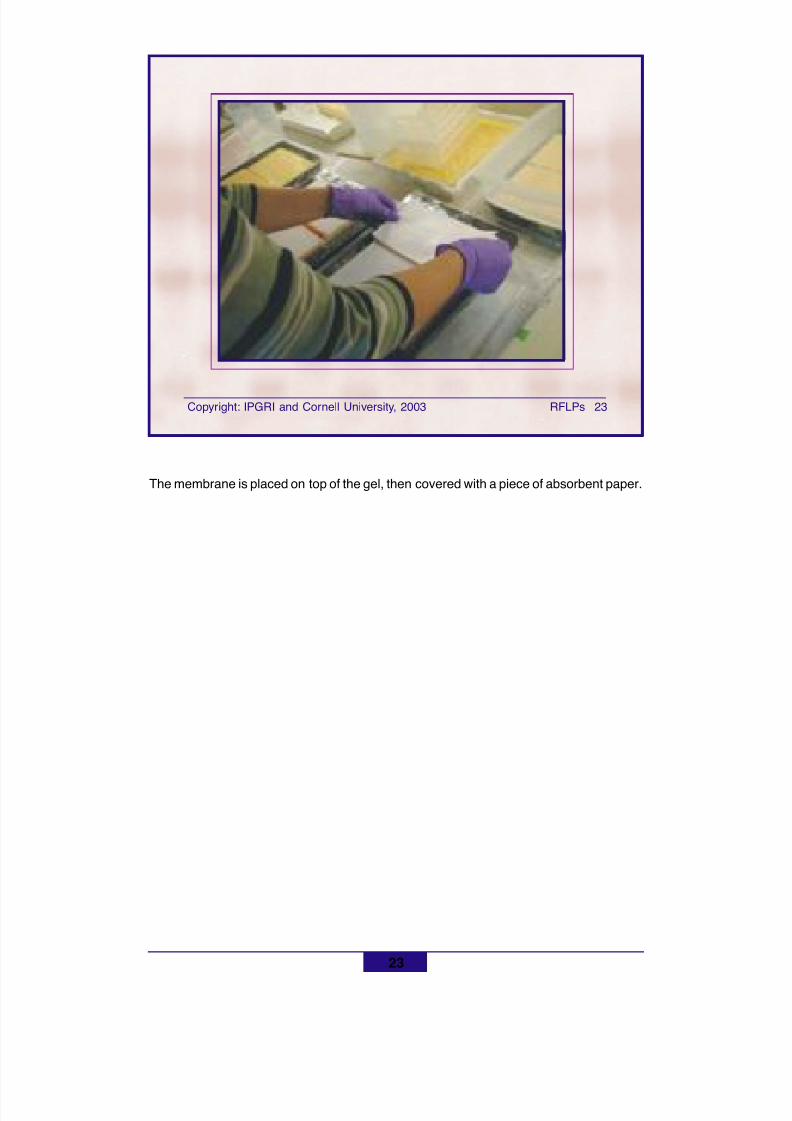
8/11/2019 Using molecular marker technology in studies on plant genetic diversity
http://slidepdf.com/reader/full/using-molecular-marker-technology-in-studies-on-plant-genetic-diversity 135/374
Copyright: IPGRI and Cornell University, 2003 RFLPs 23
23
The membrane is placed on top of the gel, then covered with a piece of absorbent paper.
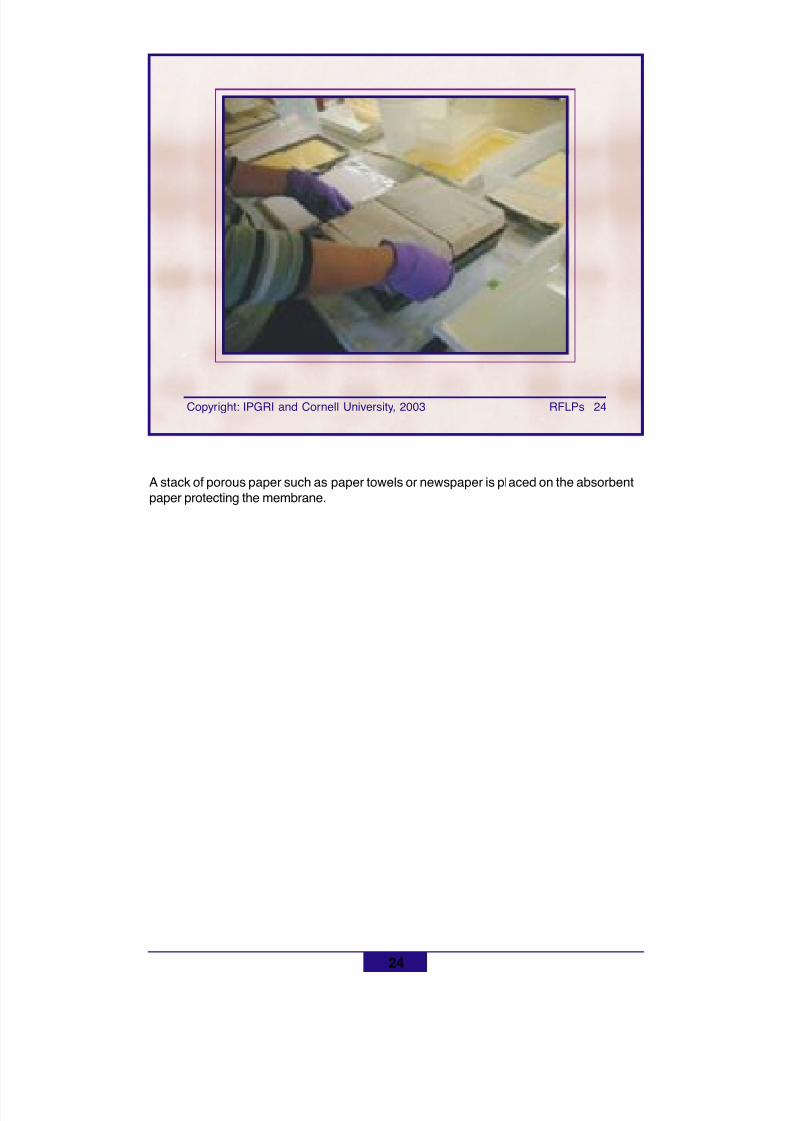
8/11/2019 Using molecular marker technology in studies on plant genetic diversity
http://slidepdf.com/reader/full/using-molecular-marker-technology-in-studies-on-plant-genetic-diversity 136/374
Copyright: IPGRI and Cornell University, 2003 RFLPs 24
24
A stack of porous paper such as paper towels or newspaper is placed on the absorbentpaper protecting the membrane.
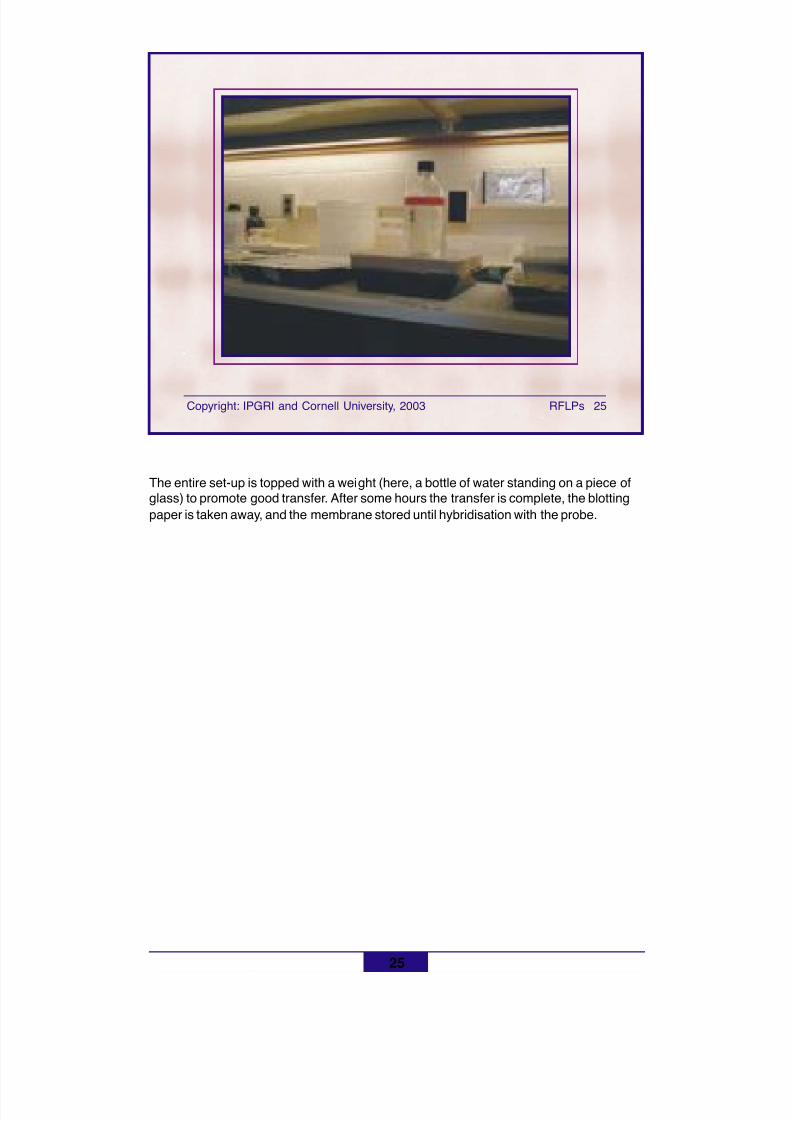
8/11/2019 Using molecular marker technology in studies on plant genetic diversity
http://slidepdf.com/reader/full/using-molecular-marker-technology-in-studies-on-plant-genetic-diversity 137/374
Copyright: IPGRI and Cornell University, 2003 RFLPs 25
25
The entire set-up is topped with a weight (here, a bottle of water standing on a piece ofglass) to promote good transfer. After some hours the transfer is complete, the blottingpaper is taken away, and the membrane stored until hybridisation with the probe.
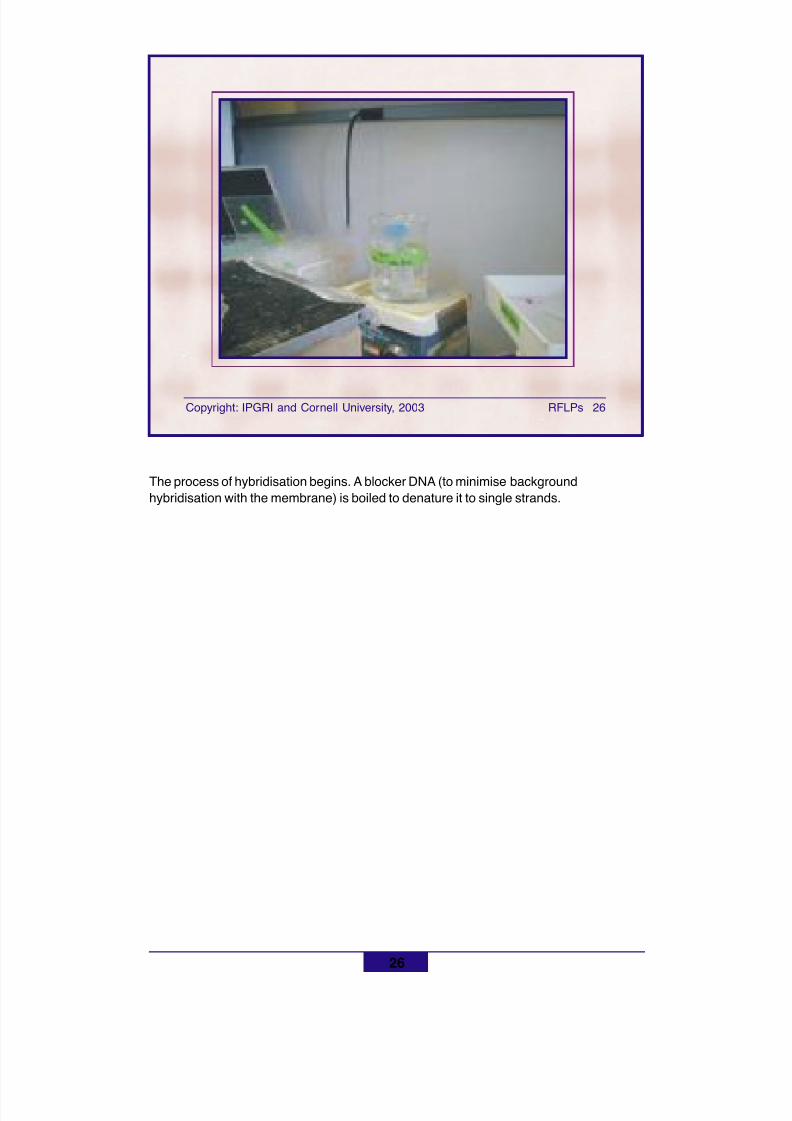
8/11/2019 Using molecular marker technology in studies on plant genetic diversity
http://slidepdf.com/reader/full/using-molecular-marker-technology-in-studies-on-plant-genetic-diversity 138/374
Copyright: IPGRI and Cornell University, 2003 RFLPs 26
26
The process of hybridisation begins. A blocker DNA (to minimise backgroundhybridisation with the membrane) is boiled to denature it to single strands.
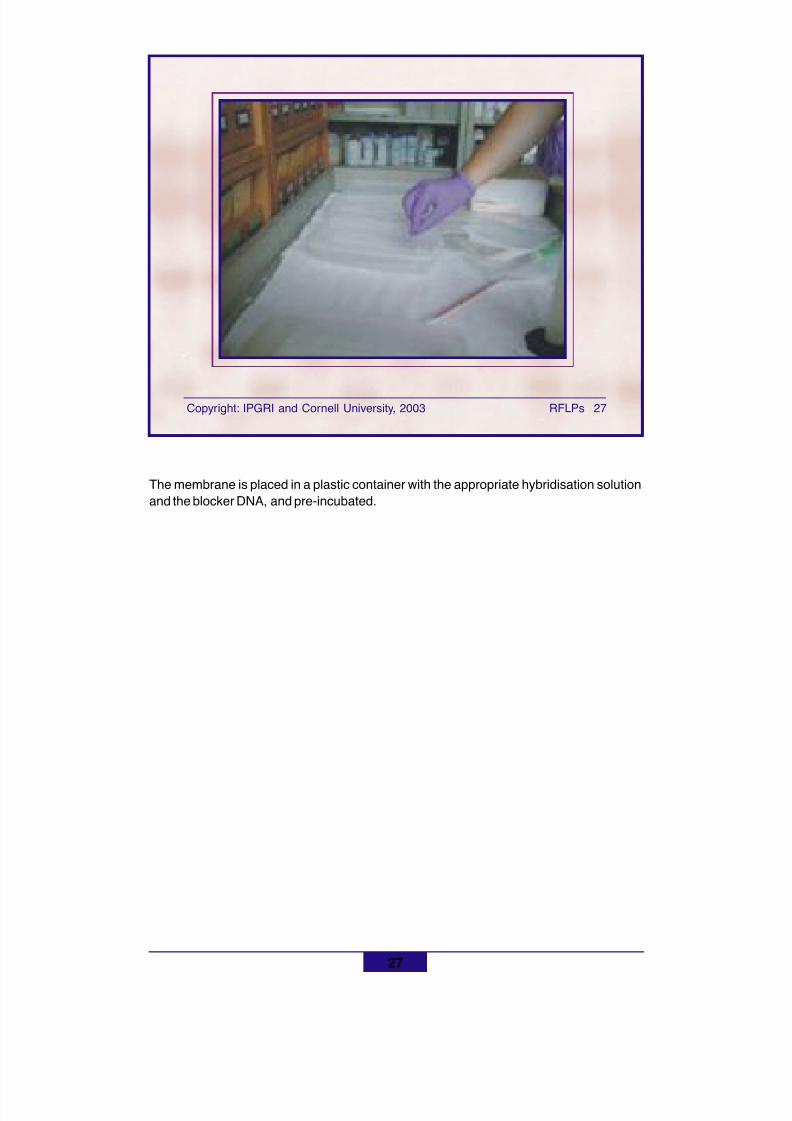
8/11/2019 Using molecular marker technology in studies on plant genetic diversity
http://slidepdf.com/reader/full/using-molecular-marker-technology-in-studies-on-plant-genetic-diversity 139/374
Copyright: IPGRI and Cornell University, 2003 RFLPs 27
27
The membrane is placed in a plastic container with the appropriate hybridisation solutionand the blocker DNA, and pre-incubated.
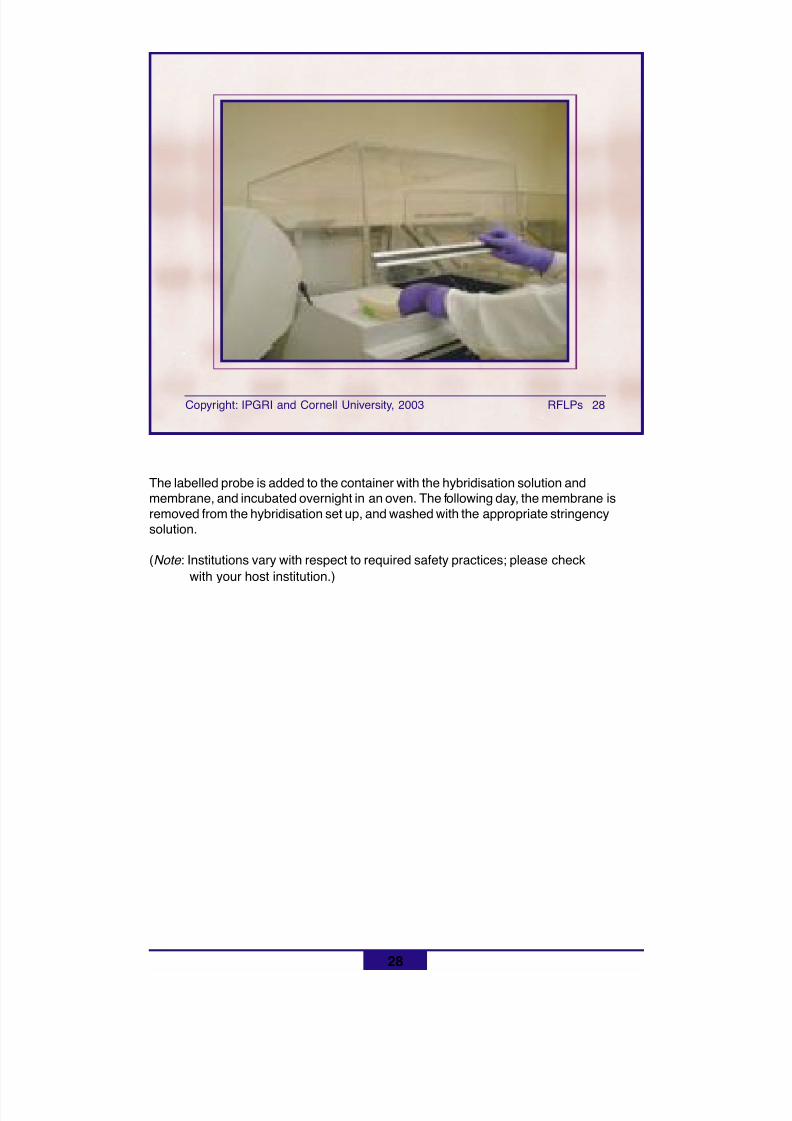
8/11/2019 Using molecular marker technology in studies on plant genetic diversity
http://slidepdf.com/reader/full/using-molecular-marker-technology-in-studies-on-plant-genetic-diversity 140/374
Copyright: IPGRI and Cornell University, 2003 RFLPs 28
28
The labelled probe is added to the container with the hybridisation solution andmembrane, and incubated overnight in an oven. The following day, the membrane isremoved from the hybridisation set up, and washed with the appropriate stringencysolution.
(Note : Institutions vary with respect to required safety practices; please check with your host institution.)
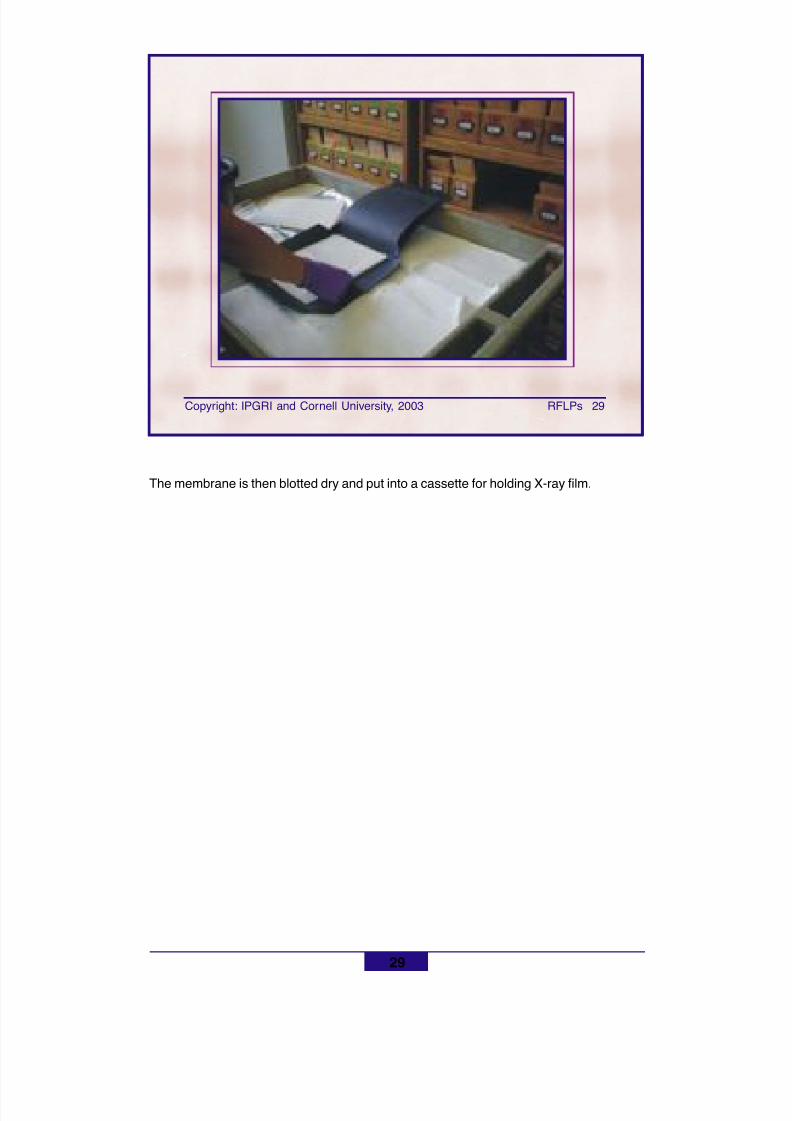
8/11/2019 Using molecular marker technology in studies on plant genetic diversity
http://slidepdf.com/reader/full/using-molecular-marker-technology-in-studies-on-plant-genetic-diversity 141/374
Copyright: IPGRI and Cornell University, 2003 RFLPs 29
29
The membrane is then blotted dry and put into a cassette for holding X-ray film.
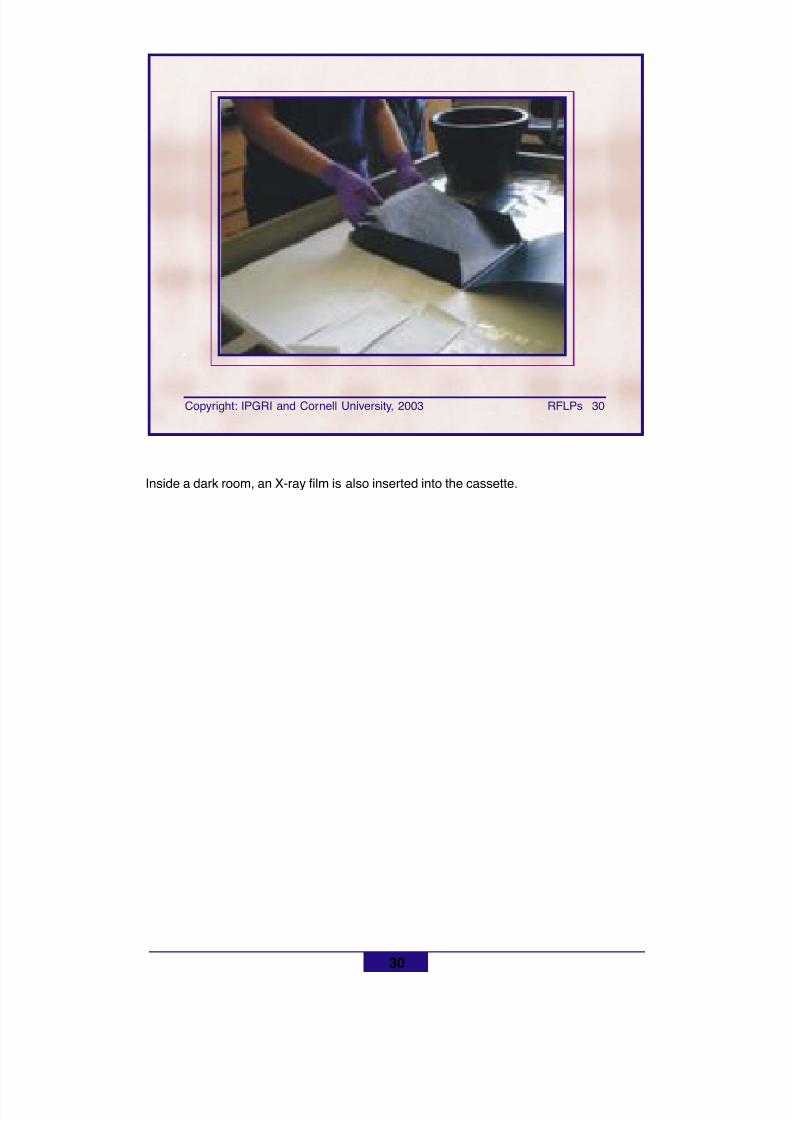
8/11/2019 Using molecular marker technology in studies on plant genetic diversity
http://slidepdf.com/reader/full/using-molecular-marker-technology-in-studies-on-plant-genetic-diversity 142/374
Copyright: IPGRI and Cornell University, 2003 RFLPs 30
30
Inside a dark room, an X-ray film is also inserted into the cassette.
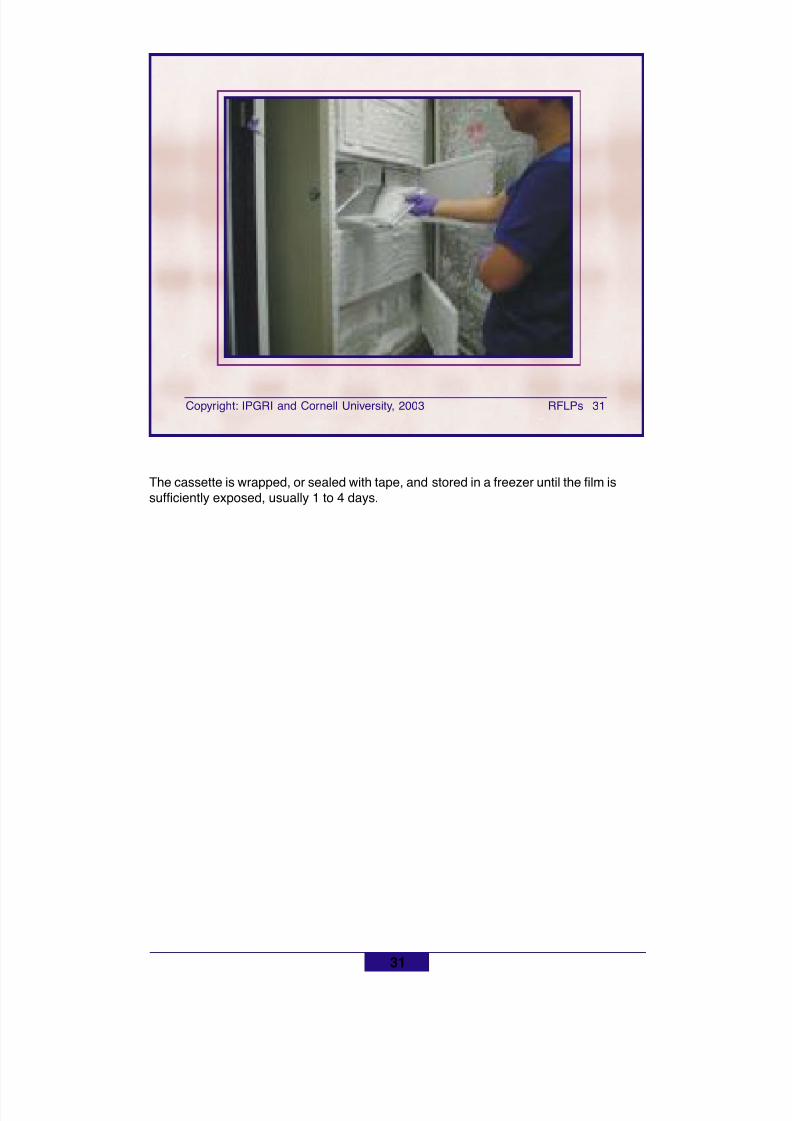
8/11/2019 Using molecular marker technology in studies on plant genetic diversity
http://slidepdf.com/reader/full/using-molecular-marker-technology-in-studies-on-plant-genetic-diversity 143/374
Copyright: IPGRI and Cornell University, 2003 RFLPs 31
31
The cassette is wrapped, or sealed with tape, and stored in a freezer until the film issufficiently exposed, usually 1 to 4 days.
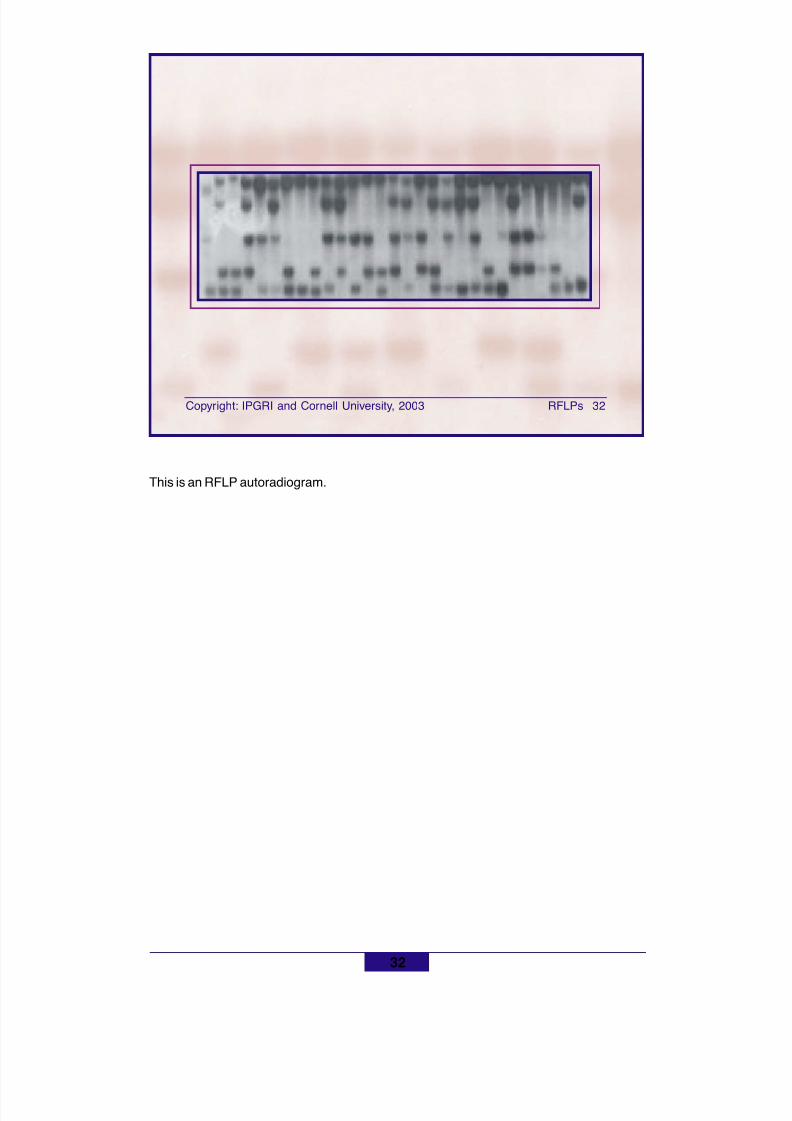
8/11/2019 Using molecular marker technology in studies on plant genetic diversity
http://slidepdf.com/reader/full/using-molecular-marker-technology-in-studies-on-plant-genetic-diversity 144/374
Copyright: IPGRI and Cornell University, 2003 RFLPs 32
32
This is an RFLP autoradiogram.
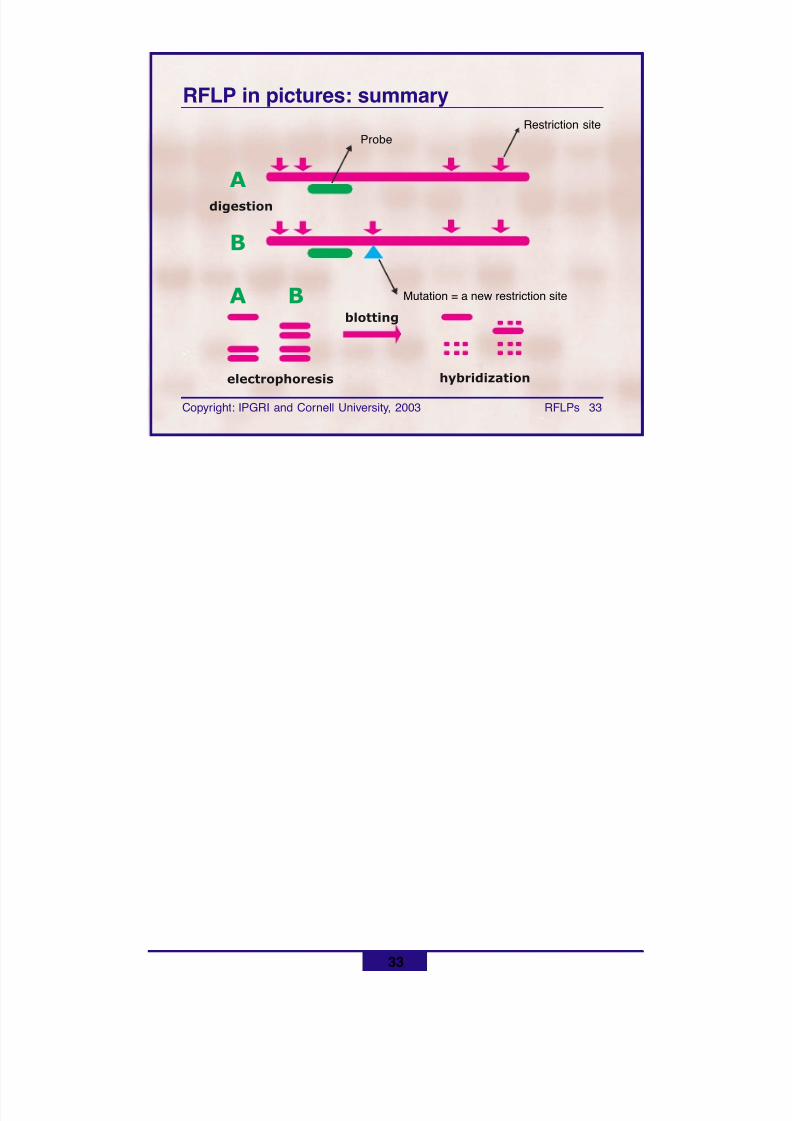
8/11/2019 Using molecular marker technology in studies on plant genetic diversity
http://slidepdf.com/reader/full/using-molecular-marker-technology-in-studies-on-plant-genetic-diversity 145/374
33
Copyright: IPGRI and Cornell University, 2003 RFLPs 33
RFLP in pictures: summary
A
B
A B
digestion
blotting
electrophoresis hybridization
ProbeRestriction site
Mutation = a new restriction site
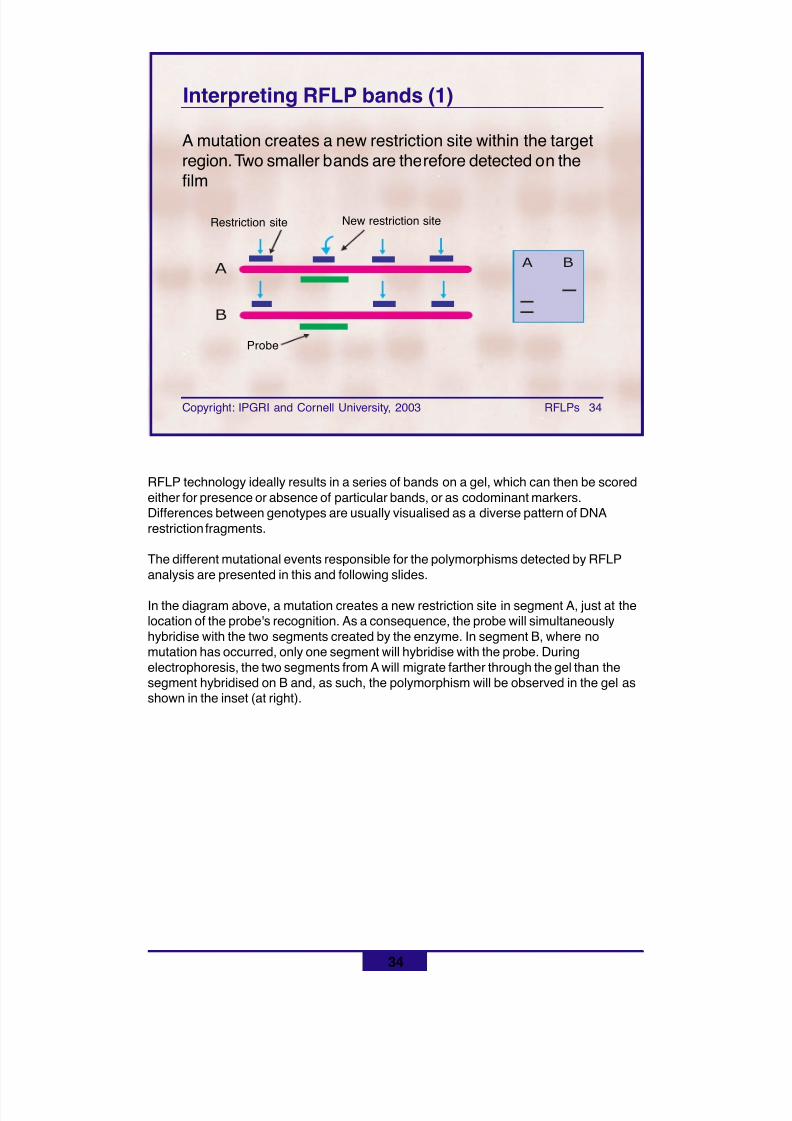
8/11/2019 Using molecular marker technology in studies on plant genetic diversity
http://slidepdf.com/reader/full/using-molecular-marker-technology-in-studies-on-plant-genetic-diversity 146/374
34
Copyright: IPGRI and Cornell University, 2003 RFLPs 34
Interpreting RFLP bands (1)
A mutation creates a new restriction site within the targetregion. Two smaller bands are therefore detected on thefilm
A
B
A B
RFLP technology ideally results in a series of bands on a gel, which can then be scoredeither for presence or absence of particular bands, or as codominant markers.Differences between genotypes are usually visualised as a diverse pattern of DNArestriction fragments.
The different mutational events responsible for the polymorphisms detected by RFLPanalysis are presented in this and following slides.
In the diagram above, a mutation creates a new restriction site in segment A, just at thelocation of the probe's recognition. As a consequence, the probe will simultaneouslyhybridise with the two segments created by the enzyme. In segment B, where nomutation has occurred, only one segment will hybridise with the probe. Duringelectrophoresis, the two segments from A will migrate farther through the gel than thesegment hybridised on B and, as such, the polymorphism will be observed in the gel asshown in the inset (at right).
Restriction site
Probe
New restriction site
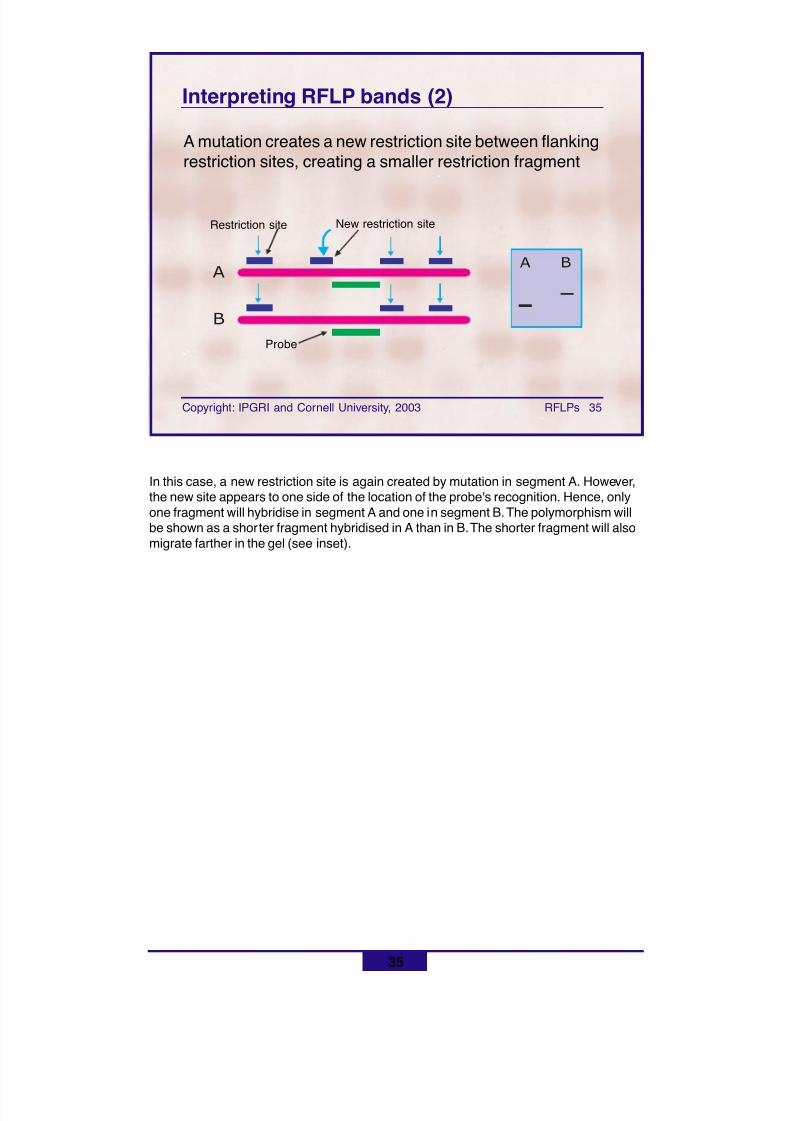
8/11/2019 Using molecular marker technology in studies on plant genetic diversity
http://slidepdf.com/reader/full/using-molecular-marker-technology-in-studies-on-plant-genetic-diversity 147/374
35
Copyright: IPGRI and Cornell University, 2003 RFLPs 35
Interpreting RFLP bands (2)
A mutation creates a new restriction site between flankingrestriction sites, creating a smaller restriction fragment
A
B
A B
Restriction site
Probe
In this case, a new restriction site is again created by mutation in segment A. However,the new site appears to one side of the location of the probe's recognition. Hence, onlyone fragment will hybridise in segment A and one in segment B. The polymorphism willbe shown as a shorter fragment hybridised in A than in B. The shorter fragment will alsomigrate farther in the gel (see inset).
New restriction site
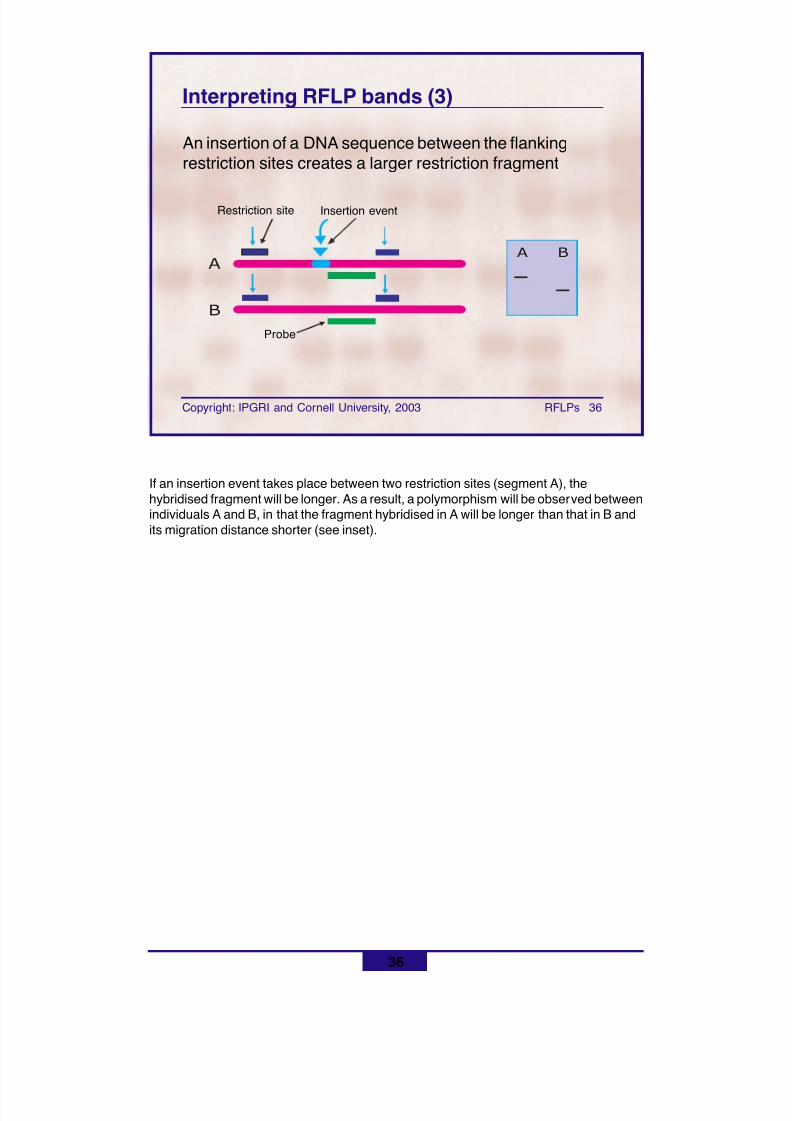
8/11/2019 Using molecular marker technology in studies on plant genetic diversity
http://slidepdf.com/reader/full/using-molecular-marker-technology-in-studies-on-plant-genetic-diversity 148/374
36
Copyright: IPGRI and Cornell University, 2003 RFLPs 36
Interpreting RFLP bands (3)
An insertion of a DNA sequence between the flankingrestriction sites creates a larger restriction fragment
A BA
B
Restriction site
Probe
If an insertion event takes place between two restriction sites (segment A), thehybridised fragment will be longer. As a result, a polymorphism will be observed betweenindividuals A and B, in that the fragment hybridised in A will be longer than that in B andits migration distance shorter (see inset).
Insertion event
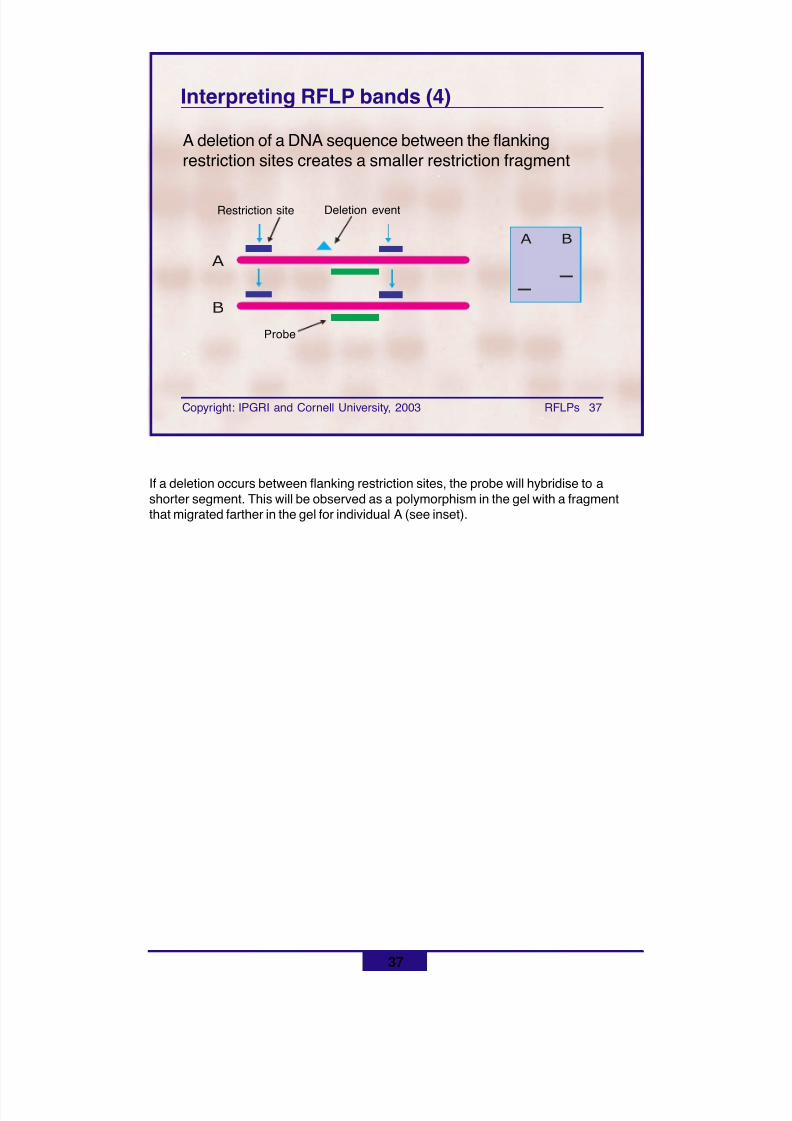
8/11/2019 Using molecular marker technology in studies on plant genetic diversity
http://slidepdf.com/reader/full/using-molecular-marker-technology-in-studies-on-plant-genetic-diversity 149/374
37
Copyright: IPGRI and Cornell University, 2003 RFLPs 37
Interpreting RFLP bands (4)
A deletion of a DNA sequence between the flankingrestriction sites creates a smaller restriction fragment
A B
A
B
Restriction site
Probe
If a deletion occurs between flanking restriction sites, the probe will hybridise to ashorter segment. This will be observed as a polymorphism in the gel with a fragmentthat migrated farther in the gel for individual A (see inset).
Deletion event
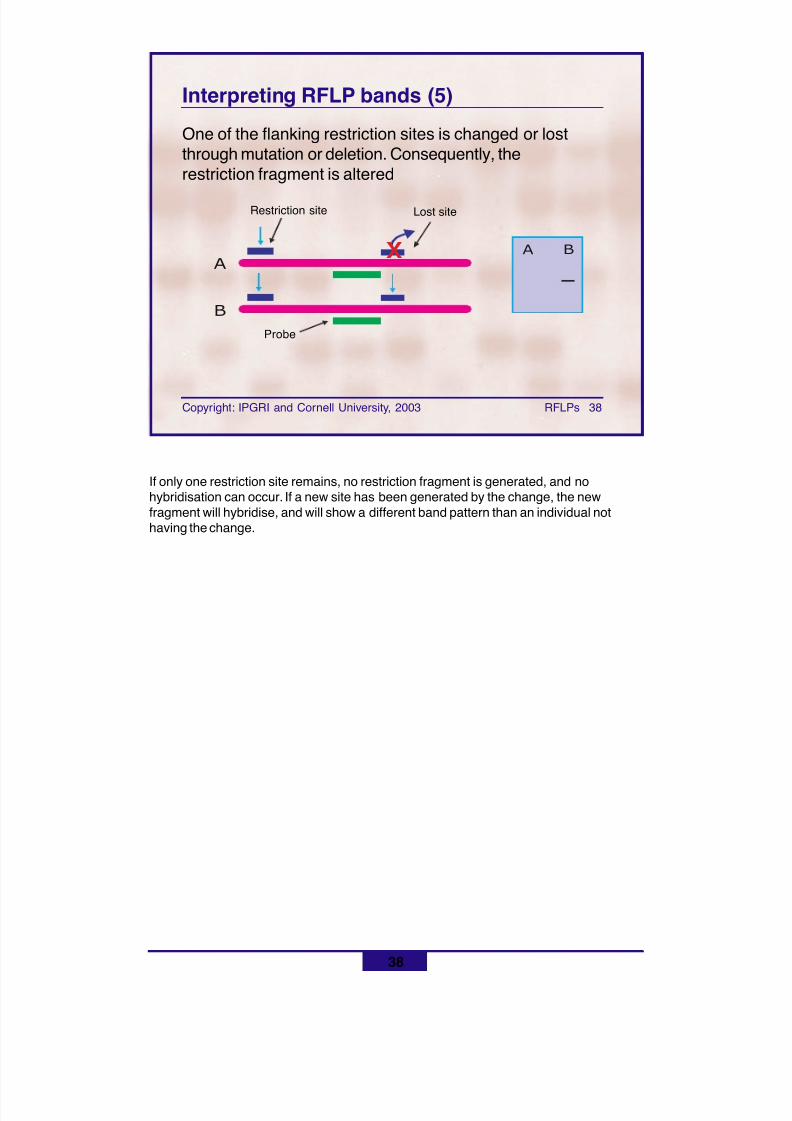
8/11/2019 Using molecular marker technology in studies on plant genetic diversity
http://slidepdf.com/reader/full/using-molecular-marker-technology-in-studies-on-plant-genetic-diversity 150/374
38
Copyright: IPGRI and Cornell University, 2003 RFLPs 38
Interpreting RFLP bands (5)
One of the flanking restriction sites is changed or lostthrough mutation or deletion. Consequently, therestriction fragment is altered
A BA
B
X
If only one restriction site remains, no restriction fragment is generated, and nohybridisation can occur. If a new site has been generated by the change, the newfragment will hybridise, and will show a different band pattern than an individual nothaving the change.
Restriction site
Probe
Lost site
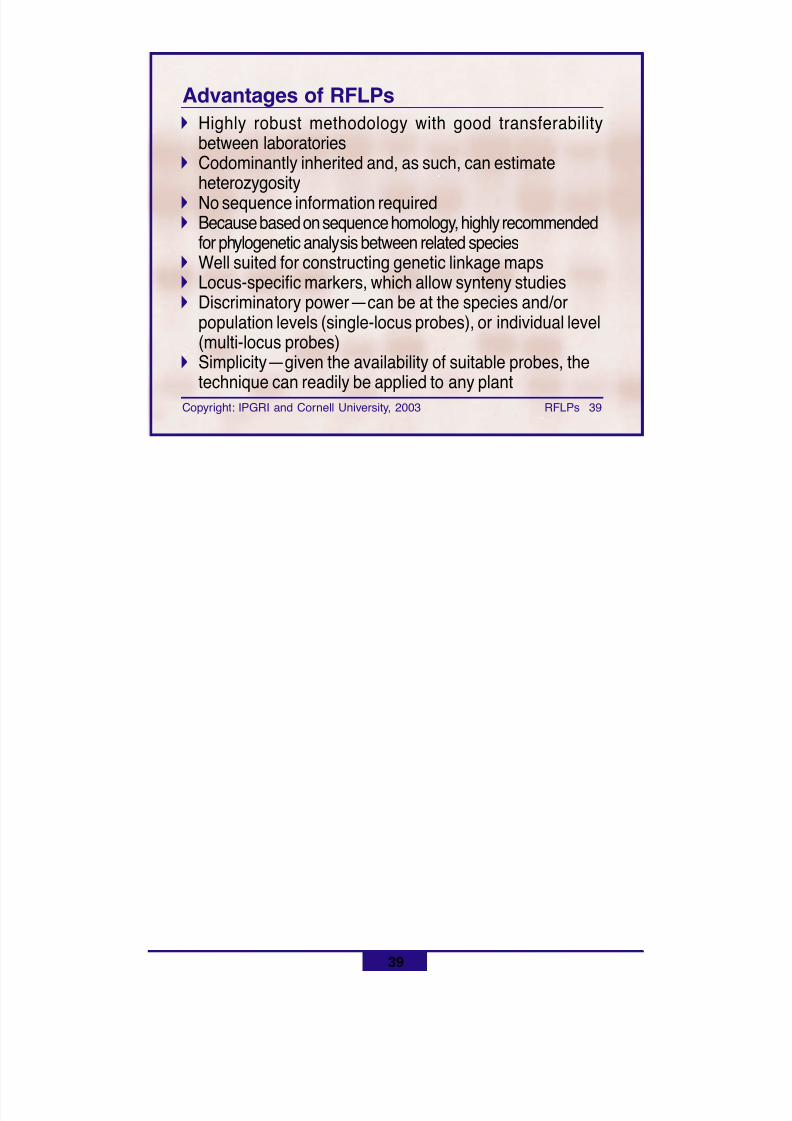
8/11/2019 Using molecular marker technology in studies on plant genetic diversity
http://slidepdf.com/reader/full/using-molecular-marker-technology-in-studies-on-plant-genetic-diversity 151/374
39
Copyright: IPGRI and Cornell University, 2003 RFLPs 39
Advantages of RFLPs! Highly robust methodology with good transferability
between laboratories! Codominantly inherited and, as such, can estimate
heterozygosity! No sequence information required! Because based on sequence homology, highly recommended
for phylogenetic analysis between related species! Well suited for constructing genetic linkage maps! Locus-specific markers, which allow synteny studies! Discriminatory power—can be at the species and/or
population levels (single-locus probes), or individual level(multi-locus probes)
! Simplicity—given the availability of suitable probes, thetechnique can readily be applied to any plant
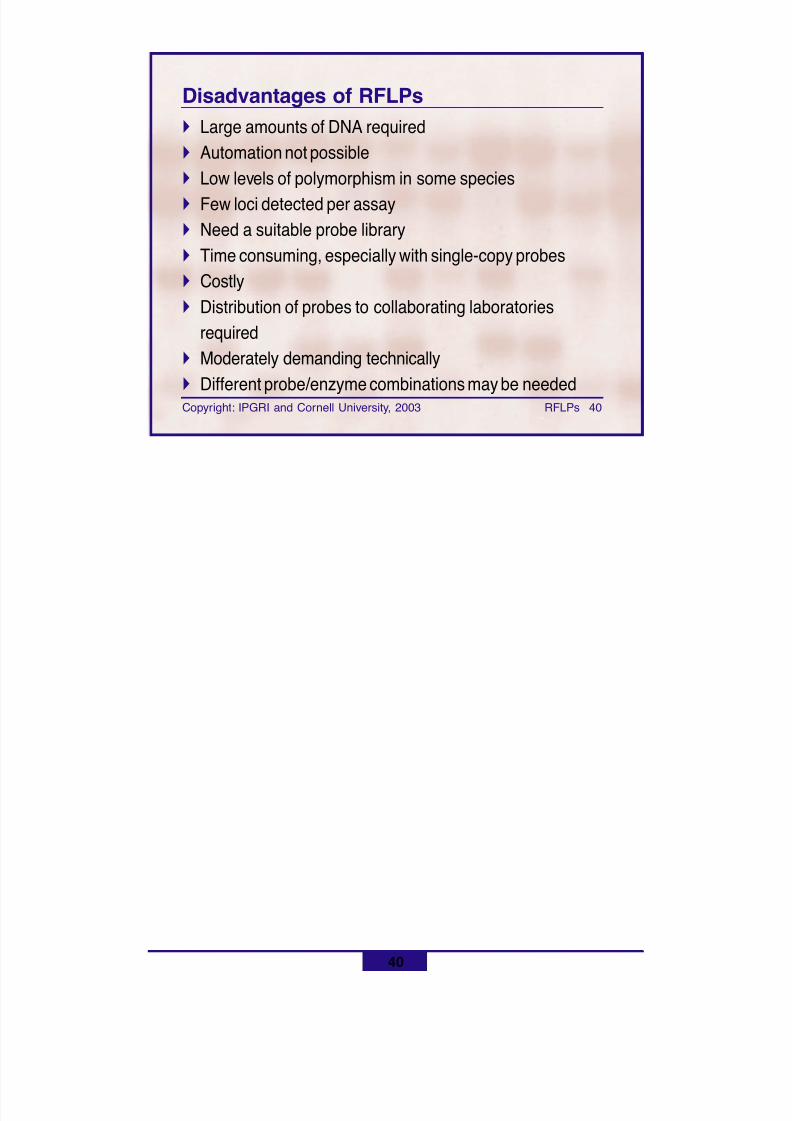
8/11/2019 Using molecular marker technology in studies on plant genetic diversity
http://slidepdf.com/reader/full/using-molecular-marker-technology-in-studies-on-plant-genetic-diversity 152/374
40
Copyright: IPGRI and Cornell University, 2003 RFLPs 40
Disadvantages of RFLPs! Large amounts of DNA required! Automation not possible! Low levels of polymorphism in some species! Few loci detected per assay! Need a suitable probe library! Time consuming, especially with single-copy probes! Costly! Distribution of probes to collaborating laboratories
required! Moderately demanding technically!
Different probe/enzyme combinations may be needed
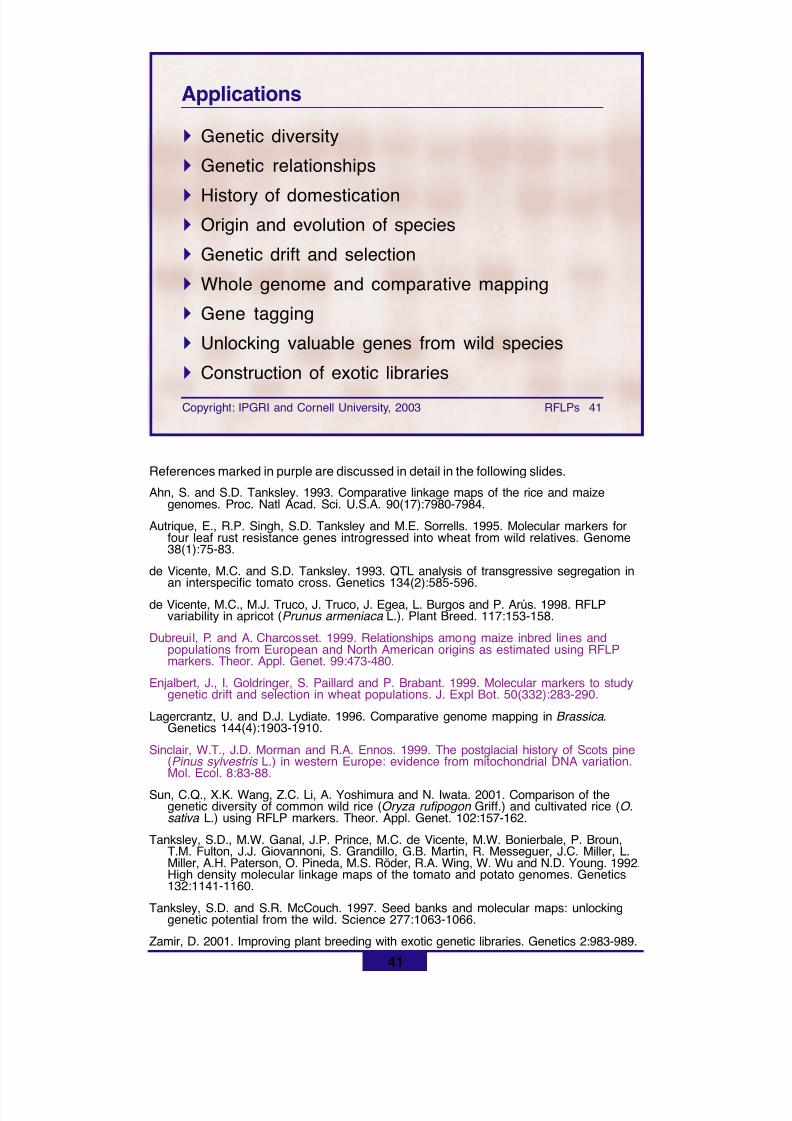
8/11/2019 Using molecular marker technology in studies on plant genetic diversity
http://slidepdf.com/reader/full/using-molecular-marker-technology-in-studies-on-plant-genetic-diversity 153/374
41
Copyright: IPGRI and Cornell University, 2003 RFLPs 41
Applications
! Genetic diversity! Genetic relationships
! History of domestication! Origin and evolution of species! Genetic drift and selection! Whole genome and comparative mapping! Gene tagging! Unlocking valuable genes from wild species! Construction of exotic libraries
References marked in purple are discussed in detail in the following slides.
Ahn, S. and S.D. Tanksley. 1993. Comparative linkage maps of the rice and maizegenomes. Proc. Natl Acad. Sci. U.S.A. 90(17):7980-7984.
Autrique, E., R.P. Singh, S.D. Tanksley and M.E. Sorrells. 1995. Molecular markers forfour leaf rust resistance genes introgressed into wheat from wild relatives. Genome38(1):75-83.
de Vicente, M.C. and S.D. Tanksley. 1993. QTL analysis of transgressive segregation in
an interspecific tomato cross. Genetics 134(2):585-596.de Vicente, M.C., M.J. Truco, J. Truco, J. Egea, L. Burgos and P. Arús. 1998. RFLP
variability in apricot ( Prunus armeniaca L.). Plant Breed. 117:153-158.
Dubreuil, P. and A. Charcosset. 1999. Relationships among maize inbred lines andpopulations from European and North American origins as estimated using RFLPmarkers. Theor. Appl. Genet. 99:473-480.
Enjalbert, J., I. Goldringer, S. Paillard and P. Brabant. 1999. Molecular markers to studygenetic drift and selection in wheat populations. J. Expl Bot. 50(332):283-290.
Lagercrantz, U. and D.J. Lydiate. 1996. Comparative genome mapping in Brassica .Genetics 144(4):1903-1910.
Sinclair, W.T., J.D. Morman and R.A. Ennos. 1999. The postglacial history of Scots pine(Pinus sylvestris L.) in western Europe: evidence from mitochondrial DNA variation.Mol. Ecol. 8:83-88.
Sun, C.Q., X.K. Wang, Z.C. Li, A. Yoshimura and N. Iwata. 2001. Comparison of thegenetic diversity of common wild rice ( Oryza rufipogon Griff.) and cultivated rice ( O.sativa L.) using RFLP markers. Theor. Appl. Genet. 102:157-162.
Tanksley, S.D., M.W. Ganal, J.P. Prince, M.C. de Vicente, M.W. Bonierbale, P. Broun,T.M. Fulton, J.J. Giovannoni, S. Grandillo, G.B. Martin, R. Messeguer, J.C. Miller, L.Miller, A.H. Paterson, O. Pineda, M.S. Röder, R.A. Wing, W. Wu and N.D. Young. 1992.High density molecular linkage maps of the tomato and potato genomes. Genetics132:1141-1160.
Tanksley, S.D. and S.R. McCouch. 1997. Seed banks and molecular maps: unlockinggenetic potential from the wild. Science 277:1063-1066.
Zamir, D. 2001. Improving plant breeding with exotic genetic libraries. Genetics 2:983-989.
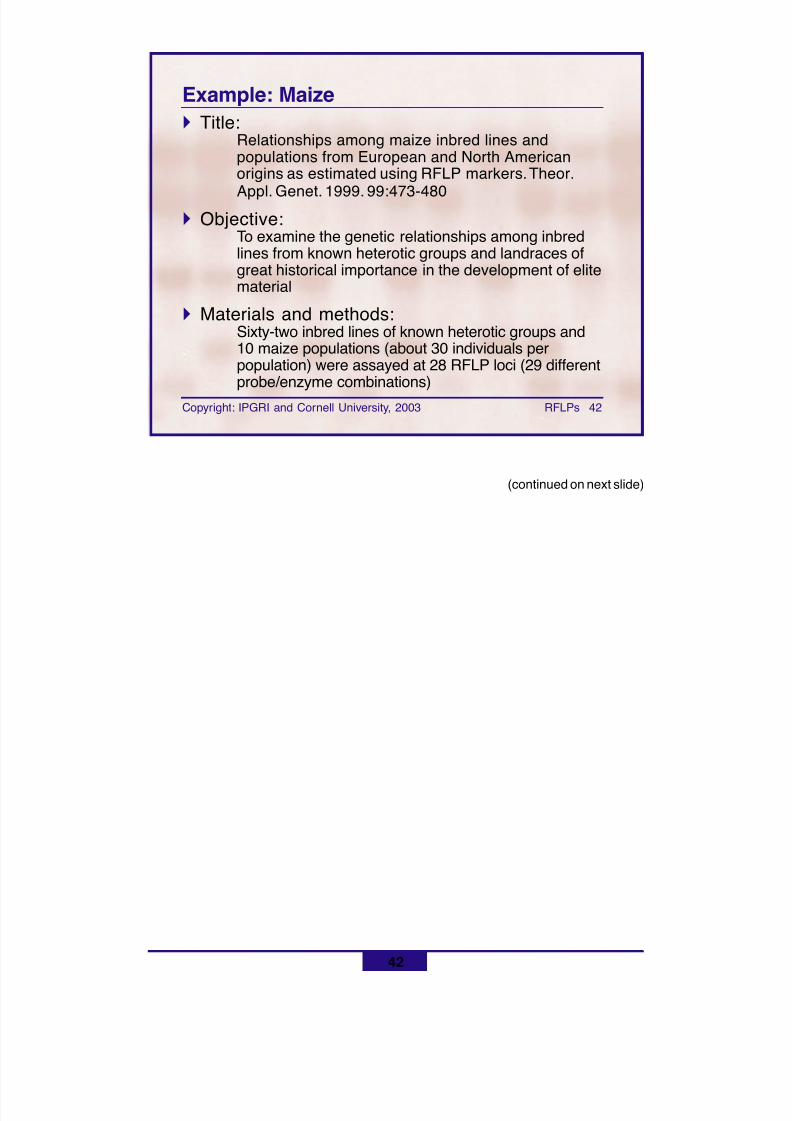
8/11/2019 Using molecular marker technology in studies on plant genetic diversity
http://slidepdf.com/reader/full/using-molecular-marker-technology-in-studies-on-plant-genetic-diversity 154/374
42
Copyright: IPGRI and Cornell University, 2003 RFLPs 42
Example: Maize! Title:
Relationships among maize inbred lines andpopulations from European and North Americanorigins as estimated using RFLP markers. Theor.
Appl. Genet. 1999. 99:473-480! Objective:
To examine the genetic relationships among inbredlines from known heterotic groups and landraces ofgreat historical importance in the development of elitematerial
! Materials and methods:Sixty-two inbred lines of known heterotic groups and10 maize populations (about 30 individuals perpopulation) were assayed at 28 RFLP loci (29 differentprobe/enzyme combinations)
(continued on next slide)
8/11/2019 Using molecular marker technology in studies on plant genetic diversity
http://slidepdf.com/reader/full/using-molecular-marker-technology-in-studies-on-plant-genetic-diversity 155/374
43
Copyright: IPGRI and Cornell University, 2003 RFLPs 43
Example: Maize (continued)
Results:Comparing alleles specific to each type of germplasmshowed a deficit of alleles within lines accounting for about
22% of the total allelic richness of the populations:• Associations among inbreds and populations proved
consistent with pedigree data of the inbreds andprovided new information on the genetic basis ofheterotic groups
• European flint inbreds were revealed to be as close tothe north-eastern U.S. flint population studied as tothe typical European populations
(continued on next slide)
8/11/2019 Using molecular marker technology in studies on plant genetic diversity
http://slidepdf.com/reader/full/using-molecular-marker-technology-in-studies-on-plant-genetic-diversity 156/374
44
Copyright: IPGRI and Cornell University, 2003 RFLPs 44
Examples: Maize (continued)
! Discussion:The populations represent significant reservoirs ofdiversity, and elite germplasm is not likely to contain alluseful alleles
Question : How can the European heterotic group becloser to the nor th-eastern U.S. flint 'Compton's Early'populations than to other U.S. populations?
! Conclusions:Results suggest that a larger set of populationsshould be studied with molecular markers to developappropriate strategies for the most effective use of thesegenetic resources in breeding programs
8/11/2019 Using molecular marker technology in studies on plant genetic diversity
http://slidepdf.com/reader/full/using-molecular-marker-technology-in-studies-on-plant-genetic-diversity 157/374
45
Copyright: IPGRI and Cornell University, 2003 RFLPs 45
Example: Wheat
! Title:Molecular markers to study genetic drift and selection inwheat populations. J. Expl. Bot. 1999. 50(332):283-290
! Objective:To compare allelic frequencies in wheat populations thathave been subjected to natural selection
! Materials and methods:Two initial populations and six derived subpopulationscultivated for 10 years in contrasting sites were studiedat 30 loci
(continued on next slide)
8/11/2019 Using molecular marker technology in studies on plant genetic diversity
http://slidepdf.com/reader/full/using-molecular-marker-technology-in-studies-on-plant-genetic-diversity 158/374
46
Copyright: IPGRI and Cornell University, 2003 RFLPs 46
Examples: Wheat (continued)
! Results and discussion:Differentiation between subpopulations based on RFLPdiversity was highly significant:• Allelic frequency variation was found to be much
greater than expected under genetic drift only.Selection greatly influenced the evolution ofpopulations
• Some loci revealed higher differentiation than other.This may have indicated that they were geneticallylinked to other polymorphic loci involved in adaptation
! Conclusions:Variations of allelic frequencies observed for the RFLPmarkers cannot be explained by evolution under geneticdrift only but by direct or indirect effects of selection
8/11/2019 Using molecular marker technology in studies on plant genetic diversity
http://slidepdf.com/reader/full/using-molecular-marker-technology-in-studies-on-plant-genetic-diversity 159/374
47
Copyright: IPGRI and Cornell University, 2003 RFLPs 47
Examples: Scots pine! Title:
The postglacial history of Scots pine ( Pinus sylvestris L.)in western Europe: evidence from mitochondrial DNAvariation. Mol. Ecol. 1999. 8:83-888
! Objective:To investigate the geographical structure of mitochondrialDNA variants in western European populations of Scotspine
! Materials and methods:Twenty populations of P. sylvestris from Scotland and 18from continental Europe (an average of 21 individualsper population) were studied, using RFLP analysis oftotal DNA
(continued on next slide)
8/11/2019 Using molecular marker technology in studies on plant genetic diversity
http://slidepdf.com/reader/full/using-molecular-marker-technology-in-studies-on-plant-genetic-diversity 160/374
48
Copyright: IPGRI and Cornell University, 2003 RFLPs 48
Example: Scots pine (continued)
! Results:Three major mtDNA RFLP patterns (mitotypes a, b, and d)were detected:
• Within Spain, all three mitotypes were found. Gene diversity washigh, being distributed predominantly among, rather than within,populations. Mitotype d was present only in the southernmostpopulation (Sierra Nevada, Spain)
• Italian populations were fixed for mitotype b. Populations fromnorthern France, Germany, Poland, Russia and southern Swedenwere fixed for mitotype a. Populations in northern Fennoscandia(Norway, Sweden and Finland) were fixed for mitotype b
• In Scotland, mitotype a was largely fixed. Mitotype b was presentin some polymorphic populations
(continued on next slide)
8/11/2019 Using molecular marker technology in studies on plant genetic diversity
http://slidepdf.com/reader/full/using-molecular-marker-technology-in-studies-on-plant-genetic-diversity 161/374
49
Copyright: IPGRI and Cornell University, 2003 RFLPs 49
Example: Scots pine (continued)
! Discussion:• The detection of different mitoypes was unequivocal
proof of genetic differences in the mtDNA genome.The diversity of mitotypes in Spanish populationsindicates that these either descend from survivors inrefugia during the last glaciation or represent Tertiaryrelics that have survived as isolated populations
• In Europe, after glaciation, P. sylvestris apparentlybegan developing in at least three evolutionarydirections, each of which had a different origin —Spain,north central Europe and northern Fennoscandia
! Conclusions:Studies of maternally inherited mtDNA markers canprovide useful insights into the history of species andhelp define geographical areas with germplasm that maybe conserved
8/11/2019 Using molecular marker technology in studies on plant genetic diversity
http://slidepdf.com/reader/full/using-molecular-marker-technology-in-studies-on-plant-genetic-diversity 162/374
50
Copyright: IPGRI and Cornell University, 2003 RFLPs 50
In summary
! The RFLP technology detects length changes in targetDNA molecules after restriction enzyme digestion
! RFLP bands are detected by hybridising the target DNAwith a DNA probe
! RFLP banding patterns reflect different mutational eventsat the hybridisation site of the probe or its neighbouringregion
! RFLP is a highly robust technology, but time consumingand technically demanding
8/11/2019 Using molecular marker technology in studies on plant genetic diversity
http://slidepdf.com/reader/full/using-molecular-marker-technology-in-studies-on-plant-genetic-diversity 163/374
51
Copyright: IPGRI and Cornell University, 2003 RFLPs 51
By now you should know
! Main steps required for detecting RFLPs
! Different sources of probes
! The effect of different mutational events ondetecting RFLP banding patterns
! The advantages and disadvantages of the RFLPtechnology for genetic diversity analysis
8/11/2019 Using molecular marker technology in studies on plant genetic diversity
http://slidepdf.com/reader/full/using-molecular-marker-technology-in-studies-on-plant-genetic-diversity 164/374
Basic references
Botstein, D., R.L. White, M. Skolnick and R.W. Davis. 1980. Construction of a geneticlinkage map in man using restriction fragment length polymorphisms. Am. J. HumanGenet. 32:314-331.
Griffiths, A.J.F., J.H. Miller, D.T. Suzuki, R.C. Lewontin and W.M. Gelbart. 1996. An
introduction to genetic analysis (6th edn.). W.H. Freeman and Co., NY.
Jeffreys, A.J., V. Wilson and S.L. Thein.1985a. Hypervariable 'minisatellite' regions inhuman DNA. Nature 314:67-73.
Jeffreys, A.J., V. Wilson and S.L.Thein.1985b. Individual-specific "fingerprints" of humanDNA. Nature 316:76-79.
Nakamura, Y., M. Leppert, P. O'Connell, R. Wolff, T. Holm, M. Culver, C. Martin, E.Fujimoto, M. Hoff, E. Kumlin and R. White. 1987. Variable Number of Tandem Repeat(VNTR) markers for human gene mapping. Science 235:1616-1622.
Rogstad, S.H., J.C. Patton, II and B.A. Schaal. 1988. M13 repeat probe detects DNAminisatellite-like sequences in gymnosperms and angiosperms. Proc. Natl Acad. Sci.U.S.A. 85:9176-9178.
Ryskov, A.P., A.G. Jincharadze, M.I. Prosnyak, P.L. Ivanov and S.A. Limborska. 1988.M13 phage DNA as a universal marker for DNA fingerprinting of animals, plants andmicroorganisms. FEBS Lett. 233:388-392.
Southern, E.M. 1975. Detection of specific sequences among DNA fragments separatedby electrophoresis. J. Mol. Biol. 98: 503-517.
52
8/11/2019 Using molecular marker technology in studies on plant genetic diversity
http://slidepdf.com/reader/full/using-molecular-marker-technology-in-studies-on-plant-genetic-diversity 165/374
53
Copyright: IPGRI and Cornell University, 2003 RFLPs 53
NextDNA-based technologies
PCR-based technologiesPCR basics
! DNA-based technologies• PCR-based technologies
• PCR with arbitrary primers• Amplified fragment length polymorphisms (AFLPs)• Sequences-tagged sites (STS)• Latest strategies
! Complementary technologies! Final considerations! Glossary
8/11/2019 Using molecular marker technology in studies on plant genetic diversity
http://slidepdf.com/reader/full/using-molecular-marker-technology-in-studies-on-plant-genetic-diversity 166/374
Using molecular marker technologyin studies on plant geneticdiversity
IV PCR-based technologies
j~áå ãÉåì
8/11/2019 Using molecular marker technology in studies on plant genetic diversity
http://slidepdf.com/reader/full/using-molecular-marker-technology-in-studies-on-plant-genetic-diversity 167/374
Using molecular marker technology instudies on plant genetic diversity
DNA-based technologies
PCR-based technologiesPCR basics
Copyright: IPGRI and Cornell University, 2003 PCR basics 1
8/11/2019 Using molecular marker technology in studies on plant genetic diversity
http://slidepdf.com/reader/full/using-molecular-marker-technology-in-studies-on-plant-genetic-diversity 168/374
2
Copyright: IPGRI and Cornell University, 2003 PCR basics 2
Contents
! The polymerase chain reaction
! PCR procedures:• Steps• Cycle 1• Cycle 2• Cycle 3• Conditions for cycling• Conditions for the reaction mixture• Components• Equipment
! PCR technology in pictures
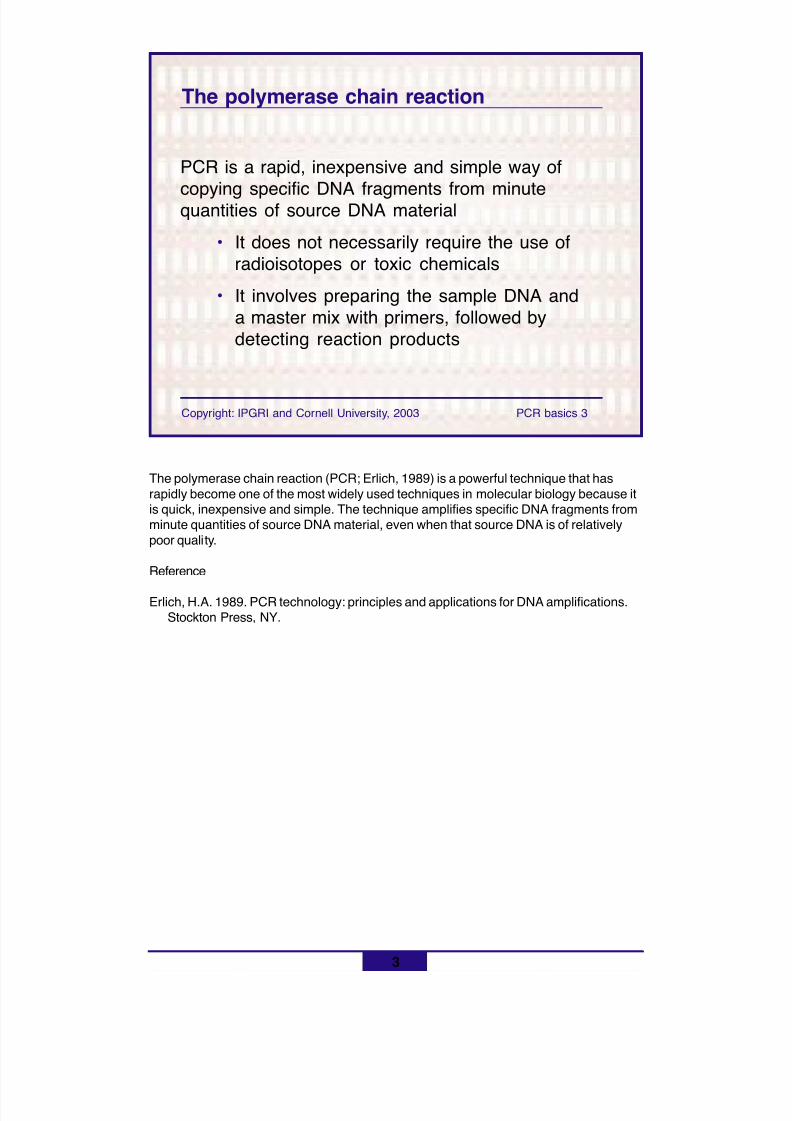
8/11/2019 Using molecular marker technology in studies on plant genetic diversity
http://slidepdf.com/reader/full/using-molecular-marker-technology-in-studies-on-plant-genetic-diversity 169/374
3
Copyright: IPGRI and Cornell University, 2003 PCR basics 3
PCR is a rapid, inexpensive and simple way of
copying specific DNA fragments from minutequantities of source DNA material
• It does not necessarily require the use ofradioisotopes or toxic chemicals
• It involves preparing the sample DNA anda master mix with primers, followed bydetecting reaction products
The polymerase chain reaction
The polymerase chain reaction (PCR; Erlich, 1989) is a powerful technique that hasrapidly become one of the most widely used techniques in molecular biology because itis quick, inexpensive and simple. The technique amplifies specific DNA fragments fromminute quantities of source DNA material, even when that source DNA is of relativelypoor quality.
Reference
Erlich, H.A. 1989. PCR technology: principles and applications for DNA amplifications.Stockton Press, NY.
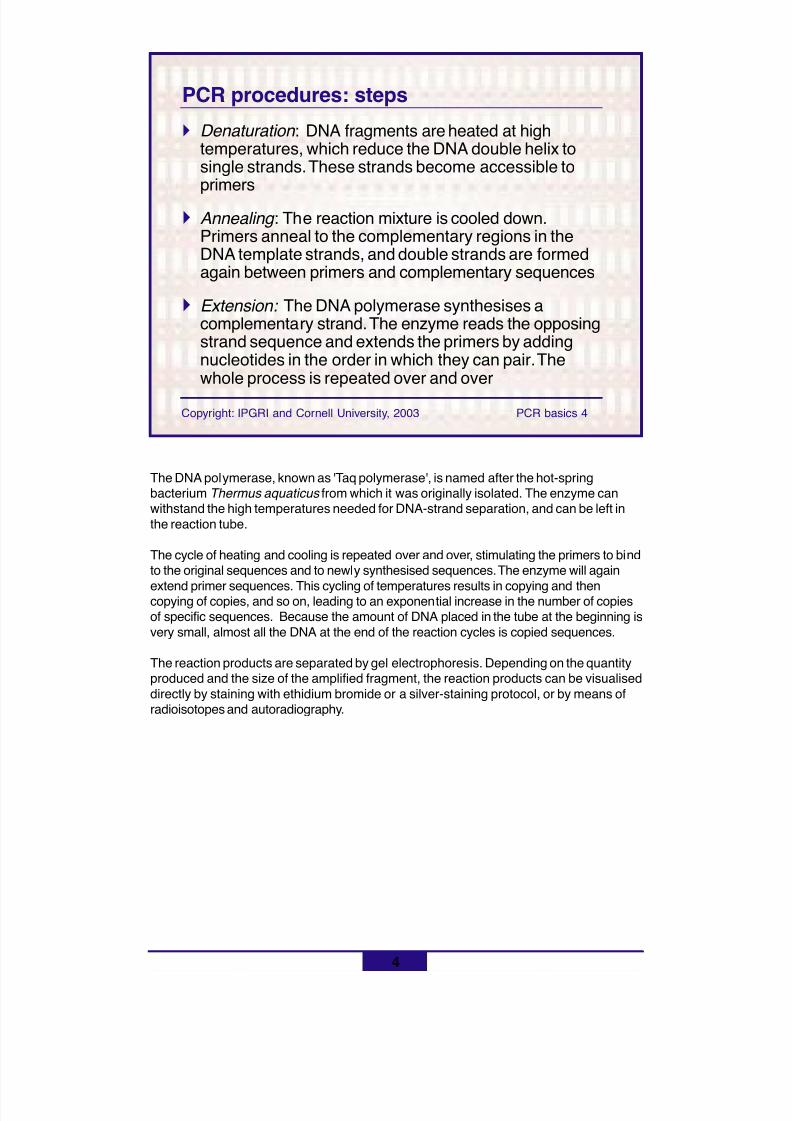
8/11/2019 Using molecular marker technology in studies on plant genetic diversity
http://slidepdf.com/reader/full/using-molecular-marker-technology-in-studies-on-plant-genetic-diversity 170/374
4
Copyright: IPGRI and Cornell University, 2003 PCR basics 4
PCR procedures: steps
The DNA polymerase, known as 'Taq polymerase', is named after the hot-springbacterium Thermus aquaticus from which it was originally isolated. The enzyme canwithstand the high temperatures needed for DNA-strand separation, and can be left inthe reaction tube.
The cycle of heating and cooling is repeated over and over, stimulating the primers to bindto the original sequences and to newly synthesised sequences. The enzyme will again
extend primer sequences. This cycling of temperatures results in copying and thencopying of copies, and so on, leading to an exponential increase in the number of copiesof specific sequences. Because the amount of DNA placed in the tube at the beginning isvery small, almost all the DNA at the end of the reaction cycles is copied sequences.
The reaction products are separated by gel electrophoresis. Depending on the quantityproduced and the size of the amplified fragment, the reaction products can be visualiseddirectly by staining with ethidium bromide or a silver-staining protocol, or by means ofradioisotopes and autoradiography.
! Denaturation : DNA fragments are heated at hightemperatures, which reduce the DNA double helix tosingle strands. These strands become accessible toprimers
! Annealing : The reaction mixture is cooled down.Primers anneal to the complementary regions in theDNA template strands, and double strands are formedagain between primers and complementary sequences
! Extension: The DNA polymerase synthesises acomplementary strand. The enzyme reads the opposingstrand sequence and extends the primers by addingnucleotides in the order in which they can pair. Thewhole process is repeated over and over
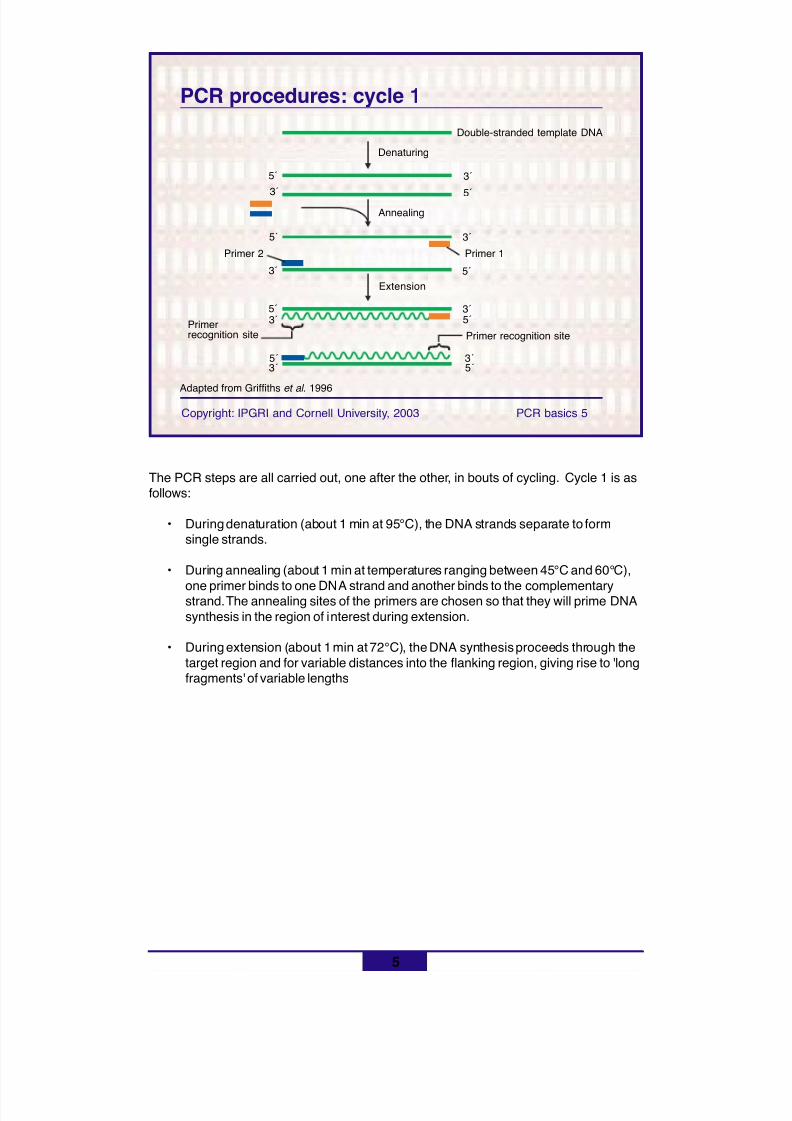
8/11/2019 Using molecular marker technology in studies on plant genetic diversity
http://slidepdf.com/reader/full/using-molecular-marker-technology-in-studies-on-plant-genetic-diversity 171/374
5
Copyright: IPGRI and Cornell University, 2003 PCR basics 5
PCR procedures: cycle 1
The PCR steps are all carried out, one after the other, in bouts of cycling. Cycle 1 is asfollows:
• During denaturation (about 1 min at 95°C), the DNA strands separate to formsingle strands.
• During annealing (about 1 min at temperatures ranging between 45°C and 60°C),
one primer binds to one DNA strand and another binds to the complementarystrand. The annealing sites of the primers are chosen so that they will prime DNAsynthesis in the region of interest during extension.
• During extension (about 1 min at 72°C), the DNA synthesis proceeds through thetarget region and for variable distances into the flanking region, giving rise to 'longfragments' of variable lengths
Double-stranded template DNA
5´ 3´
3´ 5´
Denaturing
Annealing
Extension
Primer 1Primer 2
5´ 3´
5´ 3´
3´ 5´
3´ 5´
3´ 5´5´ 3´
Primer recognition sitePrimerrecognition site
Adapted from Griffiths et al. 1996
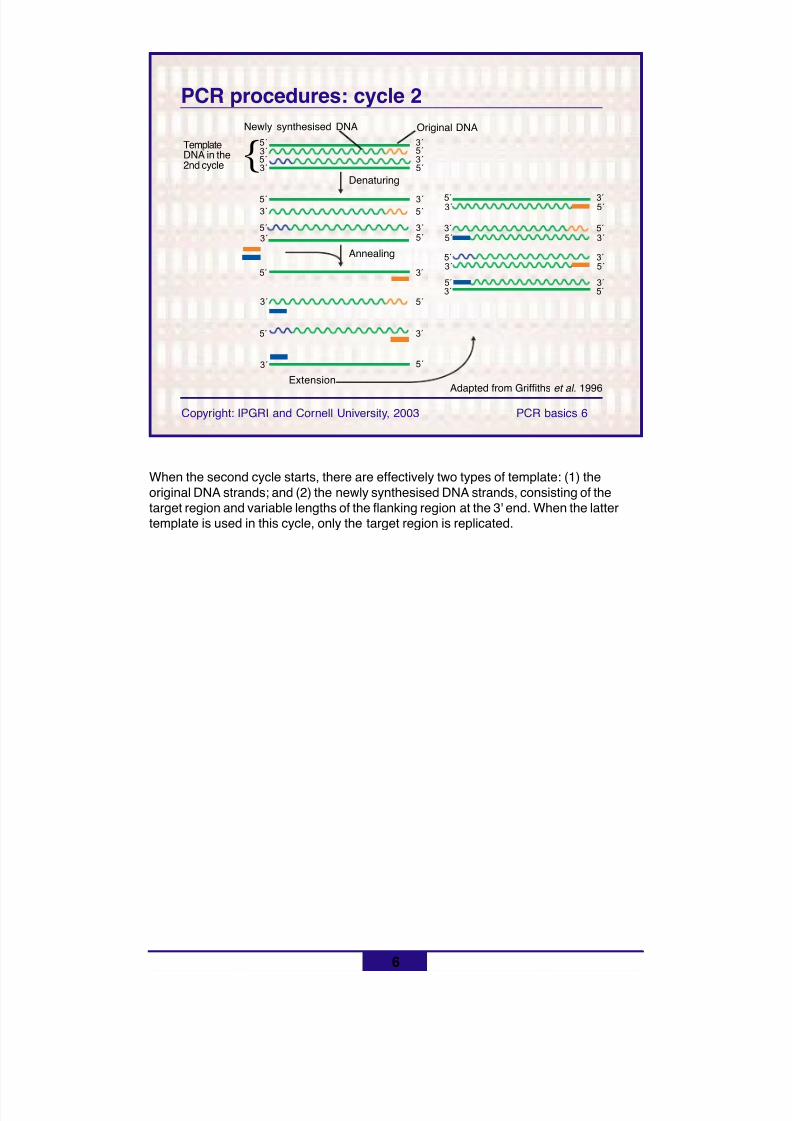
8/11/2019 Using molecular marker technology in studies on plant genetic diversity
http://slidepdf.com/reader/full/using-molecular-marker-technology-in-studies-on-plant-genetic-diversity 172/374
6
Copyright: IPGRI and Cornell University, 2003 PCR basics 6
PCR procedures: cycle 2
When the second cycle starts, there are effectively two types of template: (1) theoriginal DNA strands; and (2) the newly synthesised DNA strands, consisting of thetarget region and variable lengths of the flanking region at the 3' end. When the lattertemplate is used in this cycle, only the target region is replicated.
Adapted from Griffiths et al. 1996
Denaturing
Annealing
Extension
5´
Newly synthesised DNA
3´5´3´
3´5´3´5´ }Template
DNA in the2nd cycle
Original DNA
5´
3´
5´3´
3´
5´
3´5´
5´ 3´
3´ 5´
5´ 3´
3´ 5´
5´ 3´5´3´
3´ 5´3´5´
5´ 3´5´3´
5´ 3´3´ 5´
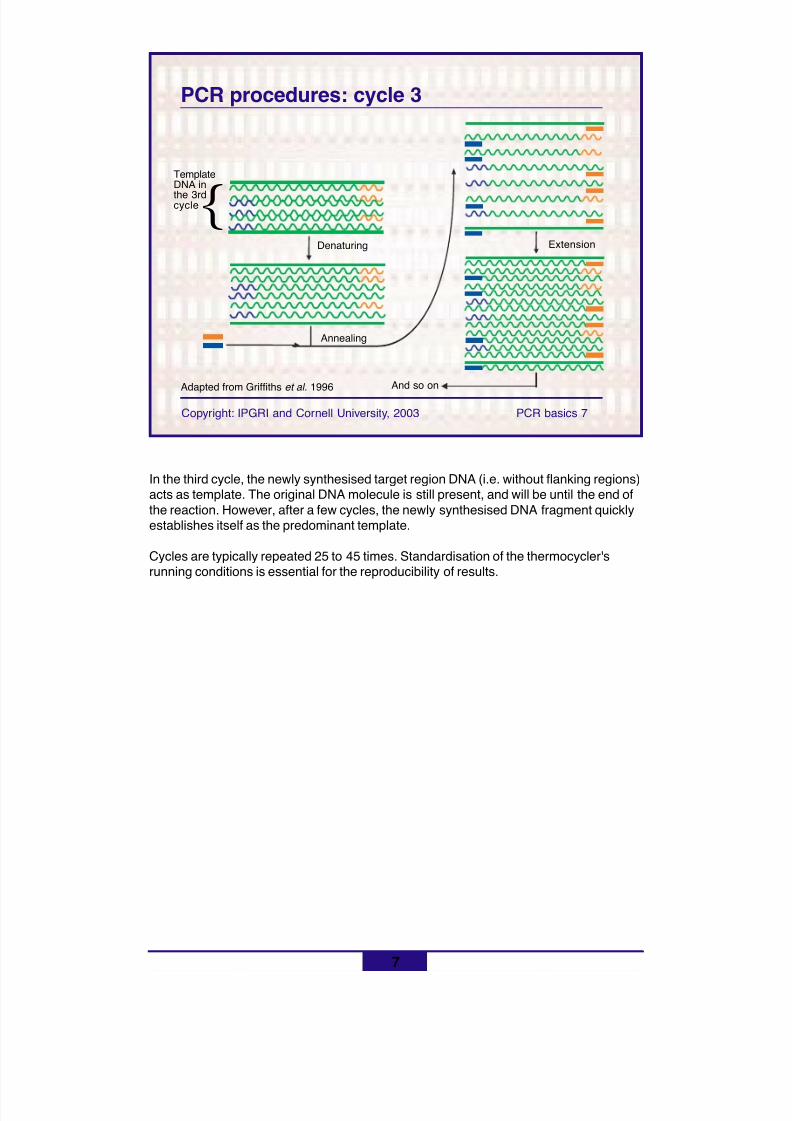
8/11/2019 Using molecular marker technology in studies on plant genetic diversity
http://slidepdf.com/reader/full/using-molecular-marker-technology-in-studies-on-plant-genetic-diversity 173/374
7
Copyright: IPGRI and Cornell University, 2003 PCR basics 7
PCR procedures: cycle 3
In the third cycle, the newly synthesised target region DNA (i.e. without flanking regions)acts as template. The original DNA molecule is still present, and will be until the end ofthe reaction. However, after a few cycles, the newly synthesised DNA fragment quicklyestablishes itself as the predominant template.
Cycles are typically repeated 25 to 45 times. Standardisation of the thermocycler'srunning conditions is essential for the reproducibility of results.
}TemplateDNA inthe 3rdcycle
And so on
Denaturing
Annealing
Extension
Adapted from Griffiths et al. 1996
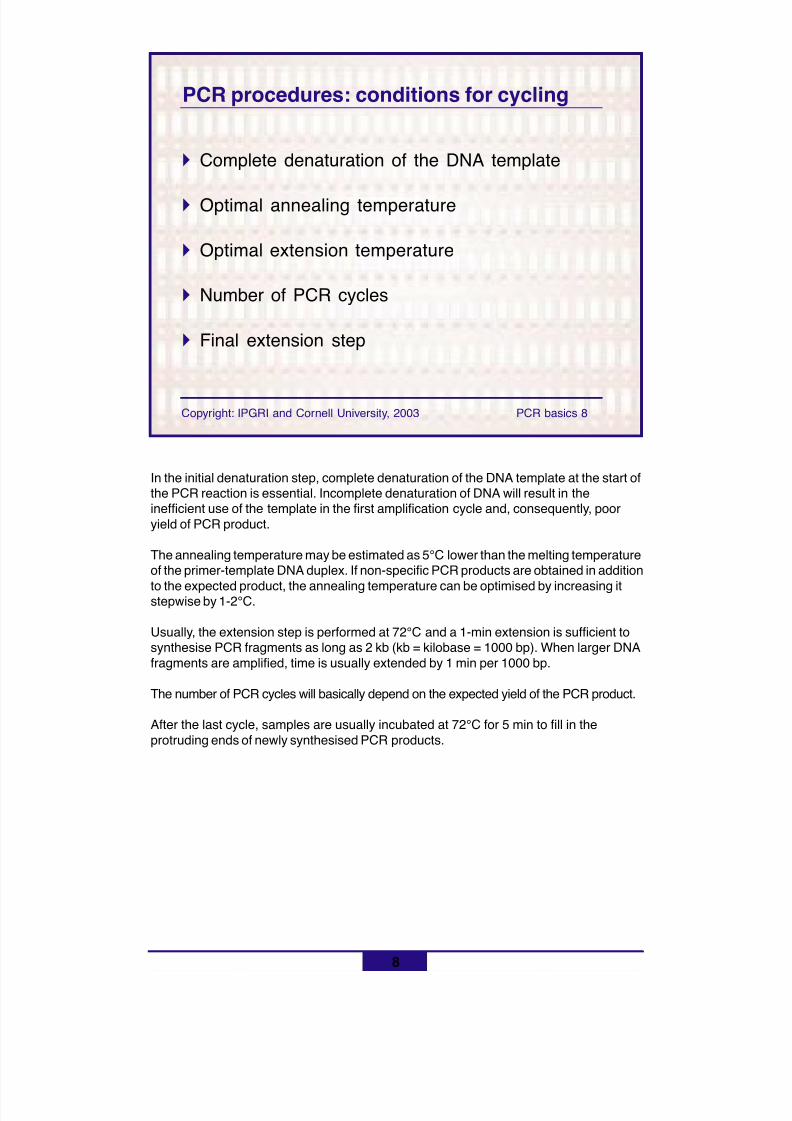
8/11/2019 Using molecular marker technology in studies on plant genetic diversity
http://slidepdf.com/reader/full/using-molecular-marker-technology-in-studies-on-plant-genetic-diversity 174/374
8
Copyright: IPGRI and Cornell University, 2003 PCR basics 8
PCR procedures: conditions for cycling
! Complete denaturation of the DNA template
! Optimal annealing temperature
! Optimal extension temperature
! Number of PCR cycles
! Final extension step
In the initial denaturation step, complete denaturation of the DNA template at the start ofthe PCR reaction is essential. Incomplete denaturation of DNA will result in theinefficient use of the template in the first amplification cycle and, consequently, pooryield of PCR product.
The annealing temperature may be estimated as 5°C lower than the melting temperatureof the primer-template DNA duplex. If non-specific PCR products are obtained in addition
to the expected product, the annealing temperature can be optimised by increasing itstepwise by 1-2°C.
Usually, the extension step is performed at 72°C and a 1-min extension is sufficient tosynthesise PCR fragments as long as 2 kb (kb = kilobase = 1000 bp). When larger DNAfragments are amplified, time is usually extended by 1 min per 1000 bp.
The number of PCR cycles will basically depend on the expected yield of the PCR product.
After the last cycle, samples are usually incubated at 72°C for 5 min to fill in theprotruding ends of newly synthesised PCR products.
8/11/2019 Using molecular marker technology in studies on plant genetic diversity
http://slidepdf.com/reader/full/using-molecular-marker-technology-in-studies-on-plant-genetic-diversity 175/374
9
Copyright: IPGRI and Cornell University, 2003 PCR basics 9
PCR procedures: conditions for thereaction mixture
Contamination of the DNA must be prevented by:
!!!!! Separating the areas for DNA extraction andPCR
!!!!! Using sole-purpose laboratory equipment
!!!!! Autoclaving and aliquoting
!!!!! Adding a control reaction
Some useful tips:
• DNA extraction and PCR reaction mixing and processing should be performed inseparate areas.
• Use of sole-purpose vessels and positive displacement pipettes or tips for DNAsample and reaction mixture preparation is strongly recommended.
• All solutions, except dNTPs, primers and Taq DNA polymerase, should beautoclaved. Where possible, solutions should be aliquoted in small quantities andstored in designated PCR areas.
• A good practice, to confirm absence of contamination, is to add a control reactionwithout template DNA.
8/11/2019 Using molecular marker technology in studies on plant genetic diversity
http://slidepdf.com/reader/full/using-molecular-marker-technology-in-studies-on-plant-genetic-diversity 176/374
10
Copyright: IPGRI and Cornell University, 2003 PCR basics 10
PCR procedures: components
Components:• Sterile deionised water
• 10X PCR buffer• dNTP mix
• Primer
• Taq DNA polymerase
• MgCl2
• Template DNA
Many PCR machines are now available in 48-, 96- or 384-well formats. This, combinedwith the use of multichannel pipettors, can greatly increase the number of reactions thatcan be done simultaneously. If several reactions need to be simultaneously prepared, amaster mix should be used as follows: water, buffer, dNTPs, primers, MgCl 2 and TaqDNA polymerase in a single tube. This will then be aliquoted into individual tubes.
Considerations:
Template DNA. Nearly any standard method is suitable for template DNA purification.An adequate amount of template DNA is between 0.1 and 1 µg for genomic DNA for atotal reaction mixture of 100 µl. Larger template DNA amounts usually increase the yieldof non-specific PCR products.
Primers. (1) PCR primers should be 10-24 nucleotides in length. (2) The GC contentshould be 40%-60%. (3) The primer should not be self-complementary or complementaryto any other primer in the reaction mixture, to prevent primer-dimer and hairpin formation.(4) Melting temperatures of primer pairs should not differ by more than 5°C, so that theGC content and length must be chosen accordingly. (5) The melting and annealingtemperatures of a primer are estimated as follows: if the primer is shorter than 25nucleotides, the approximate melting temperature is calculated with the formula: Tm = 4(G + C) + 2 (A + T). (6) The annealing temperature should be about 5°C lower than themelting temperature.
MgCl 2 concentration. Because Mg 2+ ions form complexes with dNTPs, primers andDNA templates, the optimal concentration of MgCl 2 has to be selected for eachexperiment. Too few Mg 2
+ ions result in a low yield of PCR product, and too many willincrease the yield of non-specific products. The recommended range of MgCl 2concentration is 1 to 3 mM, under the standard reaction conditions specified.
Taq DNA polymerase. Higher Taq DNA polymerase concentrations than needed maycause synthesis of non-specific products.
dNTPs. The concentration of each dNTP (dATP, dCTP, dGTP, dTTP) in the reactionmixture is usually 200 µM. These concentrations must be checked as being equal,because inaccuracies will increase the degree of misincorporation.
Considerations:• Template DNA
• Primers• MgCl
2concentration
• Taq polymerase
• dNTPs
8/11/2019 Using molecular marker technology in studies on plant genetic diversity
http://slidepdf.com/reader/full/using-molecular-marker-technology-in-studies-on-plant-genetic-diversity 177/374
11
Copyright: IPGRI and Cornell University, 2003 PCR basics 11
PCR procedures: equipment
! Micropipettes
! Thermocycler
! Electrophoresis units
! Power supply units
! Photographic equipment
8/11/2019 Using molecular marker technology in studies on plant genetic diversity
http://slidepdf.com/reader/full/using-molecular-marker-technology-in-studies-on-plant-genetic-diversity 178/374
12
Copyright: IPGRI and Cornell University, 2003 PCR basics 12
PCR technology in pictures
The following photographs demonstrate how PCRtechnology is carried out
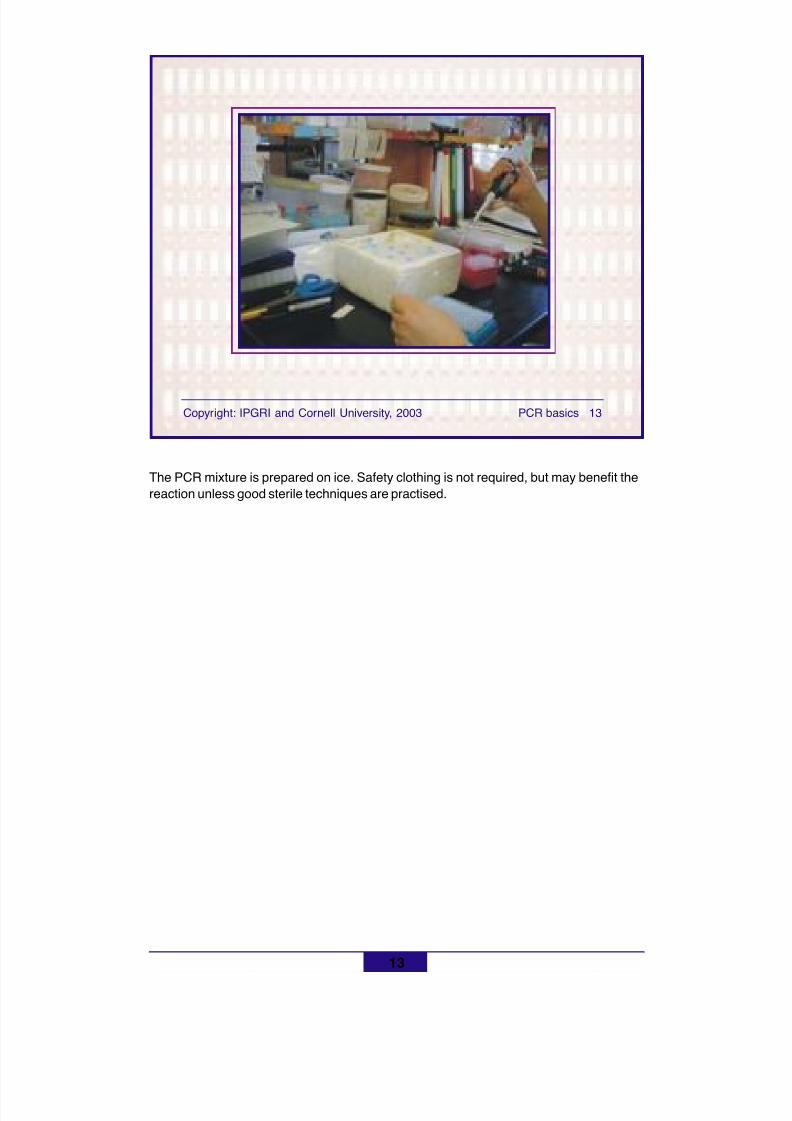
8/11/2019 Using molecular marker technology in studies on plant genetic diversity
http://slidepdf.com/reader/full/using-molecular-marker-technology-in-studies-on-plant-genetic-diversity 179/374
13
Copyright: IPGRI and Cornell University, 2003 PCR basics 13
The PCR mixture is prepared on ice. Safety clothing is not required, but may benefit thereaction unless good sterile techniques are practised.
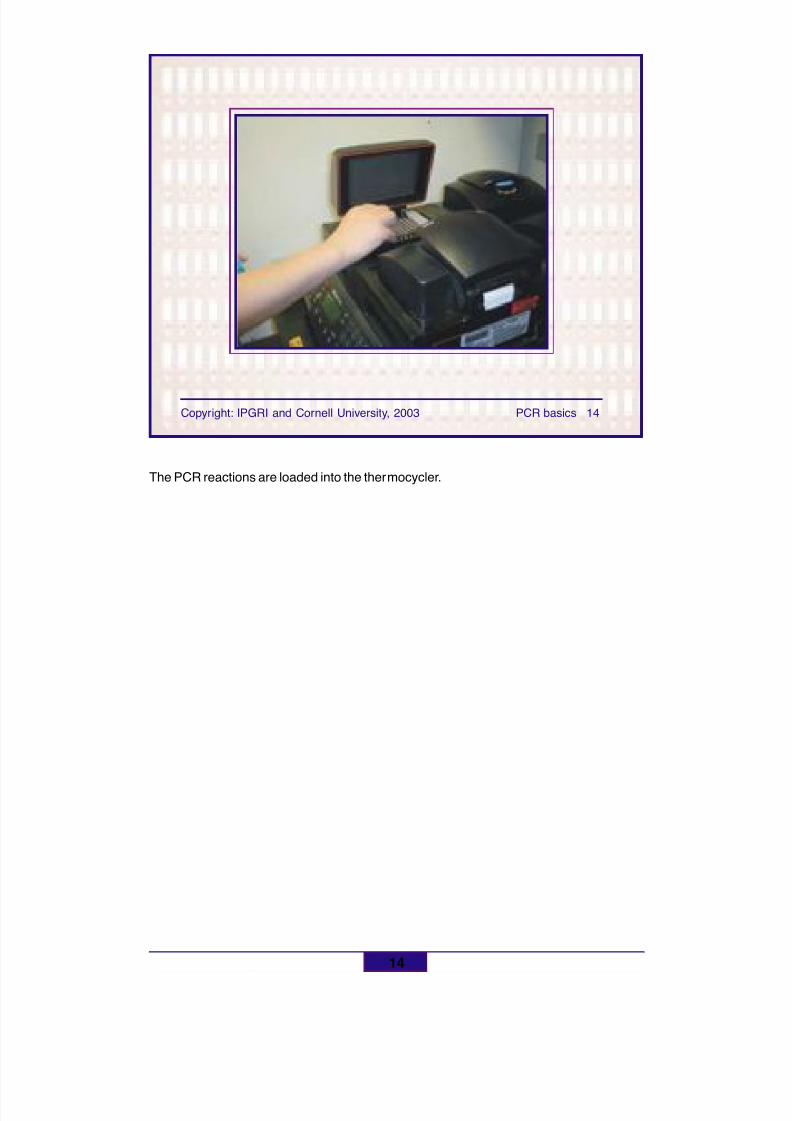
8/11/2019 Using molecular marker technology in studies on plant genetic diversity
http://slidepdf.com/reader/full/using-molecular-marker-technology-in-studies-on-plant-genetic-diversity 180/374
14
Copyright: IPGRI and Cornell University, 2003 PCR basics 14
The PCR reactions are loaded into the thermocycler.
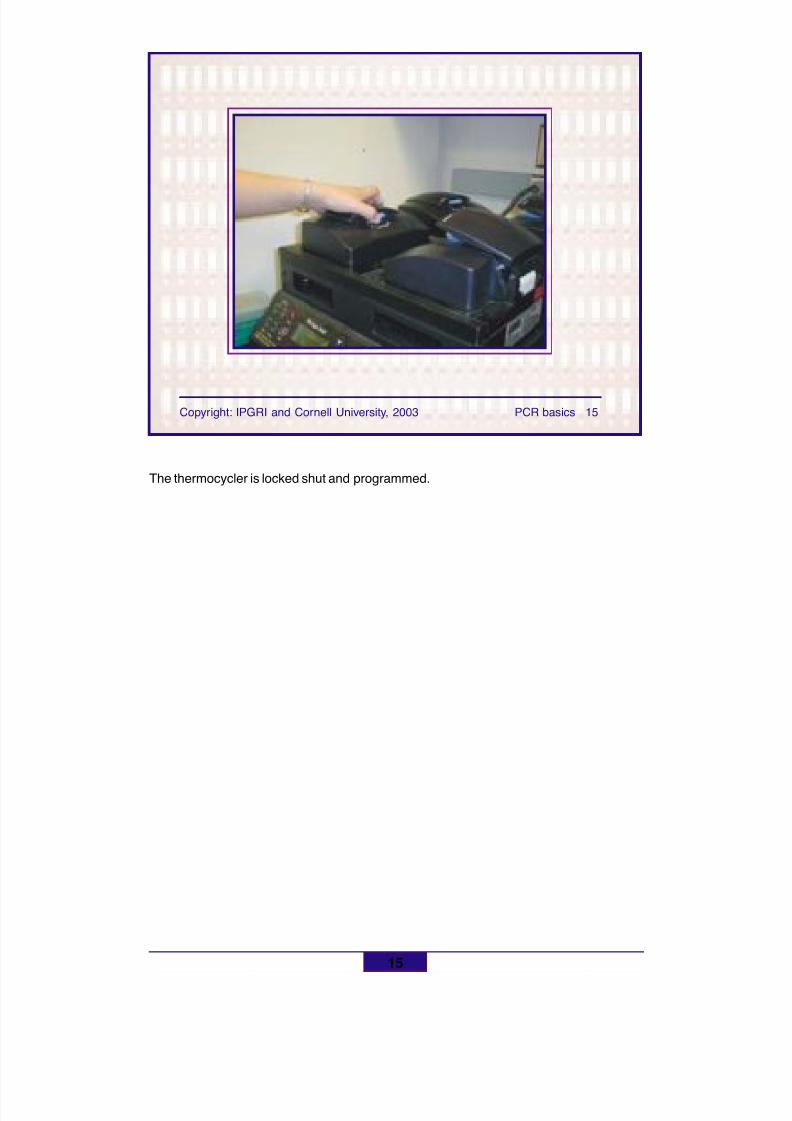
8/11/2019 Using molecular marker technology in studies on plant genetic diversity
http://slidepdf.com/reader/full/using-molecular-marker-technology-in-studies-on-plant-genetic-diversity 181/374
15
Copyright: IPGRI and Cornell University, 2003 PCR basics 15
The thermocycler is locked shut and programmed.
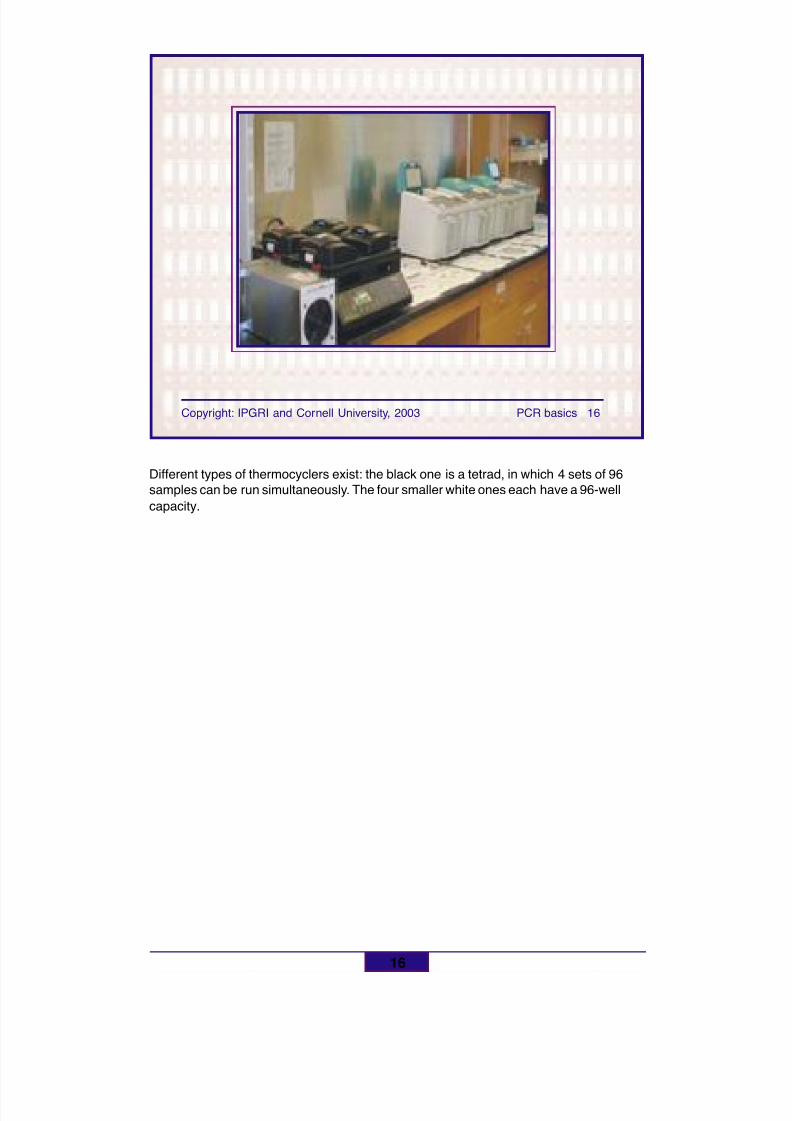
8/11/2019 Using molecular marker technology in studies on plant genetic diversity
http://slidepdf.com/reader/full/using-molecular-marker-technology-in-studies-on-plant-genetic-diversity 182/374
16
Copyright: IPGRI and Cornell University, 2003 PCR basics 16
Different types of thermocyclers exist: the black one is a tetrad, in which 4 sets of 96samples can be run simultaneously. The four smaller white ones each have a 96-wellcapacity.
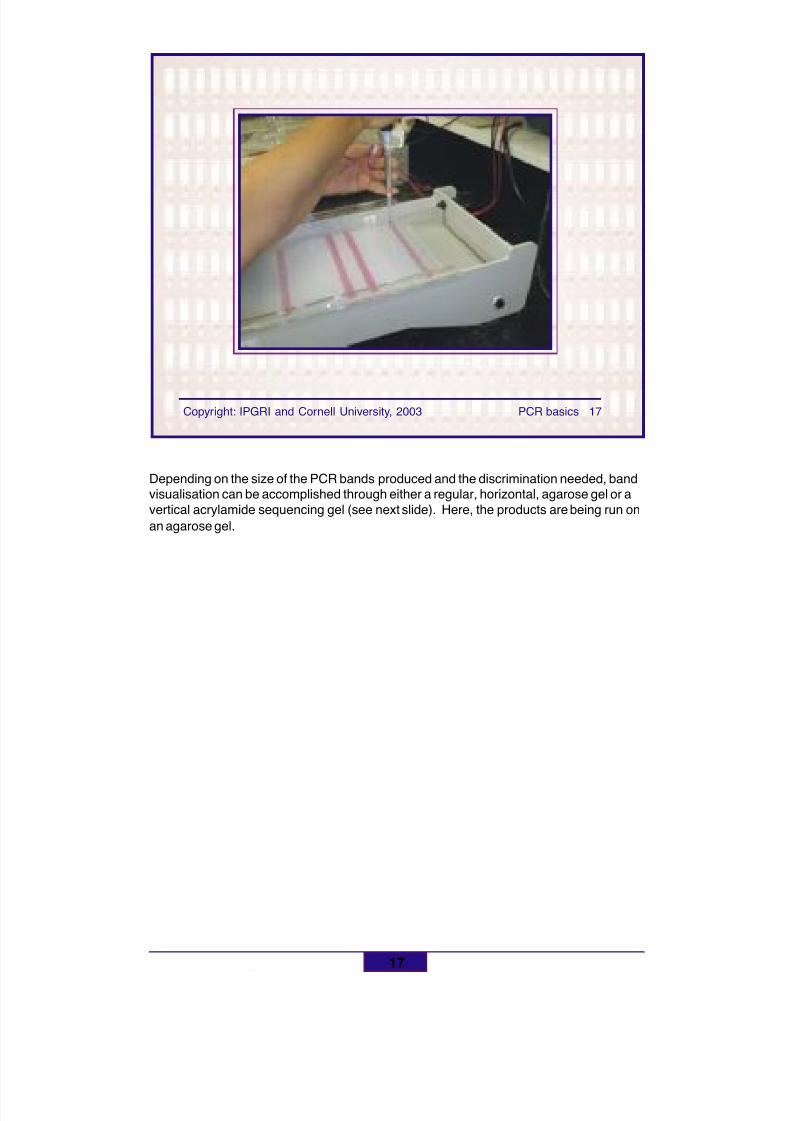
8/11/2019 Using molecular marker technology in studies on plant genetic diversity
http://slidepdf.com/reader/full/using-molecular-marker-technology-in-studies-on-plant-genetic-diversity 183/374
17
Copyright: IPGRI and Cornell University, 2003 PCR basics 17
Depending on the size of the PCR bands produced and the discrimination needed, bandvisualisation can be accomplished through either a regular, horizontal, agarose gel or avertical acrylamide sequencing gel (see next slide). Here, the products are being run onan agarose gel.
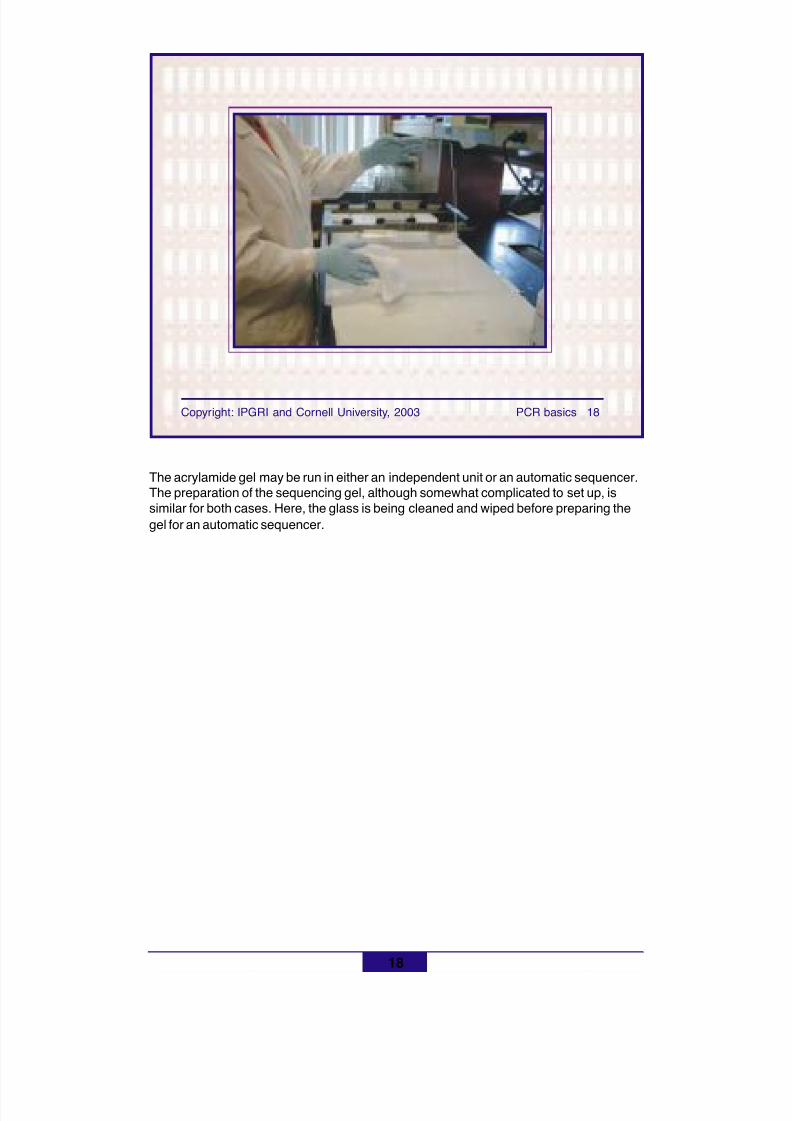
8/11/2019 Using molecular marker technology in studies on plant genetic diversity
http://slidepdf.com/reader/full/using-molecular-marker-technology-in-studies-on-plant-genetic-diversity 184/374
18
Copyright: IPGRI and Cornell University, 2003 PCR basics 18
The acrylamide gel may be run in either an independent unit or an automatic sequencer.The preparation of the sequencing gel, although somewhat complicated to set up, issimilar for both cases. Here, the glass is being cleaned and wiped before preparing thegel for an automatic sequencer.
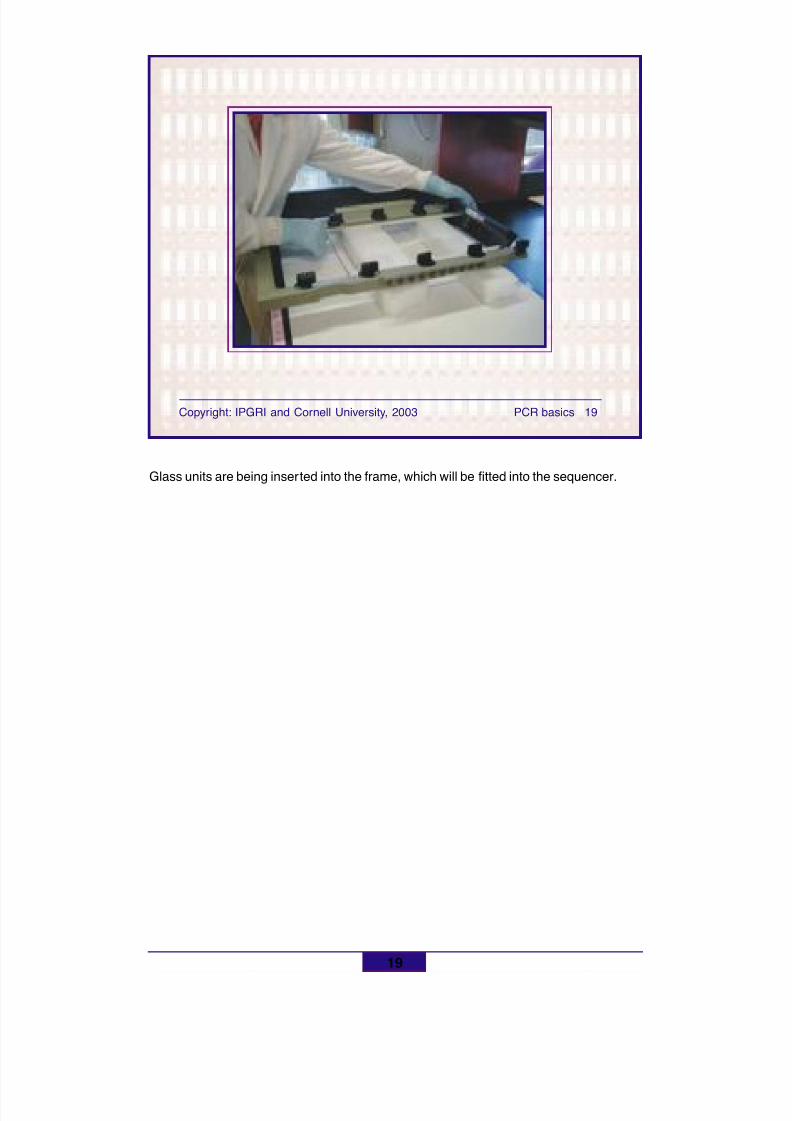
8/11/2019 Using molecular marker technology in studies on plant genetic diversity
http://slidepdf.com/reader/full/using-molecular-marker-technology-in-studies-on-plant-genetic-diversity 185/374
19
Copyright: IPGRI and Cornell University, 2003 PCR basics 19
Glass units are being inserted into the frame, which will be fitted into the sequencer.
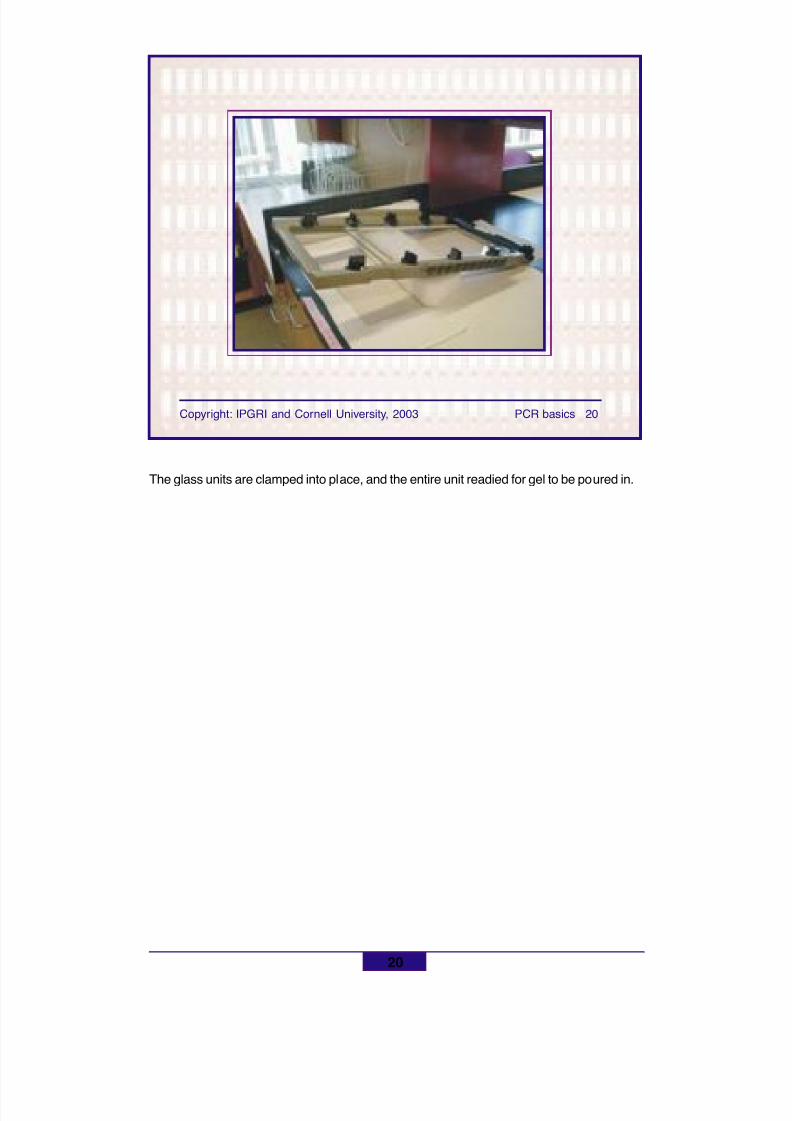
8/11/2019 Using molecular marker technology in studies on plant genetic diversity
http://slidepdf.com/reader/full/using-molecular-marker-technology-in-studies-on-plant-genetic-diversity 186/374
20
Copyright: IPGRI and Cornell University, 2003 PCR basics 20
The glass units are clamped into place, and the entire unit readied for gel to be poured in.
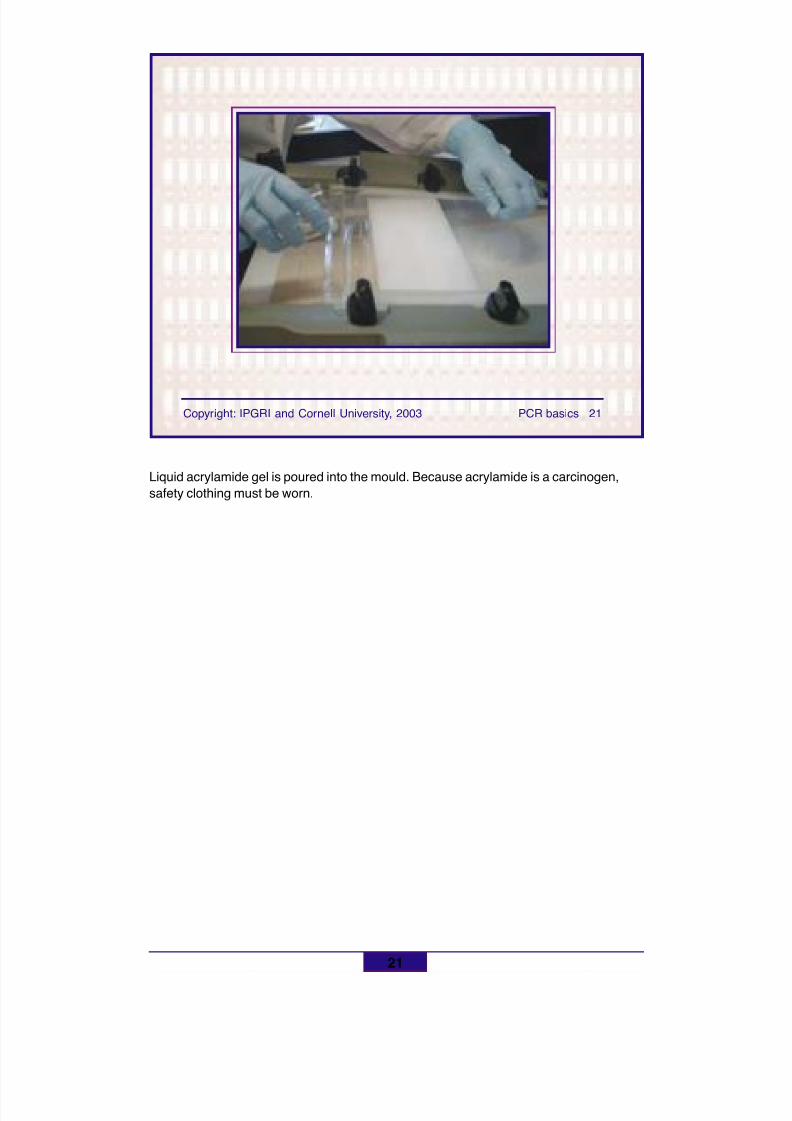
8/11/2019 Using molecular marker technology in studies on plant genetic diversity
http://slidepdf.com/reader/full/using-molecular-marker-technology-in-studies-on-plant-genetic-diversity 187/374
21
Copyright: IPGRI and Cornell University, 2003 PCR basics 21
Liquid acrylamide gel is poured into the mould. Because acrylamide is a carcinogen,safety clothing must be worn.
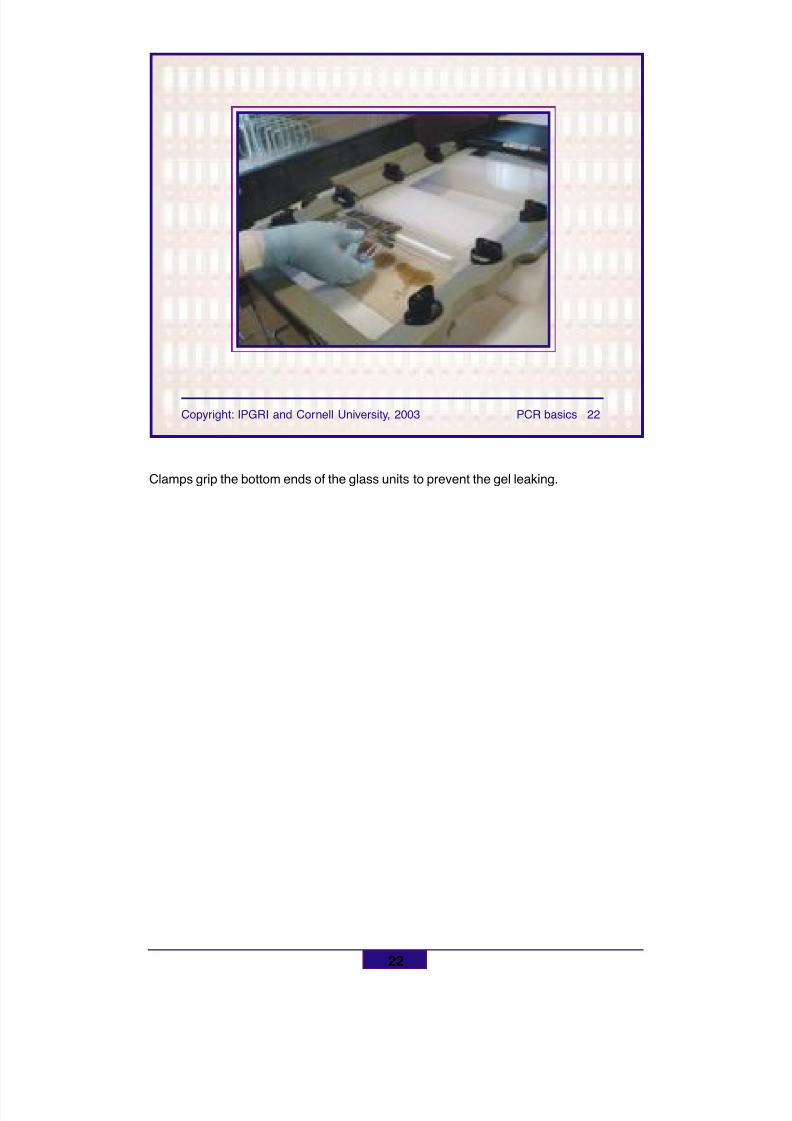
8/11/2019 Using molecular marker technology in studies on plant genetic diversity
http://slidepdf.com/reader/full/using-molecular-marker-technology-in-studies-on-plant-genetic-diversity 188/374
22
Copyright: IPGRI and Cornell University, 2003 PCR basics 22
Clamps grip the bottom ends of the glass units to prevent the gel leaking.
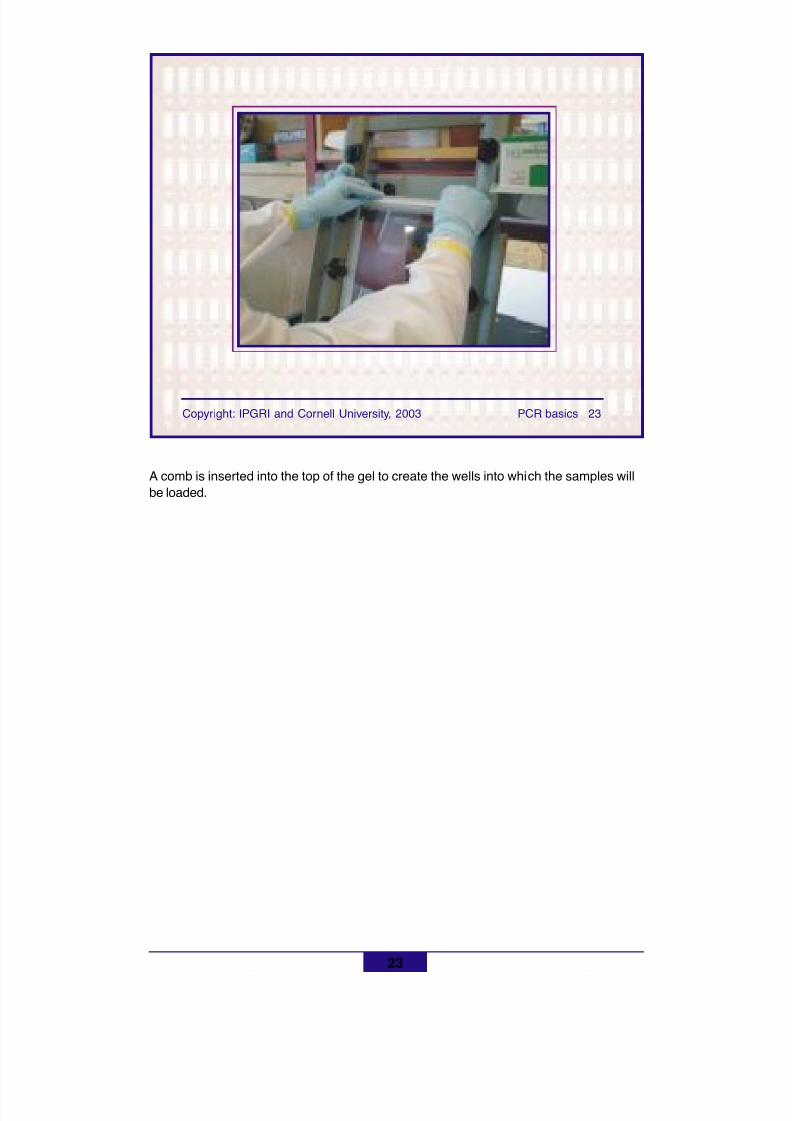
8/11/2019 Using molecular marker technology in studies on plant genetic diversity
http://slidepdf.com/reader/full/using-molecular-marker-technology-in-studies-on-plant-genetic-diversity 189/374
23
Copyright: IPGRI and Cornell University, 2003 PCR basics 23
A comb is inserted into the top of the gel to create the wells into which the samples willbe loaded.
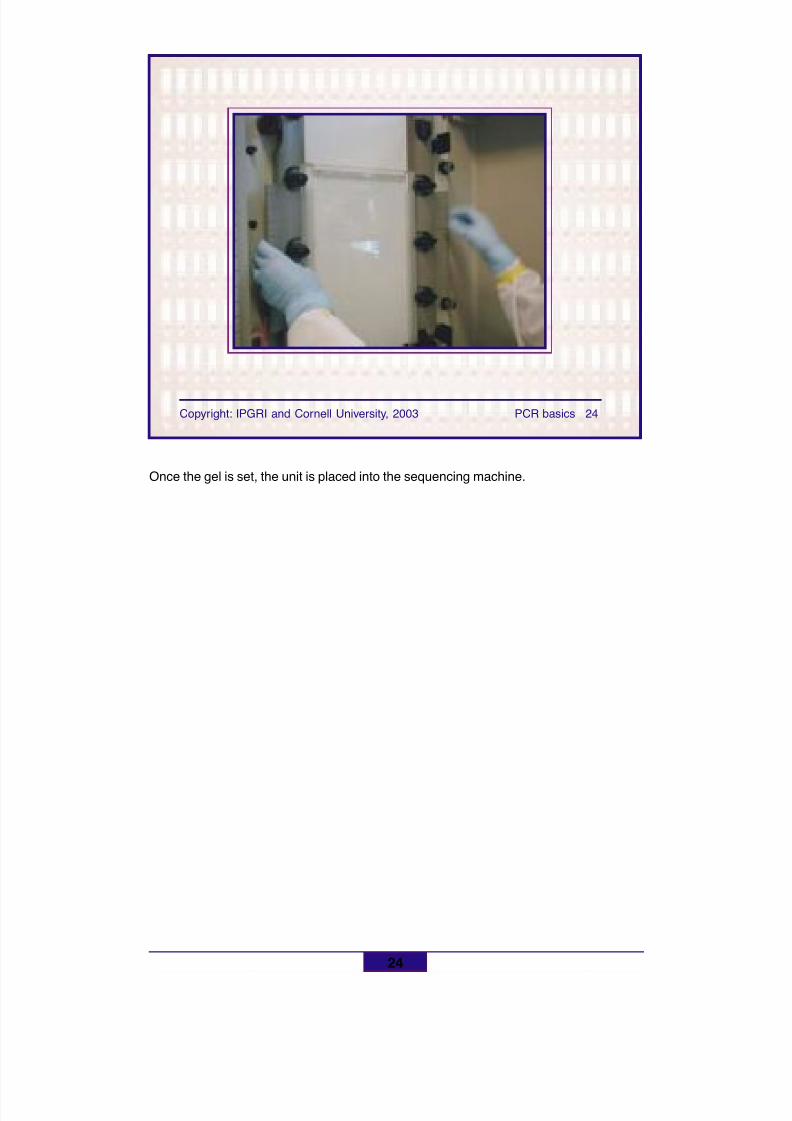
8/11/2019 Using molecular marker technology in studies on plant genetic diversity
http://slidepdf.com/reader/full/using-molecular-marker-technology-in-studies-on-plant-genetic-diversity 190/374
24
Copyright: IPGRI and Cornell University, 2003 PCR basics 24
Once the gel is set, the unit is placed into the sequencing machine.
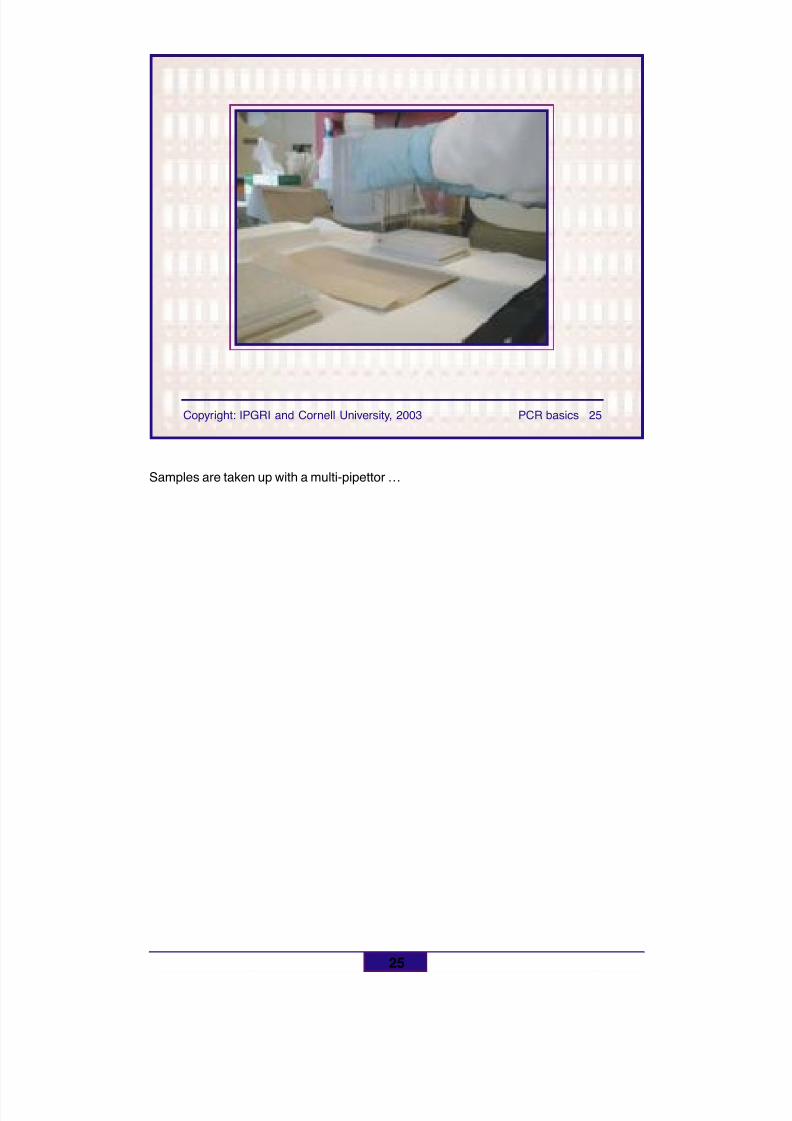
8/11/2019 Using molecular marker technology in studies on plant genetic diversity
http://slidepdf.com/reader/full/using-molecular-marker-technology-in-studies-on-plant-genetic-diversity 191/374
25
Copyright: IPGRI and Cornell University, 2003 PCR basics 25
Samples are taken up with a multi-pipettor …
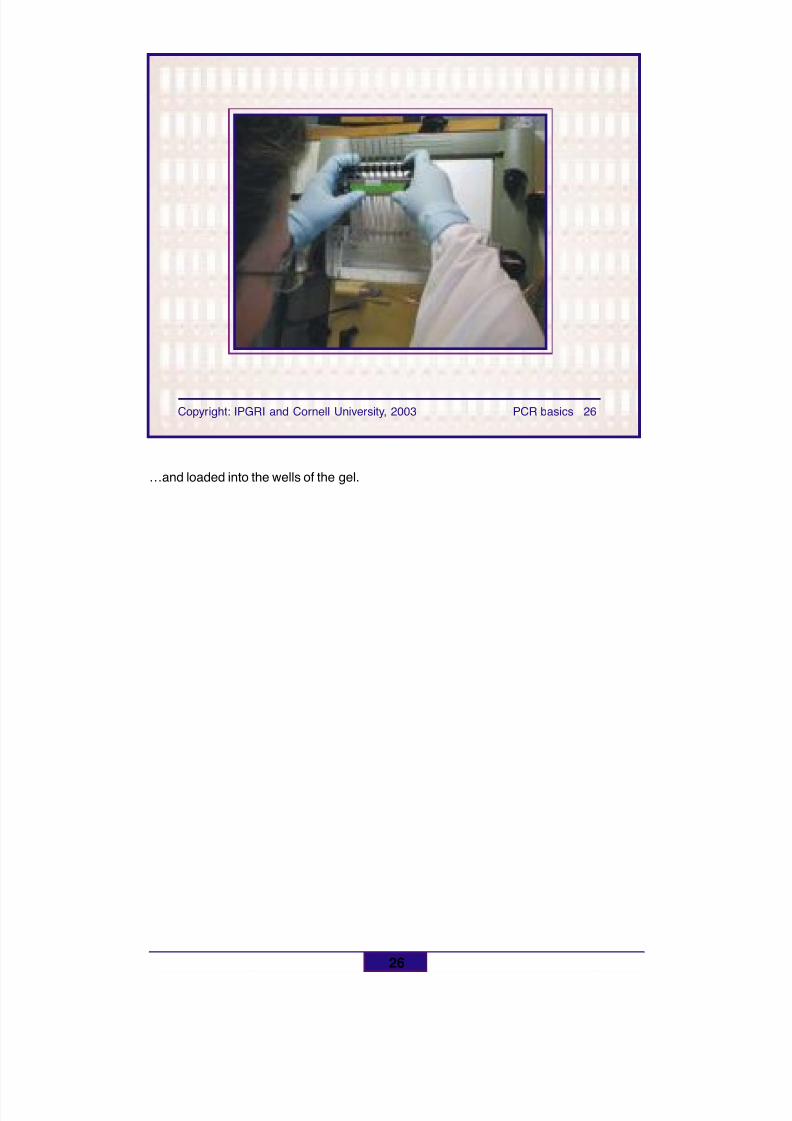
8/11/2019 Using molecular marker technology in studies on plant genetic diversity
http://slidepdf.com/reader/full/using-molecular-marker-technology-in-studies-on-plant-genetic-diversity 192/374
26
Copyright: IPGRI and Cornell University, 2003 PCR basics 26
…and loaded into the wells of the gel.
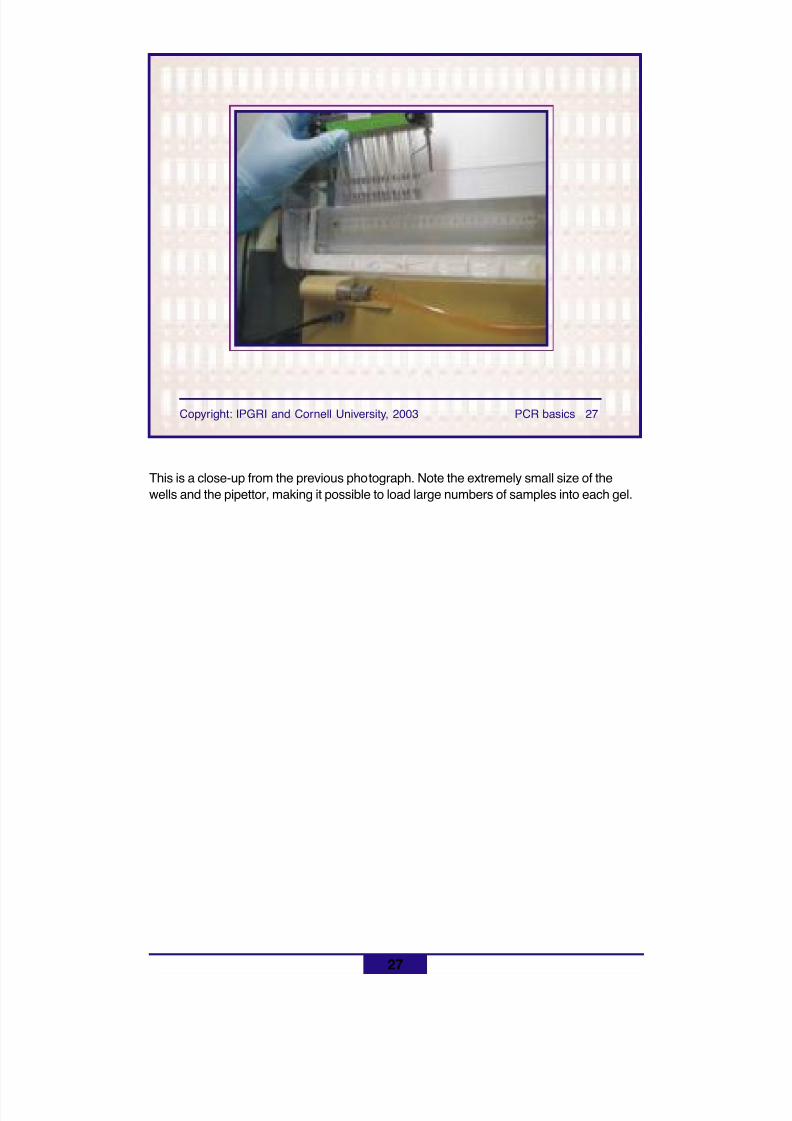
8/11/2019 Using molecular marker technology in studies on plant genetic diversity
http://slidepdf.com/reader/full/using-molecular-marker-technology-in-studies-on-plant-genetic-diversity 193/374
27
Copyright: IPGRI and Cornell University, 2003 PCR basics 27
This is a close-up from the previous photograph. Note the extremely small size of thewells and the pipettor, making it possible to load large numbers of samples into each gel.
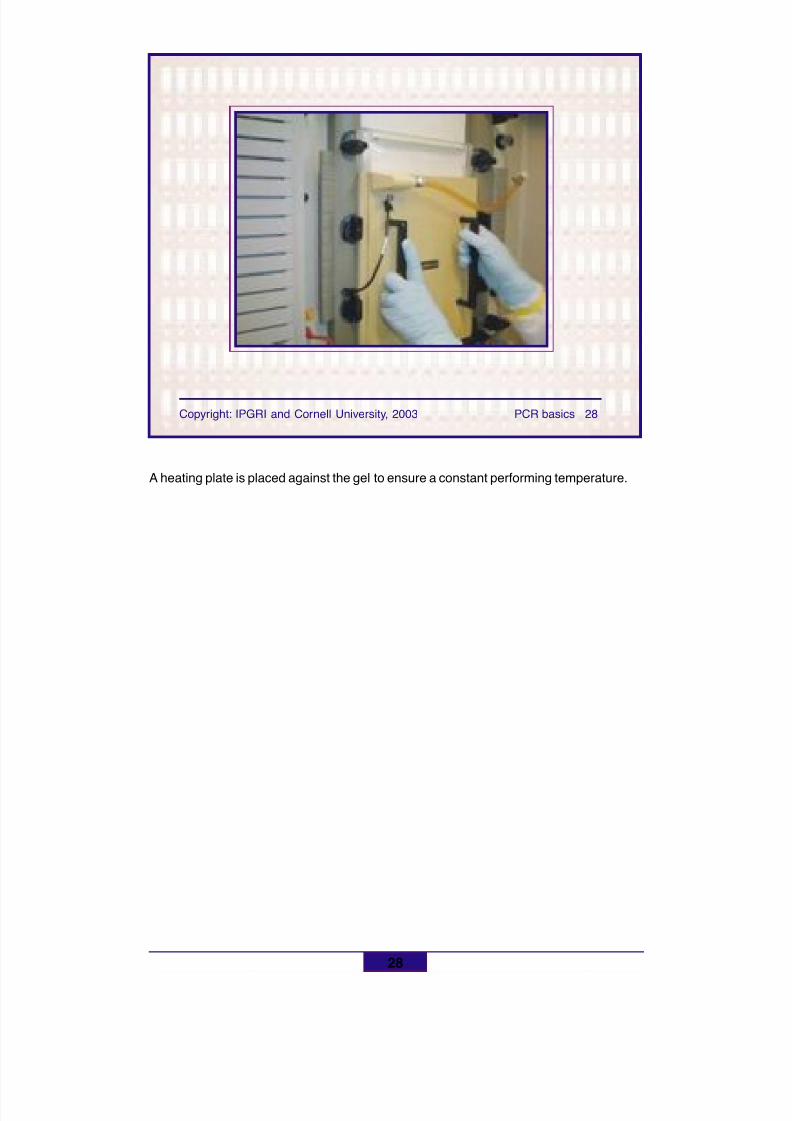
8/11/2019 Using molecular marker technology in studies on plant genetic diversity
http://slidepdf.com/reader/full/using-molecular-marker-technology-in-studies-on-plant-genetic-diversity 194/374
28
Copyright: IPGRI and Cornell University, 2003 PCR basics 28
A heating plate is placed against the gel to ensure a constant performing temperature.
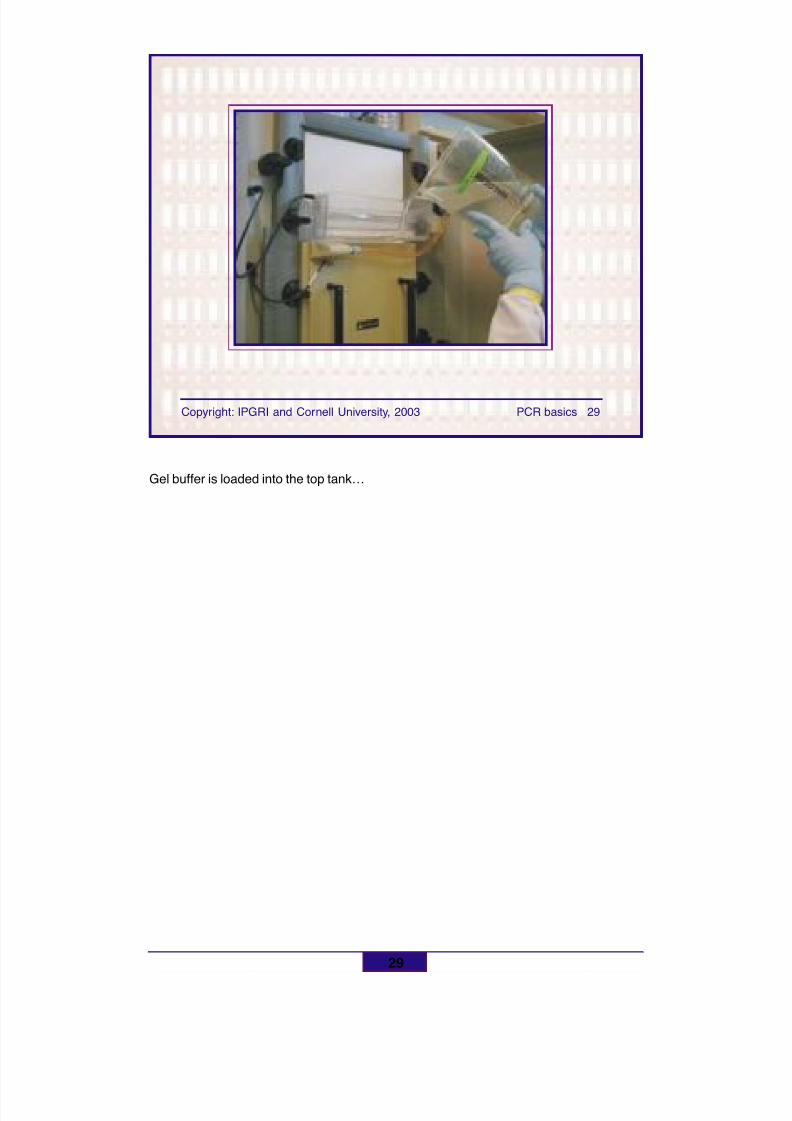
8/11/2019 Using molecular marker technology in studies on plant genetic diversity
http://slidepdf.com/reader/full/using-molecular-marker-technology-in-studies-on-plant-genetic-diversity 195/374
29
Copyright: IPGRI and Cornell University, 2003 PCR basics 29
Gel buffer is loaded into the top tank…
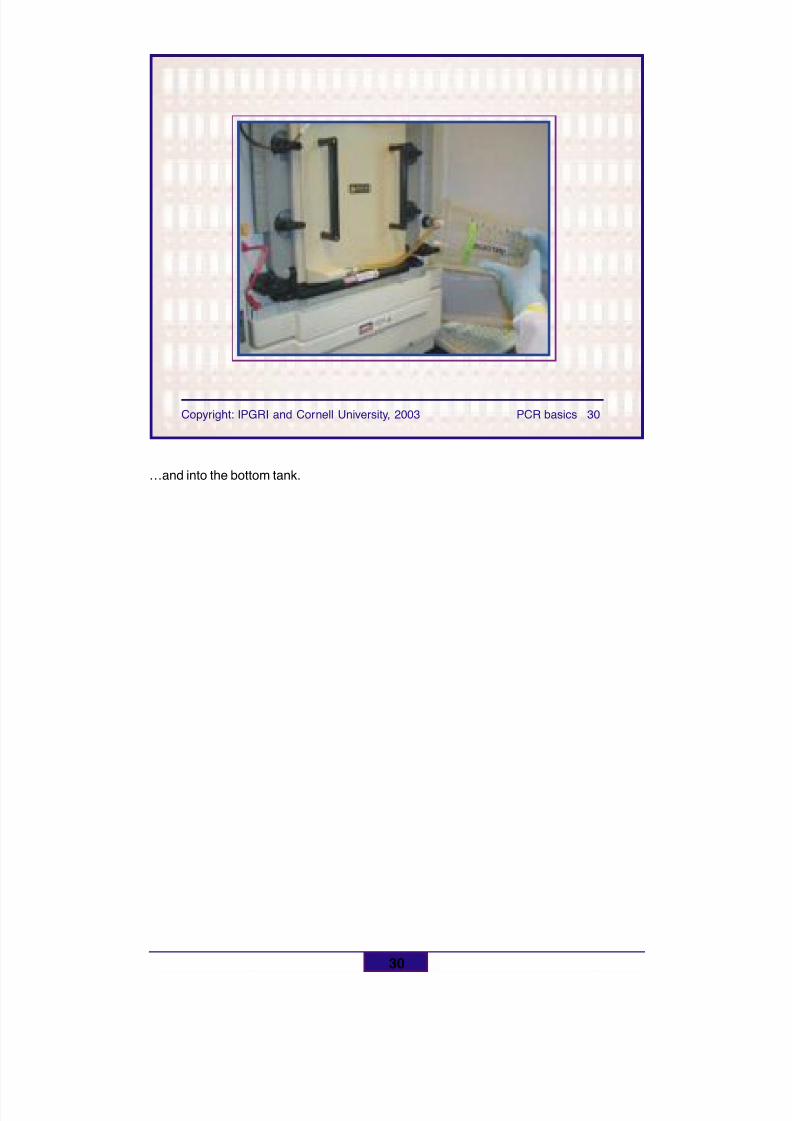
8/11/2019 Using molecular marker technology in studies on plant genetic diversity
http://slidepdf.com/reader/full/using-molecular-marker-technology-in-studies-on-plant-genetic-diversity 196/374
30
Copyright: IPGRI and Cornell University, 2003 PCR basics 30
…and into the bottom tank.
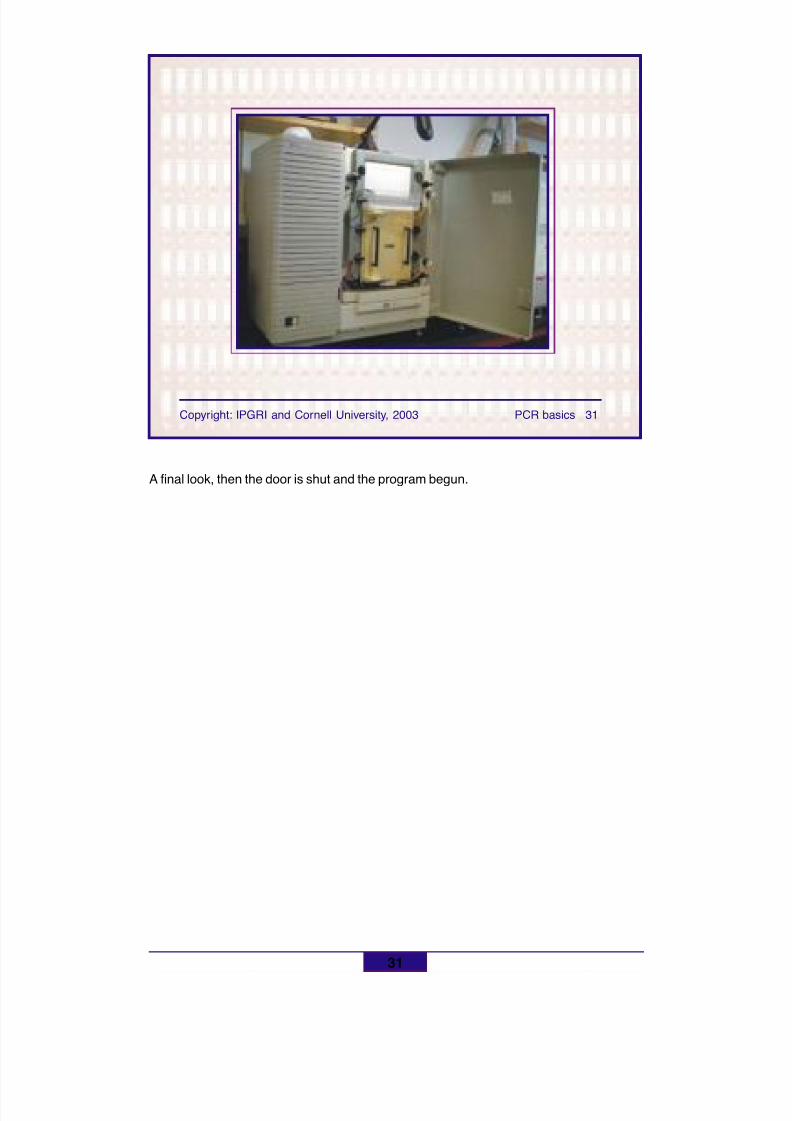
8/11/2019 Using molecular marker technology in studies on plant genetic diversity
http://slidepdf.com/reader/full/using-molecular-marker-technology-in-studies-on-plant-genetic-diversity 197/374
31
Copyright: IPGRI and Cornell University, 2003 PCR basics 31
A final look, then the door is shut and the program begun.
8/11/2019 Using molecular marker technology in studies on plant genetic diversity
http://slidepdf.com/reader/full/using-molecular-marker-technology-in-studies-on-plant-genetic-diversity 198/374
32
Copyright: IPGRI and Cornell University, 2003 PCR basics 32
In summary
!!!!! PCR is a simple technique to obtain manycopies of specific DNA fragments
!!!!! Three steps are involved in PCR: denaturation,annealing and extension
!!!!! To ensure success, care should be taken both inpreparing the reaction mixture and setting up thecycling conditions
8/11/2019 Using molecular marker technology in studies on plant genetic diversity
http://slidepdf.com/reader/full/using-molecular-marker-technology-in-studies-on-plant-genetic-diversity 199/374
33
Copyright: IPGRI and Cornell University, 2003 PCR basics 33
By now you should know
!!!!! What the basis of PCR is
!!!!! Those items that can affect the performance ofthe PCR, step by step, and what their effects onPCR results would be
8/11/2019 Using molecular marker technology in studies on plant genetic diversity
http://slidepdf.com/reader/full/using-molecular-marker-technology-in-studies-on-plant-genetic-diversity 200/374
Basic references
Erlich, H.A. 1989. PCR technology: principles and applications for DNA amplifications.Stockton Press, NY.
Erlich, H.A. and N. Arnheim. 1992. Genetic analysis using the polymerase chainreaction. Ann. Rev. Genet. 26:479-506.
Griffiths, A.J.F., J.H. Miller, D.T. Suzuki, R.C. Lewontin and W.M. Gelbart. 1996. Anintroduction to genetic analysis (6th edn.). W.H. Freeman and Co., NY.
Newton, C.R. and A. Graham. 1994. PCR, part 1: Basic principles and methods.EngBios Scientific Publishers, Oxford.
Saiki, R.K., D.H. Gelfand, S. Stoffel, S.J. Scharf, R. Higuchi, G.T. Horn, K.B. Mullis andH.A. Erlich. 1988. Primer-directed enzymatic amplification of DNA with athermostable DNA polymerase. Science 239:487-491.
34
8/11/2019 Using molecular marker technology in studies on plant genetic diversity
http://slidepdf.com/reader/full/using-molecular-marker-technology-in-studies-on-plant-genetic-diversity 201/374
35
Copyright: IPGRI and Cornell University, 2003 PCR basics 35
Next
DNA-based technologiesPCR-based technologies
PCR with arbitrary primers
! DNA-based technologies• PCR-based technologies
• Amplified fragment length polymorphisms (AFLPs)• Sequences-tagged sites (STS)• Latest strategies
! Complementary technologies
! Final considerations
! Glossary
8/11/2019 Using molecular marker technology in studies on plant genetic diversity
http://slidepdf.com/reader/full/using-molecular-marker-technology-in-studies-on-plant-genetic-diversity 202/374
Using molecular marker technology instudies on plant genetic diversity
DNA-based technologies
PCR-based technologiesPCR with arbitrary primers
(RAPDs, DAF, AP-PCR)
Copyright: IPGRI and Cornell University, 2003 PCR with arbitrary primers 1
8/11/2019 Using molecular marker technology in studies on plant genetic diversity
http://slidepdf.com/reader/full/using-molecular-marker-technology-in-studies-on-plant-genetic-diversity 203/374
2
Copyright: IPGRI and Cornell University, 2003 PCR with arbitrary primers 2
Contents! PCR with arbitrary primers! RAPD technology, step by step
• Isolating DNA• PCR reaction• RAPD product detection• Diagrammatic summary
! Equipment! Interpreting RAPD banding patterns! Advantages and disadvantages of RAPDs! Applications
• Meadow fescue• Bell pepper• Modern rose
! Differences: DAF and AP-PCR technologies
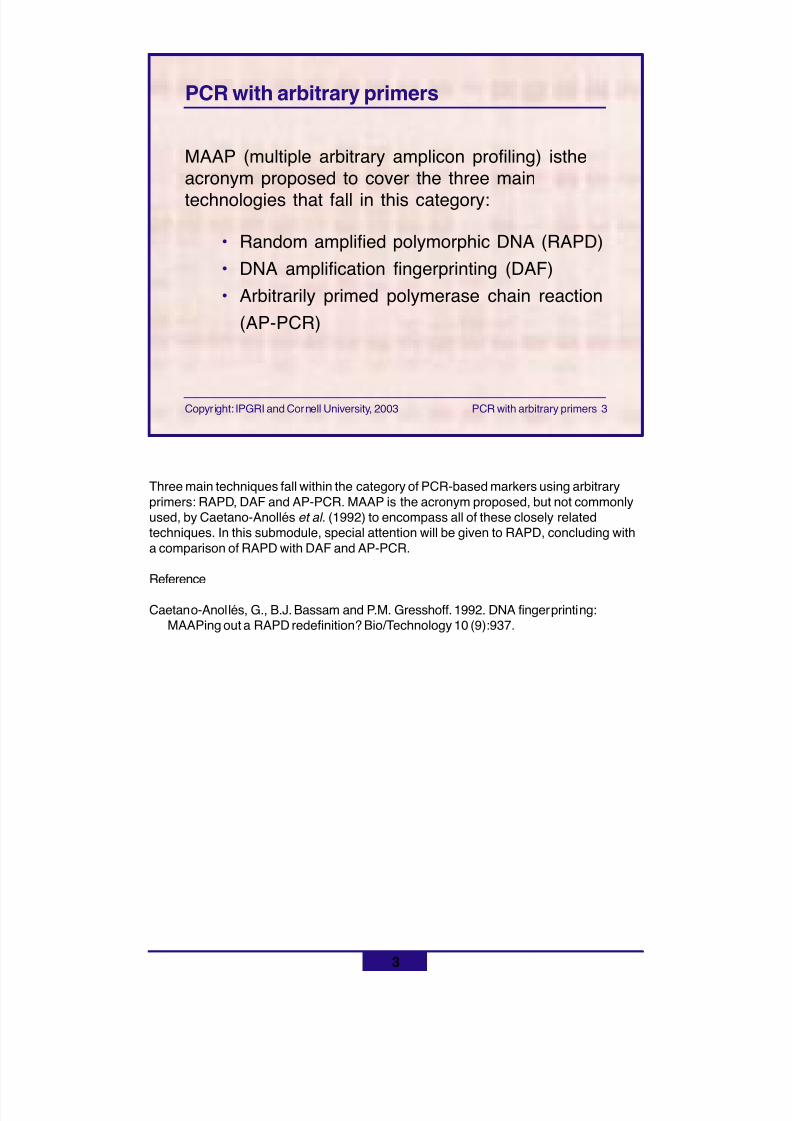
8/11/2019 Using molecular marker technology in studies on plant genetic diversity
http://slidepdf.com/reader/full/using-molecular-marker-technology-in-studies-on-plant-genetic-diversity 204/374
3
Copyright: IPGRI and Cornell University, 2003 PCR with arbitrary primers 3
MAAP (multiple arbitrary amplicon profiling) istheacronym proposed to cover the three maintechnologies that fall in this category:
• Random amplified polymorphic DNA (RAPD)• DNA amplification fingerprinting (DAF)• Arbitrarily primed polymerase chain reaction
(AP-PCR)
PCR with arbitrary primers
Three main techniques fall within the category of PCR-based markers using arbitraryprimers: RAPD, DAF and AP-PCR. MAAP is the acronym proposed, but not commonlyused, by Caetano-Anollés et al. (1992) to encompass all of these closely relatedtechniques. In this submodule, special attention will be given to RAPD, concluding witha comparison of RAPD with DAF and AP-PCR.
Reference
Caetano-Anollés, G., B.J. Bassam and P.M. Gresshoff. 1992. DNA fingerprinting:MAAPing out a RAPD redefinition? Bio/Technology 10 (9):937.
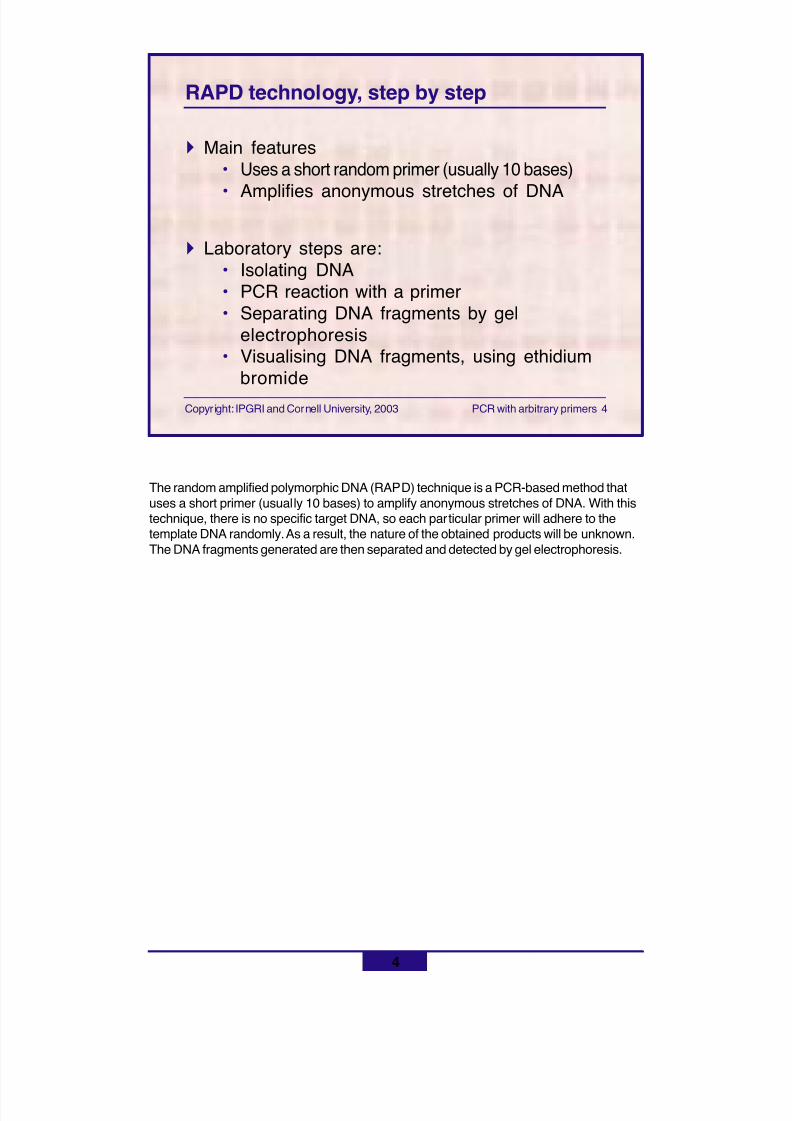
8/11/2019 Using molecular marker technology in studies on plant genetic diversity
http://slidepdf.com/reader/full/using-molecular-marker-technology-in-studies-on-plant-genetic-diversity 205/374
4
Copyright: IPGRI and Cornell University, 2003 PCR with arbitrary primers 4
RAPD technology, step by step
The random amplified polymorphic DNA (RAPD) technique is a PCR-based method thatuses a short primer (usually 10 bases) to amplify anonymous stretches of DNA. With thistechnique, there is no specific target DNA, so each particular primer will adhere to thetemplate DNA randomly. As a result, the nature of the obtained products will be unknown.The DNA fragments generated are then separated and detected by gel electrophoresis.
! Main features• Uses a short random primer (usually 10 bases)
• Amplifies anonymous stretches of DNA
! Laboratory steps are:• Isolating DNA• PCR reaction with a primer• Separating DNA fragments by gel
electrophoresis• Visualising DNA fragments, using ethidium
bromide
8/11/2019 Using molecular marker technology in studies on plant genetic diversity
http://slidepdf.com/reader/full/using-molecular-marker-technology-in-studies-on-plant-genetic-diversity 206/374
5
Copyright: IPGRI and Cornell University, 2003 PCR with arbitrary primers 5
Isolating DNA
Total, chloroplast or mitochondrial DNA can be used
• Tiny amounts of DNA are sufficient• DNA must be clean and of high molecular
weight
If minimal quality of DNA is not achieved, thereproducibility of results will be hard to ensure
8/11/2019 Using molecular marker technology in studies on plant genetic diversity
http://slidepdf.com/reader/full/using-molecular-marker-technology-in-studies-on-plant-genetic-diversity 207/374
6
Copyright: IPGRI and Cornell University, 2003 PCR with arbitrary primers 6
PCR reaction
The PCR components needed are already discussed in the submodule "PCR basics".Only a short primer (usually 10 bp long) is used. Primers with these characteristics arecommercially available under different brands. A concentration of MgCl 2 is often addedto promote amplification of more bands through the reaction. However, care should betaken to find the suitable concentration for each case, to prevent the appearance ofnon-specific products.
PCR conditions usually include an annealing cycle at a low temperature (about 40°C),thus encouraging primer—DNA annealing and leading to a sufficient number of products.Again, the appearance of non-specific products must be prevented, which can be doneby determining the appropriate temperature at which 'ghost' bands will not appear.
!!!!! Components for a PCR
!!!!! Primers (10 bases long) are commerciallyavailable from different companies
!!!!! Addition of MgCl 2 is usual
!!!!! Annealing cycles are performed at lowtemperatures (about 40°C)
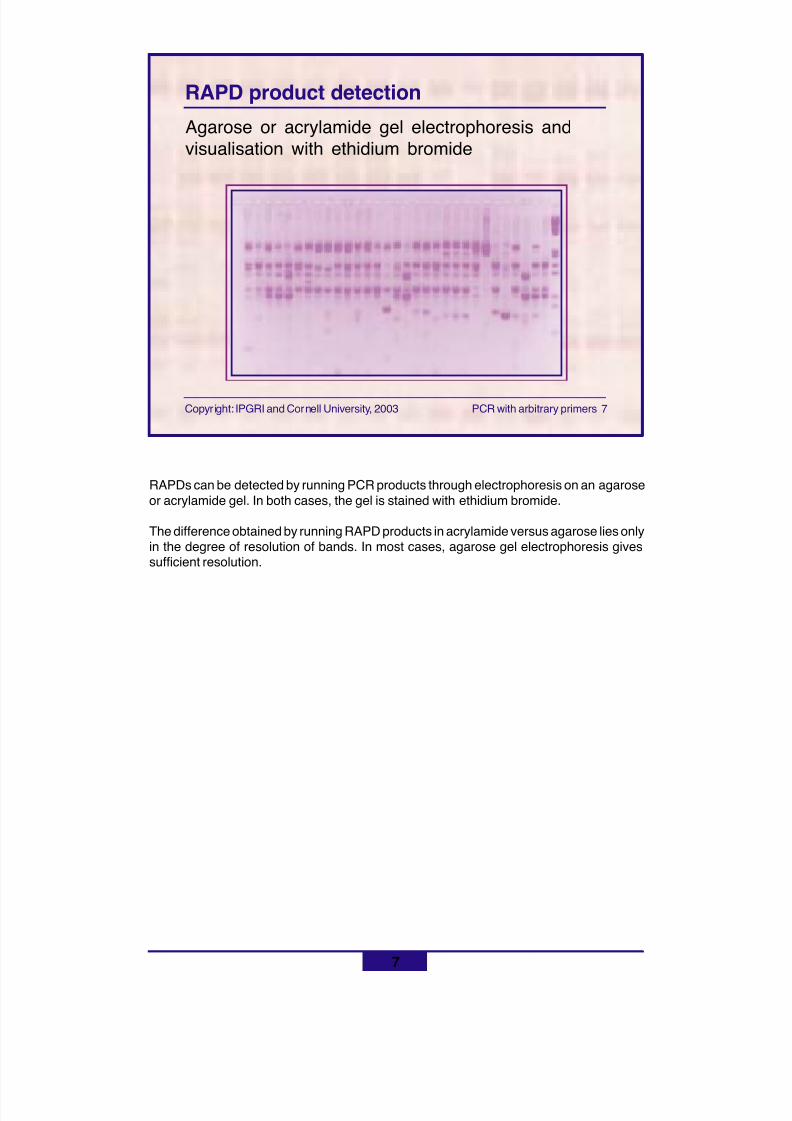
8/11/2019 Using molecular marker technology in studies on plant genetic diversity
http://slidepdf.com/reader/full/using-molecular-marker-technology-in-studies-on-plant-genetic-diversity 208/374
7
Copyright: IPGRI and Cornell University, 2003 PCR with arbitrary primers 7
RAPD product detection
Agarose or acrylamide gel electrophoresis andvisualisation with ethidium bromide
RAPDs can be detected by running PCR products through electrophoresis on an agaroseor acrylamide gel. In both cases, the gel is stained with ethidium bromide.
The difference obtained by running RAPD products in acrylamide versus agarose lies onlyin the degree of resolution of bands. In most cases, agarose gel electrophoresis givessufficient resolution.

8/11/2019 Using molecular marker technology in studies on plant genetic diversity
http://slidepdf.com/reader/full/using-molecular-marker-technology-in-studies-on-plant-genetic-diversity 209/374
8
Copyright: IPGRI and Cornell University, 2003 PCR with arbitrary primers 8
Diagrammatic summaryA D
E B
G
CF
Primer
Amplified band
DNA molecule
ECADBF
Gel
{
Adapted from Griffiths et al. 1996
8/11/2019 Using molecular marker technology in studies on plant genetic diversity
http://slidepdf.com/reader/full/using-molecular-marker-technology-in-studies-on-plant-genetic-diversity 210/374
9
Copyright: IPGRI and Cornell University, 2003 PCR with arbitrary primers 9
Equipment
! Resources:
• Distilled and/or deionised water
• Reagents
! Equipment:
• Refrigerator and freezer• Laminar flow hood• Centrifuge• Thermocycler• Power supply units
• Hotplate or microwave• pH meter• Standard balance• Gel electrophoresis units• UV transilluminator
8/11/2019 Using molecular marker technology in studies on plant genetic diversity
http://slidepdf.com/reader/full/using-molecular-marker-technology-in-studies-on-plant-genetic-diversity 211/374
10
Copyright: IPGRI and Cornell University, 2003 PCR with arbitrary primers 10
Interpreting RAPD banding patterns (1)
DNA polymorphism among individuals can be due to:
! Mismatches at the primer site
! The appearance of a new primer site
! The length of the amplified region betweenprimer sites
8/11/2019 Using molecular marker technology in studies on plant genetic diversity
http://slidepdf.com/reader/full/using-molecular-marker-technology-in-studies-on-plant-genetic-diversity 212/374
11
Copyright: IPGRI and Cornell University, 2003 PCR with arbitrary primers 11
Because of the nature of RAPD markers, only thepresence or absence of a particular band can be
assessed. Criteria for selecting scoring bands:
! Reproducibility —need to repeat experiments
! Thickness! Size! Expected segregation observed in a mapping
population
Interpreting RAPD banding patterns (2)
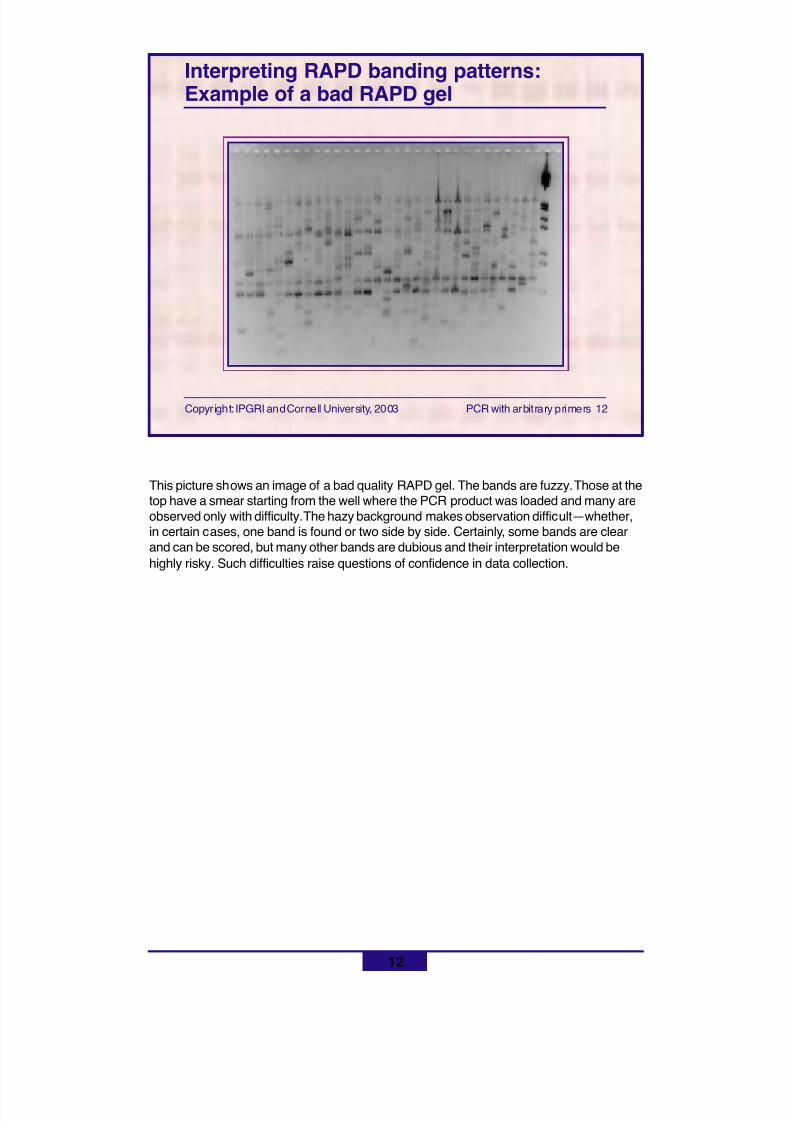
8/11/2019 Using molecular marker technology in studies on plant genetic diversity
http://slidepdf.com/reader/full/using-molecular-marker-technology-in-studies-on-plant-genetic-diversity 213/374
12
Copyright: IPGRI and Cornell University, 2003 PCR with arbitrary primers 12
Interpreting RAPD banding patterns:Example of a bad RAPD gel
This picture shows an image of a bad quality RAPD gel. The bands are fuzzy. Those at thetop have a smear starting from the well where the PCR product was loaded and many areobserved only with difficulty. The hazy background makes observation difficult—whether,in certain cases, one band is found or two side by side. Certainly, some bands are clearand can be scored, but many other bands are dubious and their interpretation would behighly risky. Such difficulties raise questions of confidence in data collection.
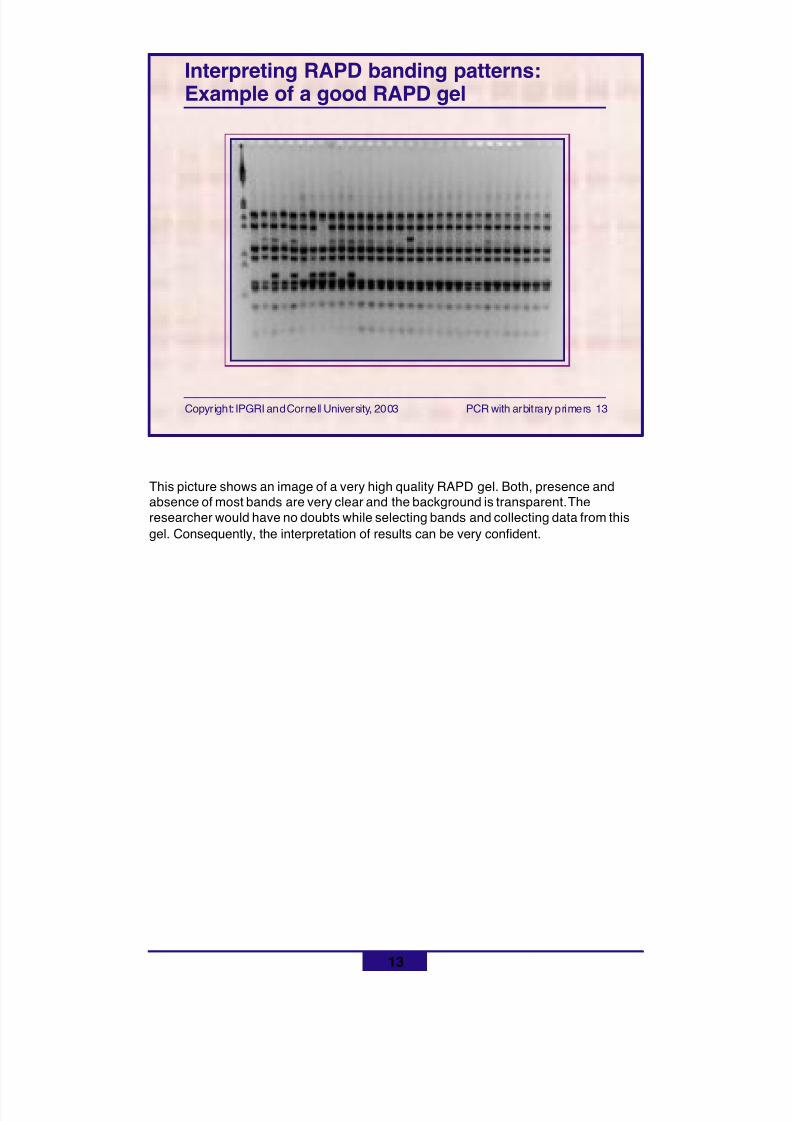
8/11/2019 Using molecular marker technology in studies on plant genetic diversity
http://slidepdf.com/reader/full/using-molecular-marker-technology-in-studies-on-plant-genetic-diversity 214/374
13
Copyright: IPGRI and Cornell University, 2003 PCR with arbitrary primers 13
Interpreting RAPD banding patterns:Example of a good RAPD gel
This picture shows an image of a very high quality RAPD gel. Both, presence andabsence of most bands are very clear and the background is transparent. Theresearcher would have no doubts while selecting bands and collecting data from thisgel. Consequently, the interpretation of results can be very confident.
8/11/2019 Using molecular marker technology in studies on plant genetic diversity
http://slidepdf.com/reader/full/using-molecular-marker-technology-in-studies-on-plant-genetic-diversity 215/374
14
Copyright: IPGRI and Cornell University, 2003 PCR with arbitrary primers 14
Advantages of RAPDs
! High number of fragments
! Simple
! Arbitrary primers are easily purchased, with noneed for initial genetic or genomic information
! Only tiny quantities of target DNA are required
! Unit costs per assay are low
Some comments:
• Many different fragments (corresponding to multiple loci dispersed throughoutthe genome) are normally amplified, using each single primer. The techniqueis therefore rapid in detecting polymorphisms. Although most commerciallyproduced primers result in several fragments, some primers may fail to giveamplification fragments from some material.
• The technique is simple. RAPD analysis does not require expertise to handlehybridisation of DNA or other highly technical activities.
8/11/2019 Using molecular marker technology in studies on plant genetic diversity
http://slidepdf.com/reader/full/using-molecular-marker-technology-in-studies-on-plant-genetic-diversity 216/374
15
Copyright: IPGRI and Cornell University, 2003 PCR with arbitrary primers 15
! Dominant
! Lack of a priori knowledge on the identity of theamplification products
! Problems with reproducibility
! Problems of co-migration
Disadvantages of RAPDs
RAPD markers are dominant. Amplification either occurs at a locus or it does not,leading to scores based on band presence or absence. This means that homozygotesand heterozygotes cannot be distinguished. In addition, the absence of a band throughlack of a target sequence cannot be distinguished from that occurring through the lackof amplification for other reasons (e.g. poor quality DNA), contributing to ambiguity in theinterpretation of results.
Nothing is known about the identity of the amplification products unless the studies aresupported by pedigree analysis.
Problems with reproducibility result as RAPD suffers from sensitivity to changes in thequality of DNA, PCR components and PCR conditions, resulting in changes of theamplified fragments. Reproducible results may be obtained if care is taken tostandardise the conditions used (Munthali et al ., 1992; Lowe et al ., 1996).
Problems of co-migration raise questions like 'Do equal-sized bands correspond to thesame DNA fragment?'
• The presence of a band of identical molecular weight in different individuals is notevidence per se that the individuals share the same (homologous) DNA fragment.
• A band detected on a gel as being single can comprise different amplification
products. This is because the type of gel electrophoresis used, while able toseparate DNA quantitatively (i.e. according to size), cannot separate equal-sizedfragments qualitatively (i.e. according to base sequence).
References
Lowe, A.J., O. Hanotte and L. Guarino. 1996. Standardization of molecular genetictechniques for the characterization of germplasm collections: the case of randomamplified polymorphic DNA (RAPD). Plant Genet. Resour. Newsl. 107:50-54.
Munthali, M., B.V. Ford-Lloyd and H.J. Newbury. 1992. The random amplification ofpolymorphic DNA for fingerprinting plants. PCR Methods Appl. 1(4):274-276.
8/11/2019 Using molecular marker technology in studies on plant genetic diversity
http://slidepdf.com/reader/full/using-molecular-marker-technology-in-studies-on-plant-genetic-diversity 217/374
16
Copyright: IPGRI and Cornell University, 2003 PCR with arbitrary primers 16
Applications
! Genetic diversity! Germplasm characterisation! Genetic structure of populations
! Domestication
! Detection of somaclonal variation
! Cultivar identification! Hybrid purity! Genome mapping
References in purple are explained in detail in the following slides.
Cattan-Toupance, I., Y. Michalakis and C. Neema. 1998. Genetic structure of wild beanpopulations in their South Andean centre of origin. Theor. Appl. Genet. 96:844-851.
Cristofani, M., M.A. Machado and D. Grattapaglia. 1999. Genetic linkage maps of Citrus sunki Hort. Ex. Tan. and Poncirus trifoliata (L.) Raf. and mapping of citrus resistancegene. Euphytica 109(1):25-32.
Hashmi, G., R. Huettel, R. Meyer, L. Krusberg and F. Hammerschlag. 1997. RAPDanalysis of somaclonal variants derived from embryo callus cultures of peach. PlantCell Rep 16(9):624-627.
Kölliker, R., F.J. Stadelmann, B. Breidy and J. Nösberger. 1998. Fertilization anddefoliation frequency affect genetic diversity of Festuca pratensis Huds. inpermanent grasslands. Mol. Ecol. 7:1557-1567.
Martelli, G., F. Sunseri, I. Greco, M.R. Sabina, P. Porreca and A. Levi. 1999. Strawberrycultivars genetic relationship using randomly amplified polymorphic DNA (RAPD)analysis. Adv. Hortic. Sci. 13(3):99-104.
Martin, M., F. Piola, D. Chessel, M. Jay and P. Heizmann. 2001. The domesticationprocess of the Modern Rose: genetic structure and allelic composition of the rosecomplex. Theor. Appl. Genet. 102:398-404.
Morden, C.W. and W. Loeffler. 1999. Fragmentation and genetic differentiation amongsubpopulations of the endangered Hawaiian mint Haplostachys haplostachya (Lamiaceae). Mol. Ecol. 8:617-625.
Nebauer, S.G., L. del Castillo-Agudo and J. Segura. 1999. RAPD variation within andamong natural populations of outcrossing willow-leaved foxglove ( Digitalis obscura L.).Theor. Appl. Genet. 98:985-994.
Rodríguez, J.M., T. Berke, L. Engle and J. Nienhuis. 1999. Variation among and withinCapsicum species revealed by RAPD markers. Theor. Appl. Genet. 99:147-156.
Rom, M., M. Bar, A. Rom, M. Pilowsky and D. Gidoni. 1995. Purity control of F 1-hybridtomato cultivars by RAPD markers. Plant Breed. 114(2):188-190.
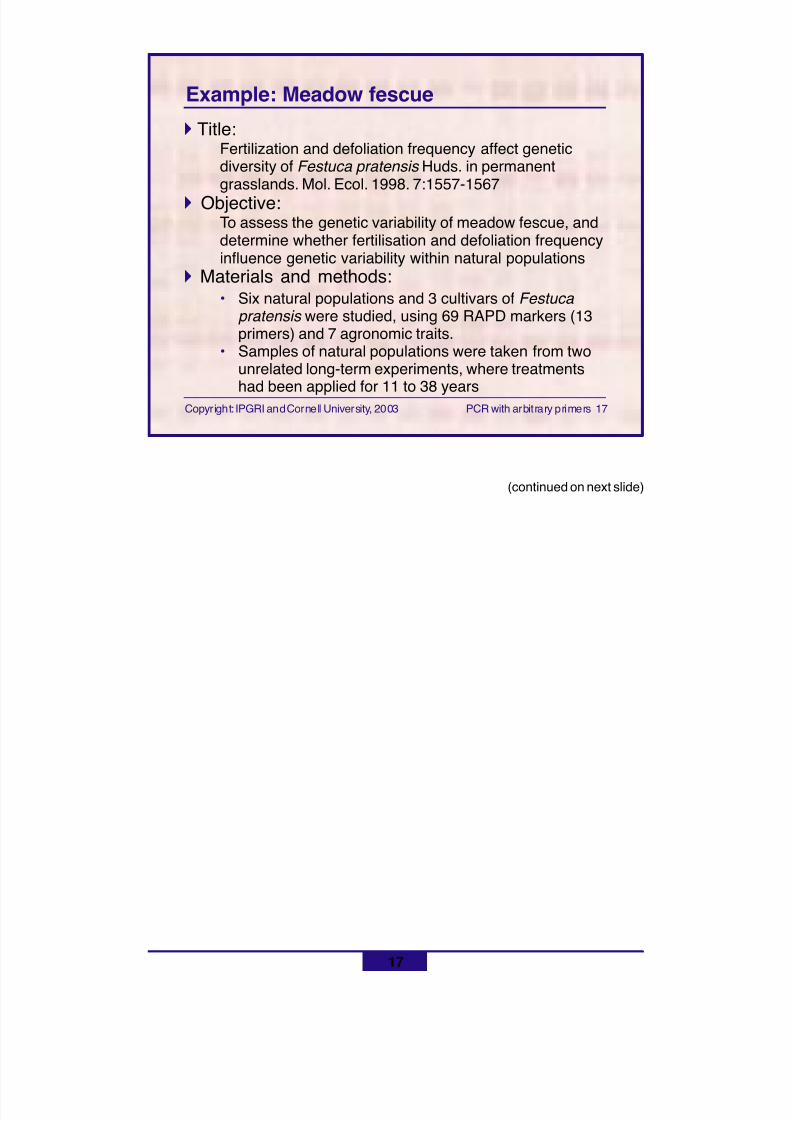
8/11/2019 Using molecular marker technology in studies on plant genetic diversity
http://slidepdf.com/reader/full/using-molecular-marker-technology-in-studies-on-plant-genetic-diversity 218/374
17
Copyright: IPGRI and Cornell University, 2003 PCR with arbitrary primers 17
Example: Meadow fescue! Title:
Fertilization and defoliation frequency affect geneticdiversity of Festuca pratensis Huds. in permanentgrasslands. Mol. Ecol. 1998. 7:1557-1567
! Objective:To assess the genetic variability of meadow fescue, anddetermine whether fertilisation and defoliation frequencyinfluence genetic variability within natural populations
! Materials and methods:• Six natural populations and 3 cultivars of Festuca
pratensis were studied, using 69 RAPD markers (13primers) and 7 agronomic traits.
• Samples of natural populations were taken from twounrelated long-term experiments, where treatments
had been applied for 11 to 38 years
(continued on next slide)
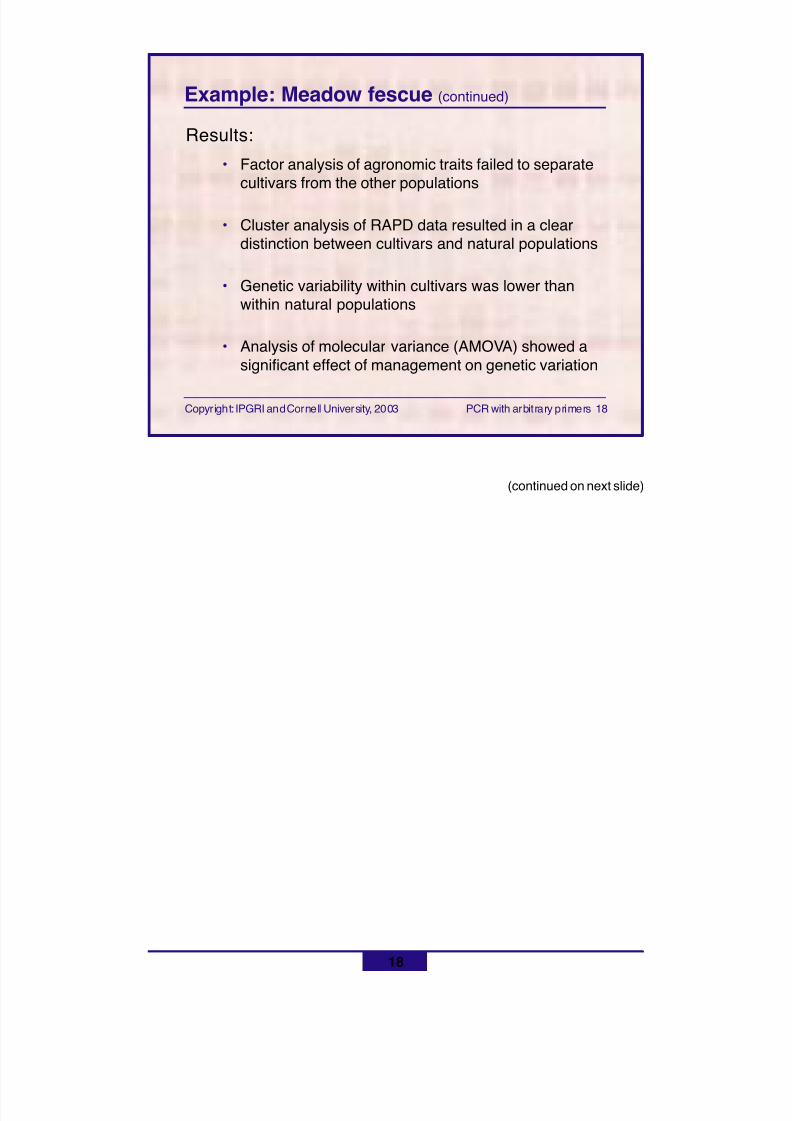
8/11/2019 Using molecular marker technology in studies on plant genetic diversity
http://slidepdf.com/reader/full/using-molecular-marker-technology-in-studies-on-plant-genetic-diversity 219/374
18
Copyright: IPGRI and Cornell University, 2003 PCR with arbitrary primers 18
Example: Meadow fescue (continued)
Results:
• Factor analysis of agronomic traits failed to separatecultivars from the other populations
• Cluster analysis of RAPD data resulted in a cleardistinction between cultivars and natural populations
• Genetic variability within cultivars was lower thanwithin natural populations
• Analysis of molecular variance (AMOVA) showed asignificant effect of management on genetic variation
(continued on next slide)
8/11/2019 Using molecular marker technology in studies on plant genetic diversity
http://slidepdf.com/reader/full/using-molecular-marker-technology-in-studies-on-plant-genetic-diversity 220/374
19
Copyright: IPGRI and Cornell University, 2003 PCR with arbitrary primers 19
Example: Meadow fescue (continued)
! Discussion:Significant genetic variation exists within cultivars andnatural populations of Festuca pratensis . However,fertilisation and high cutting frequency may reduce it
! Conclusions:Unfertilised and rarely cut populations of meadow fescueshould be conserved as a gene pool. Further studies ofother species are needed to learn more about howmanagement systems influence the diversity of plantcommunities and the genetic architecture of species
8/11/2019 Using molecular marker technology in studies on plant genetic diversity
http://slidepdf.com/reader/full/using-molecular-marker-technology-in-studies-on-plant-genetic-diversity 221/374
20
Copyright: IPGRI and Cornell University, 2003 PCR with arbitrary primers 20
Example: Bell pepper
! Title:Variation among and within Capsicum species revealedby RAPD markers. Theor. Appl. Genet. 1999. 99:147-156
! Objective:To characterize germplasm of Capsicum species
! Materials and methods:A total of 134 accessions from six Capsicum species,maintained at the Asian Vegetable Research andDevelopment Center (AVRDC) genebank, werecharacterised with 110 RAPD markers (25 primers)
(continued on next slide)
8/11/2019 Using molecular marker technology in studies on plant genetic diversity
http://slidepdf.com/reader/full/using-molecular-marker-technology-in-studies-on-plant-genetic-diversity 222/374
21
Copyright: IPGRI and Cornell University, 2003 PCR with arbitrary primers 21
Example: Bell pepper (continued)
! Results and discussion:
• Ten pairs of potentially duplicate accessionsdocumented
• Diagnostic RAPDs were identified and employed toimprove taxonomic identification. They could also beused to monitor natural and artificial hybridisation
• Three Capsicum accessions, misclassified onmorphological traits, were re-identified throughdiagnostic RAPDs
• Three accessions, previously unclassified, wereassigned to a species based on diagnostic RAPDs
• Capsicum annuum accessions from the genebank didnot differ from lines in the breeding program for RAPD
variation or diversity
(continued on next slide)
8/11/2019 Using molecular marker technology in studies on plant genetic diversity
http://slidepdf.com/reader/full/using-molecular-marker-technology-in-studies-on-plant-genetic-diversity 223/374
8/11/2019 Using molecular marker technology in studies on plant genetic diversity
http://slidepdf.com/reader/full/using-molecular-marker-technology-in-studies-on-plant-genetic-diversity 224/374
23
Copyright: IPGRI and Cornell University, 2003 PCR with arbitrary primers 23
Example: Modern rose! Title:
The domestication process of the Modern Rose: geneticstructure and allelic composition of the rose complex.Theor. Appl. Genet. 2001. 102:398-404
! Objective:To evaluate the genetic variability among cultivated rosevarieties and investigate the history of rose breeding
! Materials and methods:From 13 horticultural groups, 100 old varieties ofcultivated rose were selected for the way they markedsuccessive stages of domestication. They were studiedwith AP-PCR, using five long (20-mer) primers
(continued on next slide)
8/11/2019 Using molecular marker technology in studies on plant genetic diversity
http://slidepdf.com/reader/full/using-molecular-marker-technology-in-studies-on-plant-genetic-diversity 225/374
24
Copyright: IPGRI and Cornell University, 2003 PCR with arbitrary primers 24
Example: Modern rose (continued)
Results and discussion:• Fifty-eight polymorphic DNA fragments were
produced, 55 being informative and discriminatory,
allowing differentiation among almost all 100 cultivars
• A dendrogram showed the relationships betweenChinese and European founder roses, hybrid groupsof the first and second generations, and the mostmodern hybrid Teas produced during domestication
• Principal component analysis demonstrated theoccurrence of a continuous gradient of the European/ Chinese allele ratio, and considerable reduction ingenetic variability over the course of domestication
(continued on next slide)
8/11/2019 Using molecular marker technology in studies on plant genetic diversity
http://slidepdf.com/reader/full/using-molecular-marker-technology-in-studies-on-plant-genetic-diversity 226/374
25
Copyright: IPGRI and Cornell University, 2003 PCR with arbitrary primers 25
Example: Modern rose (continued)
Conclusions:
The effect of selection for a limited array ofmorphological traits resulted in the retention of only asmall number of alleles during the domestication of rose.Rose has much more genetic variation than is so farused. Selecting for different variants to generate varietieswith new and valuable aesthetic traits should bepossible
8/11/2019 Using molecular marker technology in studies on plant genetic diversity
http://slidepdf.com/reader/full/using-molecular-marker-technology-in-studies-on-plant-genetic-diversity 227/374
26
Copyright: IPGRI and Cornell University, 2003 PCR with arbitrary primers 26
For DAF:
! Primer concentrations are higher
! Shorter primers are used (5 to 8 nucleotides)
! Two-temperature cycle vs. the 3-temperaturecycle used in RAPD
! Highly complex banding patterns
References
Caetano-Anollés, G., B.J. Bassam and P.M. Gresshoff. 1991a. DNA amplificationfingerprinting: a strategy for genome analysis. Plant Mol. Biol. Rep. 9(4):294-307.
Caetano-Anollés, G., B.J. Bassam and P.M. Gresshoff. 1991b. DNA amplification usingvery short arbitrary oligonucleotide primers. Bio/Technology 9:553-557.
Differences: DAF and RAPD technologies
8/11/2019 Using molecular marker technology in studies on plant genetic diversity
http://slidepdf.com/reader/full/using-molecular-marker-technology-in-studies-on-plant-genetic-diversity 228/374
27
Copyright: IPGRI and Cornell University, 2003 PCR with arbitrary primers 27
In AP-PCR:
! The amplification is in three parts, each with itsown stringency and concentration of constituents
! High primer concentrations are used in the firstPCR cycles
! Primers of variable length, and often designedfor other purposes, are arbitrarily chosen for use(e.g. M13 universal sequencing primer)
Reference
Welsh, J. and M. McClelland. 1990. Fingerprinting genomes using PCR with arbitraryprimers. Nucleic Acids Res. 18(24):7213-7218.
27
Differences: AP-PCR and RAPD technologies
8/11/2019 Using molecular marker technology in studies on plant genetic diversity
http://slidepdf.com/reader/full/using-molecular-marker-technology-in-studies-on-plant-genetic-diversity 229/374
28
Copyright: IPGRI and Cornell University, 2003 PCR with arbitrary primers 28
In summary
! The RAPD technology is based on a simplePCR with a single short arbitrary primer
! RAPD easily produces a significant numberof bands, but markers are dominant andreproducibility problems are common
! DAF and AP-PCR are alternative, more complextechnologies, of RAPD
8/11/2019 Using molecular marker technology in studies on plant genetic diversity
http://slidepdf.com/reader/full/using-molecular-marker-technology-in-studies-on-plant-genetic-diversity 230/374
29
Copyright: IPGRI and Cornell University, 2003 PCR with arbitrary primers 29
By now you should know
! Main features of the RAPD procedure
! Causes of polymorphisms in the DNA moleculethat can be detected with RAPD
! Criteria for selecting RAPD bands for geneticdiversity analysis
! Advantages and disadvantages of RAPDtechnology
! Main differences of DAF and AP-PCR withRAPD technology
8/11/2019 Using molecular marker technology in studies on plant genetic diversity
http://slidepdf.com/reader/full/using-molecular-marker-technology-in-studies-on-plant-genetic-diversity 231/374
Basic references
Caetano-Anollés, G., B.J. Bassam and P.M. Gresshoff. 1991a. DNA amplificationfingerprinting: a strategy for genome analysis. Plant Mol. Biol. Rep. 9(4):294-307.
Caetano-Anollés, G., B.J. Bassam and P.M. Gresshoff. 1991b. DNA amplification usingvery short arbitrary oligonucleotide primers. Bio/Technology 9:553-557.
Caetano-Anollés, G., B.J. Bassam and P.M. Gresshoff. 1992. DNA fingerprinting:MAAPing out a RAPD redefinition? Bio/Technology 10(9):937.
Griffiths, A.J.F., J.H. Miller, D.T. Suzuki, R.C. Lewontin and W.M. Gelbart. 1996.An introduction to genetic analysis (6th edn.). W.H. Freeman and Co., NY.
Lowe, A.J., O. Hanotte and L. Guarino. 1996. Standardization of molecular genetictechniques for the characterization of germplasm collections: the case of randomamplified polymorphic DNA (RAPD). Plant Genet. Resour. Newsl. 107:50-54.
Munthali, M., B.V. Ford-Lloyd and H.J. Newbury. 1992. The random amplification ofpolymorphic DNA for fingerprinting plants. PCR Methods Appl. 1(4):274-276.
Welsh, J. and M. McClelland. 1990. Fingerprinting genomes using PCR with arbitraryprimers. Nucleic Acids Res. 18(24):7213-7218.
Williams, J.G.K., A.R. Kubelik, K.J. Livak, J.A. Rafalski and V. Tingey. 1990. DNApolymorphisms amplified by arbitrary primers are useful as genetic markers.Nucleic Acids Res. 18(22):6531-6535.
30
8/11/2019 Using molecular marker technology in studies on plant genetic diversity
http://slidepdf.com/reader/full/using-molecular-marker-technology-in-studies-on-plant-genetic-diversity 232/374
31
Copyright: IPGRI and Cornell University, 2003 PCR with arbitrary primers 31
Next
DNA-based technologiesPCR-based technologies
Amplified fragment length polymorphisms
! DNA-based technologies• PCR-based technologies
• Sequences-tagged sites (STS)• Latest strategies
! Complementary technologies! Final considerations! Glossary
8/11/2019 Using molecular marker technology in studies on plant genetic diversity
http://slidepdf.com/reader/full/using-molecular-marker-technology-in-studies-on-plant-genetic-diversity 233/374
Copyright: IPGRI and Cornell University, 2003 AFLPs 1
Using molecular marker technology in
studies on plant genetic diversityDNA-based technologies
PCR-based technologiesAmplified fragment length polymorphisms
(AFLPs)
8/11/2019 Using molecular marker technology in studies on plant genetic diversity
http://slidepdf.com/reader/full/using-molecular-marker-technology-in-studies-on-plant-genetic-diversity 234/374
2
Copyright: IPGRI and Cornell University, 2003 AFLPs 2
Contents
! AFLP technology, step by step• Four steps• DNA digestion and ligation
• PCRs and detection• Summarising the technology! Equipment! Interpreting AFLP bands! Advantages and disadvantages of AFLPs! Applications
• Limonium sp.• Stylosanthes spp.• Indian mustard
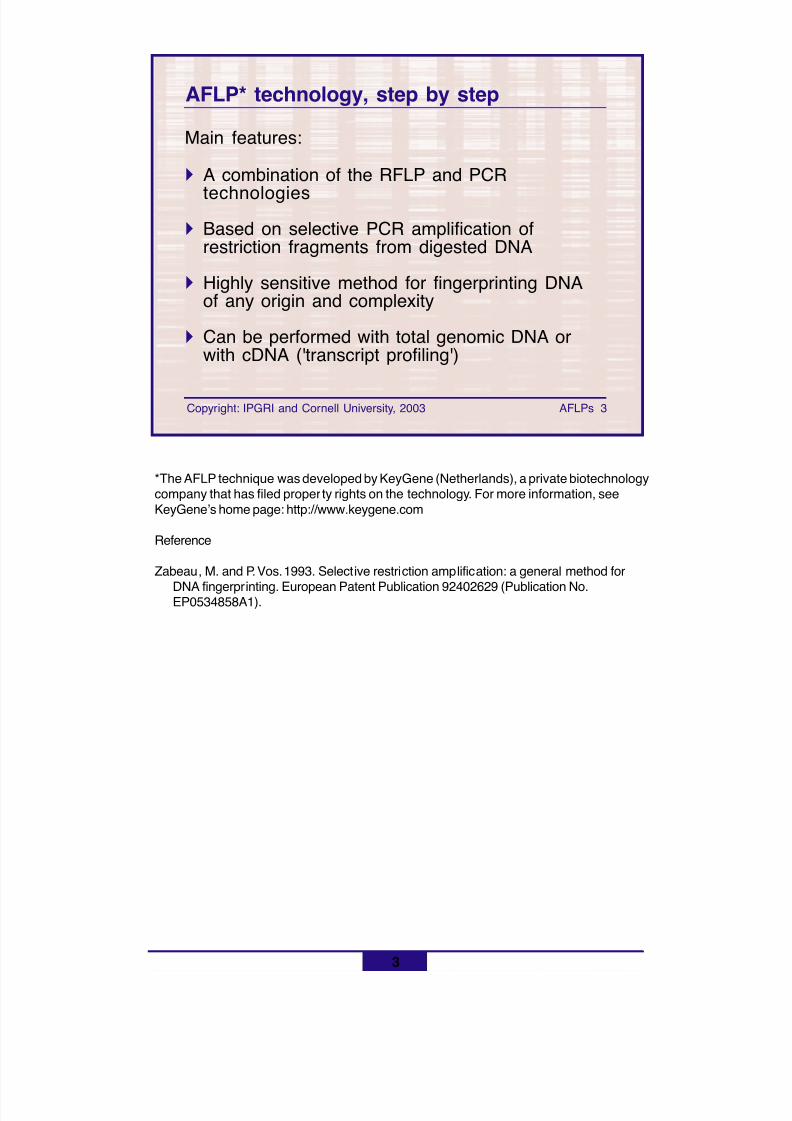
8/11/2019 Using molecular marker technology in studies on plant genetic diversity
http://slidepdf.com/reader/full/using-molecular-marker-technology-in-studies-on-plant-genetic-diversity 235/374
3
Copyright: IPGRI and Cornell University, 2003 AFLPs 3
Main features:
! A combination of the RFLP and PCR
technologies! Based on selective PCR amplification of
restriction fragments from digested DNA
! Highly sensitive method for fingerprinting DNAof any origin and complexity
! Can be performed with total genomic DNA orwith cDNA ('transcript profiling')
AFLP* technology, step by step
*The AFLP technique was developed by KeyGene (Netherlands), a private biotechnologycompany that has filed proper ty rights on the technology. For more information, seeKeyGene’s home page: http://www.keygene.com
Reference
Zabeau, M. and P. Vos. 1993. Selective restriction amplification: a general method for
DNA fingerprinting. European Patent Publication 92402629 (Publication No.EP0534858A1).
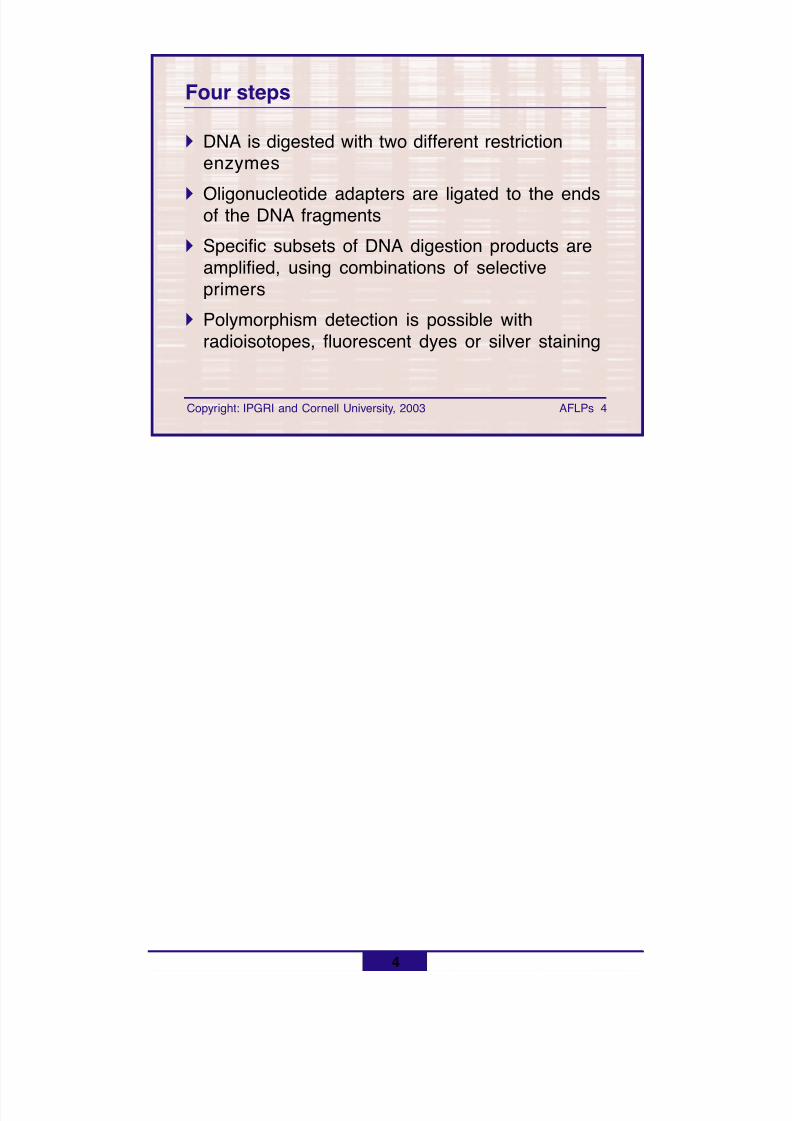
8/11/2019 Using molecular marker technology in studies on plant genetic diversity
http://slidepdf.com/reader/full/using-molecular-marker-technology-in-studies-on-plant-genetic-diversity 236/374
4
Copyright: IPGRI and Cornell University, 2003 AFLPs 4
Four steps
! DNA is digested with two different restrictionenzymes
! Oligonucleotide adapters are ligated to the endsof the DNA fragments
! Specific subsets of DNA digestion products areamplified, using combinations of selectiveprimers
! Polymorphism detection is possible withradioisotopes, fluorescent dyes or silver staining
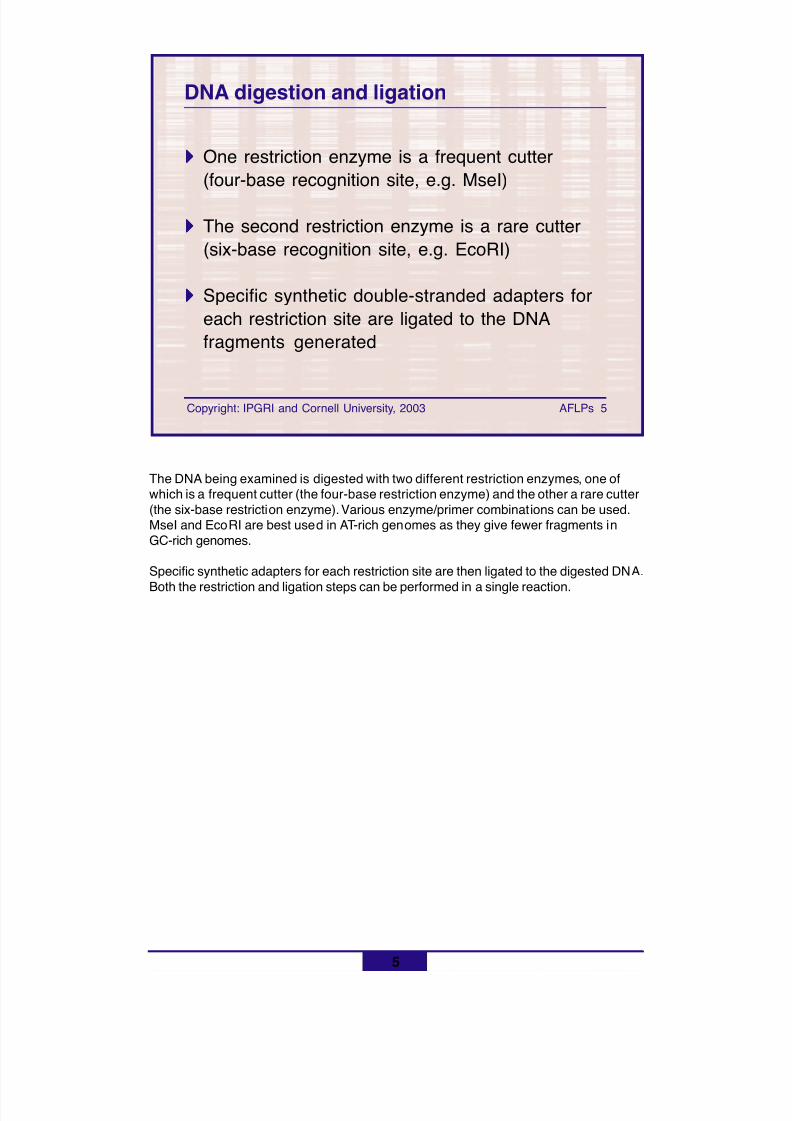
8/11/2019 Using molecular marker technology in studies on plant genetic diversity
http://slidepdf.com/reader/full/using-molecular-marker-technology-in-studies-on-plant-genetic-diversity 237/374
5
Copyright: IPGRI and Cornell University, 2003 AFLPs 5
DNA digestion and ligation
!!!!! One restriction enzyme is a frequent cutter(four-base recognition site, e.g. MseI)
!!!!! The second restriction enzyme is a rare cutter(six-base recognition site, e.g. EcoRI)
!!!!! Specific synthetic double-stranded adapters foreach restriction site are ligated to the DNAfragments generated
The DNA being examined is digested with two different restriction enzymes, one ofwhich is a frequent cutter (the four-base restriction enzyme) and the other a rare cutter(the six-base restriction enzyme). Various enzyme/primer combinations can be used.MseI and EcoRI are best used in AT-rich genomes as they give fewer fragments inGC-rich genomes.
Specific synthetic adapters for each restriction site are then ligated to the digested DNA.
Both the restriction and ligation steps can be performed in a single reaction.
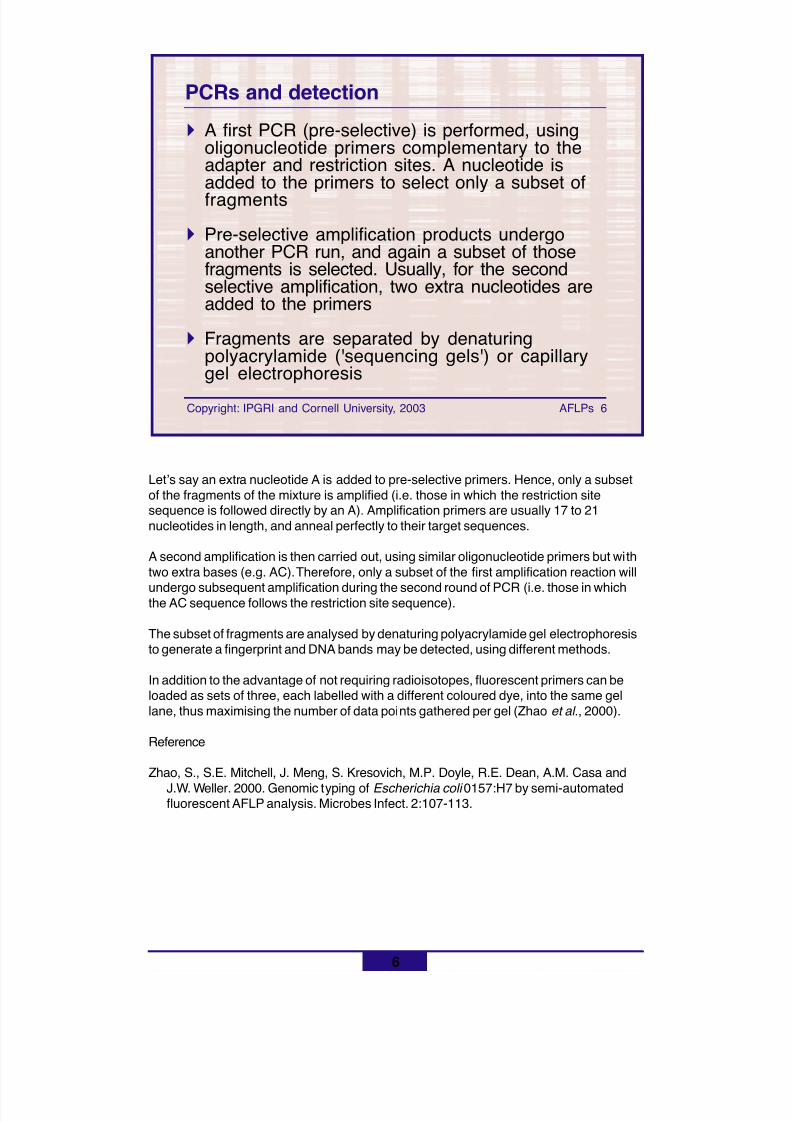
8/11/2019 Using molecular marker technology in studies on plant genetic diversity
http://slidepdf.com/reader/full/using-molecular-marker-technology-in-studies-on-plant-genetic-diversity 238/374
6
Copyright: IPGRI and Cornell University, 2003 AFLPs 6
PCRs and detection
! A first PCR (pre-selective) is performed, usingoligonucleotide primers complementary to theadapter and restriction sites. A nucleotide isadded to the primers to select only a subset offragments
! Pre-selective amplification products undergoanother PCR run, and again a subset of thosefragments is selected. Usually, for the secondselective amplification, two extra nucleotides areadded to the primers
! Fragments are separated by denaturingpolyacrylamide ('sequencing gels') or capillarygel electrophoresis
Let’s say an extra nucleotide A is added to pre-selective primers. Hence, only a subsetof the fragments of the mixture is amplified (i.e. those in which the restriction sitesequence is followed directly by an A). Amplification primers are usually 17 to 21nucleotides in length, and anneal perfectly to their target sequences.
A second amplification is then carried out, using similar oligonucleotide primers but withtwo extra bases (e.g. AC). Therefore, only a subset of the first amplification reaction will
undergo subsequent amplification during the second round of PCR (i.e. those in whichthe AC sequence follows the restriction site sequence).
The subset of fragments are analysed by denaturing polyacrylamide gel electrophoresisto generate a fingerprint and DNA bands may be detected, using different methods.
In addition to the advantage of not requiring radioisotopes, fluorescent primers can beloaded as sets of three, each labelled with a different coloured dye, into the same gellane, thus maximising the number of data points gathered per gel (Zhao et al ., 2000).
Reference
Zhao, S., S.E. Mitchell, J. Meng, S. Kresovich, M.P. Doyle, R.E. Dean, A.M. Casa andJ.W. Weller. 2000. Genomic typing of Escherichia coli 0157:H7 by semi-automatedfluorescent AFLP analysis. Microbes Infect. 2:107-113.
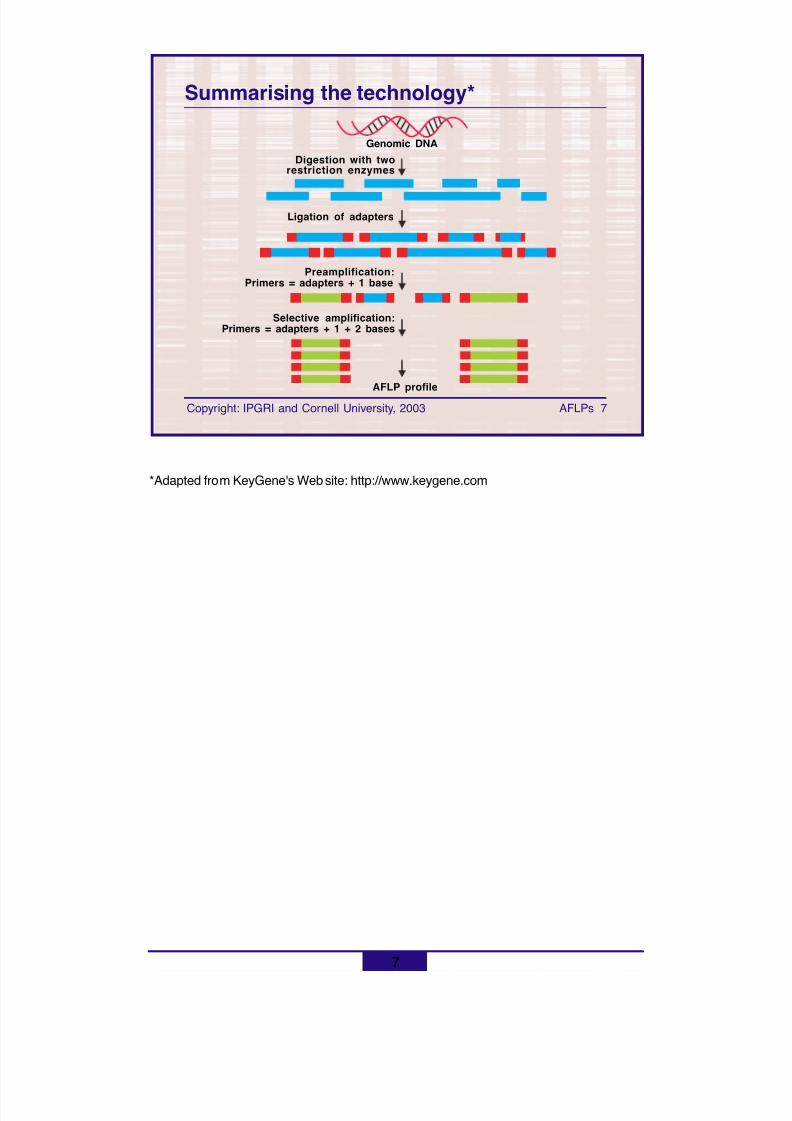
8/11/2019 Using molecular marker technology in studies on plant genetic diversity
http://slidepdf.com/reader/full/using-molecular-marker-technology-in-studies-on-plant-genetic-diversity 239/374
8/11/2019 Using molecular marker technology in studies on plant genetic diversity
http://slidepdf.com/reader/full/using-molecular-marker-technology-in-studies-on-plant-genetic-diversity 240/374
8
Copyright: IPGRI and Cornell University, 2003 AFLPs 8
Equipment
! Resources:• Distilled and/or deionised water• Reagents
! Equipment:
• Refrigerator and freezer• Laminar flow hood• Centrifuge• Thermocycler• Power supply units• Hotplate or microwave
• pH meter• Standard balance• Vertical gel
electrophoresis units• UV transilluminator• Automatic sequencer
8/11/2019 Using molecular marker technology in studies on plant genetic diversity
http://slidepdf.com/reader/full/using-molecular-marker-technology-in-studies-on-plant-genetic-diversity 241/374
9
Copyright: IPGRI and Cornell University, 2003 AFLPs 9
Interpreting AFLP bands
The AFLP technique detects polymorphismsarising from changes (presence or size) in therestriction sites or adjacent to these! Different restriction enzymes can be used, and different
combinations of pre- and selective nucleotides willincrease the probability of finding useful polymorphisms
! The more selective bases, the less polymorphism will bedetected
! Bands are usually scored as either present or absent
! Heterozygous versus homozygous bands may be detected,based on the thickness of the signal, although this can betricky
The molecular basis of AFLP polymorphisms will usually be caused at the nucleotidelevel. Single nucleotide changes will be detected when (1) the actual restriction sites areaffected; and (2) nucleotides adjacent to the restriction sites are affected, which causethe primers to mispair at the 3' end and prevent amplification.
Most AFLP markers will be mono-allelic, meaning that only one allele can be scored andthe corresponding allele is not detected. At a low frequency, bi-allelic markers will be
identified, as a result of small insertions or deletions in the restriction fragments.
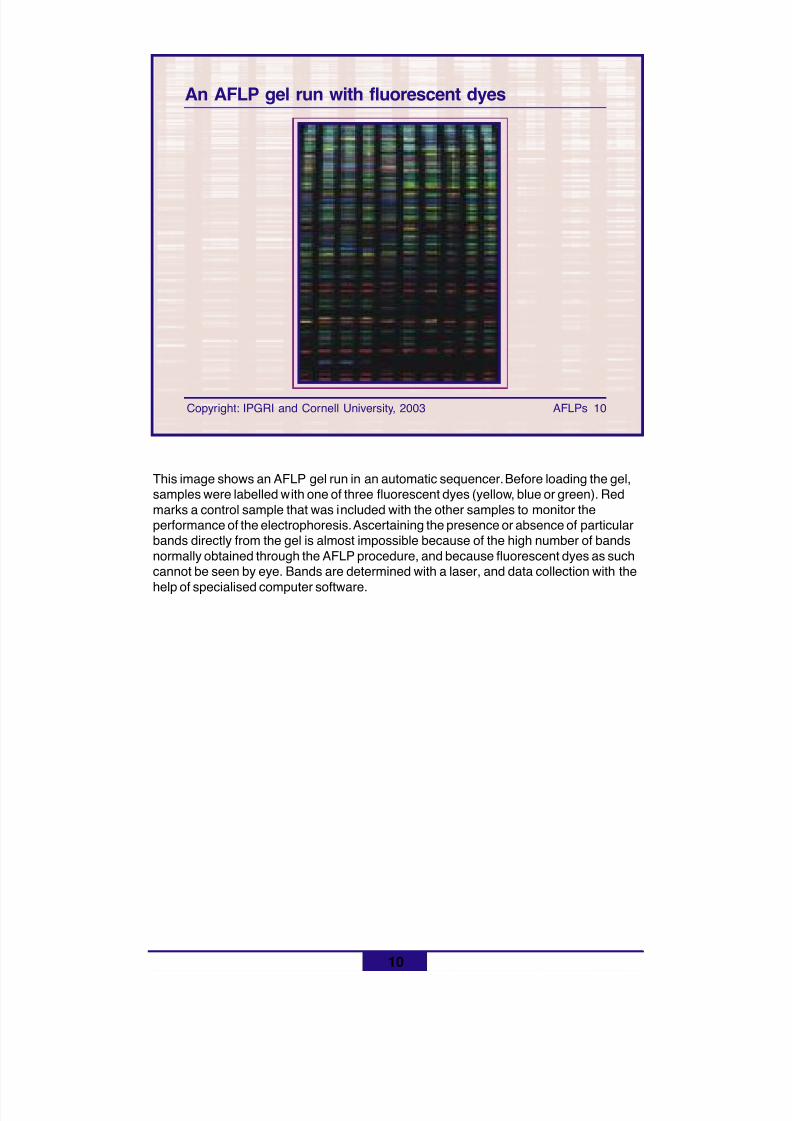
8/11/2019 Using molecular marker technology in studies on plant genetic diversity
http://slidepdf.com/reader/full/using-molecular-marker-technology-in-studies-on-plant-genetic-diversity 242/374
10
Copyright: IPGRI and Cornell University, 2003 AFLPs 10
An AFLP gel run with fluorescent dyes
This image shows an AFLP gel run in an automatic sequencer. Before loading the gel,samples were labelled with one of three fluorescent dyes (yellow, blue or green). Redmarks a control sample that was included with the other samples to monitor theperformance of the electrophoresis. Ascertaining the presence or absence of particularbands directly from the gel is almost impossible because of the high number of bandsnormally obtained through the AFLP procedure, and because fluorescent dyes as suchcannot be seen by eye. Bands are determined with a laser, and data collection with the
help of specialised computer software.
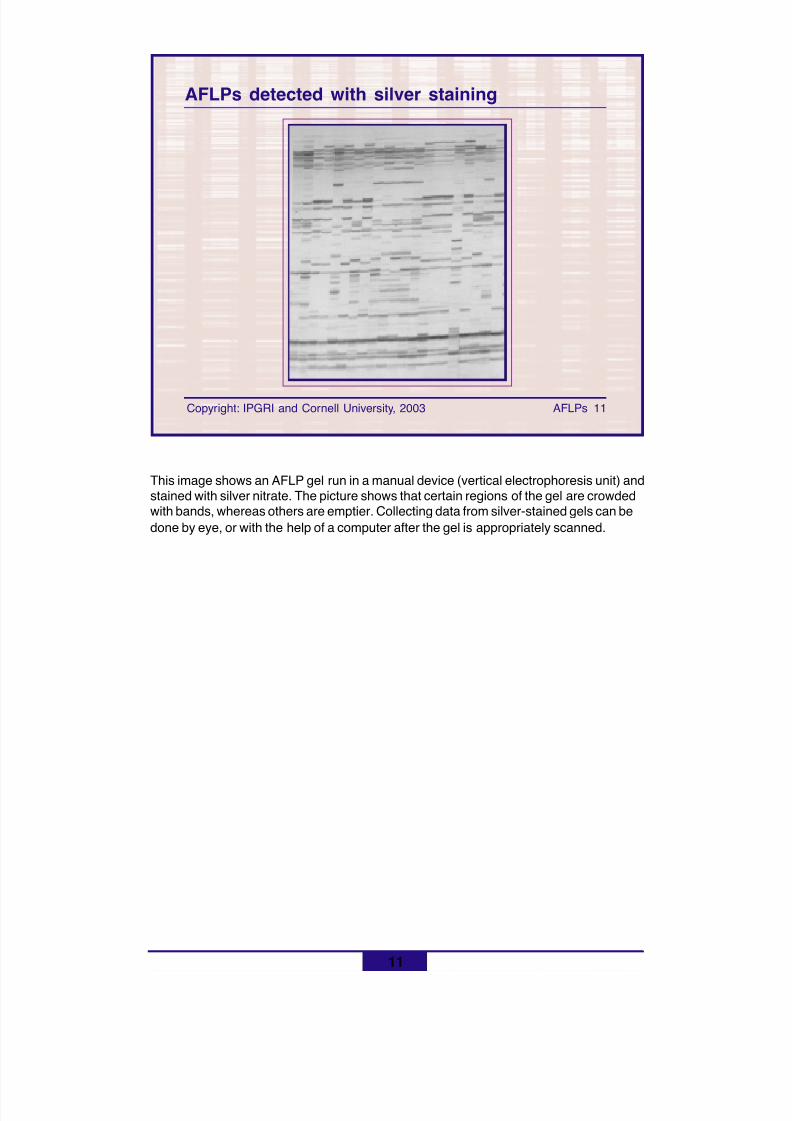
8/11/2019 Using molecular marker technology in studies on plant genetic diversity
http://slidepdf.com/reader/full/using-molecular-marker-technology-in-studies-on-plant-genetic-diversity 243/374
11
Copyright: IPGRI and Cornell University, 2003 AFLPs 11
AFLPs detected with silver staining
This image shows an AFLP gel run in a manual device (vertical electrophoresis unit) andstained with silver nitrate. The picture shows that certain regions of the gel are crowdedwith bands, whereas others are emptier. Collecting data from silver-stained gels can bedone by eye, or with the help of a computer after the gel is appropriately scanned.
8/11/2019 Using molecular marker technology in studies on plant genetic diversity
http://slidepdf.com/reader/full/using-molecular-marker-technology-in-studies-on-plant-genetic-diversity 244/374
12
Copyright: IPGRI and Cornell University, 2003 AFLPs 12
Advantages of AFLPs
! AFLPs allow a quick scan of the whole genomefor polymorphisms
! Because of the large number of bandsgenerated, each marker gives a highlyinformative fingerprint
! They are also highly reproducible
! No prior sequence information or probegeneration is needed
! Extremely useful in creating quick genetic maps
! “Transcript profiling”
The AFLP technology can be applied to any DNA sample, including human, animal, plantand microbial DNA, giving it the potential to become a universal DNA fingerprinting system.
Because of the nature of AFLP primers, the markers obtained are highly reliable androbust, unaffected by small variations in the amplification process.
A typical AFLP fingerprint contains between 50 and 100 amplified fragments, many of
which, or even most, may serve as genetic markers.
The generation of transcript profiles using AFLPs with cDNAs is an efficient tool foridentifying differentially expressed mRNAs. This tool has several advantages that canbe useful for discovering genes in germplasm.
8/11/2019 Using molecular marker technology in studies on plant genetic diversity
http://slidepdf.com/reader/full/using-molecular-marker-technology-in-studies-on-plant-genetic-diversity 245/374
13
Copyright: IPGRI and Cornell University, 2003 AFLPs 13
Disadvantages of AFLPs
! AFLPs generate huge quantities of information,which may need automated analysis andtherefore computer technology
! AFLP markers display dominance
! In genetic mapping, AFLPs often cluster at thecentromeres and telomeres
! They are technically demanding in thelaboratory and, especially, in data analysis
A further drawback of AFLP technology is perhaps the lack of guarantee of homologybetween bands of similar molecular weight (MW), thus creating difficulties for sometypes of studies such as phylogenetic analyses. However, while non-homologous bandswith similar weight are also found with other markers such as RAPDs, they may, in fact,be less common with AFLP technology because gel resolution is very high and,consequently, the likelihood of non-homologous bands being coincidentally of the samemolecular weight is low.
8/11/2019 Using molecular marker technology in studies on plant genetic diversity
http://slidepdf.com/reader/full/using-molecular-marker-technology-in-studies-on-plant-genetic-diversity 246/374
14
Copyright: IPGRI and Cornell University, 2003 AFLPs 14
! Genetic diversity assessment
! Genetic distance analysis! Genetic fingerprinting
! Analysis of germplasm collections
! Genome mapping
! Monitoring diagnostic markers
Applications
References in purple colour are explained in detail in the following slides.
Badr, A., K. Müller, R. Schäfer-Pregl, H. El Rabey, S. Effgen, H.H. Ibrahim, C. Pozzi,W. Rohde and F. Salamini. 2000. On the origin and domestication history of barley(Hordeum vulgare ). Mol. Biol. Evol. 17(4):499-510.
Barret, B.A. and K.K. Kidwell. 1998. AFLP-based genetic diversity assessment amongwheat cultivars from the Pacific Northwest. Crop Sci. 38:1261-1271.
Beebe, S., J. Rengifo, E. Gaitán, M.C. Duque and J. Tohme. 2001. Diversity and origin ofAndean landraces of common bean. Crop Sci. 41:854-862.
Gilbert, K.G., S. Garton, M.A. Karam, G.M. Arnold, A. Karp, K.J. Edwards, D.T. Cookeand J.H.A. Barker. 2002. A high degree of genetic diversity is revealed in Isatis spp.(dyer's woad) by amplified fragment length polymorphism (AFLP). Theor. Appl. Genet.104:1150-1156.
Miyashita, N.T., A. Kawabe and H. Innan. 1999. DNA variation in the wild plant Arabidopsis thaliana revealed by amplified fragment length polymorphism analysis. Genetics152:1273-1731.
Palacios, C. and F. González-Candelas. 1999. AFLP analysis of the critically endangeredLimonium cavanillesii (Plumbaginaceae). J. Hered. 90(4):485-489.
Rouf-Mian, M.A., A.A. Hopkins and J.C. Zwonitzer. 2002. Determination of geneticdiversity in Tall Fescue with AFLP markers. Crop Sci. 42:944-950.
Sawkins, M.C., B.L. Maass, B.C. Pengelly, H.J. Newbury, B.V. Ford-Lloyd, N. Maxted andR. Smith. 2001. Geographical patterns of genetic variation in two species of Stylosanthes Sw. using amplified fragment length polymorphism. Mol. Ecol. 10:1947-1958.
Srivastava, A., V. Gupta, D. Pental and A.K. Pradhan. 2001. AFLP-based geneticdiversity assessment amongst agronomically important natural and some newlysynthesized lines of Brassica juncea . Theor. Appl. Genet. 102:193-199.
Vuylsteke, M., R. Mank, B. Brugmans, P. Stam and M. Kuiper. 2000. Furthercharacterization of AFLP (R) data as a tool in genetic diversity assessment amongmaize ( Zea mays L.) inbred lines. Mol. Breed. 6(3):265-276.
8/11/2019 Using molecular marker technology in studies on plant genetic diversity
http://slidepdf.com/reader/full/using-molecular-marker-technology-in-studies-on-plant-genetic-diversity 247/374
15
Copyright: IPGRI and Cornell University, 2003 AFLPs 15
Example: Limonium sp.
! Title:AFLP analysis of the critically endangered Limonium cavanillesii (Plumbaginaceae). J. Hered. 1999.
90(4):485-489! Objective:
To compare the performance of AFLPs for the geneticdiversity analysis of L. cavanillesii and their efficiencyagainst a previous RAPD study
! Materials and methods:DNA was extracted from 29 wild individuals. Theseindividuals were the same as those employed in aprevious RAPD study*. Three primer combinationswere selected
*Palacios, C and F. González-Candelas. 1997. Lack of genetic variability in the rare andendangered Limonium cavanillesii (Plumbaginaceae) using RAPD markers. Mol.Ecol. 6:671-675.
(continued on next slide)
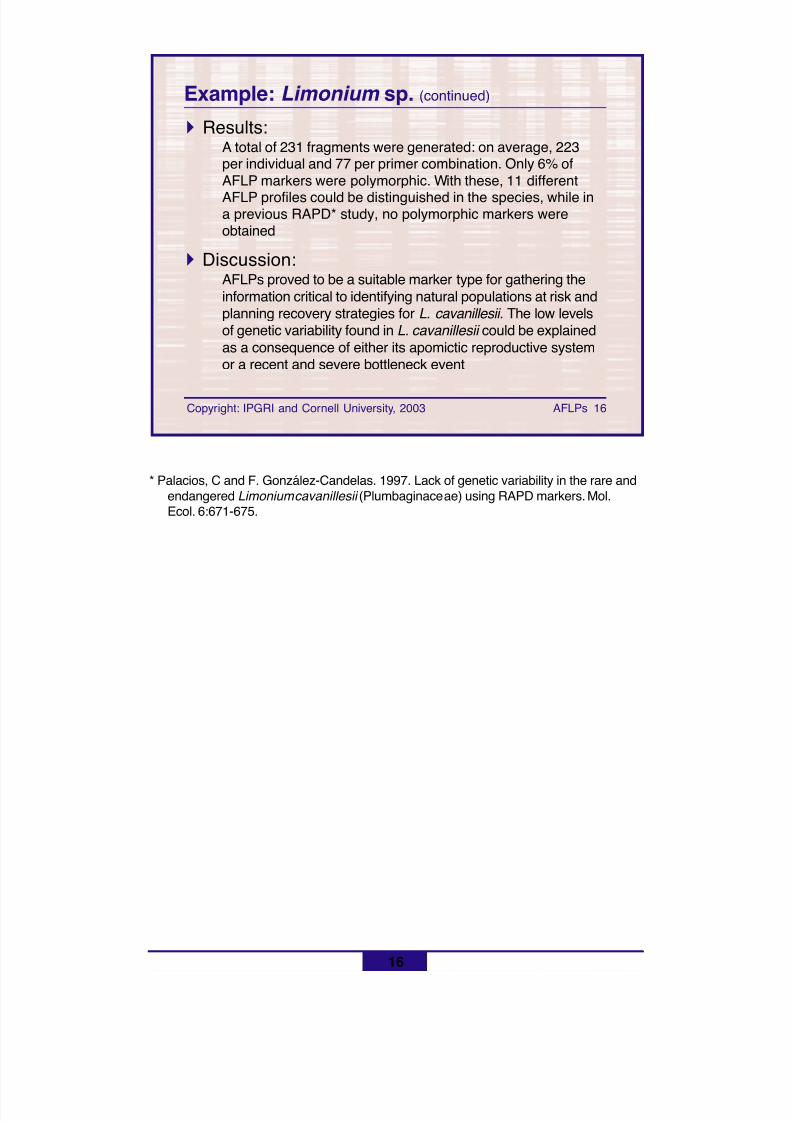
8/11/2019 Using molecular marker technology in studies on plant genetic diversity
http://slidepdf.com/reader/full/using-molecular-marker-technology-in-studies-on-plant-genetic-diversity 248/374
16
Copyright: IPGRI and Cornell University, 2003 AFLPs 16
Example: Limonium sp. (continued)
! Results:A total of 231 fragments were generated: on average, 223per individual and 77 per primer combination. Only 6% ofAFLP markers were polymorphic. With these, 11 differentAFLP profiles could be distinguished in the species, while ina previous RAPD* study, no polymorphic markers wereobtained
! Discussion:AFLPs proved to be a suitable marker type for gathering theinformation critical to identifying natural populations at risk andplanning recovery strategies for L. cavanillesii . The low levelsof genetic variability found in L. cavanillesii could be explainedas a consequence of either its apomictic reproductive systemor a recent and severe bottleneck event
* Palacios, C and F. González-Candelas. 1997. Lack of genetic variability in the rare andendangered Limonium cavanillesii (Plumbaginaceae) using RAPD markers. Mol.Ecol. 6:671-675.
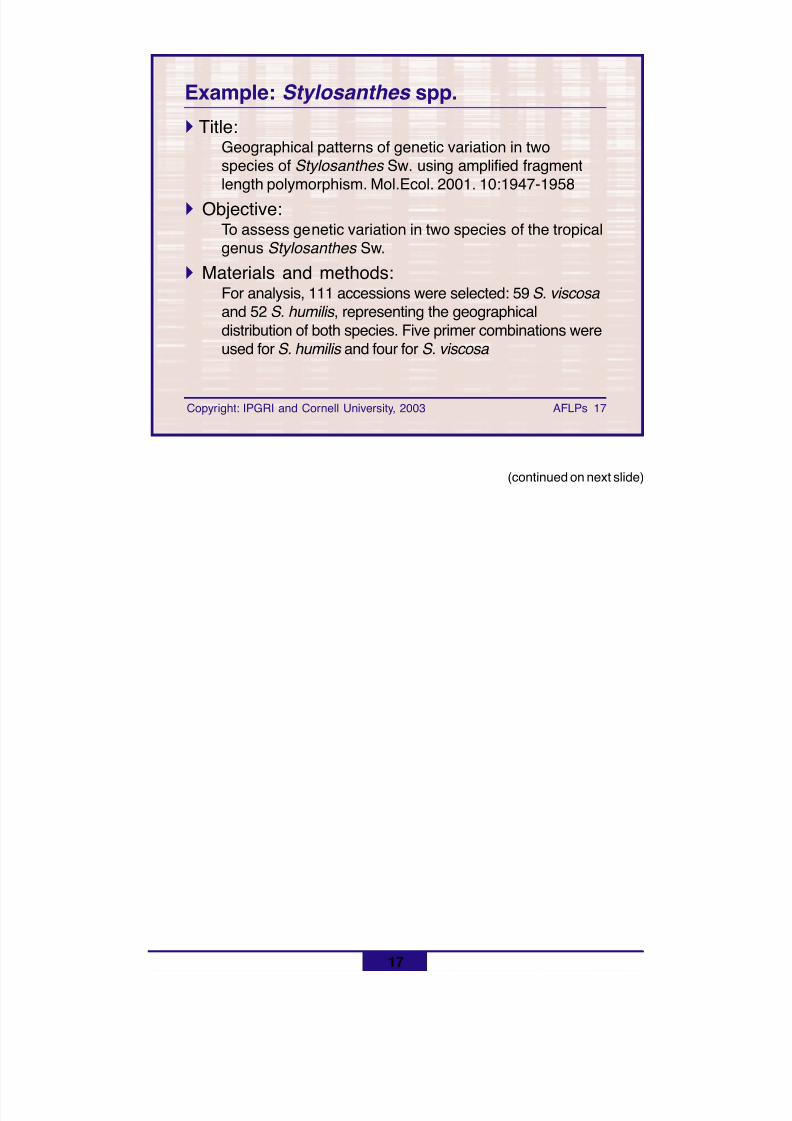
8/11/2019 Using molecular marker technology in studies on plant genetic diversity
http://slidepdf.com/reader/full/using-molecular-marker-technology-in-studies-on-plant-genetic-diversity 249/374
17
Copyright: IPGRI and Cornell University, 2003 AFLPs 17
Example: Stylosanthes spp.! Title:
Geographical patterns of genetic variation in twospecies of Stylosanthes Sw. using amplified fragmentlength polymorphism. Mol.Ecol. 2001. 10:1947-1958
! Objective:To assess genetic variation in two species of the tropicalgenus Stylosanthes Sw.
! Materials and methods:For analysis, 111 accessions were selected: 59 S. viscosa and 52 S. humilis , representing the geographicaldistribution of both species. Five primer combinations wereused for S. humilis and four for S. viscosa
(continued on next slide)
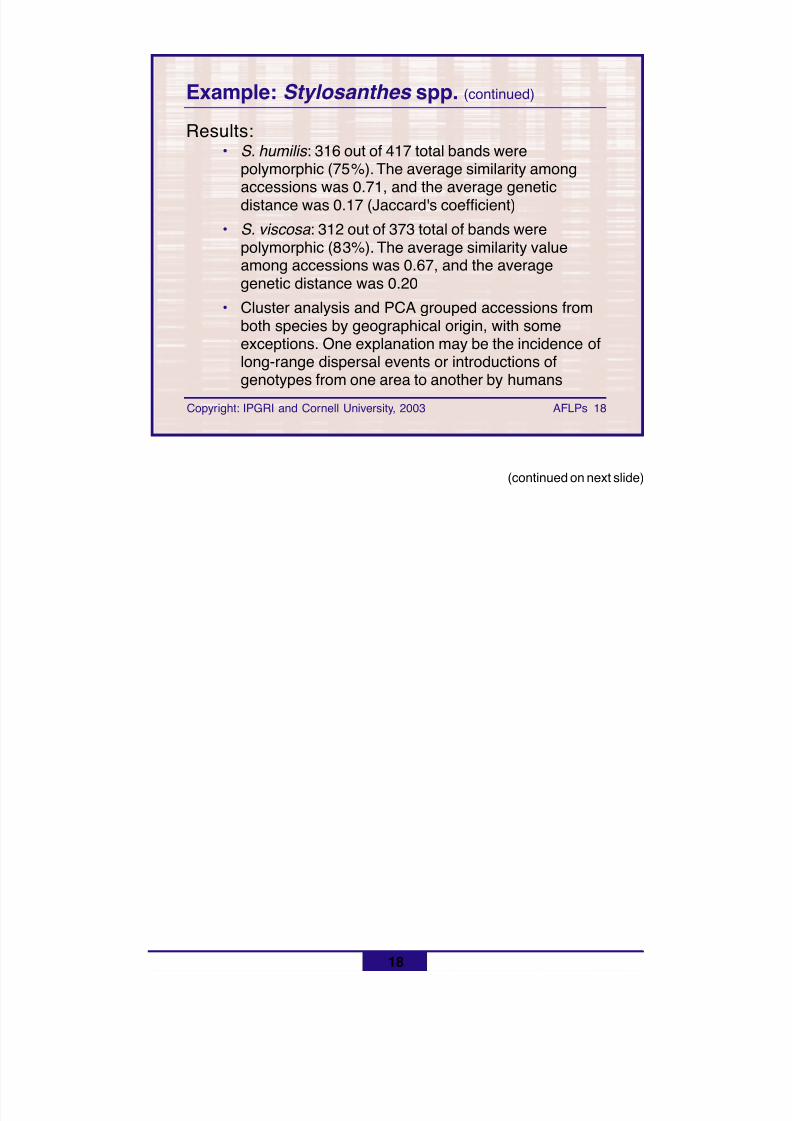
8/11/2019 Using molecular marker technology in studies on plant genetic diversity
http://slidepdf.com/reader/full/using-molecular-marker-technology-in-studies-on-plant-genetic-diversity 250/374
18
Copyright: IPGRI and Cornell University, 2003 AFLPs 18
Example: Stylosanthes spp. (continued)
Results:• S. humilis : 316 out of 417 total bands were
polymorphic (75%). The average similarity amongaccessions was 0.71, and the average geneticdistance was 0.17 (Jaccard's coefficient)
• S. viscosa : 312 out of 373 total of bands werepolymorphic (83%). The average similarity valueamong accessions was 0.67, and the averagegenetic distance was 0.20
• Cluster analysis and PCA grouped accessions fromboth species by geographical origin, with someexceptions. One explanation may be the incidence oflong-range dispersal events or introductions ofgenotypes from one area to another by humans
(continued on next slide)
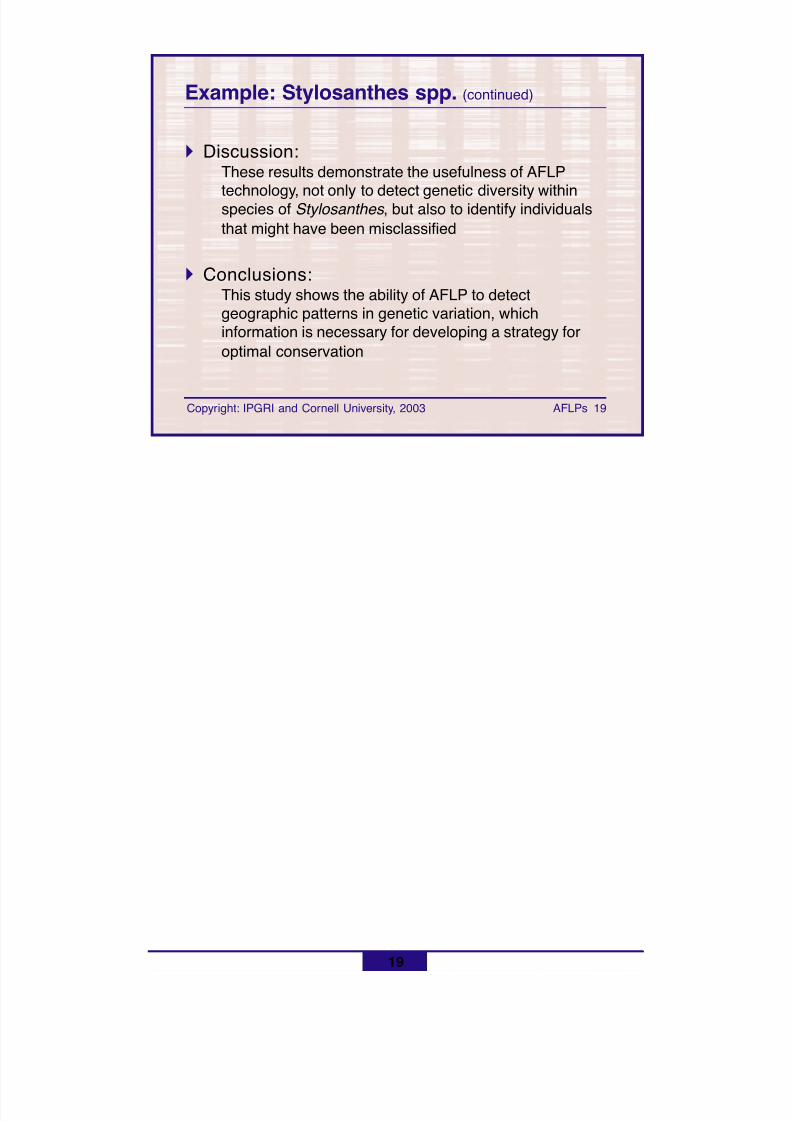
8/11/2019 Using molecular marker technology in studies on plant genetic diversity
http://slidepdf.com/reader/full/using-molecular-marker-technology-in-studies-on-plant-genetic-diversity 251/374
19
Copyright: IPGRI and Cornell University, 2003 AFLPs 19
Example: Stylosanthes spp. (continued)
! Discussion:These results demonstrate the usefulness of AFLP
technology, not only to detect genetic diversity withinspecies of Stylosanthes , but also to identify individualsthat might have been misclassified
! Conclusions:This study shows the ability of AFLP to detectgeographic patterns in genetic variation, whichinformation is necessary for developing a strategy foroptimal conservation
8/11/2019 Using molecular marker technology in studies on plant genetic diversity
http://slidepdf.com/reader/full/using-molecular-marker-technology-in-studies-on-plant-genetic-diversity 252/374
20
Copyright: IPGRI and Cornell University, 2003 AFLPs 20
Example: Indian mustard! Title:
AFLP-based genetic diversity assessment amongstagronomically important natural and some newly synthesizedlines of Brassica juncea . Theor. Appl. Genet. 2001. 102:193-199
! Objectives:• Study the genetic variation among B. juncea accessions• Identify the AFLP primer combinations that would be
informative for varietal identification• Search polymorphic markers for eventual tagging of
putative agronomic traits available in the germplasm studied!!!!! Materials and methods:
The study used 30 B. juncea accessions, representing 21established natural populations and 9 synthetic varieties andlines. Selective amplification was carried out with 21 EcoRI/ MseI primer pair combinations
(continued on next slide)
8/11/2019 Using molecular marker technology in studies on plant genetic diversity
http://slidepdf.com/reader/full/using-molecular-marker-technology-in-studies-on-plant-genetic-diversity 253/374
21
Copyright: IPGRI and Cornell University, 2003 AFLPs 21
Example: Indian mustard (continued)
Results:• For the 30 genotypes, 1251 fragments were scored.
On average, 37 bands per primer combination were
polymorphic• No single primer pair could distinguish all 30
genotypes on the basis of the presence or absence ofvariety specific bands
• Four primer pairs were found to be most informativeand had 100% discriminatory power
• Cluster analysis based on these four informativeprimers broadly agreed with results of earlier studiesbased on morphological traits* and RAPD data**
**Jain, A., S. Bhatia, S.S. Banga, S. Prakash and M. Lakshmikumaran. 1994. Potentialuse of the random amplified polymorphic DNA (RAPD) technique to study the geneticdiversity in Indian mustard ( Brassica juncea ) and its relationship to heterosis. Theor.Appl. Genet. 88:116-122.
*Pradhan, A.K., Y.S. Sodhi, A. Mukhopadhyay and D. Pental. 1993. Heterosis breeding inIndian mustard ( Brassica juncea (L.) Czern. & Cross): analysis of component charac-ters contributing to heterosis for yield. Euphytica 69:219-229.
(continued on next slide)
8/11/2019 Using molecular marker technology in studies on plant genetic diversity
http://slidepdf.com/reader/full/using-molecular-marker-technology-in-studies-on-plant-genetic-diversity 254/374
22
Copyright: IPGRI and Cornell University, 2003 AFLPs 22
Example: Indian mustard (continued)
!!!!! Discussion and conclusions:
In a previous RAPD* study with 32 primers, an averageof 12 polymorphic loci per primer had been obtained.Thus, the AFLP technique provided a higher degree ofresolution for discriminating among closely relatedgermplasm than did RAPDs. AFLP analysis thereforehas the potential to complement both conventional andother types of molecular marker data
*Jain, A., S. Bhatia, S.S. Banga, S. Prakash and M. Lakshmikumaran. 1994. Potentialuse of the random amplified polymorphic DNA (RAPD) technique to study thegenetic diversity in Indian mustard ( Brassica juncea ) and its relationship to heterosis.Theor. Appl. Genet. 88:116-122 .
8/11/2019 Using molecular marker technology in studies on plant genetic diversity
http://slidepdf.com/reader/full/using-molecular-marker-technology-in-studies-on-plant-genetic-diversity 255/374
23
Copyright: IPGRI and Cornell University, 2003 AFLPs 23
In summary
! The AFLP technology is based on the selectiveamplification of restriction fragments after DNAdigestion
! It detects polymorphisms caused by changes inthe restriction sites or their neighbouring regions
! This technology yields a large number of bandsper run, but they are dominant and theprocedure technically demanding
8/11/2019 Using molecular marker technology in studies on plant genetic diversity
http://slidepdf.com/reader/full/using-molecular-marker-technology-in-studies-on-plant-genetic-diversity 256/374
8/11/2019 Using molecular marker technology in studies on plant genetic diversity
http://slidepdf.com/reader/full/using-molecular-marker-technology-in-studies-on-plant-genetic-diversity 257/374
Basic references
Brown, S.M. and S. Kresovich. 1996. Molecular characterization for plant geneticresources conservation. Pp. 85-93 in Genome Mapping in Plants (H. Paterson, ed.).RG Landes Company and Academic Press, Austin, TX.
KeyGene, N.V. 2001. Empowering genomics. http://www.keygene.com (30 June 2002)
Vos, P., R. Hogers, M. Bleeker, M. Reijans, T. van de Lee, M. Hornes, A. Frijters, J. Pot,J. Peleman, M. Kuiper and M. Zabeau. 1995. AFLP: a new technique for DNAfingerprinting. Nucleic Acids Res. 23:4407-4414.
Zabeau, M. and P. Vos. 1993. Selective restriction amplification: a general method forDNA fingerprinting. European Patent Publication 92402629 (Publication No.EP0534858A1).
Zhao, S., S.E. Mitchell, J. Meng, S. Kresovich, M.P. Doyle, R.E. Dean, A.M. Casa andJ.W. Weller. 2000. Genomic typing of Escherichia coli 0157:H7 by semi-automatedfluorescent AFLP analysis. Microbes Infect. 2:107-113.
25
8/11/2019 Using molecular marker technology in studies on plant genetic diversity
http://slidepdf.com/reader/full/using-molecular-marker-technology-in-studies-on-plant-genetic-diversity 258/374
26
Copyright: IPGRI and Cornell University, 2003 AFLPs 26
Next
DNA-based technologiesPCR-based technologies
Sequences-tagged sites
! DNA-based technologies• PCR-based technologies
• Latest strategies! Complementary technologies! Final considerations! Glossary
8/11/2019 Using molecular marker technology in studies on plant genetic diversity
http://slidepdf.com/reader/full/using-molecular-marker-technology-in-studies-on-plant-genetic-diversity 259/374
Copyright: IPGRI and Cornell University, 2003 STS 1
Using molecular marker technology instudies on plant genetic diversity
PCR-based technologies• Sequences-tagged sites
(Microsatellites, SCARs, CAPS, ISSRs)
DNA-based technologies
8/11/2019 Using molecular marker technology in studies on plant genetic diversity
http://slidepdf.com/reader/full/using-molecular-marker-technology-in-studies-on-plant-genetic-diversity 260/374
2
Copyright: IPGRI and Cornell University, 2003 STS 2
Contents
! Sequence-tagged sites (STS) as markers! Microsatellites (SSRs, STMS or SSRPs)
• Identifying microsatellite regions• Structure• Selecting primers• Methodology and visualisation• Equipment• Advantages and disadvantages• Applications of SSRs and examples
! SCARs! CAPS! ISSRs
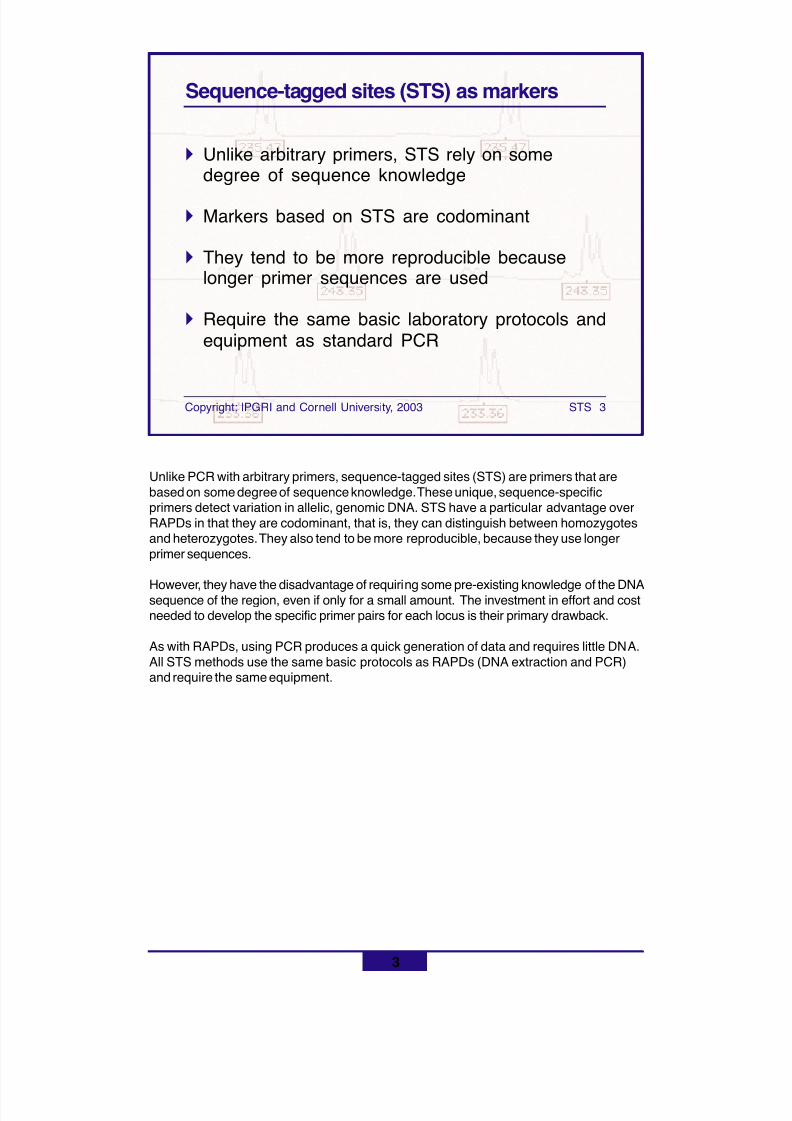
8/11/2019 Using molecular marker technology in studies on plant genetic diversity
http://slidepdf.com/reader/full/using-molecular-marker-technology-in-studies-on-plant-genetic-diversity 261/374
3
Copyright: IPGRI and Cornell University, 2003 STS 3
! Unlike arbitrary primers, STS rely on somedegree of sequence knowledge
! Markers based on STS are codominant
! They tend to be more reproducible becauselonger primer sequences are used
! Require the same basic laboratory protocols andequipment as standard PCR
Sequence-tagged sites (STS) as markers
Unlike PCR with arbitrary primers, sequence-tagged sites (STS) are primers that arebased on some degree of sequence knowledge. These unique, sequence-specificprimers detect variation in allelic, genomic DNA. STS have a particular advantage overRAPDs in that they are codominant, that is, they can distinguish between homozygotesand heterozygotes. They also tend to be more reproducible, because they use longerprimer sequences.
However, they have the disadvantage of requiring some pre-existing knowledge of the DNAsequence of the region, even if only for a small amount. The investment in effort and costneeded to develop the specific primer pairs for each locus is their primary drawback.
As with RAPDs, using PCR produces a quick generation of data and requires little DNA.All STS methods use the same basic protocols as RAPDs (DNA extraction and PCR)and require the same equipment.
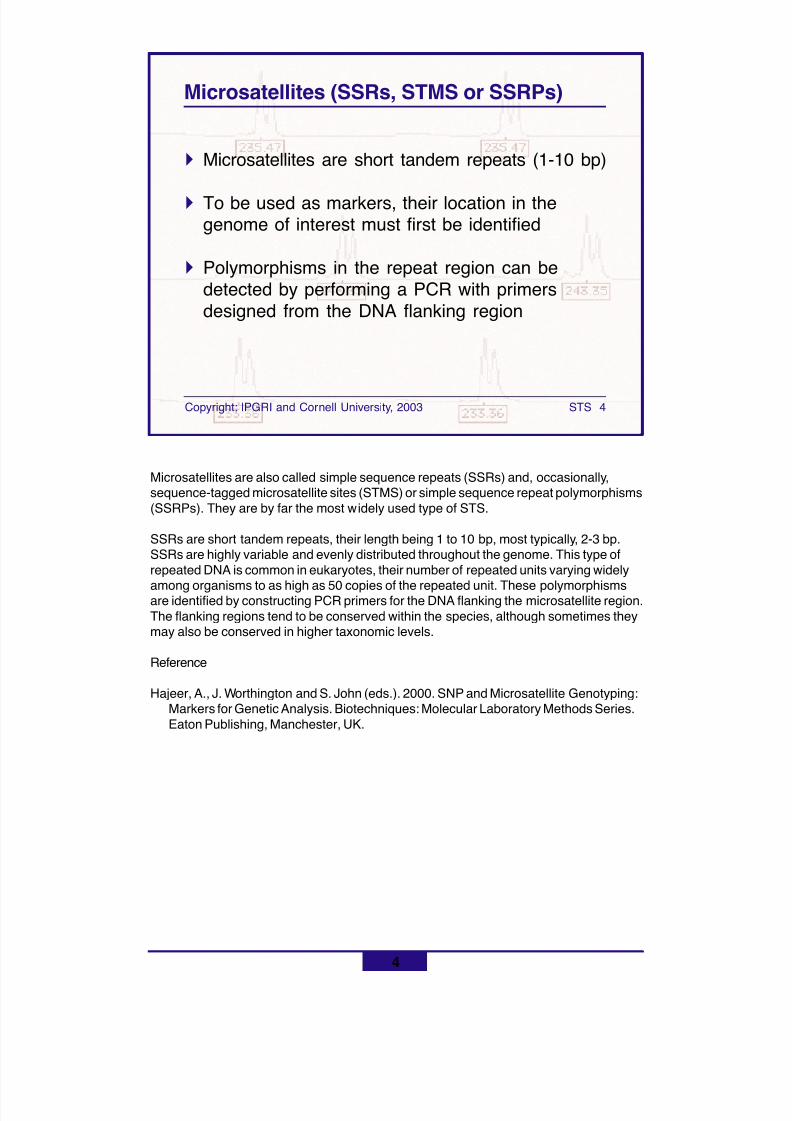
8/11/2019 Using molecular marker technology in studies on plant genetic diversity
http://slidepdf.com/reader/full/using-molecular-marker-technology-in-studies-on-plant-genetic-diversity 262/374
4
Copyright: IPGRI and Cornell University, 2003 STS 4
Microsatellites (SSRs, STMS or SSRPs)
Microsatellites are also called simple sequence repeats (SSRs) and, occasionally,sequence-tagged microsatellite sites (STMS) or simple sequence repeat polymorphisms(SSRPs). They are by far the most widely used type of STS.
SSRs are short tandem repeats, their length being 1 to 10 bp, most typically, 2-3 bp.SSRs are highly variable and evenly distributed throughout the genome. This type ofrepeated DNA is common in eukaryotes, their number of repeated units varying widely
among organisms to as high as 50 copies of the repeated unit. These polymorphismsare identified by constructing PCR primers for the DNA flanking the microsatellite region.The flanking regions tend to be conserved within the species, although sometimes theymay also be conserved in higher taxonomic levels.
Reference
Hajeer, A., J. Worthington and S. John (eds.). 2000. SNP and Microsatellite Genotyping:Markers for Genetic Analysis. Biotechniques: Molecular Laboratory Methods Series.Eaton Publishing, Manchester, UK.
! Microsatellites are short tandem repeats (1-10 bp)
! To be used as markers, their location in thegenome of interest must first be identified
! Polymorphisms in the repeat region can bedetected by performing a PCR with primersdesigned from the DNA flanking region
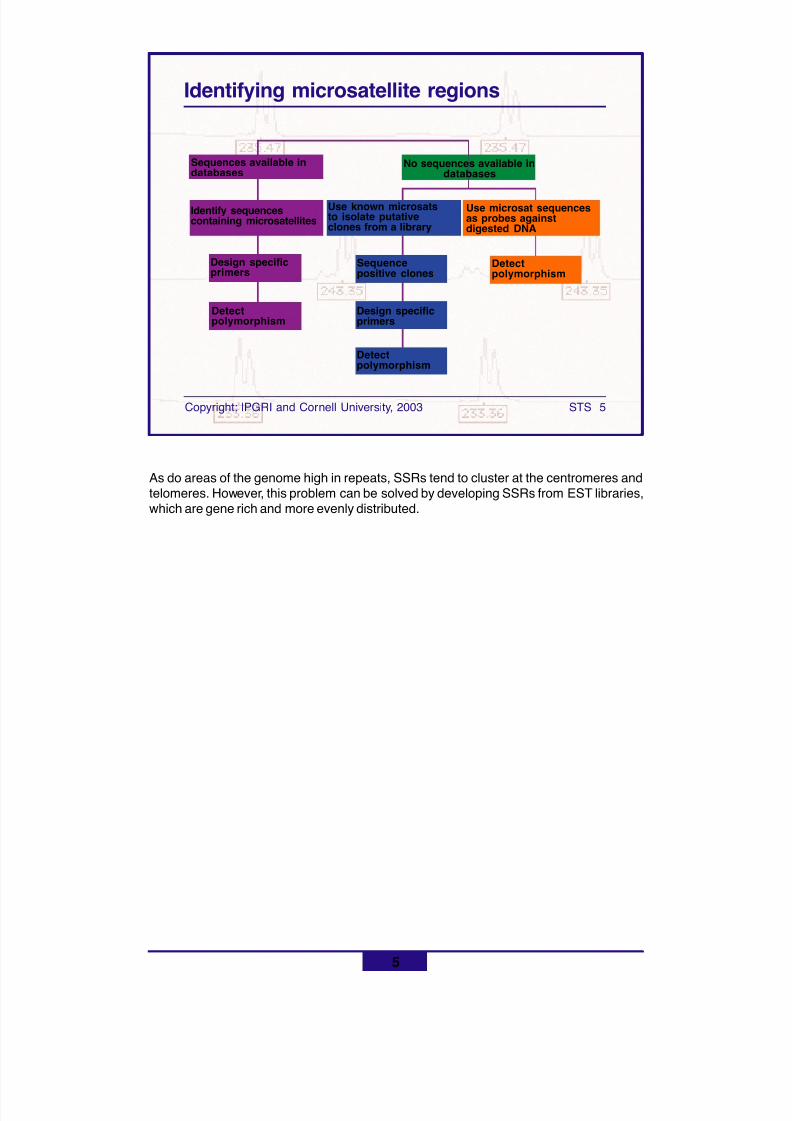
8/11/2019 Using molecular marker technology in studies on plant genetic diversity
http://slidepdf.com/reader/full/using-molecular-marker-technology-in-studies-on-plant-genetic-diversity 263/374
5
Copyright: IPGRI and Cornell University, 2003 STS 5
Identifying microsatellite regions
As do areas of the genome high in repeats, SSRs tend to cluster at the centromeres andtelomeres. However, this problem can be solved by developing SSRs from EST libraries,which are gene rich and more evenly distributed.
Sequences available indatabases
Identify sequencescontaining microsatellites
Design specificprimers
Detectpolymorphism
No sequences available indatabases
Use known microsatsto isolate putativeclones from a library
Use microsat sequencesas probes againstdigested DNA
Sequencepositive clones
Design specificprimers
Detectpolymorphism
Detectpolymorphism
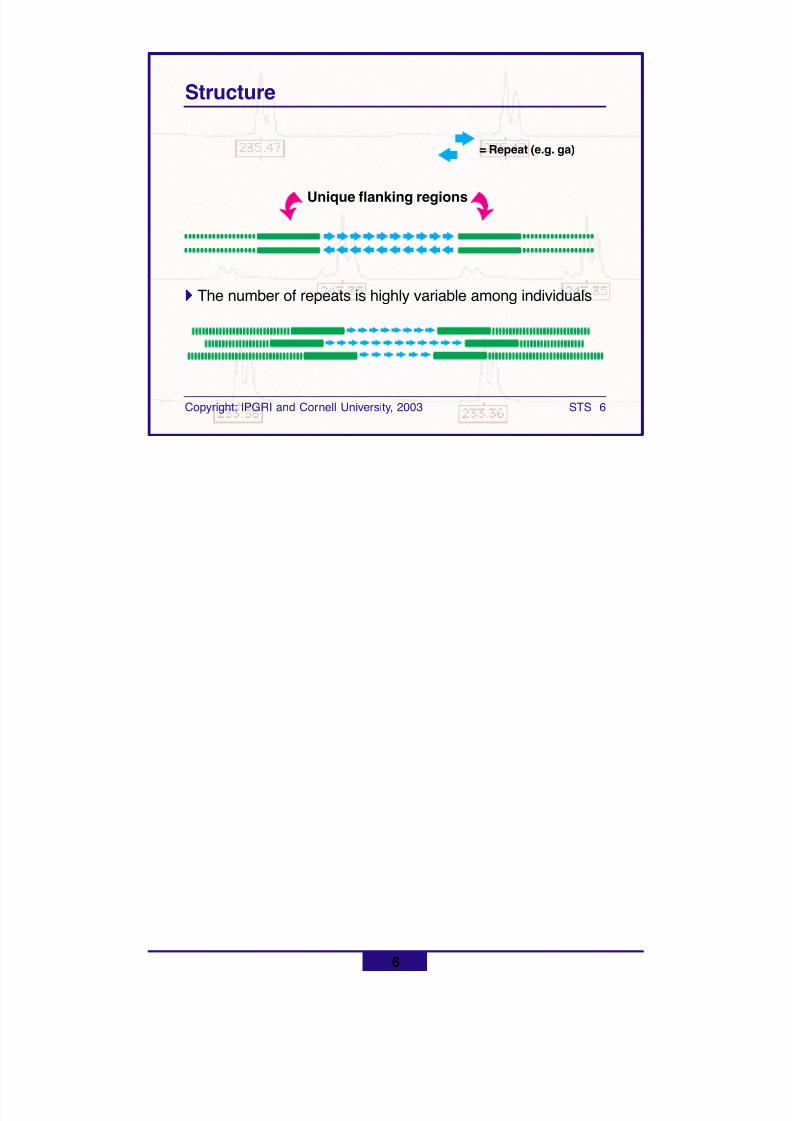
8/11/2019 Using molecular marker technology in studies on plant genetic diversity
http://slidepdf.com/reader/full/using-molecular-marker-technology-in-studies-on-plant-genetic-diversity 264/374
6
Copyright: IPGRI and Cornell University, 2003 STS 6
Structure
!!!!! The number of repeats is highly variable among individuals
Unique flanking regions
= Repeat (e.g. ga)
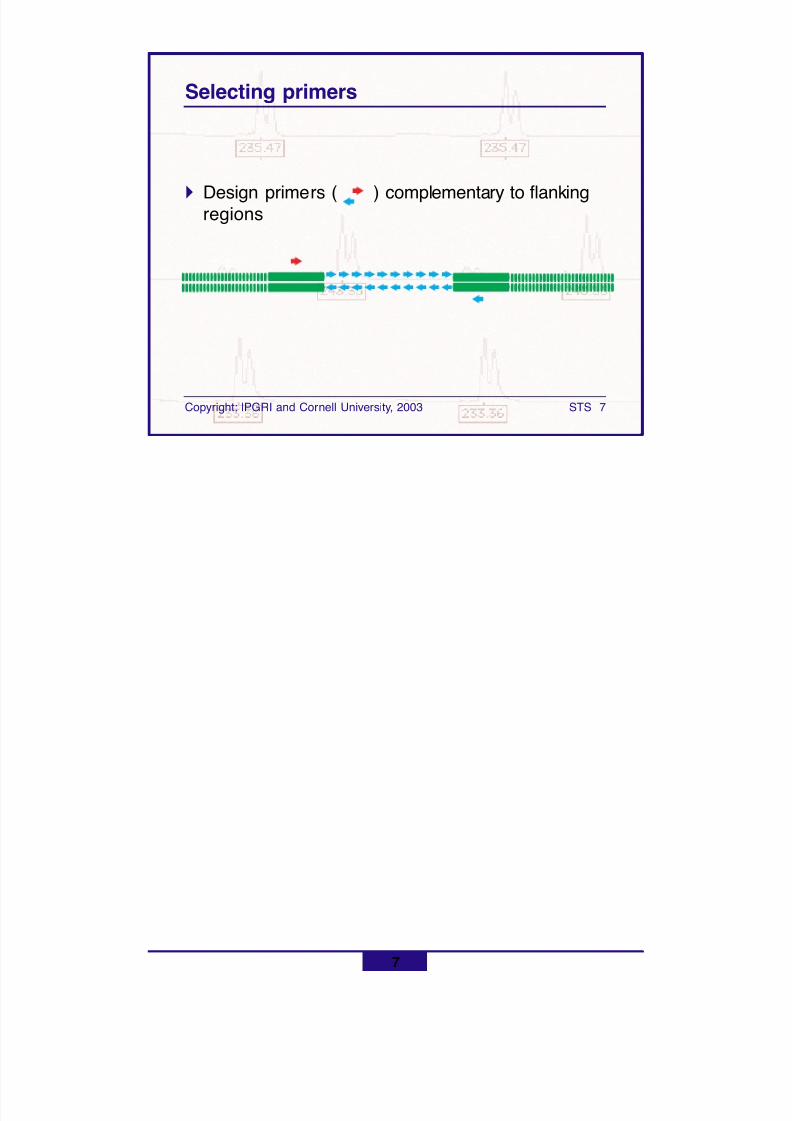
8/11/2019 Using molecular marker technology in studies on plant genetic diversity
http://slidepdf.com/reader/full/using-molecular-marker-technology-in-studies-on-plant-genetic-diversity 265/374
7
Copyright: IPGRI and Cornell University, 2003 STS 7
Selecting primers
! Design primers ( ) complementary to flankingregions
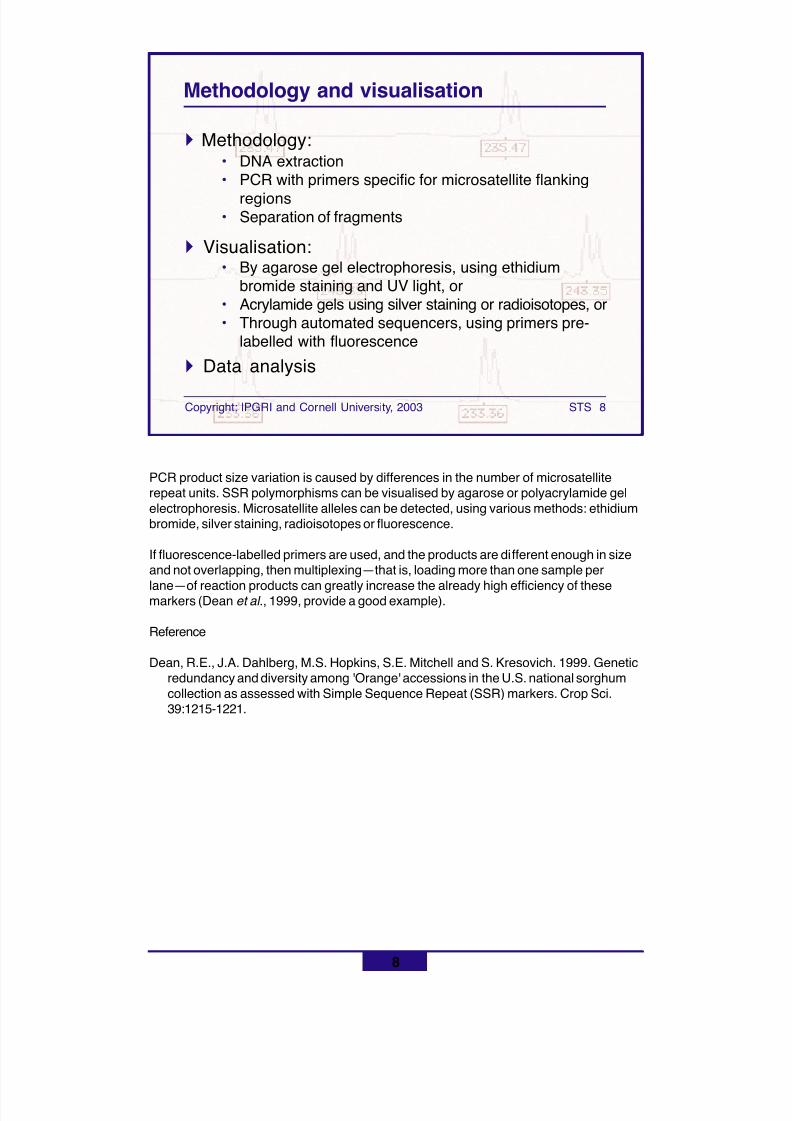
8/11/2019 Using molecular marker technology in studies on plant genetic diversity
http://slidepdf.com/reader/full/using-molecular-marker-technology-in-studies-on-plant-genetic-diversity 266/374
8
Copyright: IPGRI and Cornell University, 2003 STS 8
Methodology and visualisation
! Methodology:• DNA extraction• PCR with primers specific for microsatellite flanking
regions• Separation of fragments
! Visualisation:• By agarose gel electrophoresis, using ethidium
bromide staining and UV light, or• Acrylamide gels using silver staining or radioisotopes, or• Through automated sequencers, using primers pre-
labelled with fluorescence! Data analysis
PCR product size variation is caused by differences in the number of microsatelliterepeat units. SSR polymorphisms can be visualised by agarose or polyacrylamide gelelectrophoresis. Microsatellite alleles can be detected, using various methods: ethidiumbromide, silver staining, radioisotopes or fluorescence.
If fluorescence-labelled primers are used, and the products are different enough in sizeand not overlapping, then multiplexing—that is, loading more than one sample per
lane—of reaction products can greatly increase the already high efficiency of thesemarkers (Dean et al ., 1999, provide a good example).
Reference
Dean, R.E., J.A. Dahlberg, M.S. Hopkins, S.E. Mitchell and S. Kresovich. 1999. Geneticredundancy and diversity among 'Orange' accessions in the U.S. national sorghumcollection as assessed with Simple Sequence Repeat (SSR) markers. Crop Sci.39:1215-1221.
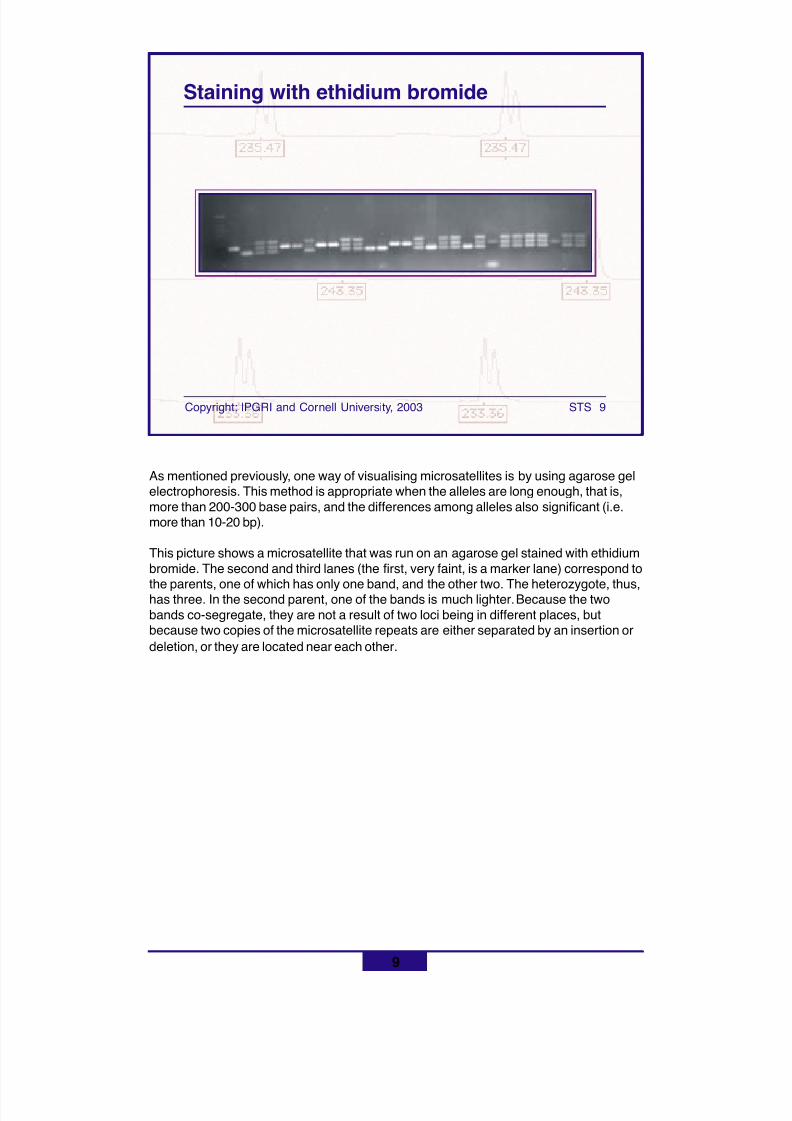
8/11/2019 Using molecular marker technology in studies on plant genetic diversity
http://slidepdf.com/reader/full/using-molecular-marker-technology-in-studies-on-plant-genetic-diversity 267/374
9
Copyright: IPGRI and Cornell University, 2003 STS 9
Staining with ethidium bromide
As mentioned previously, one way of visualising microsatellites is by using agarose gelelectrophoresis. This method is appropriate when the alleles are long enough, that is,more than 200-300 base pairs, and the differences among alleles also significant (i.e.more than 10-20 bp).
This picture shows a microsatellite that was run on an agarose gel stained with ethidiumbromide. The second and third lanes (the first, very faint, is a marker lane) correspond to
the parents, one of which has only one band, and the other two. The heterozygote, thus,has three. In the second parent, one of the bands is much lighter. Because the twobands co-segregate, they are not a result of two loci being in different places, butbecause two copies of the microsatellite repeats are either separated by an insertion ordeletion, or they are located near each other.
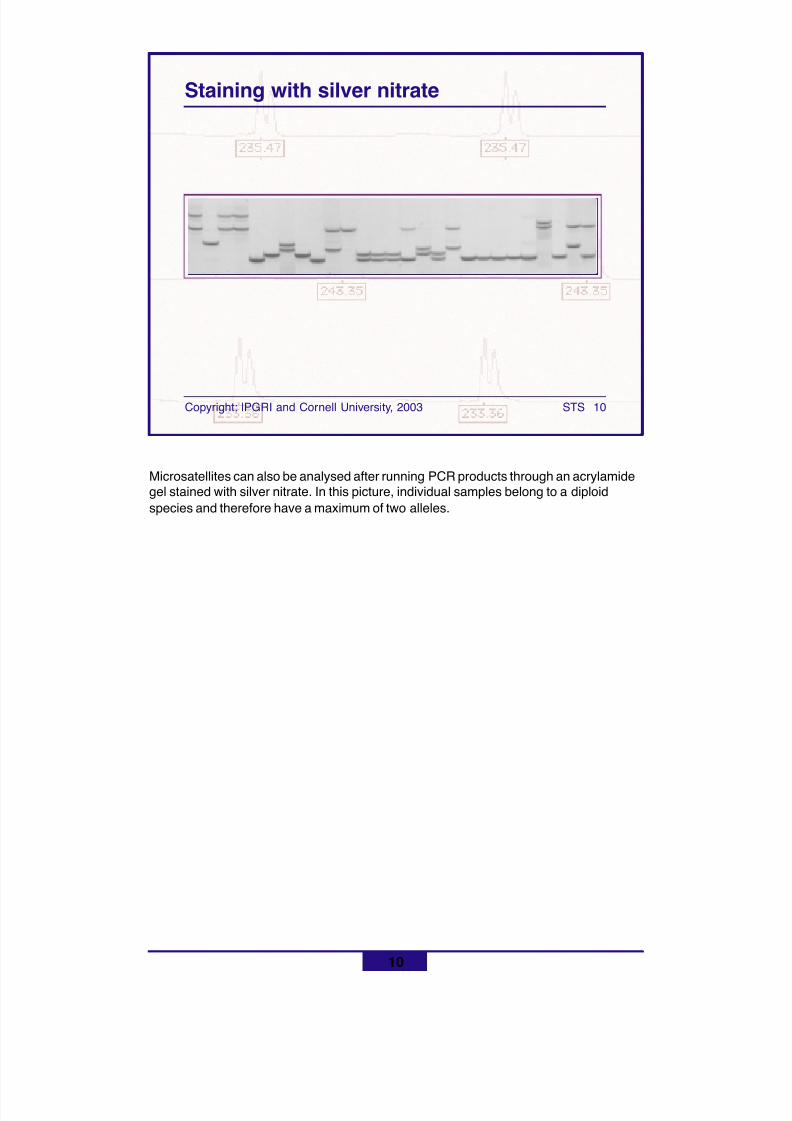
8/11/2019 Using molecular marker technology in studies on plant genetic diversity
http://slidepdf.com/reader/full/using-molecular-marker-technology-in-studies-on-plant-genetic-diversity 268/374
10
Copyright: IPGRI and Cornell University, 2003 STS 10
Staining with silver nitrate
Microsatellites can also be analysed after running PCR products through an acrylamidegel stained with silver nitrate. In this picture, individual samples belong to a diploidspecies and therefore have a maximum of two alleles.
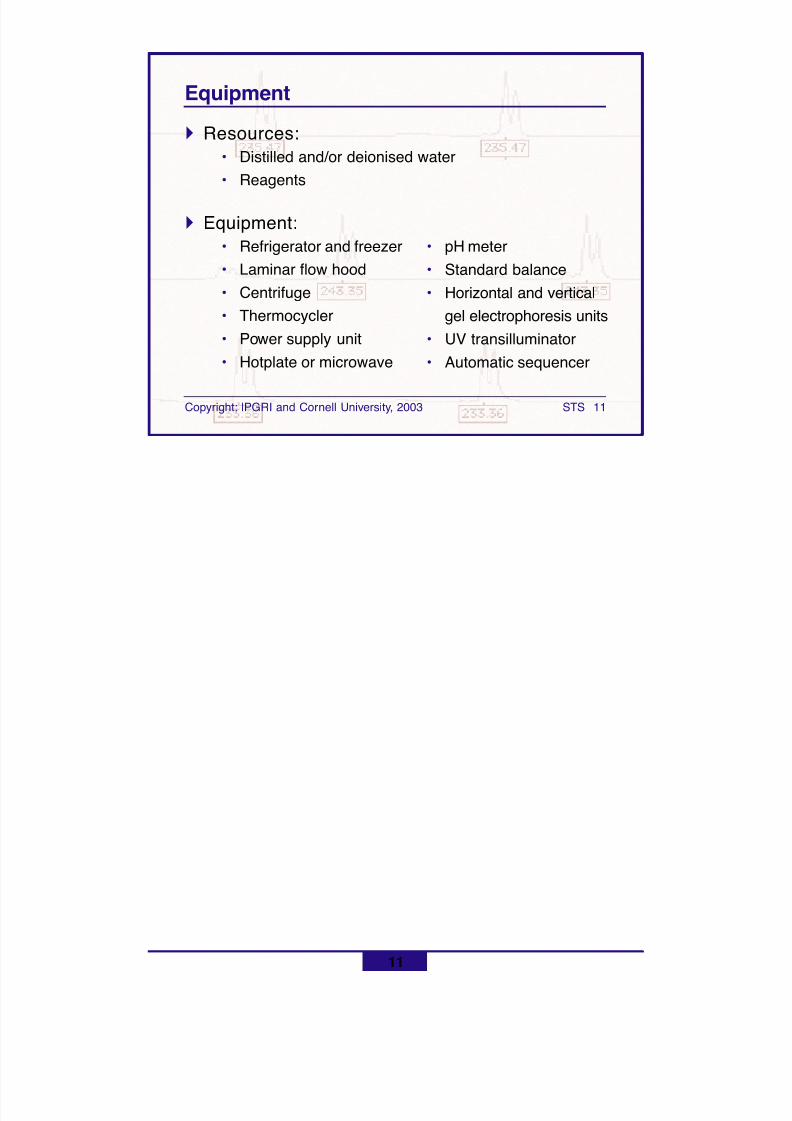
8/11/2019 Using molecular marker technology in studies on plant genetic diversity
http://slidepdf.com/reader/full/using-molecular-marker-technology-in-studies-on-plant-genetic-diversity 269/374
11
Copyright: IPGRI and Cornell University, 2003 STS 11
Equipment
! Resources:• Distilled and/or deionised water• Reagents
! Equipment:• Refrigerator and freezer• Laminar flow hood• Centrifuge• Thermocycler• Power supply unit• Hotplate or microwave
• pH meter• Standard balance• Horizontal and vertical
gel electrophoresis units• UV transilluminator• Automatic sequencer
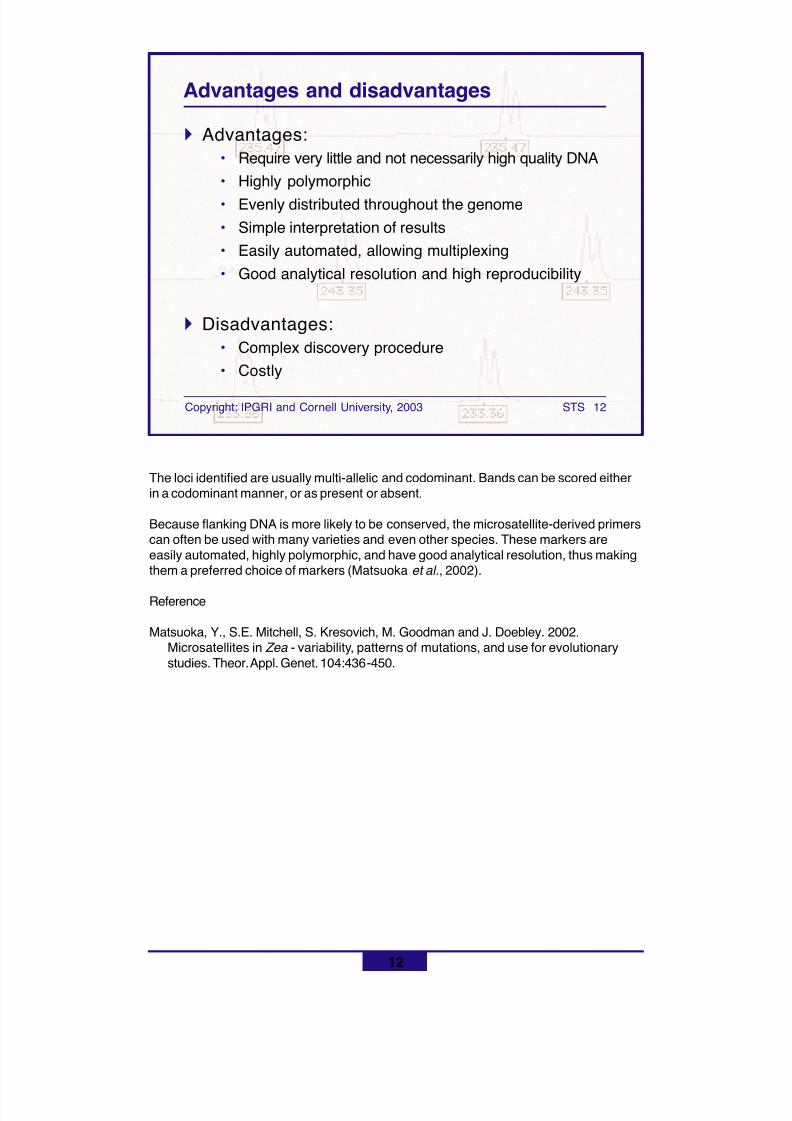
8/11/2019 Using molecular marker technology in studies on plant genetic diversity
http://slidepdf.com/reader/full/using-molecular-marker-technology-in-studies-on-plant-genetic-diversity 270/374
12
Copyright: IPGRI and Cornell University, 2003 STS 12
Advantages and disadvantages
! Advantages:• Require very little and not necessarily high quality DNA• Highly polymorphic• Evenly distributed throughout the genome• Simple interpretation of results• Easily automated, allowing multiplexing• Good analytical resolution and high reproducibility
! Disadvantages:• Complex discovery procedure• Costly
The loci identified are usually multi-allelic and codominant. Bands can be scored eitherin a codominant manner, or as present or absent.
Because flanking DNA is more likely to be conserved, the microsatellite-derived primerscan often be used with many varieties and even other species. These markers areeasily automated, highly polymorphic, and have good analytical resolution, thus makingthem a preferred choice of markers (Matsuoka et al ., 2002).
Reference
Matsuoka, Y., S.E. Mitchell, S. Kresovich, M. Goodman and J. Doebley. 2002.Microsatellites in Zea - variability, patterns of mutations, and use for evolutionarystudies. Theor. Appl. Genet. 104:436-450.
8/11/2019 Using molecular marker technology in studies on plant genetic diversity
http://slidepdf.com/reader/full/using-molecular-marker-technology-in-studies-on-plant-genetic-diversity 271/374
13
Copyright: IPGRI and Cornell University, 2003 STS 13
Applications of SSRs
References in purple colour are explained in detail in the following slides.
Cipriani, G., M.T. Marrazzo, R. Marconi, A. Cimato and R. Testolin. 2002. Microsatellitemarkers isolated in olive ( Olea europaea L.) are suitable for individual fingerprintingand reveal polymorphism within ancient cultivars. Theor. Appl. Genet. 104:223-228.
Dean, R.E., J.A. Dahlberg, M.S. Hopkins, S.E. Mitchell and S. Kresovich. 1999. Genetic
redundancy and diversity among 'Orange' accessions in the U.S. national sorghumcollection as assessed with Simple Sequence Repeat (SSR) markers. Crop Sci.39:1215-1221.
Matsuoka, Y., S.E. Mitchell, S. Kresovich, M. Goodman and J. Doebley. 2002.Microsatellites in Zea - variability, patterns of mutations, and use for evolutionarystudies. Theor. Appl. Genet. 104:436-450.
Smith, J.S.C., S. Kresovich, M.S. Hopkins, S.E. Mitchell, R.E. Dean, W.L. Woodman, M.Lee and K. Porter. 2000. Genetic diversity among elite sorghum inbred linesassessed with simple sequence repeats. Crop Sci. 40:226-232.
Westman, A.L. and S. Kresovich. 1999. Simple sequence repeats (SSR)-based markervariation in Brassica nigra genebank accessions and weed populations. Euphytica109:85-92.
! Individual genotyping
! Germplasm evaluation! Genetic diversity
! Genome mapping
! Phylogenetic studies
! Evolutionary studies
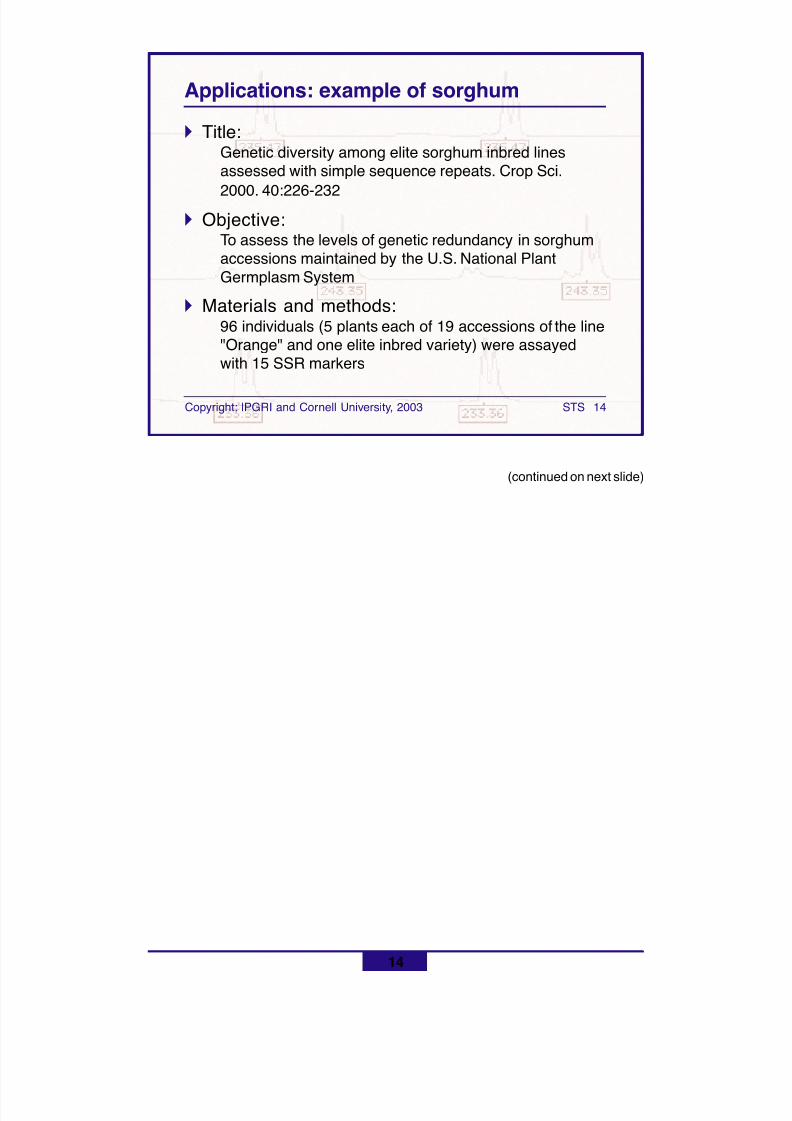
8/11/2019 Using molecular marker technology in studies on plant genetic diversity
http://slidepdf.com/reader/full/using-molecular-marker-technology-in-studies-on-plant-genetic-diversity 272/374
14
Copyright: IPGRI and Cornell University, 2003 STS 14
Applications: example of sorghum
! Title:Genetic diversity among elite sorghum inbred linesassessed with simple sequence repeats. Crop Sci.
2000. 40:226-232! Objective:
To assess the levels of genetic redundancy in sorghumaccessions maintained by the U.S. National PlantGermplasm System
! Materials and methods:96 individuals (5 plants each of 19 accessions of the line"Orange" and one elite inbred variety) were assayedwith 15 SSR markers
(continued on next slide)
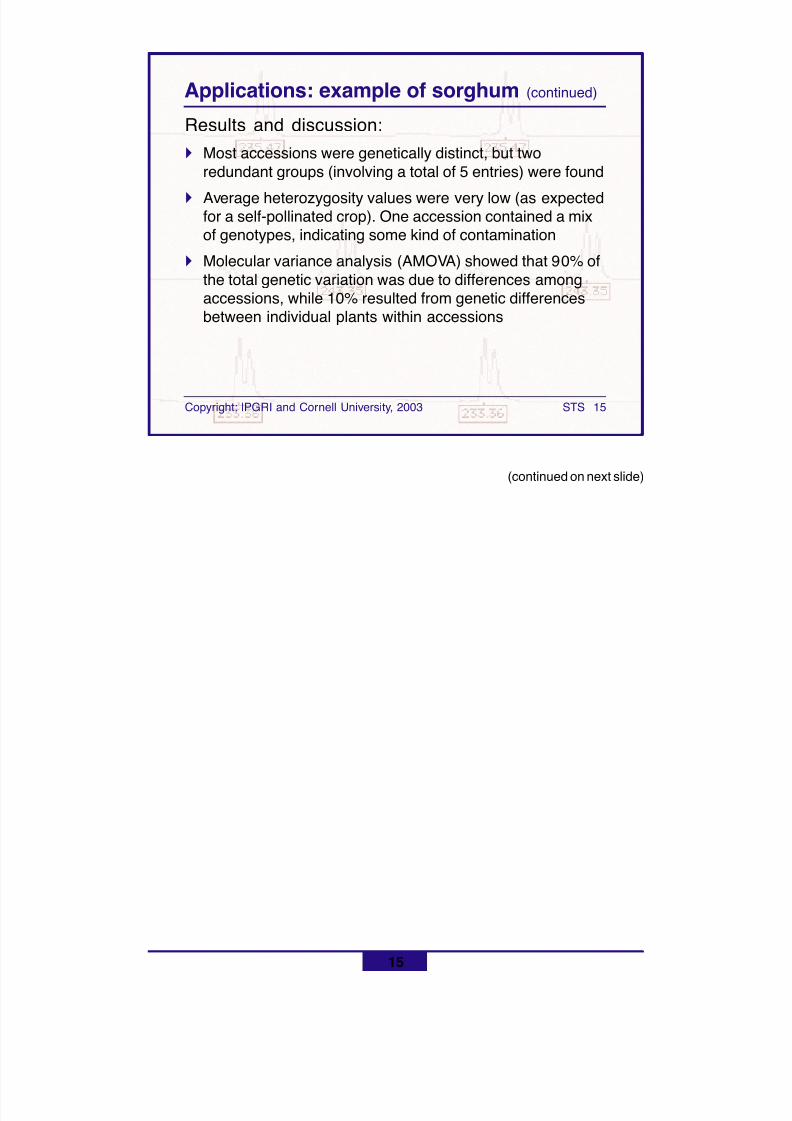
8/11/2019 Using molecular marker technology in studies on plant genetic diversity
http://slidepdf.com/reader/full/using-molecular-marker-technology-in-studies-on-plant-genetic-diversity 273/374
15
Copyright: IPGRI and Cornell University, 2003 STS 15
Applications: example of sorghum (continued)
Results and discussion:! Most accessions were genetically distinct, but two
redundant groups (involving a total of 5 entries) were found
! Average heterozygosity values were very low (as expectedfor a self-pollinated crop). One accession contained a mixof genotypes, indicating some kind of contamination
! Molecular variance analysis (AMOVA) showed that 90% ofthe total genetic variation was due to differences amongaccessions, while 10% resulted from genetic differencesbetween individual plants within accessions
(continued on next slide)
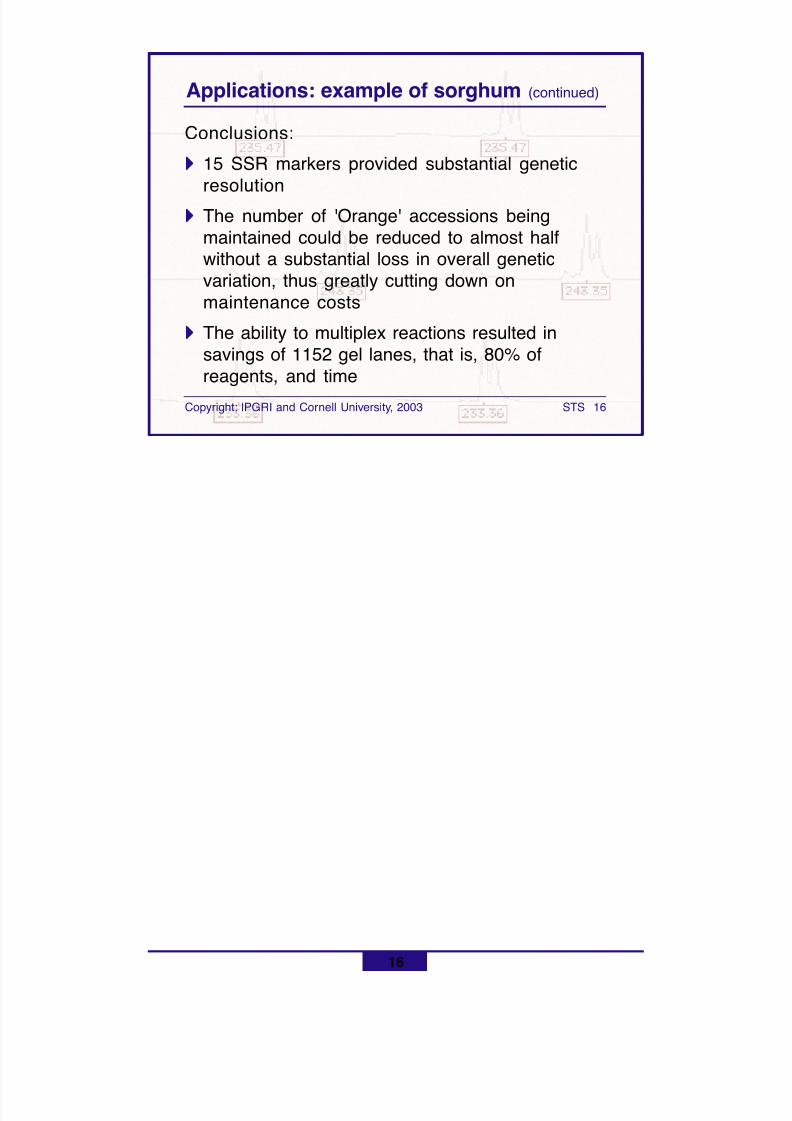
8/11/2019 Using molecular marker technology in studies on plant genetic diversity
http://slidepdf.com/reader/full/using-molecular-marker-technology-in-studies-on-plant-genetic-diversity 274/374
16
Copyright: IPGRI and Cornell University, 2003 STS 16
Applications: example of sorghum (continued)
Conclusions:
!!!!! 15 SSR markers provided substantial geneticresolution
!!!!! The number of 'Orange' accessions beingmaintained could be reduced to almost halfwithout a substantial loss in overall geneticvariation, thus greatly cutting down onmaintenance costs
!!!!! The ability to multiplex reactions resulted insavings of 1152 gel lanes, that is, 80% ofreagents, and time
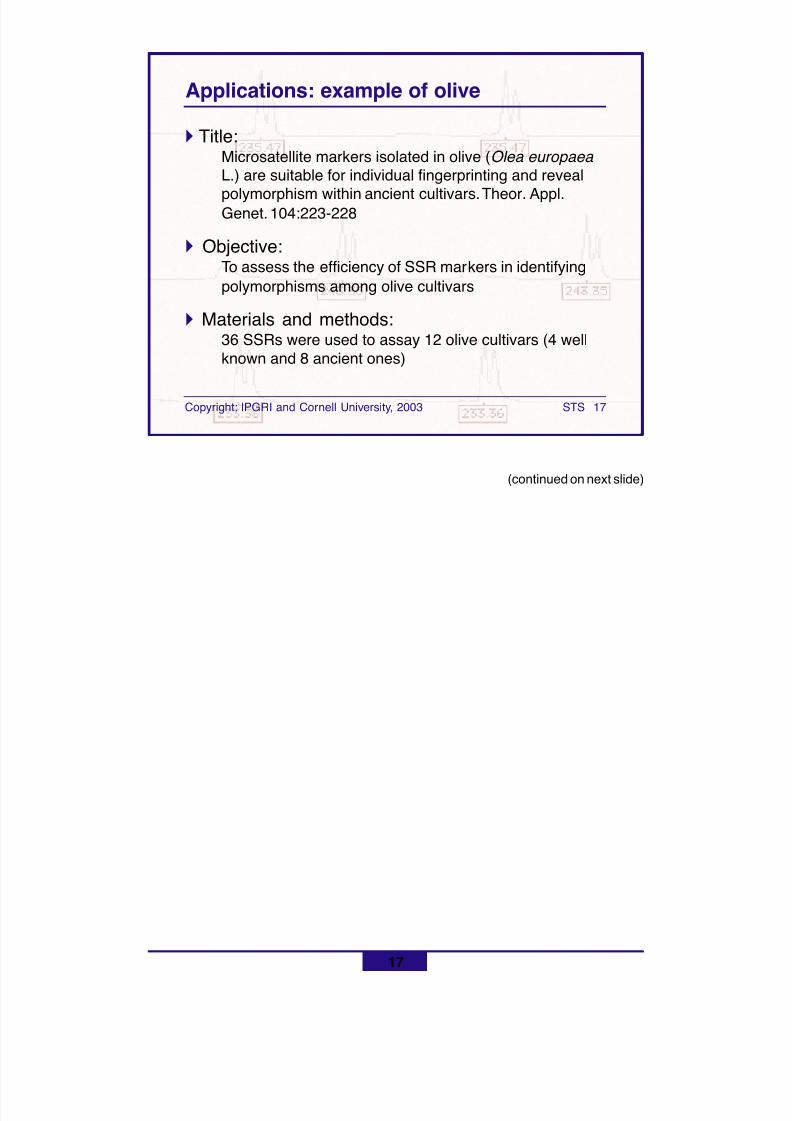
8/11/2019 Using molecular marker technology in studies on plant genetic diversity
http://slidepdf.com/reader/full/using-molecular-marker-technology-in-studies-on-plant-genetic-diversity 275/374
17
Copyright: IPGRI and Cornell University, 2003 STS 17
Applications: example of olive
! Title:Microsatellite markers isolated in olive ( Olea europaea L.) are suitable for individual fingerprinting and reveal
polymorphism within ancient cultivars. Theor. Appl.Genet. 104:223-228
! Objective:To assess the efficiency of SSR markers in identifyingpolymorphisms among olive cultivars
! Materials and methods:36 SSRs were used to assay 12 olive cultivars (4 wellknown and 8 ancient ones)
(continued on next slide)
8/11/2019 Using molecular marker technology in studies on plant genetic diversity
http://slidepdf.com/reader/full/using-molecular-marker-technology-in-studies-on-plant-genetic-diversity 276/374
18
Copyright: IPGRI and Cornell University, 2003 STS 18
Applications: example of olive (continued)
! Results and discussion:All except two of the SSR markers showed polymorphism,identifying between 1 and 5 alleles. All cultivars were easilyseparated from each other
• Five primer pairs amplified two different loci
• Six primer pairs were discarded because they yieldedunreadable patterns
• Two varieties, which had been suspected of beingidentical, were confirmed as such when they showedequal banding patterns at all loci. Another pair ofvarieties, also thought to be identical, were shownnot to be
(continued on next slide)
8/11/2019 Using molecular marker technology in studies on plant genetic diversity
http://slidepdf.com/reader/full/using-molecular-marker-technology-in-studies-on-plant-genetic-diversity 277/374
19
Copyright: IPGRI and Cornell University, 2003 STS 19
Applications: example of olive (continued)
Conclusions:
SSRs could easily differentiate between all thevarieties, and thus comprised a good tool forfingerprinting. Genetic variability within olivecultivars was also identified, using a very lownumber of markers. Previous studies that hadused AFLPs required many more markers
8/11/2019 Using molecular marker technology in studies on plant genetic diversity
http://slidepdf.com/reader/full/using-molecular-marker-technology-in-studies-on-plant-genetic-diversity 278/374
20
Copyright: IPGRI and Cornell University, 2003 STS 20
Applications: example of black mustard
! Title:Simple sequence repeats (SSR)-based markervariation in Brassica nigra genebank accessionsand weed populations. Euphytica. 1999. 109:85-92
! Objective:To determine the extent and distribution of geneticvariation in B. nigra or black mustard
! Materials and methods:Five SSR markers were used to assay 32 B. nigra accessions (including genebank accessions and weedpopulations) from four regions: Europe/North Africa,India, Ethiopia and North America
(continued on next slide)
8/11/2019 Using molecular marker technology in studies on plant genetic diversity
http://slidepdf.com/reader/full/using-molecular-marker-technology-in-studies-on-plant-genetic-diversity 279/374
8/11/2019 Using molecular marker technology in studies on plant genetic diversity
http://slidepdf.com/reader/full/using-molecular-marker-technology-in-studies-on-plant-genetic-diversity 280/374
22
Copyright: IPGRI and Cornell University, 2003 STS 22
Applications: example of black mustard
Conclusions:
Despite the belief that little genetic variationexisted within B. nigra , the SSR markersdemonstrated that the species's patterns ofvariation were consistent with its agriculturalhistory
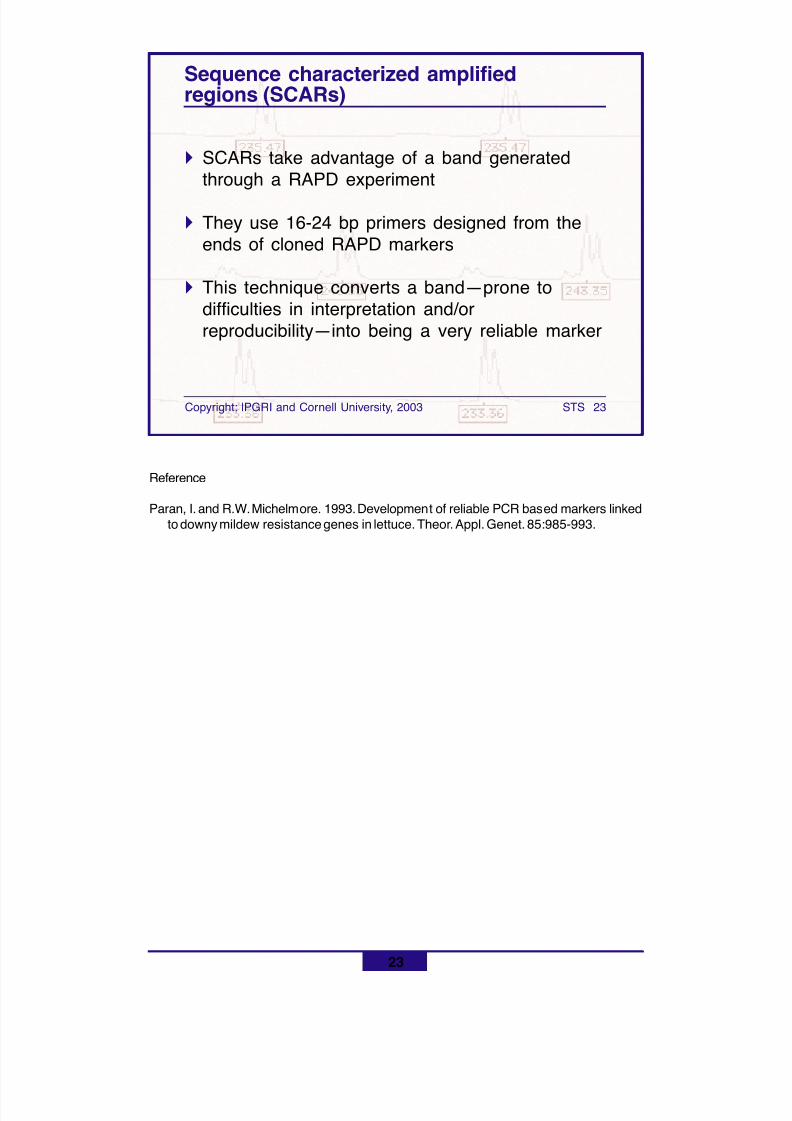
8/11/2019 Using molecular marker technology in studies on plant genetic diversity
http://slidepdf.com/reader/full/using-molecular-marker-technology-in-studies-on-plant-genetic-diversity 281/374
23
Copyright: IPGRI and Cornell University, 2003 STS 23
Sequence characterized amplifiedregions (SCARs)
! SCARs take advantage of a band generatedthrough a RAPD experiment
! They use 16-24 bp primers designed from theends of cloned RAPD markers
! This technique converts a band—prone todifficulties in interpretation and/orreproducibility—into being a very reliable marker
Reference
Paran, I. and R.W. Michelmore. 1993. Development of reliable PCR based markers linkedto downy mildew resistance genes in lettuce. Theor. Appl. Genet. 85:985-993.
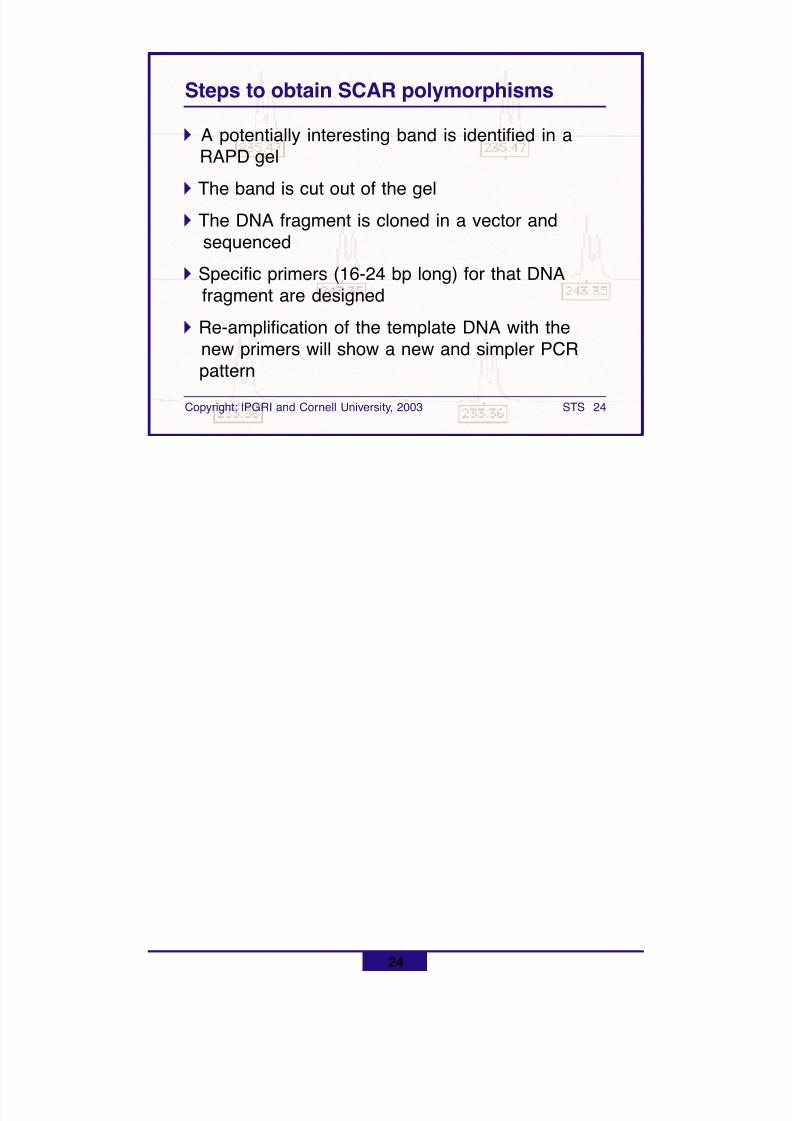
8/11/2019 Using molecular marker technology in studies on plant genetic diversity
http://slidepdf.com/reader/full/using-molecular-marker-technology-in-studies-on-plant-genetic-diversity 282/374
24
Copyright: IPGRI and Cornell University, 2003 STS 24
Steps to obtain SCAR polymorphisms
! A potentially interesting band is identified in a RAPD gel
! The band is cut out of the gel
! The DNA fragment is cloned in a vector and sequenced
! Specific primers (16-24 bp long) for that DNA fragment are designed
! Re-amplification of the template DNA with the new primers will show a new and simpler PCR pattern
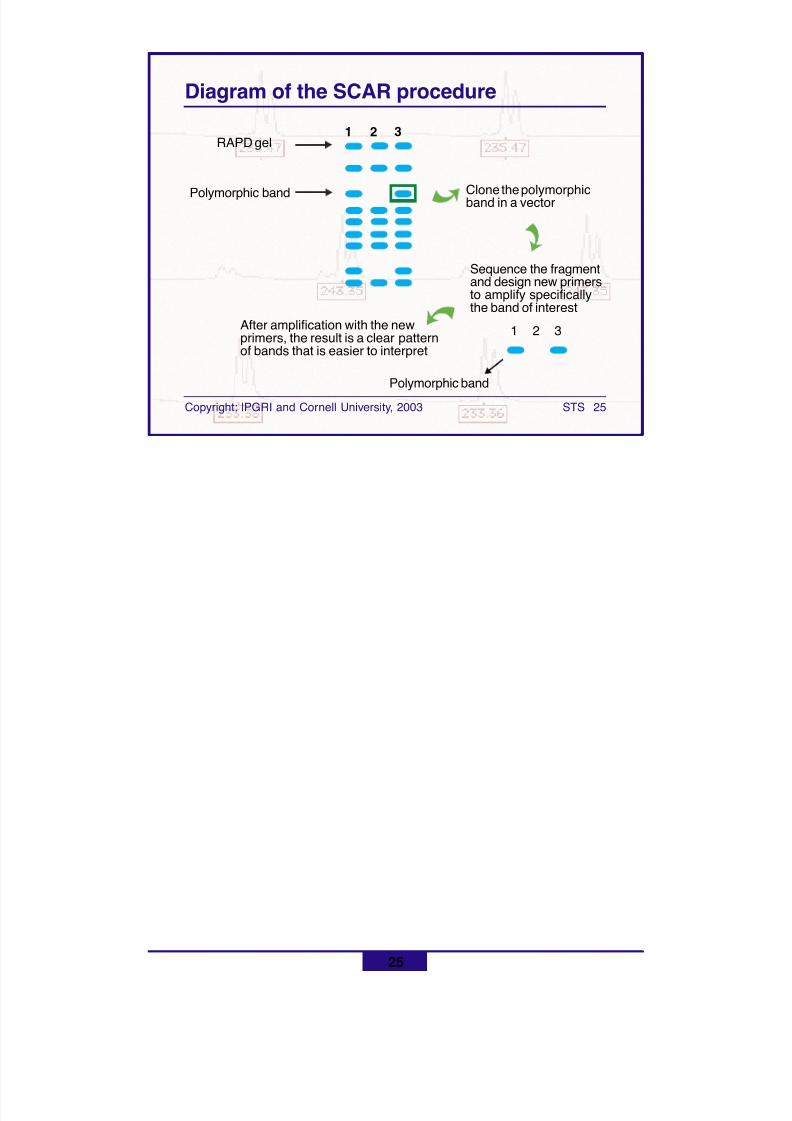
8/11/2019 Using molecular marker technology in studies on plant genetic diversity
http://slidepdf.com/reader/full/using-molecular-marker-technology-in-studies-on-plant-genetic-diversity 283/374
25
Copyright: IPGRI and Cornell University, 2003 STS 25
Diagram of the SCAR procedure
1 2 3
Polymorphic band
RAPD gel
Polymorphic band Clone the polymorphicband in a vector
Sequence the fragmentand design new primersto amplify specificallythe band of interest
1 2 3After amplification with the newprimers, the result is a clear patternof bands that is easier to interpret
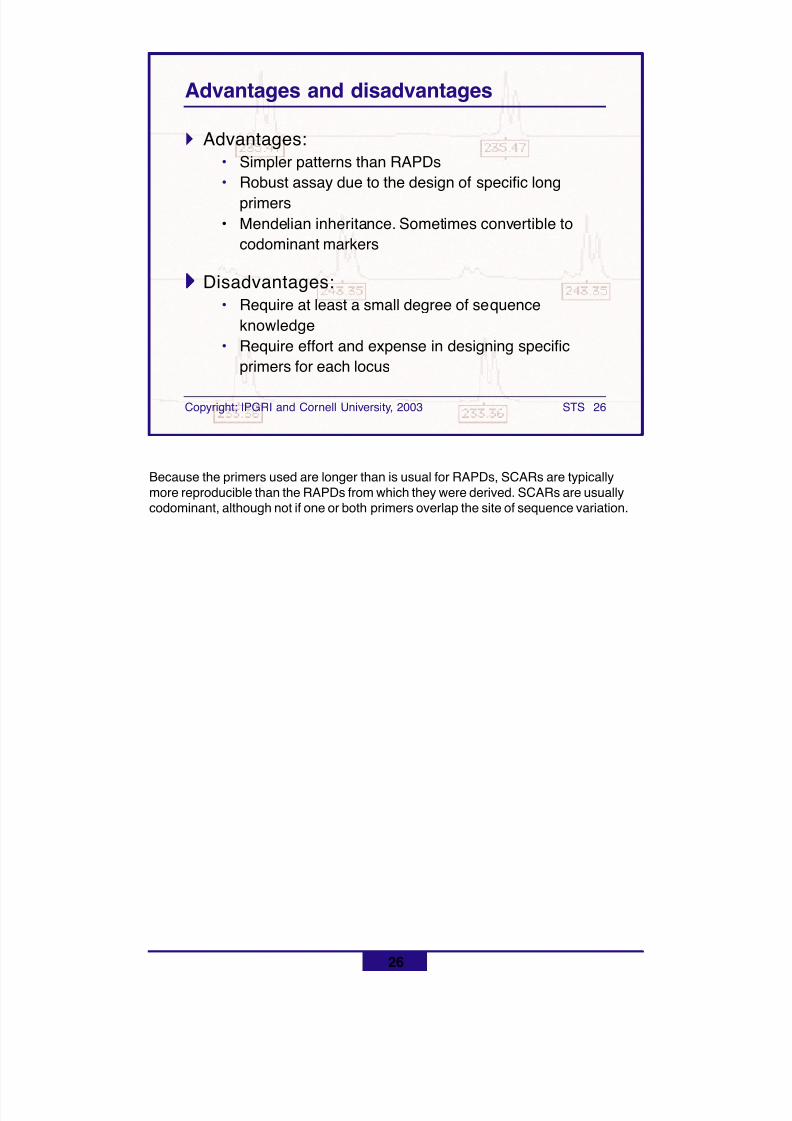
8/11/2019 Using molecular marker technology in studies on plant genetic diversity
http://slidepdf.com/reader/full/using-molecular-marker-technology-in-studies-on-plant-genetic-diversity 284/374
26
Copyright: IPGRI and Cornell University, 2003 STS 26
Advantages and disadvantages
! Advantages:• Simpler patterns than RAPDs• Robust assay due to the design of specific long
primers• Mendelian inheritance. Sometimes convertible to
codominant markers
!!!!! Disadvantages:• Require at least a small degree of sequence
knowledge• Require effort and expense in designing specific
primers for each locus
Because the primers used are longer than is usual for RAPDs, SCARs are typicallymore reproducible than the RAPDs from which they were derived. SCARs are usuallycodominant, although not if one or both primers overlap the site of sequence variation.
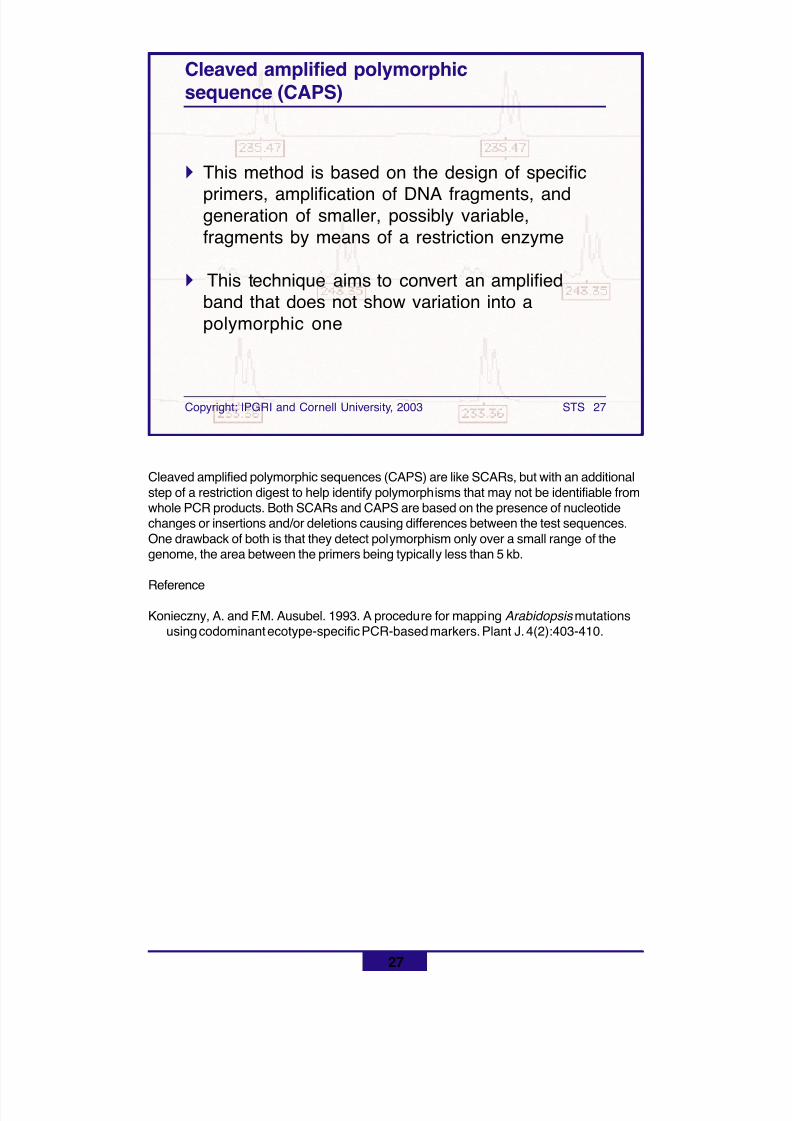
8/11/2019 Using molecular marker technology in studies on plant genetic diversity
http://slidepdf.com/reader/full/using-molecular-marker-technology-in-studies-on-plant-genetic-diversity 285/374
27
Copyright: IPGRI and Cornell University, 2003 STS 27
Cleaved amplified polymorphicsequence (CAPS)
! This method is based on the design of specific
primers, amplification of DNA fragments, andgeneration of smaller, possibly variable,fragments by means of a restriction enzyme
! This technique aims to convert an amplifiedband that does not show variation into apolymorphic one
Cleaved amplified polymorphic sequences (CAPS) are like SCARs, but with an additionalstep of a restriction digest to help identify polymorphisms that may not be identifiable fromwhole PCR products. Both SCARs and CAPS are based on the presence of nucleotidechanges or insertions and/or deletions causing differences between the test sequences.One drawback of both is that they detect polymorphism only over a small range of thegenome, the area between the primers being typically less than 5 kb.
Reference
Konieczny, A. and F.M. Ausubel. 1993. A procedure for mapping Arabidopsis mutationsusing codominant ecotype-specific PCR-based markers. Plant J. 4(2):403-410.
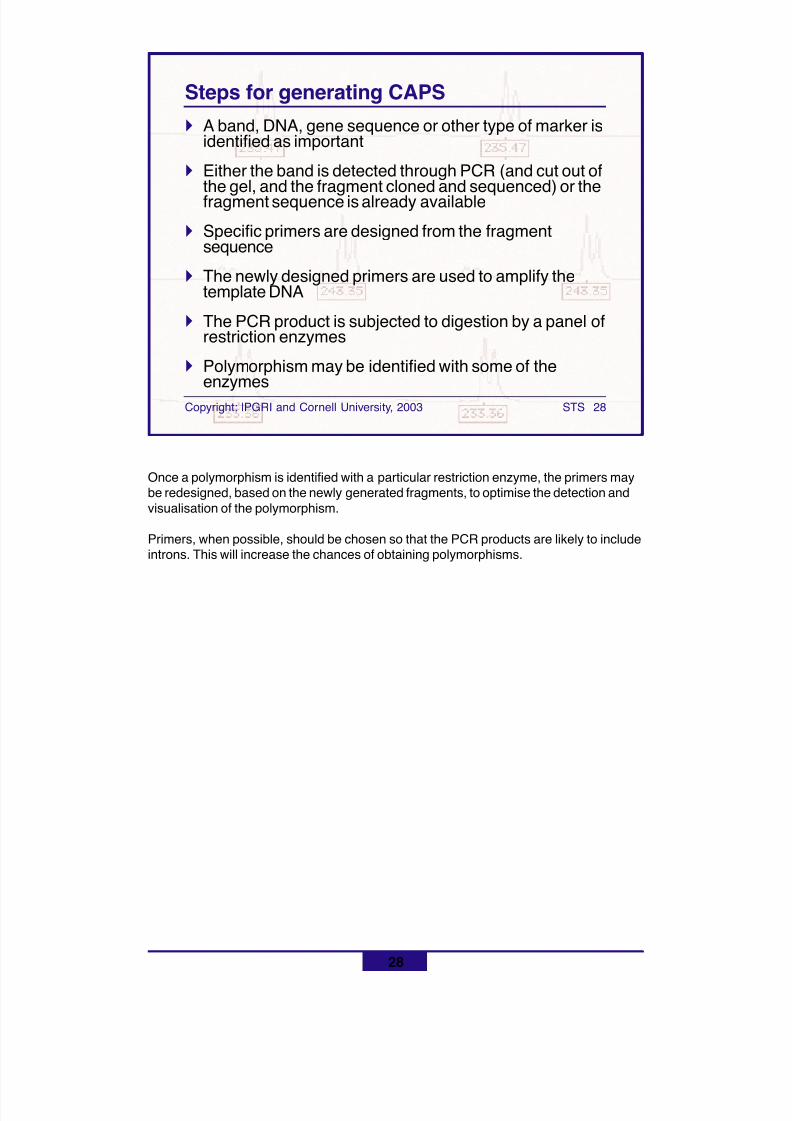
8/11/2019 Using molecular marker technology in studies on plant genetic diversity
http://slidepdf.com/reader/full/using-molecular-marker-technology-in-studies-on-plant-genetic-diversity 286/374
28
Copyright: IPGRI and Cornell University, 2003 STS 28
Steps for generating CAPS! A band, DNA, gene sequence or other type of marker is
identified as important
! Either the band is detected through PCR (and cut out ofthe gel, and the fragment cloned and sequenced) or thefragment sequence is already available
! Specific primers are designed from the fragmentsequence
! The newly designed primers are used to amplify thetemplate DNA
! The PCR product is subjected to digestion by a panel ofrestriction enzymes
! Polymorphism may be identified with some of theenzymes
Once a polymorphism is identified with a particular restriction enzyme, the primers maybe redesigned, based on the newly generated fragments, to optimise the detection andvisualisation of the polymorphism.
Primers, when possible, should be chosen so that the PCR products are likely to includeintrons. This will increase the chances of obtaining polymorphisms.
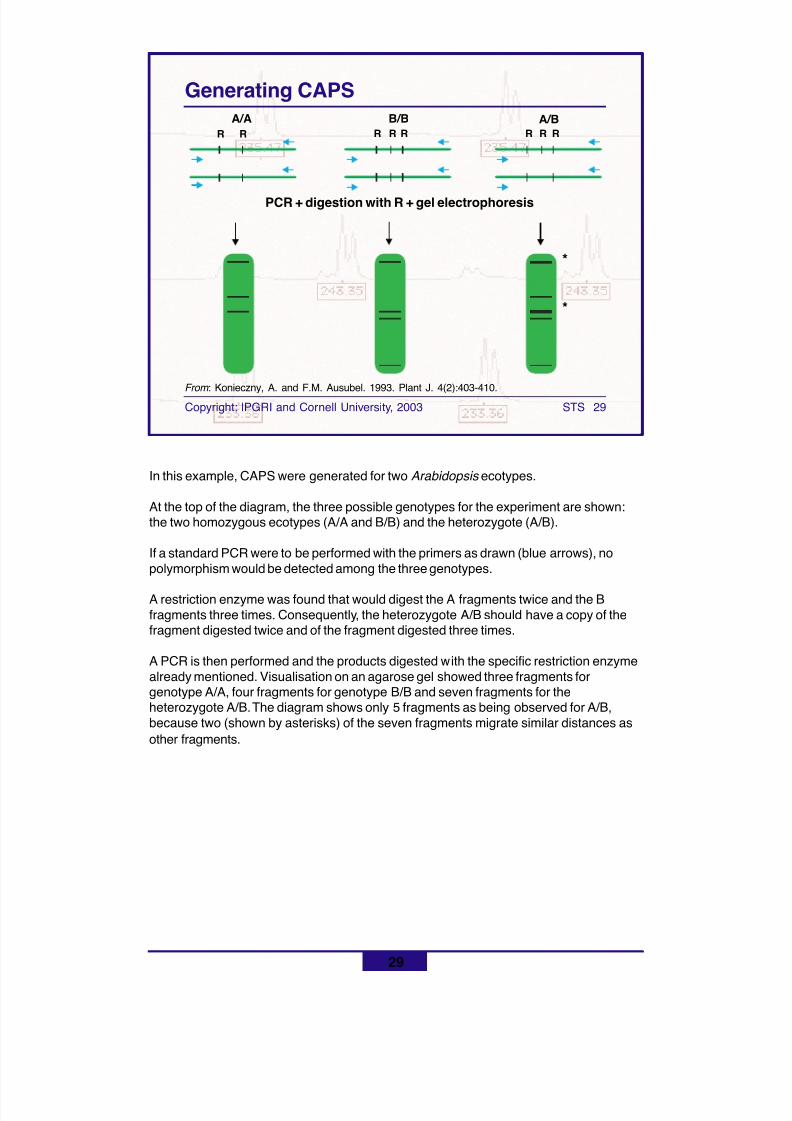
8/11/2019 Using molecular marker technology in studies on plant genetic diversity
http://slidepdf.com/reader/full/using-molecular-marker-technology-in-studies-on-plant-genetic-diversity 287/374
29
Copyright: IPGRI and Cornell University, 2003 STS 29
Generating CAPSA/A B/B A/B
R R R R R R R R
PCR + digestion with R + gel electrophoresis
*
*
From : Konieczny, A. and F.M. Ausubel. 1993. Plant J. 4(2):403-410.
In this example, CAPS were generated for two Arabidopsis ecotypes.
At the top of the diagram, the three possible genotypes for the experiment are shown:the two homozygous ecotypes (A/A and B/B) and the heterozygote (A/B).
If a standard PCR were to be performed with the primers as drawn (blue arrows), nopolymorphism would be detected among the three genotypes.
A restriction enzyme was found that would digest the A fragments twice and the Bfragments three times. Consequently, the heterozygote A/B should have a copy of thefragment digested twice and of the fragment digested three times.
A PCR is then performed and the products digested with the specific restriction enzymealready mentioned. Visualisation on an agarose gel showed three fragments forgenotype A/A, four fragments for genotype B/B and seven fragments for theheterozygote A/B. The diagram shows only 5 fragments as being observed for A/B,because two (shown by asterisks) of the seven fragments migrate similar distances asother fragments.
8/11/2019 Using molecular marker technology in studies on plant genetic diversity
http://slidepdf.com/reader/full/using-molecular-marker-technology-in-studies-on-plant-genetic-diversity 288/374
30
Copyright: IPGRI and Cornell University, 2003 STS 30
Advantages and disadvantages
! Advantages:• Robust assay because specific long primers are designed
• Codominant markers• Benefit from markers that may have already been mapped• Identify polymorphisms in markers that were
previously not informative
! Disadvantages:• Require at least a small amount of sequence
knowledge• Effort and expense required to design specific primers
for each locus
8/11/2019 Using molecular marker technology in studies on plant genetic diversity
http://slidepdf.com/reader/full/using-molecular-marker-technology-in-studies-on-plant-genetic-diversity 289/374
31
Copyright: IPGRI and Cornell University, 2003 STS 31
Inter-simple sequence repeats (ISSRs)
! They are regions found between microsatellite
repeats! The technique is based on PCR amplification of
intermicrosatellite sequences
! Because of the known abundance of repeatsequences spread all over the genome, ittargets multiple loci
Reference
Zietkiewicz, E., A. Rafalski and D. Labuda. 1994. Genome fingerprinting by simplesequence repeat (SSR)-anchored polymerase chain reaction amplification. Genomics20:176-183.
8/11/2019 Using molecular marker technology in studies on plant genetic diversity
http://slidepdf.com/reader/full/using-molecular-marker-technology-in-studies-on-plant-genetic-diversity 290/374
32
Copyright: IPGRI and Cornell University, 2003 STS 32
Identifying ISSR polymorphisms
A typical PCR is performed in which primers havebeen designed, based on a microsatellite repeatsequence, and extended one to several bases into
the flanking sequence as anchor points. Differentalternatives are possible:
! Only one primer is used
! Two primers of similar characteristics are used
! Combinations of a microsatellite-sequenceanchored primer with a random primer (i.e. thoseused for RAPD)
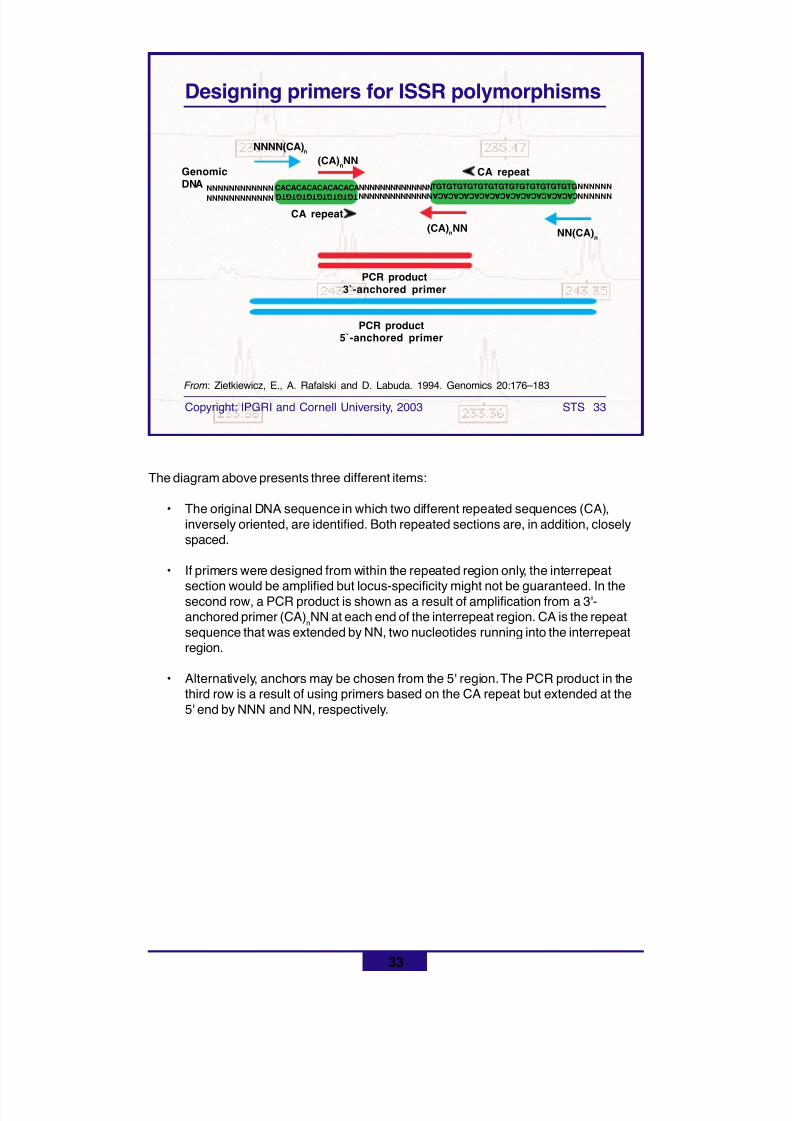
8/11/2019 Using molecular marker technology in studies on plant genetic diversity
http://slidepdf.com/reader/full/using-molecular-marker-technology-in-studies-on-plant-genetic-diversity 291/374
33
Copyright: IPGRI and Cornell University, 2003 STS 33
Designing primers for ISSR polymorphisms
The diagram above presents three different items:
• The original DNA sequence in which two different repeated sequences (CA),inversely oriented, are identified. Both repeated sections are, in addition, closelyspaced.
• If primers were designed from within the repeated region only, the interrepeat
section would be amplified but locus-specificity might not be guaranteed. In thesecond row, a PCR product is shown as a result of amplification from a 3'-anchored primer (CA) nNN at each end of the interrepeat region. CA is the repeatsequence that was extended by NN, two nucleotides running into the interrepeatregion.
• Alternatively, anchors may be chosen from the 5' region. The PCR product in thethird row is a result of using primers based on the CA repeat but extended at the5' end by NNN and NN, respectively.
From : Zietkiewicz, E., A. Rafalski and D. Labuda. 1994. Genomics 20:176–183
NNNN(CA) n
(CA) nNNCA repeat
(CA) nNNCA repeat
NN(CA) n
GenomicDNA
PCR product3`-anchored primer
PCR product5`-anchored primer
NNNNNNNNNNNN CACACACACACACACANNNNNNNNNNNN T G T G T G T G T G T G T G T G
NNNNNNNNNNNNNNNNNNNNNNNNNNNN
TGTGTGTGTGTGTGTGTGTGTGTGTGTG C A C A C A C A C A C A C A C A C A C A C A C A C A C A
NNNNNN
NNNNNN
8/11/2019 Using molecular marker technology in studies on plant genetic diversity
http://slidepdf.com/reader/full/using-molecular-marker-technology-in-studies-on-plant-genetic-diversity 292/374
34
Copyright: IPGRI and Cornell University, 2003 STS 34
Advantages and disadavantages! Advantages:
• Do not require prior sequence information• Variation within unique regions of the genome may
be found at several loci simultaneously• Tend to identify significant levels of variation• Microsatellite sequence-specific• Very useful for DNA profiling, especially for closely
related species
! Disadvantages:• Dominant markers• Polyacrylamide gel electrophoresis and detection
with silver staining or radioisotopes may be needed
8/11/2019 Using molecular marker technology in studies on plant genetic diversity
http://slidepdf.com/reader/full/using-molecular-marker-technology-in-studies-on-plant-genetic-diversity 293/374
35
Copyright: IPGRI and Cornell University, 2003 STS 35
In summary
! The use of STS as markers relies on somesequence knowledge. They are codominant andhighly reproducible
! SSRs are the type of STS most widely used.Others are SCARs, CAPS and ISSRs
! SSRs are short tandem repeats, highly variableand evenly distributed in the genome. Thesefeatures make SSRs a good marker of choice forgenetic diversity analyses
! Polymorphisms in SSRs are caused bydifferences in the number of repeat units
8/11/2019 Using molecular marker technology in studies on plant genetic diversity
http://slidepdf.com/reader/full/using-molecular-marker-technology-in-studies-on-plant-genetic-diversity 294/374
36
Copyright: IPGRI and Cornell University, 2003 STS 36
By now you should know
! The features of STS as markers
! The different types of STS markers and theircontrasting traits
! The steps involved in identifying microsatellites,designing primers and detecting polymorphisms
! The properties of microsatellites for geneticdiversity analyses
8/11/2019 Using molecular marker technology in studies on plant genetic diversity
http://slidepdf.com/reader/full/using-molecular-marker-technology-in-studies-on-plant-genetic-diversity 295/374
Basic references
Ajay, J., C. Apparanda and P.L. Bhalla. 1999. Evaluation of genetic diversity and genomefingerprinting of Pandorea (Bignoniaceae) by RAPD and inter-SSR PCR. Genome42:714-719.
Blair, M.W., O. Panaud and S.R. McCouch. 1999. Inter-simple sequence repeat (ISSR)
amplification for analysis of microsatellite motif frequency and fingerprinting in rice(Oryza sativa L.). Theor. Appl. Genet. 98:780-792.
Brown, S.M. and S. Kresovich. 1996. Molecular characterization for plant geneticresources conservation. Pp. 85-93 in Genome Mapping in Plants (H. Paterson, ed.).RG Landes Company, Georgetown, TX.
Buso, G.S.C., P.H.N. Rangel and M.E. Ferreira. 2001. Analysis of random and specificsequences of nuclear and cytoplasmatic DNA in diploid and tetraploid American wildrice species ( Oryza sp.). Genome 44:476-494.
Hajeer, A., J. Worthington and S. John (eds.). 2000. SNP and Microsatellite Genotyping:Markers for Genetic Analysis. Biotechniques Molecular Laboratory Methods Series.
Eaton Publishing, Manchester, UK.
Joshi, S.P., V.S. Gupta, R.K. Aggarwal, P.K. Ranjekar and D.S. Brar. 2000. Geneticdiversity and phylogenetic relationship as revealed by inter simple sequence repeat(ISSR) polymorphism in the genus Oryza . Theor. Appl. Genet. 100:1311-1320.
Kantety, R.V., X.P. Zeng, J.L. Bennetzen and B.E. Zehr. 1995. Assessment of geneticdiversity in dent and popcorn ( Zea mays L.) inbred lines using inter-simple sequencerepeat (ISSR) amplification. Mol. Breed. 1:365-373.
Konieczny, A. and F.M. Ausubel. 1993. A procedure for mapping Arabidopsis mutationsusing co-dominant ecotype-specific PCR-based markers. Plant J. 4(2):403-410.
Lowe, A.J., J.R. Russell, W. Powell and I.K. Dawson. 1998. Identification andcharacterization of nuclear, cleaved amplified polymorphic sequence (CAPS) loci inIrvingia gabonensis and I. wombolu , indigenous fruit trees of west and central Africa.Mol. Ecol. 7(12):1786-1788.
Morgante, M. and A.M. Olivieri. 1993. PCR-amplified microsatellites as markers in plantgenetics. Plant J. 3(1):175-182.
Paran, I. and R.W. Michelmore. 1993. Development of reliable PCR based markers linkedto downy mildew resistance genes in lettuce. Theor. Appl. Genet. 85:985-993.
Zietkiewicz, E., A. Rafalski and D. Labuda. 1994. Genome fingerprinting by simplesequence repeat (SSR)-anchored polymerase chain reaction amplification. Genomics20:176-183.
37
8/11/2019 Using molecular marker technology in studies on plant genetic diversity
http://slidepdf.com/reader/full/using-molecular-marker-technology-in-studies-on-plant-genetic-diversity 296/374
38
Copyright: IPGRI and Cornell University, 2003 STS 38
Next
DNA-based technologiesPCR-based technologies
Latest strategies
! Complementary technologies
! Final considerations
! Glossary
8/11/2019 Using molecular marker technology in studies on plant genetic diversity
http://slidepdf.com/reader/full/using-molecular-marker-technology-in-studies-on-plant-genetic-diversity 297/374
Using molecular marker technology instudies on plant genetic diversity
PCR-based technologiesLatest strategies
(DNA sequencing, ESTs, microarrays, DArT, SNPs)
Copyright: IPGRI and Cornell University, 2002 Latest strategies 1
DNA-based technologies
8/11/2019 Using molecular marker technology in studies on plant genetic diversity
http://slidepdf.com/reader/full/using-molecular-marker-technology-in-studies-on-plant-genetic-diversity 298/374
2
Copyright: IPGRI and Cornell University, 2003 Latest strategies 2
Contents
! DNA sequencing
! Expressed sequence tags (ESTs)! Microarray technology
! Diversity array technology (DArT)
! Single nucleotide polymorphisms (SNPs)
8/11/2019 Using molecular marker technology in studies on plant genetic diversity
http://slidepdf.com/reader/full/using-molecular-marker-technology-in-studies-on-plant-genetic-diversity 299/374
3
Copyright: IPGRI and Cornell University, 2003 Latest strategies 3
! DNA sequencing is the most fundamentalmeasure of diversity because it detectspolymorphisms within the DNA's building blocksthemselves
! Data collection can be automated
DNA sequencing
DNA sequencing provides the most fundamental measure of diversity, because allmarkers are derived from polymorphisms in the DNA's building blocks, that is, thenucleotide sequence of a particular DNA segment. Sequencing technology has vastlyimproved in recent years, and now PCR products (a DNA region amplified in sufficientquantity) can be sequenced directly and targeted to any genomic location of interest.Data collection can be automated.
8/11/2019 Using molecular marker technology in studies on plant genetic diversity
http://slidepdf.com/reader/full/using-molecular-marker-technology-in-studies-on-plant-genetic-diversity 300/374
4
Copyright: IPGRI and Cornell University, 2003 Latest strategies 4
DNA sequencing: methods
Two main methods exist:! Maxam-Gilbert
! Sanger (dideoxy sequencing or chaintermination)
The two methods differ slightly, with the Sanger method (described in slide 6) beingeasier to automate and, thus, more widely used.
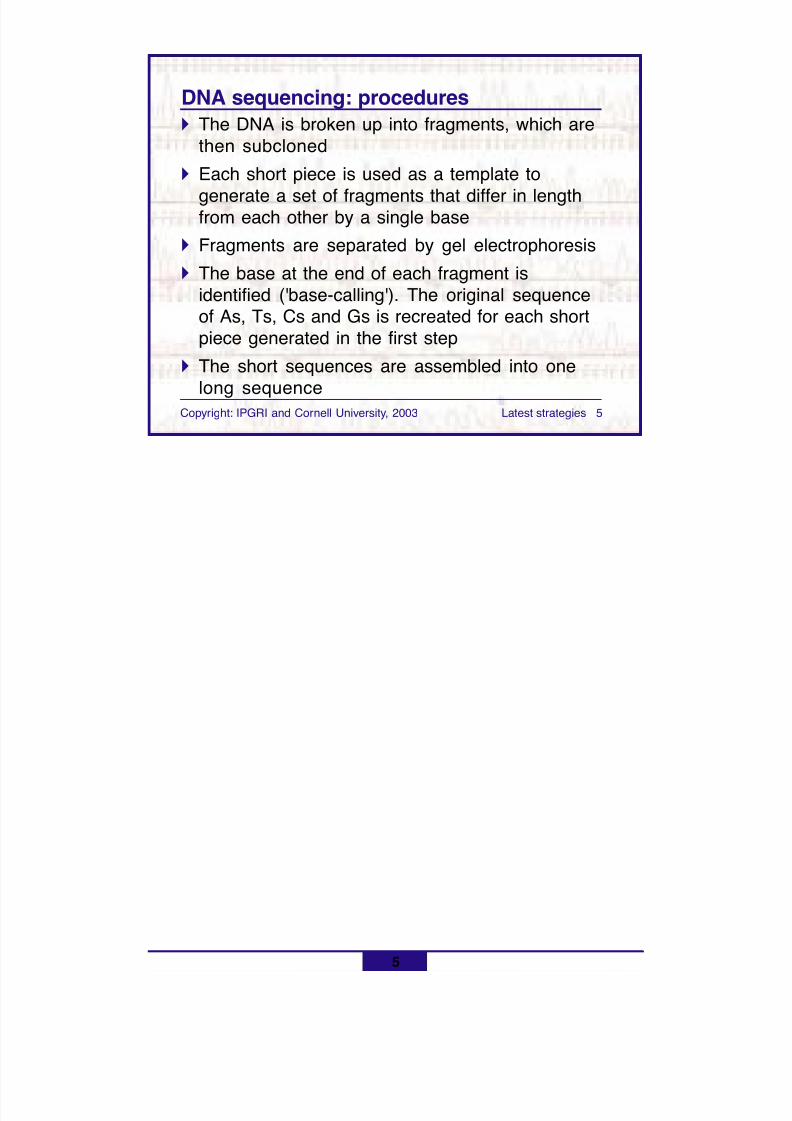
8/11/2019 Using molecular marker technology in studies on plant genetic diversity
http://slidepdf.com/reader/full/using-molecular-marker-technology-in-studies-on-plant-genetic-diversity 301/374
5
Copyright: IPGRI and Cornell University, 2003 Latest strategies 5
DNA sequencing: procedures! The DNA is broken up into fragments, which are
then subcloned! Each short piece is used as a template to
generate a set of fragments that differ in lengthfrom each other by a single base
! Fragments are separated by gel electrophoresis! The base at the end of each fragment is
identified ('base-calling'). The original sequenceof As, Ts, Cs and Gs is recreated for each shortpiece generated in the first step
! The short sequences are assembled into one
long sequence
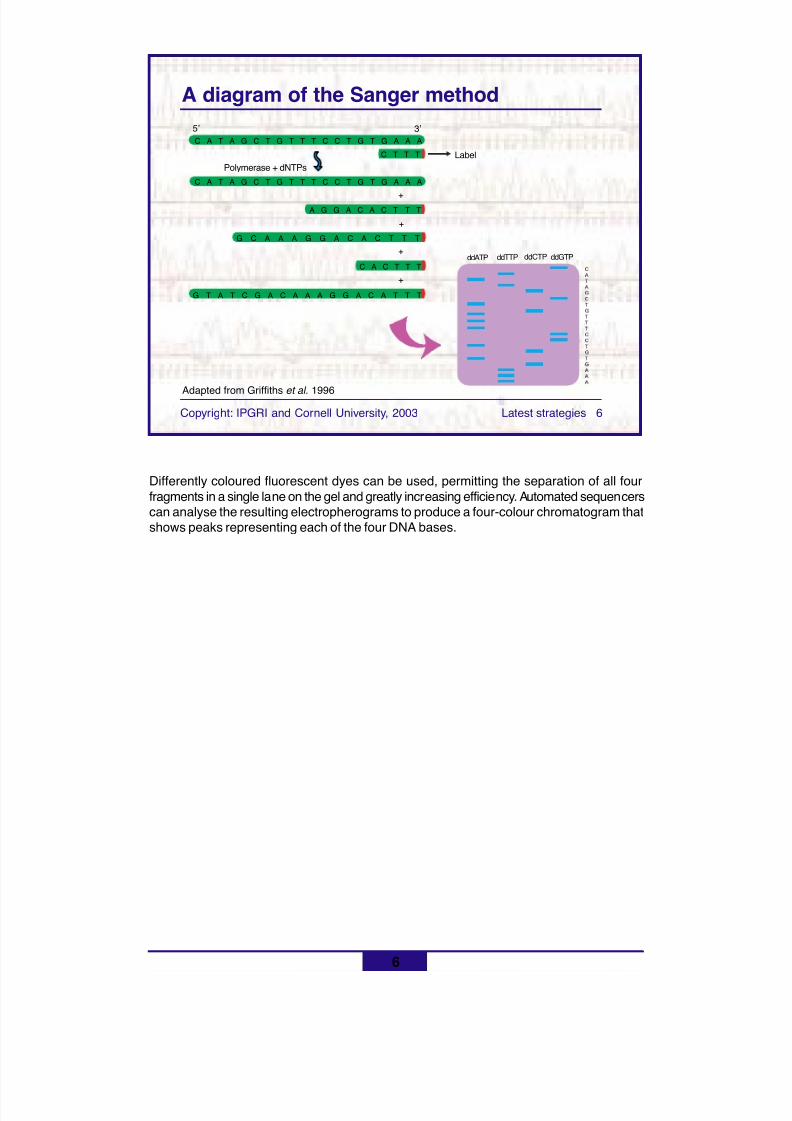
8/11/2019 Using molecular marker technology in studies on plant genetic diversity
http://slidepdf.com/reader/full/using-molecular-marker-technology-in-studies-on-plant-genetic-diversity 302/374
6
Copyright: IPGRI and Cornell University, 2003 Latest strategies 6
A diagram of the Sanger method
C A T A G C T G T T T C C T G T G A A A
C T T T
C A T A G C T G T T T C C T G T G A A A
A G G A C A C T T T
G C A A A G G A C A C T T T
C A C T T T
G T A T C G A C A A A G G A C A T T T
5’ 3’
LabelPolymerase + dNTPs
+
+
+
+
ddATP ddTTP ddCTP ddGTP
Differently coloured fluorescent dyes can be used, permitting the separation of all fourfragments in a single lane on the gel and greatly increasing efficiency. Automated sequencerscan analyse the resulting electropherograms to produce a four-colour chromatogram thatshows peaks representing each of the four DNA bases.
Adapted from Griffiths et al. 1996
8/11/2019 Using molecular marker technology in studies on plant genetic diversity
http://slidepdf.com/reader/full/using-molecular-marker-technology-in-studies-on-plant-genetic-diversity 303/374
7
Copyright: IPGRI and Cornell University, 2003 Latest strategies 7
DNA sequencing: advantages and disadvantages
! Advantages:
• Results are highly reproducible
• Maximum amount of information content
! Disadvantages:
• Costs are still high
• Technically demanding
The results are, of course, highly reproducible and informative. Costs are high, however,and a high level of technical expertise is needed, making this technology unavailable tomany researchers. The use of PCR for targeting particular regions of DNA and theavailability of automated sequencing machines have reduced the technical difficulties, butthe process is still expensive, particularly to set up.
8/11/2019 Using molecular marker technology in studies on plant genetic diversity
http://slidepdf.com/reader/full/using-molecular-marker-technology-in-studies-on-plant-genetic-diversity 304/374
8
Copyright: IPGRI and Cornell University, 2003 Latest strategies 8
Applications
! Evolutionary studies
! Calculations of genetic variation
! Comparative genomics
! Creating PCR assays (making primers to convertany marker to a PCR-based marker)
Although marker technology is, in general, based on DNA sequence variation,fortunately, a researcher does not necessarily need to know the entire DNA sequence touse molecular markers. Of course, DNA sequencing has many useful applications, but amajor drawback, particularly for diversity measurements, is that different genes evolveat different rates. Extrapolating information from particular genes to the species levelmust therefore be done with care (Brown and Kresovich, 1996).
Reference
Brown, S.M. and S. Kresovich. 1996. Molecular characterization for plant geneticresources conservation. Pp. 85-93 in Genome Mapping in Plants (H. Paterson, ed.).R.G. Landes Company, Georgetown, TX.

8/11/2019 Using molecular marker technology in studies on plant genetic diversity
http://slidepdf.com/reader/full/using-molecular-marker-technology-in-studies-on-plant-genetic-diversity 305/374
Basic references
Maxam, A.M. and W. Gilbert. 1977. A new method for sequencing DNA. Proc. Natl Acad.Sci. U.S.A. 74:560-564.
Sanger, F. 1988. Sequences, sequences and sequences. Annu. Rev. Biochem. 57:1-28.
Sanger, F., S. Nicklen and A.R. Coulson. 1977. DNA sequencing with chain-terminatinginhibitors. Proc. Natl Acad. Sci. U.S.A. 74:5463-5468.
9
8/11/2019 Using molecular marker technology in studies on plant genetic diversity
http://slidepdf.com/reader/full/using-molecular-marker-technology-in-studies-on-plant-genetic-diversity 306/374
10
Copyright: IPGRI and Cornell University, 2003 Latest strategies 10
Expressed sequence tags (ESTs)
! Expressed sequence tags are small pieces ofDNA sequence, usually 200 to 500 nucleotideslong
! Generated by sequencing either one or bothends of an expressed gene from a cDNA library
! This strategy is an extremely efficient way to findnew genes
The number of publicly available plant EST sequences has increased dramatically in thelast few years to more than 1,000,000 as of writing (National Plant Genome InitiativeProgress Report, December 2001). A list of databases of ESTs for many plants can befound at http://www.ostp.gov/NSTC/html/mpgi2001/building.htm
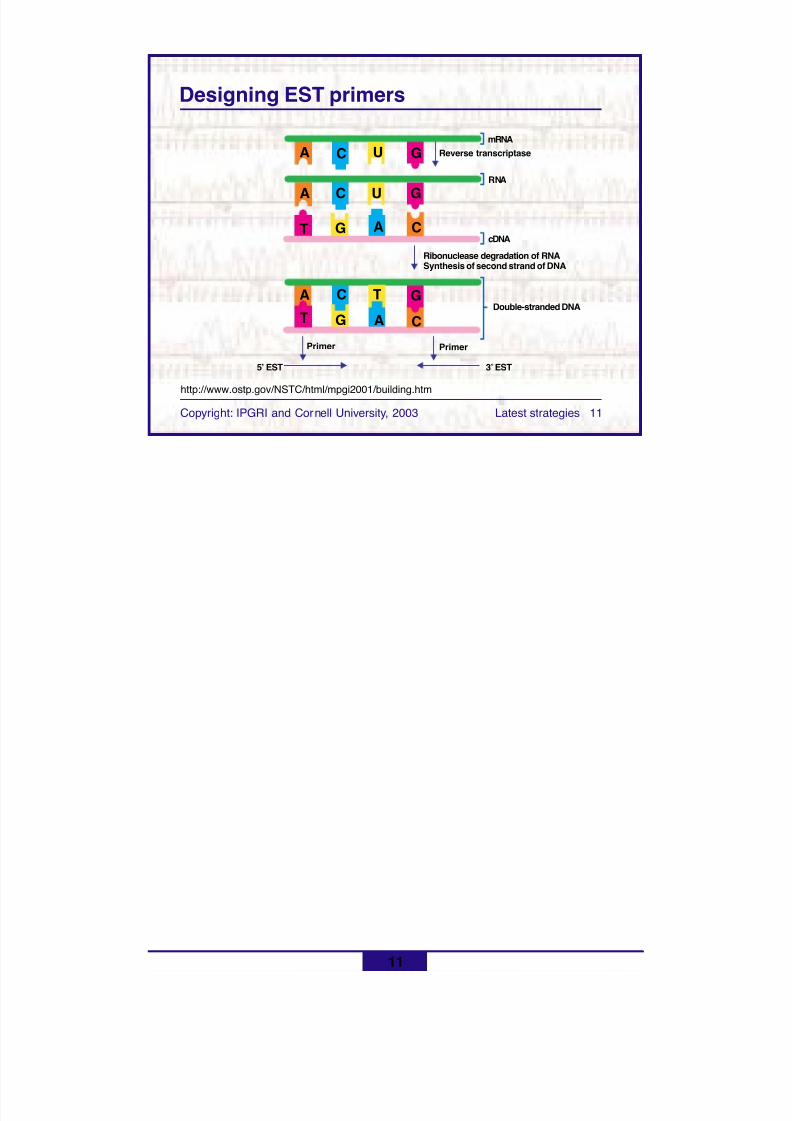
8/11/2019 Using molecular marker technology in studies on plant genetic diversity
http://slidepdf.com/reader/full/using-molecular-marker-technology-in-studies-on-plant-genetic-diversity 307/374
11
Copyright: IPGRI and Cornell University, 2003 Latest strategies 11http://www.ostp.gov/NSTC/html/mpgi2001/building.htm
Designing EST primers
mRNA
RNA
Reverse transcriptase
cDNA
Double-stranded DNA
Ribonuclease degradation of RNASynthesis of second strand of DNA
Primer
5’ EST 3’ EST
A UC G
A UC G
T AG C
A TC G
T AG C
Primer
8/11/2019 Using molecular marker technology in studies on plant genetic diversity
http://slidepdf.com/reader/full/using-molecular-marker-technology-in-studies-on-plant-genetic-diversity 308/374
12
Copyright: IPGRI and Cornell University, 2003 Latest strategies 12
ESTs: advantages and disadvantages
! Advantages:• Extremely good as genetic markers
• Codominant• Sequences can be generated rapidly• Efficient source of sequences to derive
primers for SSRs
! Disadvantages:• Isolation of mRNA may be difficult• Introns, which may contain important
information, are not part of cDNA
8/11/2019 Using molecular marker technology in studies on plant genetic diversity
http://slidepdf.com/reader/full/using-molecular-marker-technology-in-studies-on-plant-genetic-diversity 309/374
13
Copyright: IPGRI and Cornell University, 2003 Latest strategies 13
ESTs: applications
EST applications are all based on the fact thatESTs originate from segments of gene sequences:
! Comparing gene diversity in different organisms
! Gene evolution studies
! Searching databases for putative orthologues
! Probes for gene expression studies
! Detection of SNPs*
*See section beginning slide 29

8/11/2019 Using molecular marker technology in studies on plant genetic diversity
http://slidepdf.com/reader/full/using-molecular-marker-technology-in-studies-on-plant-genetic-diversity 310/374
Basic reference
National Center for Biotechnology Information (NCBI). 2001. ESTs: gene discovery madeeasier. http://www.ncbi.nlm.nih.gov/About/primer/est.html
14
8/11/2019 Using molecular marker technology in studies on plant genetic diversity
http://slidepdf.com/reader/full/using-molecular-marker-technology-in-studies-on-plant-genetic-diversity 311/374
15
Copyright: IPGRI and Cornell University, 2003 Latest strategies 15
Microarray, or ‘chip’, technology
! Microarrays are arrangements of small spotsof DNA fixed to glass slides or nylon membranes
! The technology allows monitoring of thewhole genome at once! The underlying principle of chips is base-pairing
or hybridisation between short probes andcomplementary DNA sequences
! Microarrays are constructed using cDNAs(cDNA arrays), genomic sequences oroligonucleotides synthesised in silico (‘DNAchips’)
Genomes can now be analysed on a whole-genome scale, using microarray (also called'chip') technology. This technology is based on hybridisation between shortoligonucleotide probes and complementary DNA sequences. Tens of thousands ofsamples can be immobilised on a tiny glass (more typically) or nylon slide (chip), andcan be hybridised more than once with different probes or targets (the terminology isinconsistent on whether the immobilised DNA on the chip should be called the target orprobe). More than one probe can be hybridised at a time, for example, to compare
differences in expression, by labelling them with different-coloured fluorescent dyes.
Special software programs generate the data automatically. Microarrays can be used fordiagnostics, studying gene expression and gene mapping, among other things. However,the technology is still relatively expensive, especially to set up, and the amount of datagenerated can be daunting.
For useful references, see Richmond and Somerville (2000) and Brown and Botstein(1999) at the end of this submodule (slide 19).
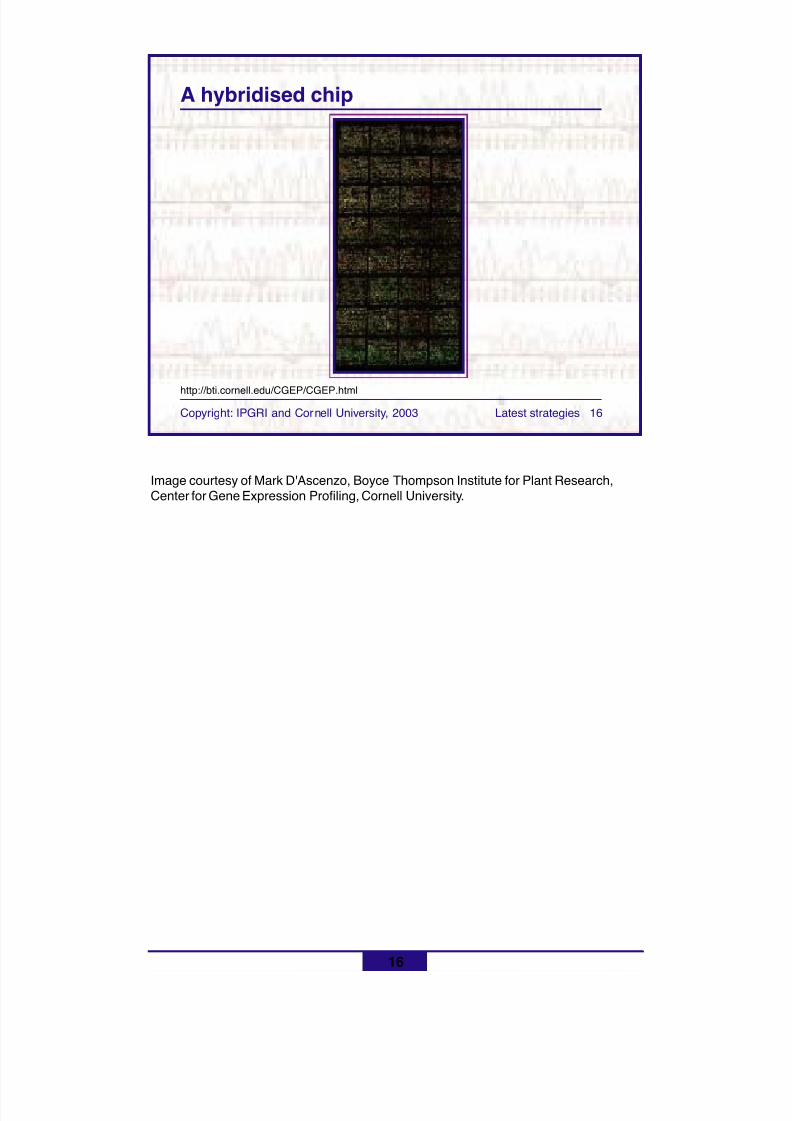
8/11/2019 Using molecular marker technology in studies on plant genetic diversity
http://slidepdf.com/reader/full/using-molecular-marker-technology-in-studies-on-plant-genetic-diversity 312/374
16
Copyright: IPGRI and Cornell University, 2003 Latest strategies 16
A hybridised chip
Image courtesy of Mark D'Ascenzo, Boyce Thompson Institute for Plant Research,Center for Gene Expression Profiling, Cornell University.
http://bti.cornell.edu/CGEP/CGEP.html
8/11/2019 Using molecular marker technology in studies on plant genetic diversity
http://slidepdf.com/reader/full/using-molecular-marker-technology-in-studies-on-plant-genetic-diversity 313/374
17
Copyright: IPGRI and Cornell University, 2003 Latest strategies 17
Microarrays: advantages and disadavantages
! Advantages:• High-throughput technology• Whole genome scanning• Allow the discovery of genotype-phenotype
relationship
! Disadvantages:• Gene sequence data must be available• Expensive• Technically demanding• Amount and type of data produced requires
high-level computing expertise and equipment
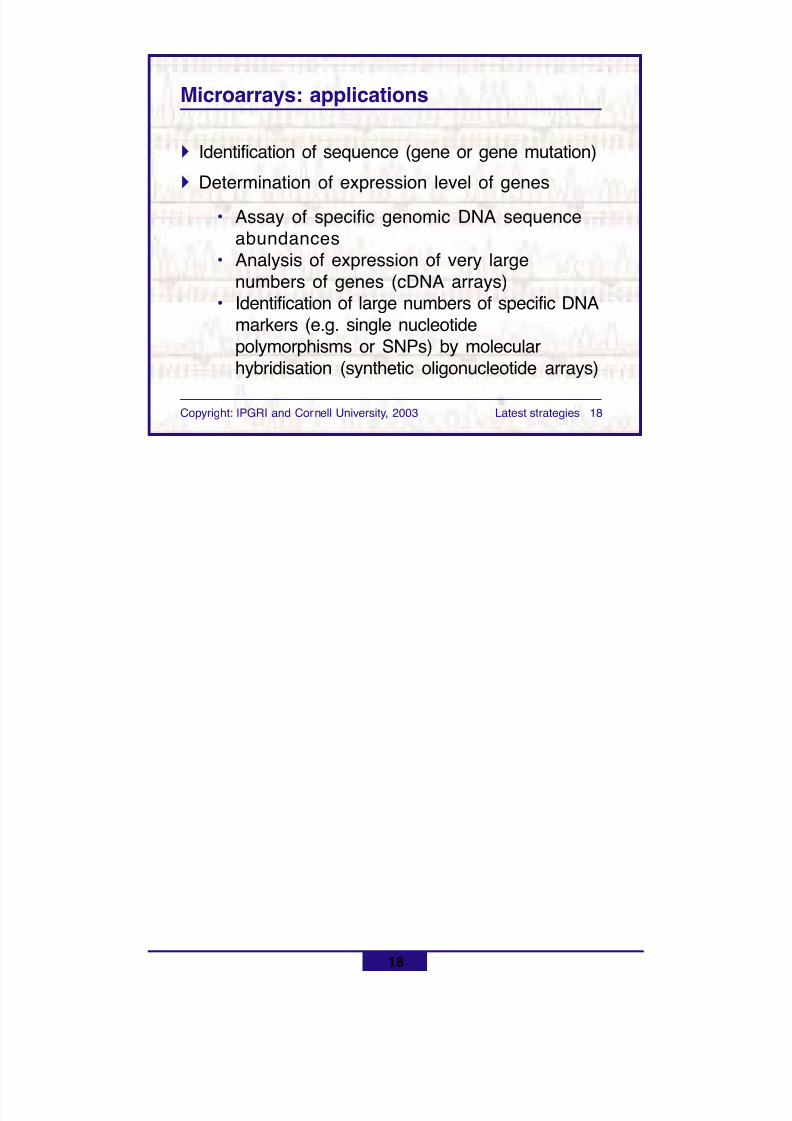
8/11/2019 Using molecular marker technology in studies on plant genetic diversity
http://slidepdf.com/reader/full/using-molecular-marker-technology-in-studies-on-plant-genetic-diversity 314/374
18
Copyright: IPGRI and Cornell University, 2003 Latest strategies 18
Microarrays: applications
! Identification of sequence (gene or gene mutation)! Determination of expression level of genes
• Assay of specific genomic DNA sequenceabundances
• Analysis of expression of very largenumbers of genes (cDNA arrays)
• Identification of large numbers of specific DNAmarkers (e.g. single nucleotidepolymorphisms or SNPs) by molecularhybridisation (synthetic oligonucleotide arrays)

8/11/2019 Using molecular marker technology in studies on plant genetic diversity
http://slidepdf.com/reader/full/using-molecular-marker-technology-in-studies-on-plant-genetic-diversity 315/374
Basic references
Alscher, R. 2001. Grid it: resources for microarray research. http://www.bsi.vt.edu/ ralscher/gridit/
Brown, P.O. and D. Botstein. 1999. Exploring the new world of the genome with DNAmicroarrays. Nature Genet. 21(supp):33-37.
Richmond, T. and S. Somerville. 2000. Chasing the dream: plant EST microarrays.Current Opinion Plant Biol. 3(2):108-116.
19
8/11/2019 Using molecular marker technology in studies on plant genetic diversity
http://slidepdf.com/reader/full/using-molecular-marker-technology-in-studies-on-plant-genetic-diversity 316/374
20
Copyright: IPGRI and Cornell University, 2003 Latest strategies 20
Diversity array technology (DArT)
Two steps are involved:
! Generating the array
! Genotyping a sample
Diversity arrays, also called DArT, was developed by CAMBIA. It involves a new use ofmicroarrays that does not require sequence knowledge, and thus may become veryuseful to crop researchers.
All the following slides on DArT have been taken, with the Centre's previousauthorisation, from CAMBIA's Web site: http://www.cambia.org.au/
References
CAMBIA. 2000. Enabling innovation. http://www.cambia.org/
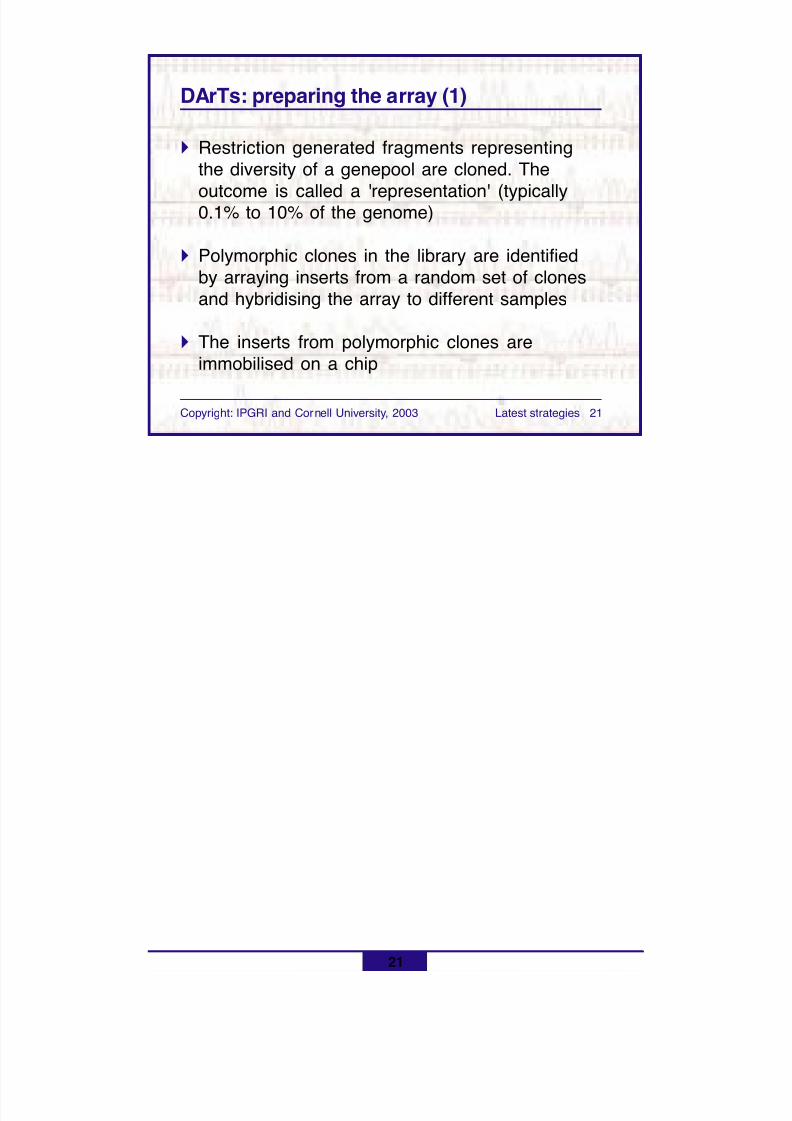
8/11/2019 Using molecular marker technology in studies on plant genetic diversity
http://slidepdf.com/reader/full/using-molecular-marker-technology-in-studies-on-plant-genetic-diversity 317/374
21
Copyright: IPGRI and Cornell University, 2003 Latest strategies 21
DArTs: preparing the array (1)
! Restriction generated fragments representingthe diversity of a genepool are cloned. The
outcome is called a 'representation' (typically0.1% to 10% of the genome)
! Polymorphic clones in the library are identifiedby arraying inserts from a random set of clonesand hybridising the array to different samples
! The inserts from polymorphic clones areimmobilised on a chip
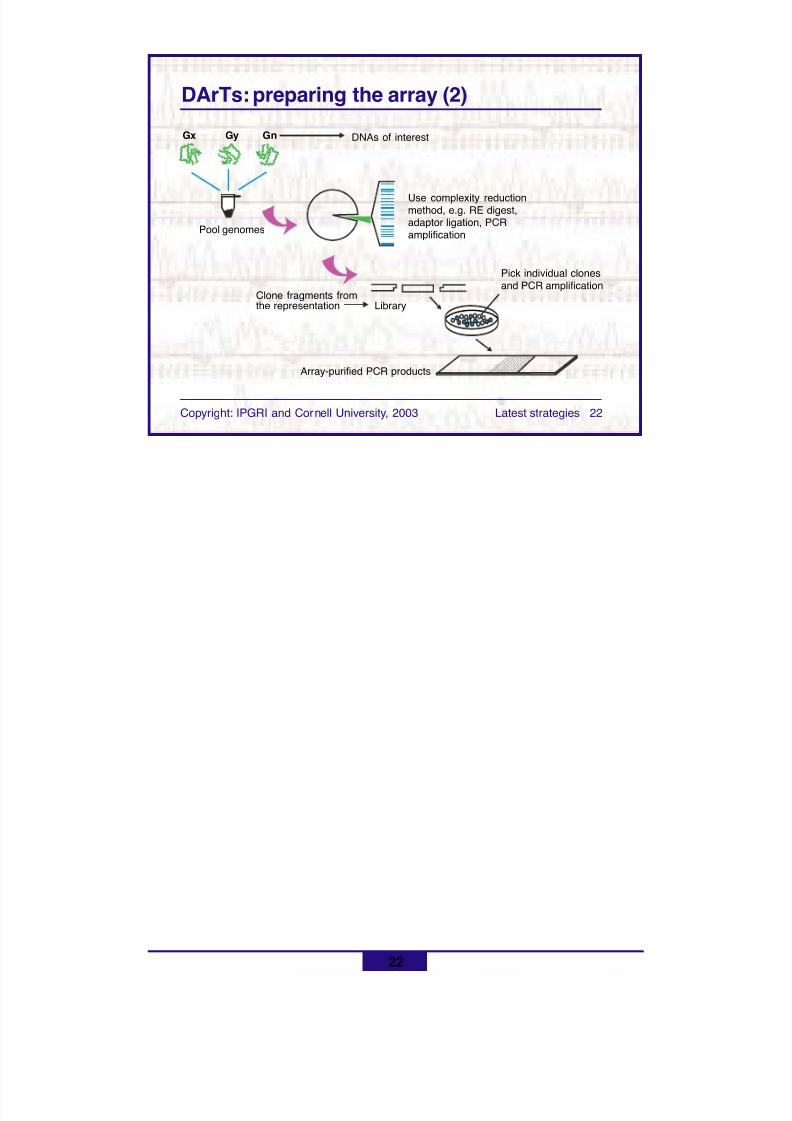
8/11/2019 Using molecular marker technology in studies on plant genetic diversity
http://slidepdf.com/reader/full/using-molecular-marker-technology-in-studies-on-plant-genetic-diversity 318/374
22
Copyright: IPGRI and Cornell University, 2003 Latest strategies 22
DArTs: preparing the array (2)
Gx Gy Gn
Pool genomes
Use complexity reductionmethod, e.g. RE digest,adaptor ligation, PCRamplification
Pick individual clonesand PCR amplification
Array-purified PCR products
Clone fragments fromthe representation Library
DNAs of interest
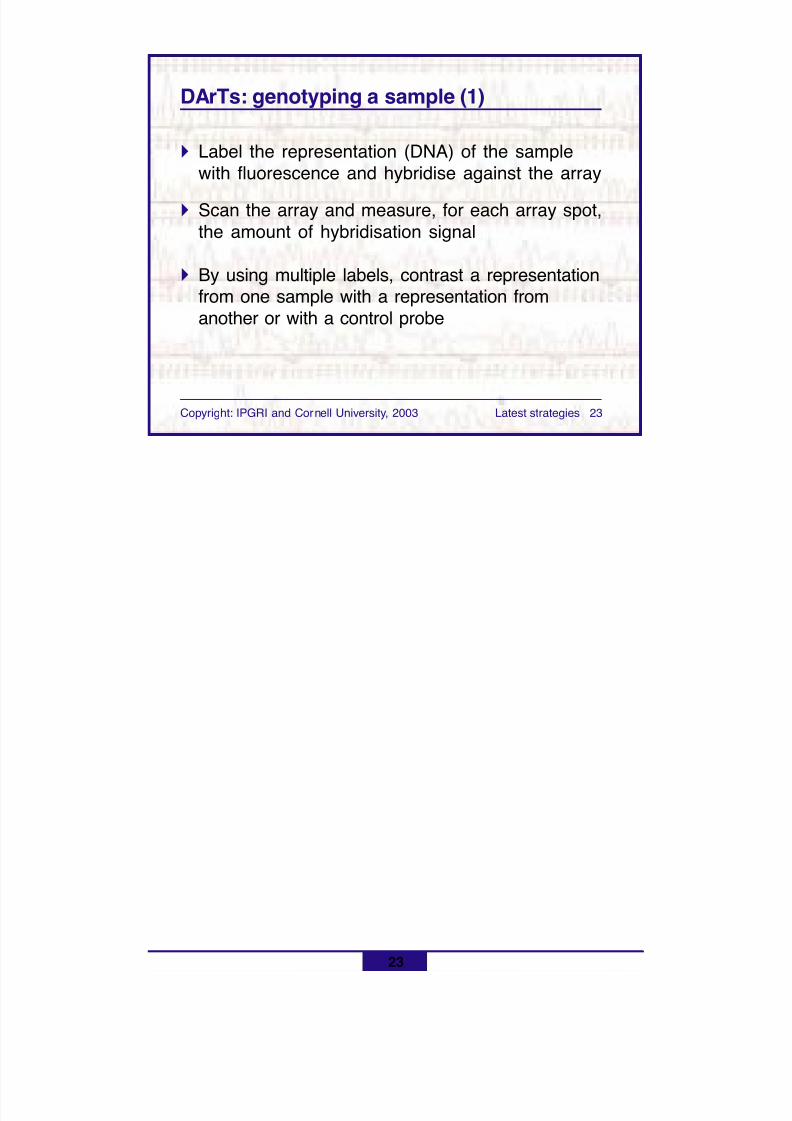
8/11/2019 Using molecular marker technology in studies on plant genetic diversity
http://slidepdf.com/reader/full/using-molecular-marker-technology-in-studies-on-plant-genetic-diversity 319/374
23
Copyright: IPGRI and Cornell University, 2003 Latest strategies 23
DArTs: genotyping a sample (1)
! Label the representation (DNA) of the samplewith fluorescence and hybridise against the array
! Scan the array and measure, for each array spot,the amount of hybridisation signal
! By using multiple labels, contrast a representationfrom one sample with a representation fromanother or with a control probe
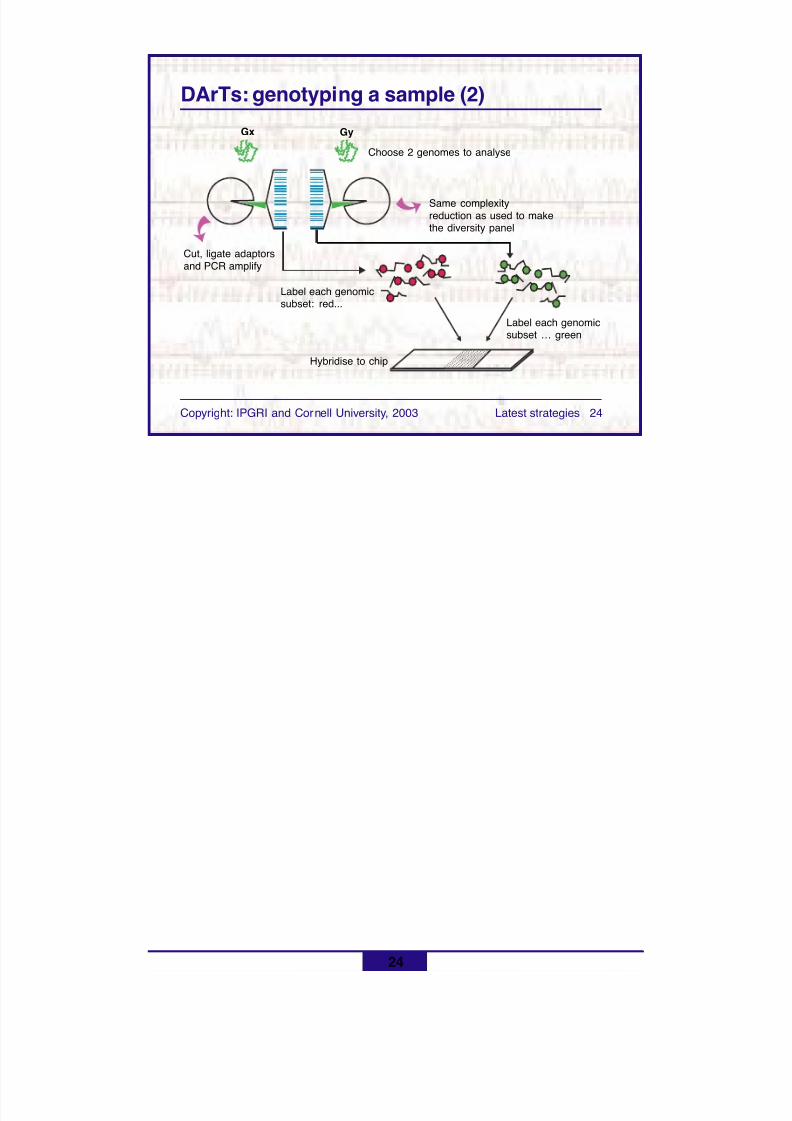
8/11/2019 Using molecular marker technology in studies on plant genetic diversity
http://slidepdf.com/reader/full/using-molecular-marker-technology-in-studies-on-plant-genetic-diversity 320/374
24
Copyright: IPGRI and Cornell University, 2003 Latest strategies 24
DArTs: genotyping a sample (2)
Gx Gy
Choose 2 genomes to analyse
Cut, ligate adaptorsand PCR amplify
Same complexityreduction as used to makethe diversity panel
Label each genomicsubset: red...
Hybridise to chip
Label each genomicsubset … green
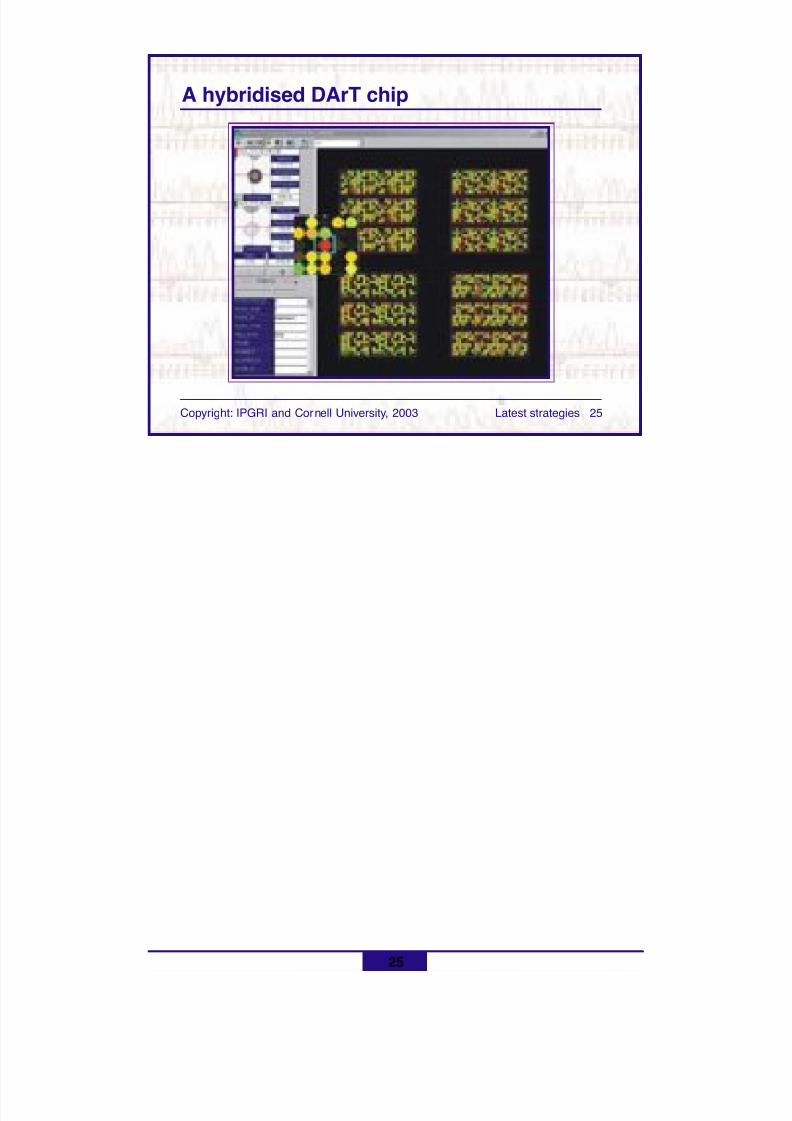
8/11/2019 Using molecular marker technology in studies on plant genetic diversity
http://slidepdf.com/reader/full/using-molecular-marker-technology-in-studies-on-plant-genetic-diversity 321/374
25
Copyright: IPGRI and Cornell University, 2003 Latest strategies 25
A hybridised DArT chip
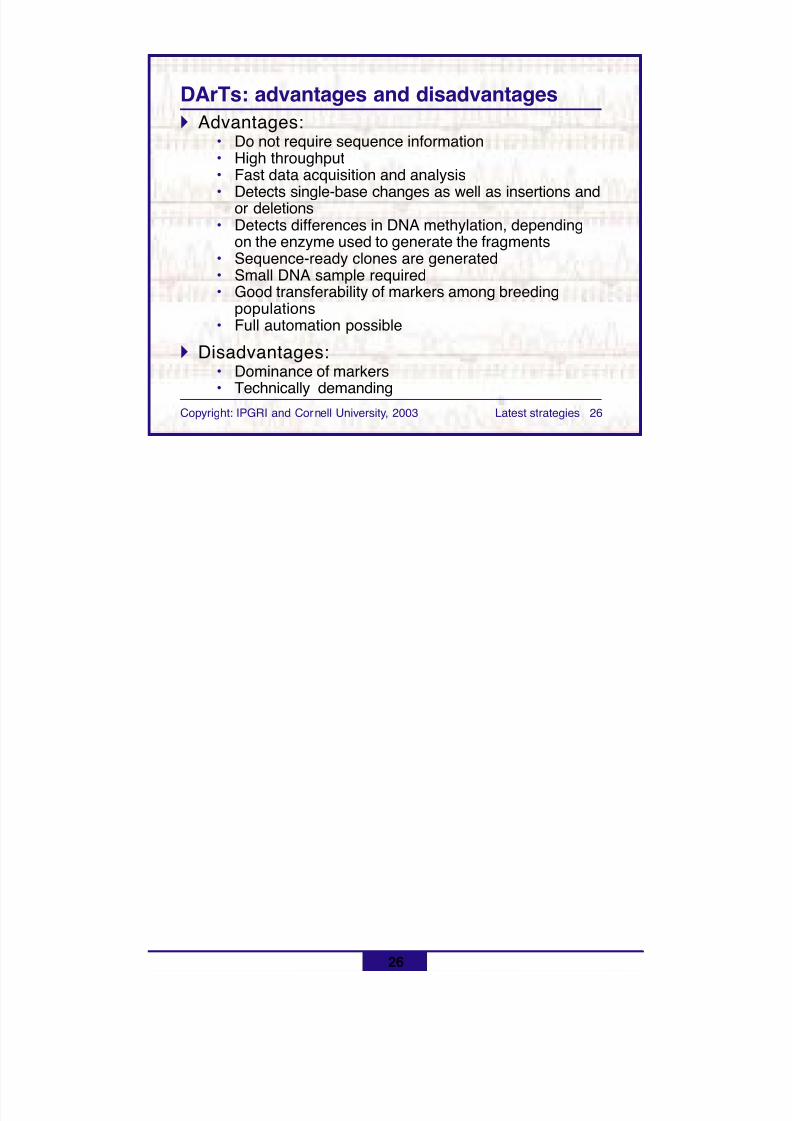
8/11/2019 Using molecular marker technology in studies on plant genetic diversity
http://slidepdf.com/reader/full/using-molecular-marker-technology-in-studies-on-plant-genetic-diversity 322/374
26
Copyright: IPGRI and Cornell University, 2003 Latest strategies 26
DArTs: advantages and disadvantages! Advantages:
• Do not require sequence information• High throughput• Fast data acquisition and analysis
• Detects single-base changes as well as insertions andor deletions• Detects differences in DNA methylation, depending
on the enzyme used to generate the fragments• Sequence-ready clones are generated• Small DNA sample required• Good transferability of markers among breeding
populations• Full automation possible
! Disadvantages:• Dominance of markers
• Technically demanding
8/11/2019 Using molecular marker technology in studies on plant genetic diversity
http://slidepdf.com/reader/full/using-molecular-marker-technology-in-studies-on-plant-genetic-diversity 323/374
27
Copyright: IPGRI and Cornell University, 2003 Latest strategies 27
DArTs: applications
! Rapid germplasm characterisation
! Genetic mapping
! Marker-assisted breeding
Reference
Jaccoud, D., K. Peng, D. Feinstein and A. Kilian. 2001. Diversity arrays: a solid-statetechnology for sequence information independent genotyping. Nucleic Acids Res.29(4):E25.

8/11/2019 Using molecular marker technology in studies on plant genetic diversity
http://slidepdf.com/reader/full/using-molecular-marker-technology-in-studies-on-plant-genetic-diversity 324/374
Basic References
CAMBIA. 2000. Enabling innovation. http://www.cambia.org/
Jaccoud, D., K. Peng, D. Feinstein and A. Kilian. 2001. Diversity arrays: a solid-statetechnology for sequence information independent genotyping. Nucleic AcidsResearch 29 (4): E25.
28
8/11/2019 Using molecular marker technology in studies on plant genetic diversity
http://slidepdf.com/reader/full/using-molecular-marker-technology-in-studies-on-plant-genetic-diversity 325/374
29
Copyright: IPGRI and Cornell University, 2003 Latest strategies 29
Single nucleotide polymorphisms (SNPs)
! Single-base substitutions between
homologous sequences
! SNPs occur more frequently than anyother type of polymorphism
! Can be identified on using microarrays andDHPLC equipment
A newer type of marker that has now been made available through new sequencingtechnologies is single nucleotide polymorphisms (SNPs). These polymorphisms aresingle-base substitutions between sequences. SNPs occur more frequently than anyother type of marker, and are very near to or even within the gene of interest.
SNPs can be identified by either using microarrays or DHPLC machines.
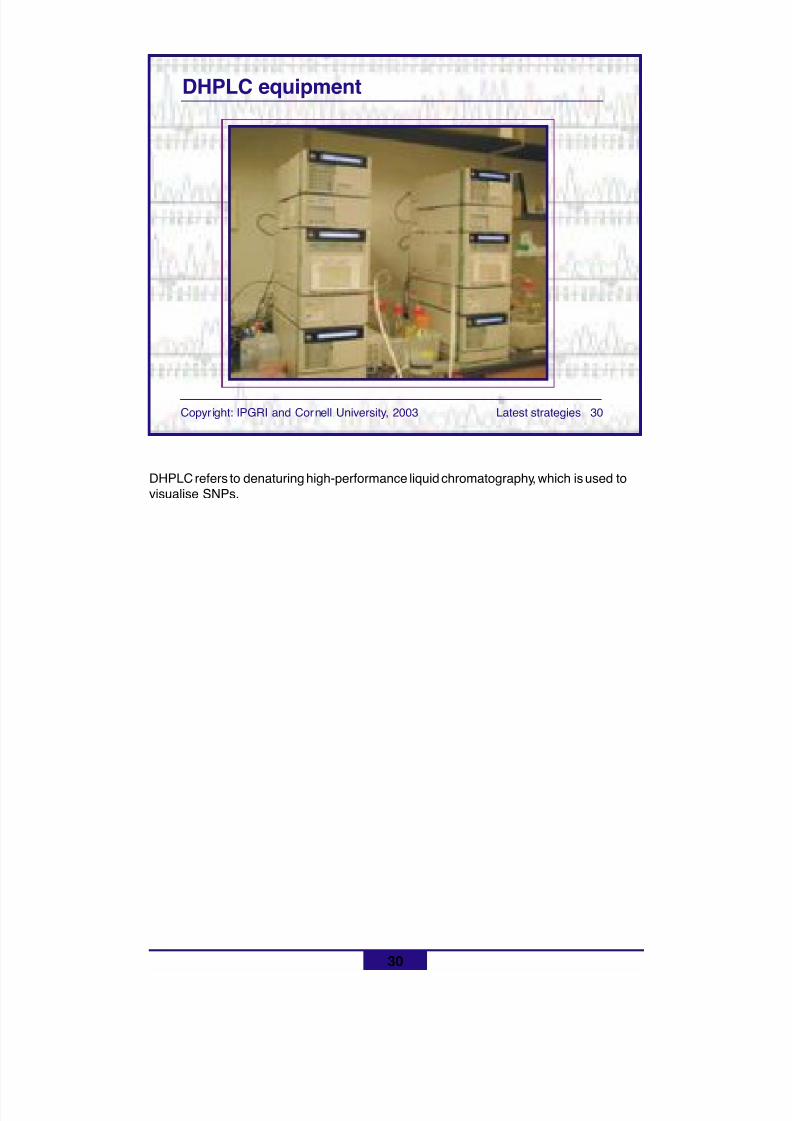
8/11/2019 Using molecular marker technology in studies on plant genetic diversity
http://slidepdf.com/reader/full/using-molecular-marker-technology-in-studies-on-plant-genetic-diversity 326/374
DHPLC refers to denaturing high-performance liquid chromatography, which is used tovisualise SNPs.
DHPLC equipment
30
Copyr ight: IPGRI and Cornell University, 2003 Latest strategies 30
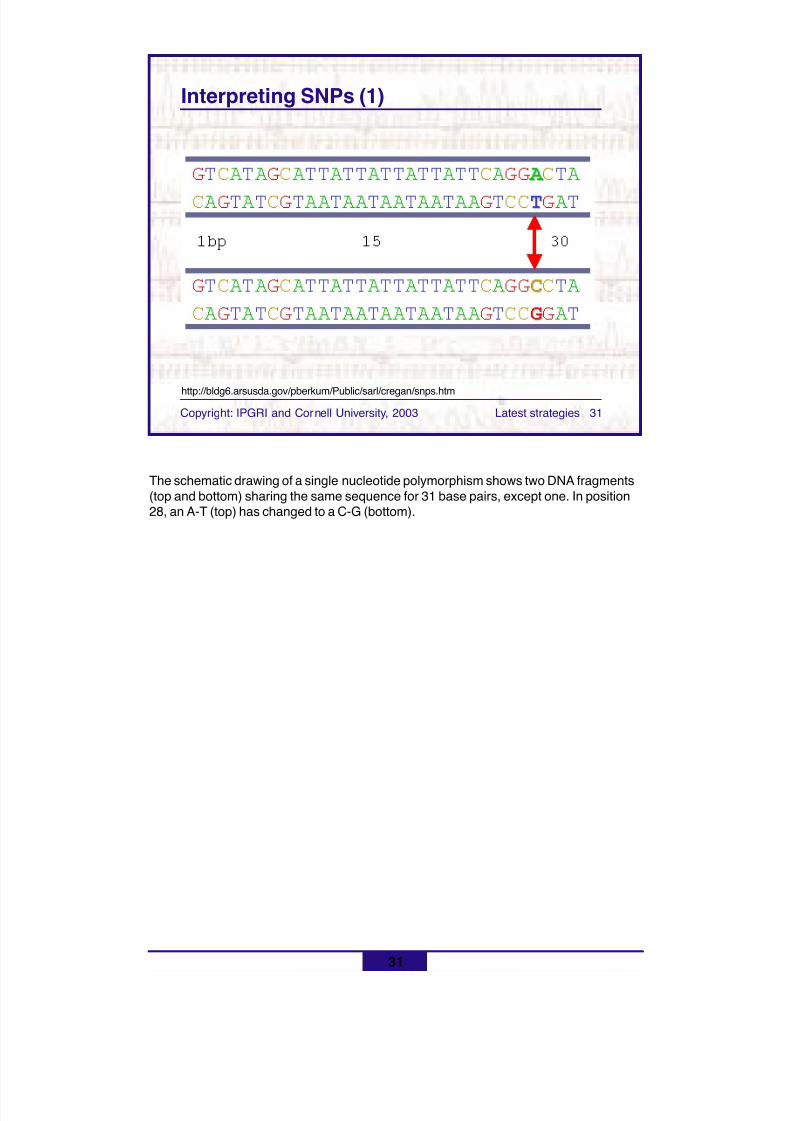
8/11/2019 Using molecular marker technology in studies on plant genetic diversity
http://slidepdf.com/reader/full/using-molecular-marker-technology-in-studies-on-plant-genetic-diversity 327/374
31
Copyright: IPGRI and Cornell University, 2003 Latest strategies 31
Interpreting SNPs (1)
http://bldg6.arsusda.gov/pberkum/Public/sarl/cregan/snps.htm
The schematic drawing of a single nucleotide polymorphism shows two DNA fragments(top and bottom) sharing the same sequence for 31 base pairs, except one. In position28, an A-T (top) has changed to a C-G (bottom).
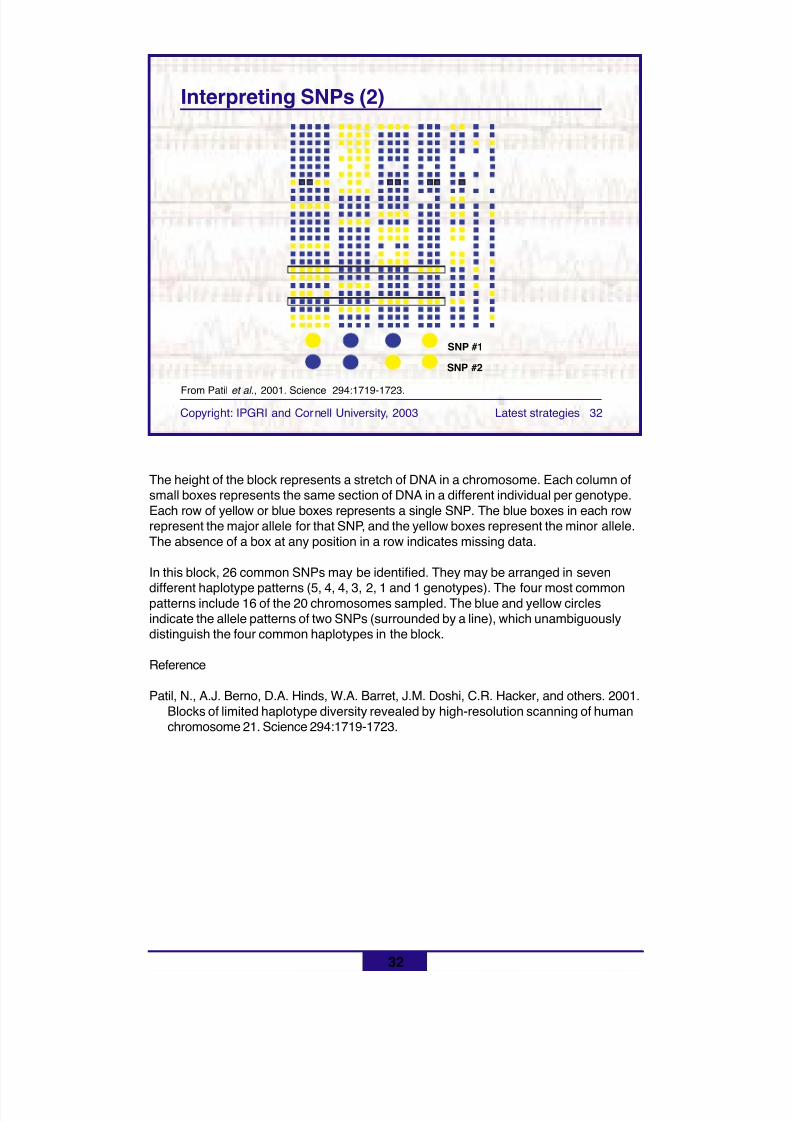
8/11/2019 Using molecular marker technology in studies on plant genetic diversity
http://slidepdf.com/reader/full/using-molecular-marker-technology-in-studies-on-plant-genetic-diversity 328/374
32
Copyright: IPGRI and Cornell University, 2003 Latest strategies 32
Interpreting SNPs (2)
The height of the block represents a stretch of DNA in a chromosome. Each column ofsmall boxes represents the same section of DNA in a different individual per genotype.Each row of yellow or blue boxes represents a single SNP. The blue boxes in each rowrepresent the major allele for that SNP, and the yellow boxes represent the minor allele.The absence of a box at any position in a row indicates missing data.
In this block, 26 common SNPs may be identified. They may be arranged in seven
different haplotype patterns (5, 4, 4, 3, 2, 1 and 1 genotypes). The four most commonpatterns include 16 of the 20 chromosomes sampled. The blue and yellow circlesindicate the allele patterns of two SNPs (surrounded by a line), which unambiguouslydistinguish the four common haplotypes in the block.
Reference
Patil, N., A.J. Berno, D.A. Hinds, W.A. Barret, J.M. Doshi, C.R. Hacker, and others. 2001.Blocks of limited haplotype diversity revealed by high-resolution scanning of humanchromosome 21. Science 294:1719-1723.
From Patil et al ., 2001. Science 294:1719-1723.
SNP #1
SNP #2
8/11/2019 Using molecular marker technology in studies on plant genetic diversity
http://slidepdf.com/reader/full/using-molecular-marker-technology-in-studies-on-plant-genetic-diversity 329/374
33
Copyright: IPGRI and Cornell University, 2003 Latest strategies 33
In summary
! Strategies are continuously being developed to improvethe detection of polymorphisms
!DNA sequencing allows the detection of variation at eventhe nucleotide level
! ESTs are powerful tools for detecting diversity withincoding regions
! Microarrays and DArT make the simultaneous analysis ofmany loci possible
! SNPs are single-base substitutions between sequences,and represent the most frequent DNA variant
8/11/2019 Using molecular marker technology in studies on plant genetic diversity
http://slidepdf.com/reader/full/using-molecular-marker-technology-in-studies-on-plant-genetic-diversity 330/374
34
Copyright: IPGRI and Cornell University, 2003 Latest strategies 34
By now you should know
! The different types of DNA variation that can bedetected by sequencing, ESTs and SNPs
! The underlying principle of microarrays and DArT
! The advantages and disadvantages of the newesttechnologies for analysing genetic diversity

8/11/2019 Using molecular marker technology in studies on plant genetic diversity
http://slidepdf.com/reader/full/using-molecular-marker-technology-in-studies-on-plant-genetic-diversity 331/374
Basic references
Griffiths, A.J.F., J.H. Miller, D.T. Suzuki, R.C. Lewontin and W.M. Gelbart. 1996. Anintroduction to genetic analysis (6th edn.). W.H. Freeman and Co., NY.
Hajeer, A., J. Worthington and S. John (eds.). 2000. SNP and Microsatellite Genotyping:Markers for Genetic Analysis. Biotechniques Molecular Laboratory Methods Series.Eaton Publishing, Manchester, UK.
USDA-ARS. 1999. The Cregan lab. http://bldg6.arsusda.gov/pberkum/Public/sarl/cregan/ snps.htm
Wang, D.G., J.B. Fan, C.J. Siao, A. Berno, P. Young, R. Sapolsky, and others. 1998.Large-scale identification, mapping, and genotyping of single-nucleotidepolymorphisms in the human genome. Science 280(5366):1077-1082.
35
8/11/2019 Using molecular marker technology in studies on plant genetic diversity
http://slidepdf.com/reader/full/using-molecular-marker-technology-in-studies-on-plant-genetic-diversity 332/374
36
Copyright: IPGRI and Cornell University, 2003 Latest strategies 36
Next
Complementary technologies
! Final considerations
! Glossary
8/11/2019 Using molecular marker technology in studies on plant genetic diversity
http://slidepdf.com/reader/full/using-molecular-marker-technology-in-studies-on-plant-genetic-diversity 333/374
Using molecular marker technologyin studies on plant geneticdiversity
V Complementary technologies
j~áå ãÉåì
8/11/2019 Using molecular marker technology in studies on plant genetic diversity
http://slidepdf.com/reader/full/using-molecular-marker-technology-in-studies-on-plant-genetic-diversity 334/374
Using molecular marker technology in
studies on plant genetic diversity
Complementarytechnologies
Copyright: IPGRI and Cornell University, 2003 Complementary technologies 1
8/11/2019 Using molecular marker technology in studies on plant genetic diversity
http://slidepdf.com/reader/full/using-molecular-marker-technology-in-studies-on-plant-genetic-diversity 335/374
2
Copyright: IPGRI and Cornell University, 2003 Complementary technologies 2
Contents
! Introduction! Denaturing gradient gel electrophoresis (DGGE)! Thermal gradient gel electrophoresis (TGGE)! Single-stranded conformational polymorphism
(SSCP)! Heteroduplex analysis! Denaturing high-performance liquid
chromotography (DHPLC)
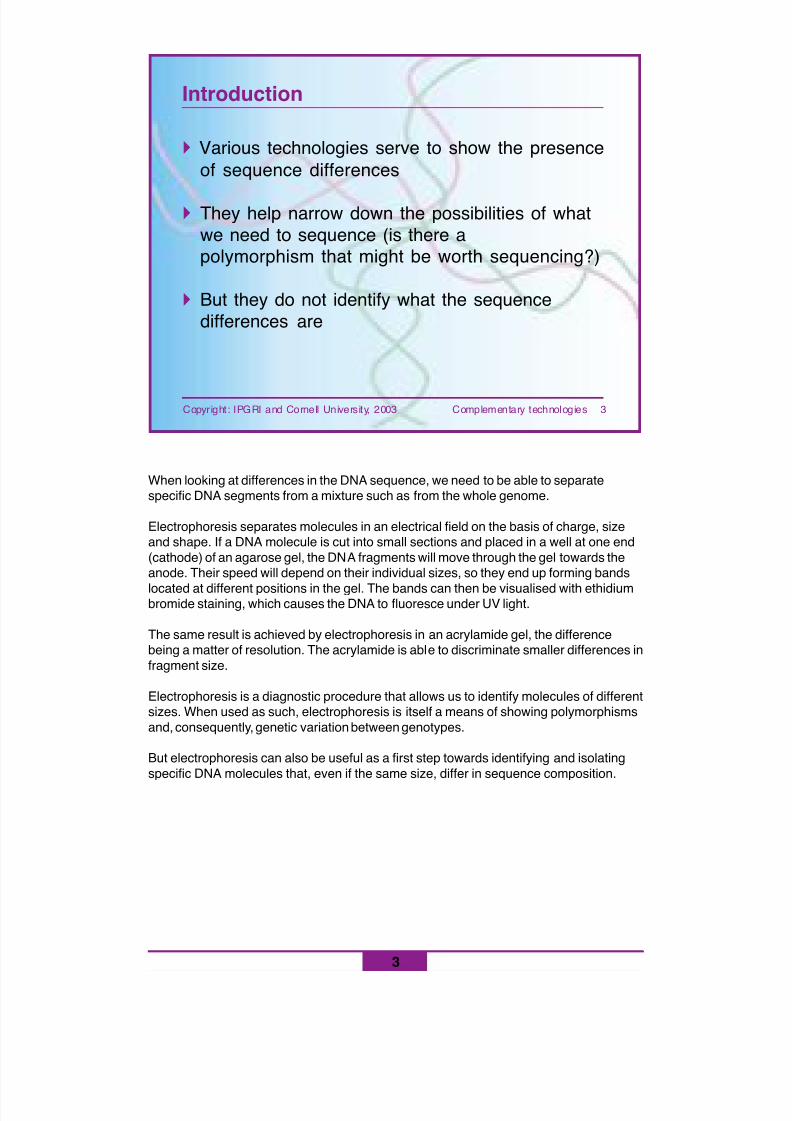
8/11/2019 Using molecular marker technology in studies on plant genetic diversity
http://slidepdf.com/reader/full/using-molecular-marker-technology-in-studies-on-plant-genetic-diversity 336/374
3
Copyright: IPGRI and Cornell University, 2003 Complementary technologies 3
Introduction
! Various technologies serve to show the presenceof sequence differences
! They help narrow down the possibilities of whatwe need to sequence (is there apolymorphism that might be worth sequencing?)
! But they do not identify what the sequencedifferences are
When looking at differences in the DNA sequence, we need to be able to separatespecific DNA segments from a mixture such as from the whole genome.
Electrophoresis separates molecules in an electrical field on the basis of charge, sizeand shape. If a DNA molecule is cut into small sections and placed in a well at one end(cathode) of an agarose gel, the DNA fragments will move through the gel towards theanode. Their speed will depend on their individual sizes, so they end up forming bands
located at different positions in the gel. The bands can then be visualised with ethidiumbromide staining, which causes the DNA to fluoresce under UV light.
The same result is achieved by electrophoresis in an acrylamide gel, the differencebeing a matter of resolution. The acrylamide is able to discriminate smaller differences infragment size.
Electrophoresis is a diagnostic procedure that allows us to identify molecules of differentsizes. When used as such, electrophoresis is itself a means of showing polymorphismsand, consequently, genetic variation between genotypes.
But electrophoresis can also be useful as a first step towards identifying and isolatingspecific DNA molecules that, even if the same size, differ in sequence composition.
8/11/2019 Using molecular marker technology in studies on plant genetic diversity
http://slidepdf.com/reader/full/using-molecular-marker-technology-in-studies-on-plant-genetic-diversity 337/374
4
Copyright: IPGRI and Cornell University, 2003 Complementary technologies 4
Denaturing gradient gel electrophoresis(DGGE) (1)
!!!!! Permits detecting very small DNA polymorphismsor mutations
!!!!! Can be applied to long DNA fragments,measuring hundreds of base pairs!!!!! Does not require previous knowledge on the
existence of a polymorphism!!!!! Based on the renaturation properties of DNA
strands!!!!! DNA denaturation takes place through
electrophoresis
8/11/2019 Using molecular marker technology in studies on plant genetic diversity
http://slidepdf.com/reader/full/using-molecular-marker-technology-in-studies-on-plant-genetic-diversity 338/374
5
Copyright: IPGRI and Cornell University, 2003 Complementary technologies 5
Denaturing gradient gel electrophoresis (2)
! Small DNA fragments are subject toelectrophoresis through a polyacrylamide gel
under increasingly denaturing conditions(formamide/urea concentrations)
! The DNA 'melts' and becomes single stranded
! DNA molecules change their shape and stopmoving
! Differences in DNA sequence are identified
The DNA fragments migrate first as double-stranded molecules. Later, because of thegel's changing composition, the molecules denature and become single stranded,forming a branched structure. This changed structure results in the molecules'diminished ability to move through the gel.
The point at which the DNA melts depends on the nucleotide sequence in the meltedregion. The final location of the molecules in the gel thus depends on the nucleotide
sequence of the fragments.
8/11/2019 Using molecular marker technology in studies on plant genetic diversity
http://slidepdf.com/reader/full/using-molecular-marker-technology-in-studies-on-plant-genetic-diversity 339/374
6
Copyright: IPGRI and Cornell University, 2003 Complementary technologies 6
Denaturing gradient gel electrophoresis (3)
DGGE can be a two-step process:
! Samples are run to separate fragmentsaccording to size
! Fragments are separated under DGGEconditions by the ‘melting point’ process
When samples are mixed, double bands indicatesequence differences between bands of thesame size
At least 95% of differences in sequence composition is estimated as being detectedwith this procedure.
DGGE also serves to distinguish homozygous versus heterozygous genotypes for aparticular DNA fragment. To take advantage of this capacity, a cycle of denaturation andrenaturation must be conducted after the last PCR cycle. Homoduplexes andheteroduplexes are formed as alleles reassociate. In the DGGE gel, fast-migrating
homoduplex combinations will indicate homozygous genotypes. Heterozygousgenotypes will show both homoduplex and heteroduplex combinations. Heteroduplexesare formed through mispairing and rapid denaturation in the gel, which will stop themigratory course of these molecules.
8/11/2019 Using molecular marker technology in studies on plant genetic diversity
http://slidepdf.com/reader/full/using-molecular-marker-technology-in-studies-on-plant-genetic-diversity 340/374
7
Copyright: IPGRI and Cornell University, 2003 Complementary technologies 7
Thermal gradient gel electrophoresis (TGGE)
! Similar to DGGE
! Increasingly denaturing conditions are achievedby a temperature gradient instead of bychanging reagent concentrations
! Can also be used for analysing single-strandedRNA and proteins

8/11/2019 Using molecular marker technology in studies on plant genetic diversity
http://slidepdf.com/reader/full/using-molecular-marker-technology-in-studies-on-plant-genetic-diversity 341/374
Basic reference
Myers, R.M., N. Lumelsky, L.S. Lerman and T. Maniatis. 1985. Detection of single basesubstitutions in total genomic DNA. Nature 313:495-498.
8
8/11/2019 Using molecular marker technology in studies on plant genetic diversity
http://slidepdf.com/reader/full/using-molecular-marker-technology-in-studies-on-plant-genetic-diversity 342/374
9
Copyright: IPGRI and Cornell University, 2003 Complementary technologies 9
Single-stranded conformationalpolymorphism (SSCP) (1)
SSCP can distinguish between two very similar DNA sequences only on the basis of theparticular shape of their single-stranded structures. In principle, then, even two alleles ofthe same gene can be discriminated.
! SSCP is based on the electrophoretic behaviourof a single-stranded DNA molecule through anon-denaturing acrylamide gel
• A single-stranded molecule has the propertyof forming secondary structures throughinternal base pairings
• These secondary structures are sequence-dependent and result in particular shapesfor each single-stranded molecule
! Differences in secondary structures cause theDNA strands to migrate differentially on the gel
8/11/2019 Using molecular marker technology in studies on plant genetic diversity
http://slidepdf.com/reader/full/using-molecular-marker-technology-in-studies-on-plant-genetic-diversity 343/374
10
Copyright: IPGRI and Cornell University, 2003 Complementary technologies 10
SSCP (2)
!!!!! The sequence of interest goes through PCR
!!!!! Next, the PCR product is denatured at 94°C and
rapidly cooled down on ice. Single-strandedmolecules do not pair but form stable secondarystructures
!!!!! The reassociated fragments are then subject toelectrophoresis:
• In an homozygous case, two bands can be observed,each corresponding to a slightly different secondarystructure
• In a heterozygous case, at least four bands can beobserved
SSCP is a simple technique, but has at least two major disadvantages:
• The electrophoretic behaviour of the single-stranded molecules isunpredictable, depending very much on temperature and runningconditions.
• In the case of long DNA fragments (> 200 bp), the method becomesinsensitive to some mutations. In principle, SSCP seems to work betterfor small insertions and/or deletions.

8/11/2019 Using molecular marker technology in studies on plant genetic diversity
http://slidepdf.com/reader/full/using-molecular-marker-technology-in-studies-on-plant-genetic-diversity 344/374
Basic reference
Hayashi, K. 1992. A method for the detection of mutations. Genet. Anal. Tech. Appl. 9:73-79.
11
8/11/2019 Using molecular marker technology in studies on plant genetic diversity
http://slidepdf.com/reader/full/using-molecular-marker-technology-in-studies-on-plant-genetic-diversity 345/374
12
Copyright: IPGRI and Cornell University, 2003 Complementary technologies 12
Heteroduplex analysis
! Two PCR-amplified products are mixed in equalquantities, denatured at 95°C and allowed to
cool! During cooling, DNA strands reanneal to form
heteroduplex DNA
! Any mismatches in the heteroduplex will cause itto have a different three-dimensional structure,with a reduced mobility that is proportional to thedegree of divergence of the sequences

8/11/2019 Using molecular marker technology in studies on plant genetic diversity
http://slidepdf.com/reader/full/using-molecular-marker-technology-in-studies-on-plant-genetic-diversity 346/374
Basic reference
Delwart, E.L., E.G. Shpaer, J. Louwagie, F. McCutchan, M. Grez, H. RübsamenWaigmann and J.I. Mullins. 1993. Genetic relationships determined by a heteroduplexmobility assay: analysis of HIV env genes. Science 262:1257-1261.
13
8/11/2019 Using molecular marker technology in studies on plant genetic diversity
http://slidepdf.com/reader/full/using-molecular-marker-technology-in-studies-on-plant-genetic-diversity 347/374
14
Copyright: IPGRI and Cornell University, 2003 Complementary technologies 14
Denaturing high-performance liquidchromatography (DHPLC): methodology
! This method can detect sequence differences ofa single base pair as well as insertions and/or
deletions
! Works with crude PCR products and does notrequire prior DNA sequencing
! Based on the differential elution of homoduplexand heteroduplex DNA when run through acolumn
DHPLC is a high-performance liquid chromatography method in which DNA fragments areseparated according to size and/or presence of heteroduplexes (reannealed DNAstrands) during their passage through a gradient in a column.
In double-stranded amplified DNA, nucleotides that are mismatched through mutationsand polymorphisms become evident after heteroduplex formation. The presence of thesepolymorphisms creates a mixed population of heteroduplexes and homoduplexes during
reannealing of wild type and mutant DNA. If this mixture of fragments is run underpartially denaturing conditions by HPLC, heteroduplexes elute from the column earlierthan the homoduplexes because of their lower melting temperature.
Analysis can be performed to detect sequence variation between individuals ordetermine heterozygosity.
8/11/2019 Using molecular marker technology in studies on plant genetic diversity
http://slidepdf.com/reader/full/using-molecular-marker-technology-in-studies-on-plant-genetic-diversity 348/374
15
Copyright: IPGRI and Cornell University, 2003 Complementary technologies 15
DHPLC: applications
! Finding new mutations and polymorphisms inany DNA fragment or particular gene sequence
! Screening clones to identify candidatefragments for sequencing
! Evaluating the fidelity of amplified fragments
! Diagnosing for the presence of knownmutations

8/11/2019 Using molecular marker technology in studies on plant genetic diversity
http://slidepdf.com/reader/full/using-molecular-marker-technology-in-studies-on-plant-genetic-diversity 349/374
Basic reference
Oefner, P.J. and P.A. Underhill. 1998. DNA Mutation Detection Using Denaturing High-Performance Liquid Chromatography (DHPLC). Current Protocols in Human Genetics,supplement 19, 7.10.1-7.10.12. Wiley & Sons, NY.
16
8/11/2019 Using molecular marker technology in studies on plant genetic diversity
http://slidepdf.com/reader/full/using-molecular-marker-technology-in-studies-on-plant-genetic-diversity 350/374
17
Copyright: IPGRI and Cornell University, 2003 Complementary technologies 17
! Several technologies help identify the presence
of sequence differences
! While they cannot tell what the variant is, theycan help narrow the range of strategies to use fordetecting it
In summary
8/11/2019 Using molecular marker technology in studies on plant genetic diversity
http://slidepdf.com/reader/full/using-molecular-marker-technology-in-studies-on-plant-genetic-diversity 351/374
18
Copyright: IPGRI and Cornell University, 2003 Complementary technologies 18
The basic principles of:
! Denaturing gradient gel electrophoresis
! Thermal gradient gel electrophoresis
! Single-stranded conformational polymorphism
! Heteroduplex analysis
! Denaturing high-performance liquidchromatography
By now you should know

8/11/2019 Using molecular marker technology in studies on plant genetic diversity
http://slidepdf.com/reader/full/using-molecular-marker-technology-in-studies-on-plant-genetic-diversity 352/374
19
Copyright: IPGRI and Cornell University, 2003 Complementary technologies 19
Next
Final considerations
! Glossary
8/11/2019 Using molecular marker technology in studies on plant genetic diversity
http://slidepdf.com/reader/full/using-molecular-marker-technology-in-studies-on-plant-genetic-diversity 353/374
Using molecular marker technologyin studies on plant geneticdiversity
VI Final considerations
j~áå ãÉåì
8/11/2019 Using molecular marker technology in studies on plant genetic diversity
http://slidepdf.com/reader/full/using-molecular-marker-technology-in-studies-on-plant-genetic-diversity 354/374
Using molecular marker technology instudies on plant genetic diversity
Final considerations
Copyright: IPGRI and Cornell University, 2003 Final considerations 1
8/11/2019 Using molecular marker technology in studies on plant genetic diversity
http://slidepdf.com/reader/full/using-molecular-marker-technology-in-studies-on-plant-genetic-diversity 355/374
Copyright: IPGRI and Cornell University, 2003 Final considerations 2
2
Contents
! When choosing a technique...
! Practical applications
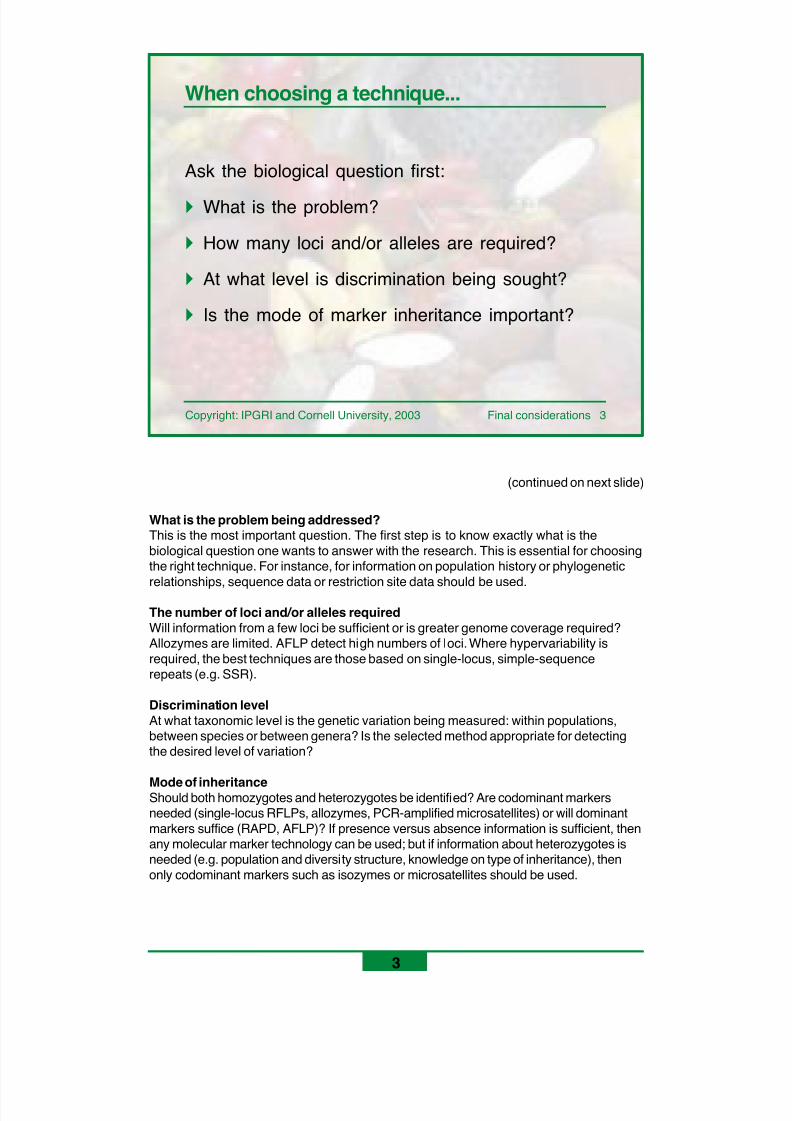
8/11/2019 Using molecular marker technology in studies on plant genetic diversity
http://slidepdf.com/reader/full/using-molecular-marker-technology-in-studies-on-plant-genetic-diversity 356/374
Copyright: IPGRI and Cornell University, 2003 Final considerations 3
3
Ask the biological question first:
! What is the problem?
! How many loci and/or alleles are required?
! At what level is discrimination being sought?
! Is the mode of marker inheritance important?
When choosing a technique...
What is the problem being addressed?This is the most important question. The first step is to know exactly what is thebiological question one wants to answer with the research. This is essential for choosingthe right technique. For instance, for information on population history or phylogeneticrelationships, sequence data or restriction site data should be used.
The number of loci and/or alleles requiredWill information from a few loci be sufficient or is greater genome coverage required?Allozymes are limited. AFLP detect high numbers of loci. Where hypervariability isrequired, the best techniques are those based on single-locus, simple-sequencerepeats (e.g. SSR).
Discrimination levelAt what taxonomic level is the genetic variation being measured: within populations,between species or between genera? Is the selected method appropriate for detectingthe desired level of variation?
Mode of inheritanceShould both homozygotes and heterozygotes be identified? Are codominant markersneeded (single-locus RFLPs, allozymes, PCR-amplified microsatellites) or will dominantmarkers suffice (RAPD, AFLP)? If presence versus absence information is sufficient, thenany molecular marker technology can be used; but if information about heterozygotes isneeded (e.g. population and diversity structure, knowledge on type of inheritance), thenonly codominant markers such as isozymes or microsatellites should be used.
(continued on next slide)
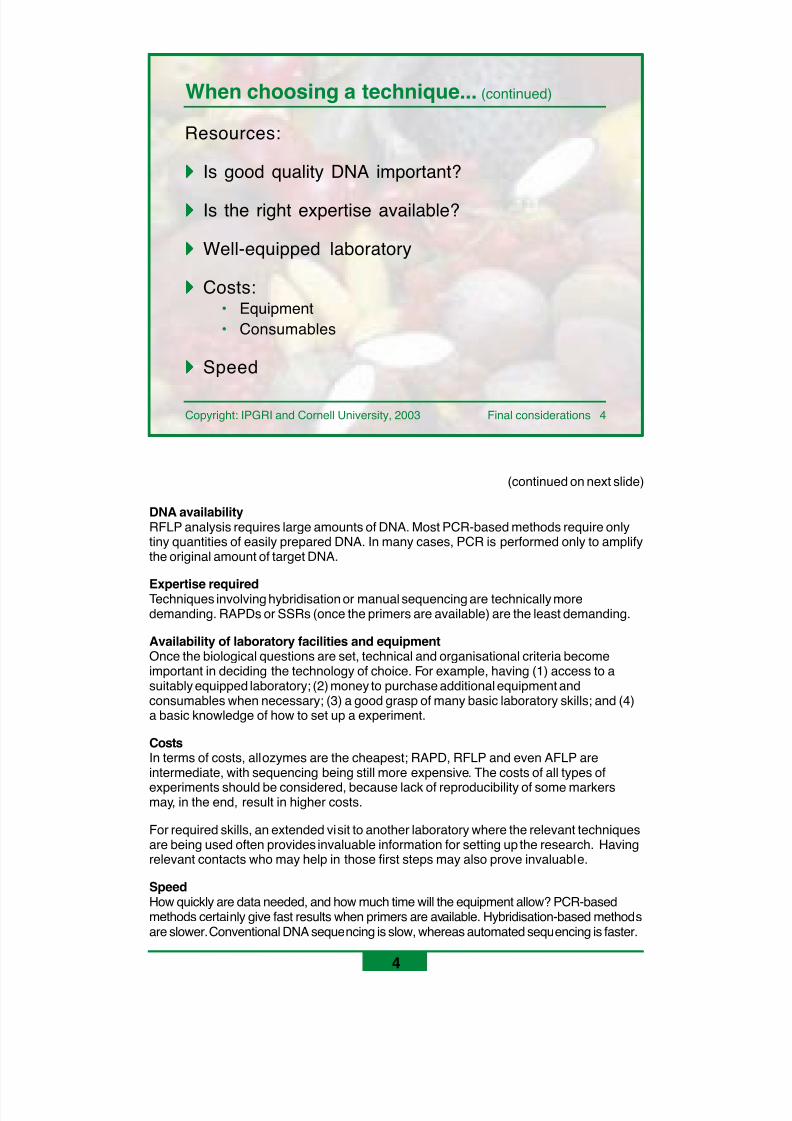
8/11/2019 Using molecular marker technology in studies on plant genetic diversity
http://slidepdf.com/reader/full/using-molecular-marker-technology-in-studies-on-plant-genetic-diversity 357/374
Copyright: IPGRI and Cornell University, 2003 Final considerations 4
4
Resources:
!!!!! Is good quality DNA important?
!!!!! Is the right expertise available?
!!!!! Well-equipped laboratory
!!!!! Costs:• Equipment• Consumables
!!!!! Speed
When choosing a technique... (continued)
DNA availabilityRFLP analysis requires large amounts of DNA. Most PCR-based methods require onlytiny quantities of easily prepared DNA. In many cases, PCR is performed only to amplifythe original amount of target DNA.
Expertise requiredTechniques involving hybridisation or manual sequencing are technically moredemanding. RAPDs or SSRs (once the primers are available) are the least demanding.
Availability of laboratory facilities and equipmentOnce the biological questions are set, technical and organisational criteria becomeimportant in deciding the technology of choice. For example, having (1) access to asuitably equipped laboratory; (2) money to purchase additional equipment andconsumables when necessary; (3) a good grasp of many basic laboratory skills; and (4)a basic knowledge of how to set up a experiment.
CostsIn terms of costs, allozymes are the cheapest; RAPD, RFLP and even AFLP areintermediate, with sequencing being still more expensive. The costs of all types ofexperiments should be considered, because lack of reproducibility of some markersmay, in the end, result in higher costs.
For required skills, an extended visit to another laboratory where the relevant techniquesare being used often provides invaluable information for setting up the research. Havingrelevant contacts who may help in those first steps may also prove invaluable.
SpeedHow quickly are data needed, and how much time will the equipment allow? PCR-basedmethods certainly give fast results when primers are available. Hybridisation-based methodsare slower. Conventional DNA sequencing is slow, whereas automated sequencing is faster.
(continued on next slide)
8/11/2019 Using molecular marker technology in studies on plant genetic diversity
http://slidepdf.com/reader/full/using-molecular-marker-technology-in-studies-on-plant-genetic-diversity 358/374
Copyright: IPGRI and Cornell University, 2003 Final considerations 5
5
When choosing a technique... (continued)
Additional matters:
!!!!! Reproducibility
!!!!! PCR versus non-PCR techniques
!!!!! Latest strategies
ReproducibilityAre robust methods required? For example, will the markers be exchanged? Is morethan one laboratory involved? If so, allozymes, RFLPs, SSRs and sequencing arerobust, whereas RAPD is not.
PCR versus non-PCR techniquesPCR-based molecular marker techniques open up numerous possibilities and could beconsidered first, because of their simplicity. Hybridisation-based techniques are morelabour intensive, more demanding technically and require different equipment.
• RAPD is an excellent technique by which to become familiar with PCR. It allowsrapid examination of polymorphisms in most, if not all, species of interest, andprimers are readily available.
• Other PCR-based markers such as SSR could be applied relatively easily, ifprimers are already available. More and more, this is the case for many species.Strategies for searching appropriate primers are also improving, and someapproaches for searching putative microsatellites rely on sequence databases,circumventing the problem of having to make and screen libraries in the laboratory.
• AFLPs have become a very popular option, although their need for a double PCRand vertical gel electrophoresis makes them more expensive and technicallymore demanding.
Latest strategiesCosts for sequencing experiments have significantly decreased. Many ESTs are alreadyavailable for several species. Microarrays, based on either anonymous genomiccharacterisation or gene expression, are becoming common. Microarray technology isstill very demanding, technically and in terms of equipment. Before deciding on it, getacquainted with the techniques, requirements and outputs. A better option might be toconsider outsourcing sample analysis and concentrate, instead, on interpreting resultsand the subsequent decision-making. SNPs are being routinely used in human studies.They are still too expensive for standard applications to genetic diversity studies inplants. Nevertheless, they look at the ultimate level of variation in the DNA sequencethe nucleotides, and may well be the future's best molecular marker option when theircosts of discovery and application decrease.
8/11/2019 Using molecular marker technology in studies on plant genetic diversity
http://slidepdf.com/reader/full/using-molecular-marker-technology-in-studies-on-plant-genetic-diversity 359/374
Copyright: IPGRI and Cornell University, 2003 Final considerations 6
6
Practical applications: genetic diversity studies
! Genetic relatedness and diversity: population
genetics
! Studying polymorphism in landraces and cultivars
! Identification of cultivars and taxonomy
! Phylogenetic studies
! Studying domestication and evolution
! Gene flow and introgression
! Comparative mapping
Some of the preceding submodules described real experiments where moleculartechniques were applied to answer questions on genetic diversity. Reference lists werealso given for the corresponding technology.
8/11/2019 Using molecular marker technology in studies on plant genetic diversity
http://slidepdf.com/reader/full/using-molecular-marker-technology-in-studies-on-plant-genetic-diversity 360/374
Copyright: IPGRI and Cornell University, 2003 Final considerations 7
7
Practical applications: germplasm management
! Taxonomic characterisation of germplasm
! Maintenance of collections:• Identifying gaps• Identifying duplicates• Development core collections• Assessing stability of conserved material• Measuring genetic erosion
! Development conservation strategies
Molecular markers may be used in genebank management to:
• Accurately identify germplasm• Screen germplasm for use by breeders and other researchers conduct routine
maintenance of the genebank, which will be streamlined by identifying duplicates,assessing stability through different rounds of regeneration or multiplication andmeasuring genetic erosion
• Identify gaps in the collection to plan for future conservation and collection activitiesand for developing core collections where other data will be complemented by ensuringthat the allelic richness of a core will be maximised.
Likewise, molecular data can be used to define conservation strategies, both ex situ
(e.g. collecting strategies) and in situ.
8/11/2019 Using molecular marker technology in studies on plant genetic diversity
http://slidepdf.com/reader/full/using-molecular-marker-technology-in-studies-on-plant-genetic-diversity 361/374
Copyright: IPGRI and Cornell University, 2003 Final considerations 8
8
Practical applications: germplasm use
! Gene mapping and identification
! Marker-assisted selection in plant breeding! Detecting somaclonal variation
! Evaluating germplasm for useful genes
! Pedigree analysis
! Hybrid identification
Molecular technologies may help promote germplasm use by providing exact data aboutthe genotypic attributes of plants, including crops. Germplasm characterisation offersinformation about individual genomic composition and, as such, allows breeders toselect promising material based on genotype, as well as on phenotype. The constructionof molecular linkage maps have opened up the possibility of locating importantagronomic traits in crop genomes and, consequently, of selecting germplasm based onthe presence of a particular gene of interest. Introgression of genes from 'donor'
germplasm can thus be followed in subsequent generations, using so-called marker-assisted selection, thus facilitating and accelerating traditional selection trials.
Molecular marker technologies are also used to detect somaclonal variation—which maybe useful for breeding—that sometimes occurs after regeneration through tissue culture.They can also help in the routine housekeeping activities of a breeding program, such askeeping track of progenies through pedigree analysis, identifying off-types in seed lotsand confirming or disproving hybrid purity.
The latest tools for molecular genetics will, hopefully, speed up breeding proceduresthrough such activities as permitting the quick discovery of useful genes in germplasmcollections or correlating genotype with phenotype.
8/11/2019 Using molecular marker technology in studies on plant genetic diversity
http://slidepdf.com/reader/full/using-molecular-marker-technology-in-studies-on-plant-genetic-diversity 362/374
Copyright: IPGRI and Cornell University, 2003 Final considerations 9
9
In summary
! The most important criteria for choosing a moleculartechnique for a genetic diversity study are:
• The biological question driving the study• The resources available versus those required
! Applications of molecular technologies cover allthe different aspects of genetic diversity analysis,germplasm management and germplasm use
8/11/2019 Using molecular marker technology in studies on plant genetic diversity
http://slidepdf.com/reader/full/using-molecular-marker-technology-in-studies-on-plant-genetic-diversity 363/374
Copyright: IPGRI and Cornell University, 2003 Final considerations 10
10
By now you should know
! The criteria that will help you succeed inselecting and applying molecular technologies
to the plant genetic resources of interest
8/11/2019 Using molecular marker technology in studies on plant genetic diversity
http://slidepdf.com/reader/full/using-molecular-marker-technology-in-studies-on-plant-genetic-diversity 364/374
Copyright: IPGRI and Cornell University, 2003 Final considerations 11
11
Next
Glossary
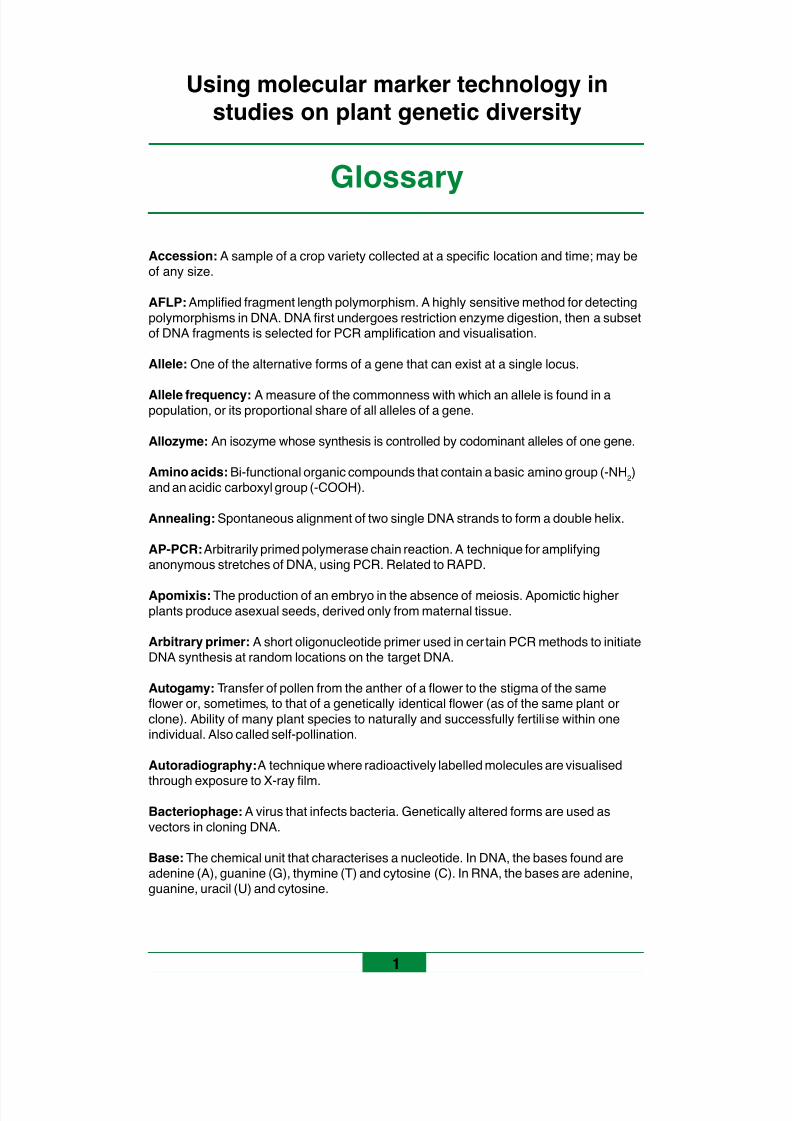
8/11/2019 Using molecular marker technology in studies on plant genetic diversity
http://slidepdf.com/reader/full/using-molecular-marker-technology-in-studies-on-plant-genetic-diversity 365/374
Glossary
1
Using molecular marker technology instudies on plant genetic diversity
Accession: A sample of a crop variety collected at a specific location and time; may beof any size.
AFLP: Amplified fragment length polymorphism. A highly sensitive method for detectingpolymorphisms in DNA. DNA first undergoes restriction enzyme digestion, then a subsetof DNA fragments is selected for PCR amplification and visualisation.
Allele: One of the alternative forms of a gene that can exist at a single locus.
Allele frequency: A measure of the commonness with which an allele is found in apopulation, or its proportional share of all alleles of a gene.
Allozyme: An isozyme whose synthesis is controlled by codominant alleles of one gene.
Amino acids: Bi-functional organic compounds that contain a basic amino group (-NH 2)and an acidic carboxyl group (-COOH).
Annealing: Spontaneous alignment of two single DNA strands to form a double helix.
AP-PCR: Arbitrarily primed polymerase chain reaction. A technique for amplifyinganonymous stretches of DNA, using PCR. Related to RAPD.
Apomixis: The production of an embryo in the absence of meiosis. Apomictic higherplants produce asexual seeds, derived only from maternal tissue.
Arbitrary primer: A short oligonucleotide primer used in cer tain PCR methods to initiateDNA synthesis at random locations on the target DNA.
Autogamy: Transfer of pollen from the anther of a flower to the stigma of the sameflower or, sometimes, to that of a genetically identical flower (as of the same plant orclone). Ability of many plant species to naturally and successfully fertilise within oneindividual. Also called self-pollination.
Autoradiography: A technique where radioactively labelled molecules are visualised
through exposure to X-ray film.
Bacteriophage: A virus that infects bacteria. Genetically altered forms are used asvectors in cloning DNA.
Base: The chemical unit that characterises a nucleotide. In DNA, the bases found areadenine (A), guanine (G), thymine (T) and cytosine (C). In RNA, the bases are adenine,guanine, uracil (U) and cytosine.
8/11/2019 Using molecular marker technology in studies on plant genetic diversity
http://slidepdf.com/reader/full/using-molecular-marker-technology-in-studies-on-plant-genetic-diversity 366/374
2
Base pair: Two nucleotide bases on different strands of a nucleic acid molecule that are heldtogether by hydrogen bonds. Bases can pair in only one way: adenine with thymine (DNA) oruracil (RNA), and guanine with cytosine (DNA). See also Complementary sequence
Base sequence: The order of nucleotide bases in DNA or RNA.
Bottleneck: A brief reduction in population size that usually leads to random genetic drift.
CAPS: Cleaved amplified polymorphic sequence, also known as PCR-RFLP, a technique fordetecting polymorphisms at a particular locus. A locus undergoes PCR amplification andpolymorphisms are detected by differences in restriction fragment sizes between individuals.
cDNA or complementary DNA: DNA transcribed from an RNA molecule by an enzymecalled reverse transcriptase.
Centromere: The constricted region of a chromosome to which spindle fibres attachduring cell division.
Character: Or trait, an attribute of individuals within a species for which various heritabledifferences can be defined.
Chromatin: Complex of DNA and protein of the interphase cell.
Chromosome: A linearly continuous arrangement of genes and other DNA, andassociated proteins and RNA.
Cloning: In molecular biology: the process of using DNA manipulation procedures toproduce multiple copies of a single gene or DNA segment.
Codominance: The situation in which a heterozygous individual exhibits the phenotypesof both alleles of a particular gene.
Complementary sequence: The sequence of a DNA or RNA strand to which a givennucleotide sequence can bond to form a double-stranded structure, e.g. TAGGAT is the
complementary sequence to ATCCTA where A = adenine, C = cytosine, G = guanineand T = thymine. See also Base pair.
cpDNA: Chloroplast DNA.
Cytoplasmic inheritance: Inheritance of the genes found in cytoplasmic organelles(viz. chloroplasts or mitochondria).
DAF: DNA amplification fingerprinting. A technique for amplifying anonymous stretchesof DNA, using PCR. Related to RAPD.
DArT: Diversity array technology.
Deletion: A particular kind of mutation involving the loss of some DNA from a chromosome.
Dendrogram: Any branching diagram that shows, by means of lines shaped like U's ahierarchy of categories or objects based on the degree of similarity or number of sharedcharacters. Often, the length of each U represents the distance between the two objectsbeing connected.
Denaturation: The separation of the two strands of the DNA double helix, or the severedisruption of a complex molecule without breaking the major bonds of its chains.
8/11/2019 Using molecular marker technology in studies on plant genetic diversity
http://slidepdf.com/reader/full/using-molecular-marker-technology-in-studies-on-plant-genetic-diversity 367/374
3
DGGE: Denaturing gradient gel electrophoresis. A method for separating DNA fragmentsaccording to their mobility under increasingly denaturing conditions (usually increasingformamide/urea concentrations). See also heteroduplex analysis, SSCP and TGGE.
DHPLC: Denaturing high-performance liquid chromatography. This method can detectsequence variations of a single base pair.
DNA: Deoxyribonucleic acid, a double chain of linked nucleotides (having deoxyribose asthe sugar component), which is the fundamental molecule of which genes are composed.
DNA fingerprint: A unique pattern of DNA fragments as revealed by Southernhybridisation or by PCR.
DNA polymerase: Any enzyme with the ability to synthesise new DNA strands, using aDNA template.
DNA sequence: The order of nucleotide bases in the DNA molecule.
Dominant allele: An allele that expresses its phenotypic effect even whenheterozygous with a recessive allele ( qv. ). That is, if A is dominant over a, then AA andAa have the same phenotype.
Double helix: The structure of DNA first proposed by Watson and Crick, with two linkedhelices joined by hydrogen bonds between paired bases.
Ecotype: A population or strain of an organism that is adapted to a particular habitat.
Electrophoresis: A technique for separating the components of a mixture of molecules(proteins, DNA or RNA) by size as a result of an electric field within a support gel.
Enzyme: A protein that functions as a catalyst of biochemical reactions.
EST: Expressed sequence tag. A small part of the active part of a gene, made fromcDNA. It can be used as a marker, to search the rest of the gene or to locate it in a
larger segment of DNA.
Eukaryote: A cell or organism with a distinct, membrane-bound nucleus and otherdifferentiated subcellular components.
ex situ conservation: (1) A conservation method that entails the removal of germplasmresources (seed, pollen, sperm, individual organisms) from their original habitat ornatural environment. (2) Keeping components of biodiversity alive outside their originalhabitat or natural environment. Cf. in situ conservation.
F1, F 2, F 3, … : A shorthand notation used to denote the different generations involved inbreeding experiments. F 1 is the first filial generation, that is, the progeny of the parentalcross; F 2 is the second filial generation, that is, the progeny of self-fertilising or
intercrossing F 1 individuals, and so on.
Flanking regions: The DNA sequences extending on either side of a specific gene or locus.
Gene: The basic physical and functional unit of heredity, which passes information fromone generation to the next. It is a segment of DNA that includes a transcribed sectionand a regulatory element that allows its transcription.
Genebank: A facility established for the ex situ conservation of individuals (seeds),tissues, or reproductive cells of plants or animals.
8/11/2019 Using molecular marker technology in studies on plant genetic diversity
http://slidepdf.com/reader/full/using-molecular-marker-technology-in-studies-on-plant-genetic-diversity 368/374
4
Gene flow: The exchange of genes between different but (usually) related populations.
Gene mapping: The determination of the relative positions of genes on a chromosomeor plasmid and the distance between them.
Genepool: The sum total of genes, with all their variations, possessed by a particularspecies at a particular time.
Genetic drift: Change in allele frequency from one generation to another within apopulation, due to the sampling of finite numbers of genes that is inevitable in all finite-sized populations. The smaller the population, the greater is the genetic drift, with theresult that some alleles are lost, and genetic diversity is reduced.
Genetic linkage: The proximity of two or more genes on a chromosome so that theytend to be inherited together.
Genetic marker: An allele, a band in a gel or trait that serves experimentally as a probeto identify an individual or one of its characteristics.
Genetic resources: The genes found in plants and animals that are of actual or potentialvalue to people.
Genome: The entire complement of genetic material in an organism.
Genotype: The specific allele composition of either of the entire cell or, more commonly,of a certain gene or set of genes.
Germplasm: The total genetic variability available to a population of organisms asrepresented by germ cells, seeds, etc.
Haplotype: A specific allelic constitution at a number of loci within a defined linkage block.
Heredity: The process by which genetic traits are passed from parents to offspring.
Heteroduplex: A double-stranded DNA molecule or a DNA/RNA hybrid where eachstrand is from a different source.
Heteroduplex analysis: The study of the mobility of heteroduplex DNA underpolyacrylamide gel electrophoresis. The reduced mobility of heteroduplex DNA comparedwith homoduplex DNA is proportional to the degree of divergence of the sequences. See also DGGE, SSCP and TGGE.
Heterozygous gene pair: A gene pair having two different alleles in the twochromosome sets of a diploid individual, for example, A a or A 1 A 2.
Homoduplex DNA: A double-stranded DNA molecule where both strands are from thesame source.
Homologous: Corresponding or alike in structure, position or origin.
Homozygous gene pair: A gene pair having identical alleles in both copies of thechromosome set, for example, AA or aa.
Hybrid: Either (1) a heterozygous individual, or (2) a progeny individual from a crossbetween parents with different genotypes.
8/11/2019 Using molecular marker technology in studies on plant genetic diversity
http://slidepdf.com/reader/full/using-molecular-marker-technology-in-studies-on-plant-genetic-diversity 369/374
5
Hybridisation: In molecular biology: the binding of complementary DNA and/or RNAsequences to form a double-stranded structure.
Insertion: A type of chromosomal abnormality in which a DNA sequence is inserted intoa gene, disrupting the normal structure and function of that gene.
in situ conservation: A conservation method that attempts to preserve the geneticintegrity of gene resources by conserving them within the evolutionary dynamicecosystems of the original habitat or natural environment. Cf. ex situ conservation
Isozyme: Multiple forms of an enzyme whose synthesis is controlled by more thanone gene.
ISSR: Inter-simple sequence repeat. ISSR primers are anchored at their 3' ends to directthe amplification of the genomic segments between the ISSRs.
Landrace: A crop cultivar or animal breed that has evolved with and has been geneticallyimproved by traditional farmers without influence from modern breeding practices.
Library: A collection of DNA clones obtained from one DNA donor.
Ligase: A type of enzyme that can rejoin a broken phosphodiester bond in a nucleic acid.
Ligation: The process of joining two or more DNA fragments together.
Locus ( pl. loci): The specific place on a chromosome where a gene or particular pieceof DNA is located.
MAAP: Multiple arbitrary amplicon profiling. A collective term for PCR techniques usingarbitrary primers.
Marker: An identifiable physical location on a chromosome whose inheritance can bemonitored (e.g. gene, restriction enzyme site or RFLP marker).
Melting temperature (Tm): Midpoint of the temperature range over which DNA isdenaturated.
Microarray: Small spots of DNA fixed to glass slides or nylon membranes. Thistechnology is based on the hybridisation between short oligonucleotide probes andcomplementary DNA sequences.
Microsatellite DNA: A type of repetitive DNA based on very short repeats such asdinucleotides, trinucleotides or tetranucleotides. See also Repetitive DNA.
Minisatellite DNA: A type of repetitive DNA sequence based on short repeats with aunique common core. See also Repetitive DNA.
mtDNA: Mitochondrial DNA.
Multiplexing: Simultaneously performing several different reactions in the samereaction tube to increase efficiency.
Mutation: A permanent structural alteration in DNA. In most cases, DNA changes eitherhave no effect or cause harm, but occasionally a mutation can improve an organism'schance of surviving and passing on the beneficial change to its descendants.
8/11/2019 Using molecular marker technology in studies on plant genetic diversity
http://slidepdf.com/reader/full/using-molecular-marker-technology-in-studies-on-plant-genetic-diversity 370/374
6
Nitrogen bases: Molecules that are important components of nucleic acids, composedof nitrogen-containing ring structures. Hydrogen bonds between bases link the twostrands of the DNA double helix.
Nuclease: An enzyme that cleaves phosphodiester bonds, which link adjacent nucleotidesin DNA and/or RNA. An exonuclease progressively cleaves from the end of the substratemolecule; an endonuclease cleaves at internal sites within the substrate molecule.
Nucleotide: A molecule composed of a nitrogen base, a sugar and a phosphate group.Nucleotides are the building blocks of nucleic acids.
Oligonucleotide: A short segment of DNA that is synthesised artificially.
Pedigree: A simplified diagram of a family's genealogy that shows family members'relationships to each other and how a particular trait or disease has been inherited.
PCR: Polymerase chain reaction. A method for amplifying a DNA sequence in largeamounts, using a heat-stable polymerase and suitable primers to direct the amplificationof the desired region of DNA.
PCR-RFLP: Alternative name for the technique known as 'cleaved amplified polymorphicsequence' or CAPS qv.
Peptide: Two or more amino acids joined by a peptide bond.
Phenotype: Either (1) the form taken by a trait (or group of traits) in a particularindividual; or (2) the detectable external appearance of a specific genotype.
Plasmid: An extra chromosome molecule of DNA that is able to replicate autonomously.
Point mutation: A change in a single base pair of DNA.
Polymer: A molecule having repeated subunits.
Polymerase: General term for enzymes that carry out the synthesis of nucleic acid, usinga pre-existing nucleic acid template and appropriate nucleotides (viz. ribonucleotides forRNA and deoxyribonucleotides for DNA).
Polymorphism: The appearance of different forms associated with various alleles ofone gene or homologous of one chromosome.
Polypeptide: A protein, which is a chain of linked amino acids.
Primer: A short DNA or RNA fragment annealed to a singled-stranded DNA and to whichfurther nucleotides can be added by DNA polymerase.
Probe: A finite nucleic acid piece that can be used to identify specific DNA segments
bearing its complementary sequence.
Protein: A polymer of amino acids joined by peptide bonds and which may comprise twoor more polypeptide chains.
RAPD: Random amplified polymorphic DNA. A technique for amplifying anonymousstretches of DNA, using PCR with arbitrary primers.
8/11/2019 Using molecular marker technology in studies on plant genetic diversity
http://slidepdf.com/reader/full/using-molecular-marker-technology-in-studies-on-plant-genetic-diversity 371/374
7
Recessive allele: An allele whose phenotypic effect is not expressed in theheterozygous state, but is masked by the dominant allele ( qv. ).
Recombination: Also known as crossing over. The production of a DNA molecule withsegments derived from more than one parental DNA molecule. In eukaryotes, this isachieved by the reciprocal exchange of DNA between non-sister chromatids within ahomologous pair of chromosomes during prophase of the first meiotic division.Recombination allows the chromosomes to rearrange their genetic material, therebyincreasing the potential of genetic diversity.
Repetitive DNA: A stretch of DNA consisting of multiple repeats of a motif. See also Microsatellite DNA, Minisatellite DNA and Satellite DNA.
Restriction enzyme: An endonuclease that will recognise a specific target sequenceand cut the DNA chain at that point.
Restriction fragment: A DNA fragment that has been cut by a restriction enzyme.
Restriction site: The specific nucleotide sequence of DNA at which a particularrestriction enzyme cuts the DNA.
Reverse transcriptase: An enzyme, requiring a DNA primer, that catalyses thesynthesis of a complementary DNA strand from an RNA template.
RFLP: Restriction fragment length polymorphism. Variation between individuals asdetected by differences in DNA fragment sizes after restriction digestion.
RNA: An organic acid containing repeating nucleotide units of adenine (A), guanine (G),cytosine (C) and uracil (U), whose ribose components are linked with phosphodiester bonds.
Satellite DNA: Very high repetition (1000 to more than 100,000 copies) of a basic motifor repeat unit (commonly 100 to 300 base pairs) that occurs at a few loci on the genome.See also Repetitive DNA.
SCAR: Sequence characterized amplified region. A SCAR is a locus representing asingle RAPD fragment that has been sequenced. Primers specific to the locus can bedesigned and used in PCR amplification.
Segregation: Genetically, it refers to the production of two separate phenotypescorresponding to the two alleles of a gene.
Sequencing: The determination of the order of nucleotides in a DNA or RNA molecule,or of the order of amino acids in a protein.
SNP: Single nucleotide polymorphism. Polymorphisms resulting from single-basesubstitutions between homologous sequences.
Somaclonal variation: Variation found in vegetative cells dividing mitotically in culture.
Southern blotting: A procedure in which DNA fragments, separated by electrophoresis,are transferred to membrane filters for detecting specific base sequences byradiolabelled complementary probes. Also known as Southern hybridisation.
SSCP: Single-stranded conformational polymorphism. A method for distinguishing betweensimilar sized DNA fragments according to the mobility of the single-stranded DNA underpolyacrylamide gel electrophoresis. See also DGGE, heteroduplex analysis, and TGGE.
8/11/2019 Using molecular marker technology in studies on plant genetic diversity
http://slidepdf.com/reader/full/using-molecular-marker-technology-in-studies-on-plant-genetic-diversity 372/374
8
SSR: Simple-sequence repeats. See Microsatellite DNA.
SSRP: Simple-sequence repeat polymorphism. See Microsatellite DNA.
STMS: Sequence-tagged microsatellite sites. Primers constructed from the flankingregions of microsatellite DNA, and which can be used in PCR reactions to amplify therepeat region.
Structural gene: Any gene that codes for a protein.
STS: Sequence-tagged site. A general term given to a marker that is defined by itsprimer's exact location and order of bases.
Synteny: Said to occur where all loci are positioned on the same chromosome. Loci maynot appear to be linked by conventional genetic tests for linkage but can still be syntenic.
Tandem repeat: Multiple copies of the same base sequence on a chromosome.
Telomeres: The distal ends of each chromosomal arm, involved in the replication andstability of linear DNA molecules.
Template: A molecule that serves as the pattern for synthesising another molecule, e.g.a single-stranded DNA molecule can be used as a template to synthesise thecomplementary nucleotide strand.
TGGE: Thermal gel gradient electrophoresis. A method for separating DNA fragmentsaccording to their mobility under increasingly hot denaturing conditions. See also DGGE,heteroduplex analysis and SSCP.
Transcription: The synthesis of complementary RNA, using a DNA template.
Transposable element: A genetic element that has the ability to move from one site ona chromosome to another. Some resemble, and many originate from, retroviruses.
Vector: The agent (e.g. plasmid or virus) used to carry a cloned DNA segment.
VNTR: Variable number of tandem repeat. A class of polymorphism characterised by thehighly variable copy number of identical or closely related sequences.
Wild type: The type or form of an organism or gene that occurs most frequently innature. Often refers to how organisms or genes are found naturally, that is, in the wild,before researchers induced mutations.
8/11/2019 Using molecular marker technology in studies on plant genetic diversity
http://slidepdf.com/reader/full/using-molecular-marker-technology-in-studies-on-plant-genetic-diversity 373/374
1
Feedback form
The subject of this module is continuously changing, making periodical updatingdesirable. For this reason we offer the module in electronic format. To help us with thetask of updating, we would appreciate receiving relevant comments and requests fromusers to fur ther improve the module. Your comments on this tool’s usefulness will alsobe very helpful.
Below we have asked a few guiding questions for you to answer. You may send youranswers to us by fax (no.: 57-2 445 0096), by post to your contact in IPGRI or bye-mail to either [email protected] or [email protected]
Questions:
1. Tell us how you use this tool…
2. Do you think the module:
a. Provides an overview of the basic scientific concepts underlying molecularmarker and DNA sequence technologies and their use in plant geneticresources?
YesNoWhy?
b. Gives information on how to compare and contrast the advantages anddisadvantages of each technology so that the most relevant decisions to aspecific research situation are made?
YesNoWhy?
c. Makes available a list of current bibliographical resources for each of thetechnologies discussed?
YesNoWhy?
8/11/2019 Using molecular marker technology in studies on plant genetic diversity
http://slidepdf.com/reader/full/using-molecular-marker-technology-in-studies-on-plant-genetic-diversity 374/374
3. Tell us what you liked and what you would change about the following:
a. Contents
b. Spectrum of technologies offered
c. Criteria to select techniques
d. Structure within the submodules
e. Drawings, diagrams, pictures
f. Other
4. What would you add to the module to make it more useful in your particular situation?
a. Basic references
b. Examples of applications
c. Additional information on basic concepts
d. More technologies:
i. Old
ii. New
5. What other topics would you like to see in this module?
6. Was the module, or parts of it, difficult to download? Why?
Send