Embed Size (px)
Citation preview
Using molecular marker technology instudies on plant genetic diversity
DNA-based technologiesRestriction fragment length
polymorphisms
Copyright: IPGRI and Cornell University, 2003 RFLPs 1

2
Copyright: IPGRI and Cornell University, 2003 RFLPs 2
Contents
! RFLP technology• Isolating DNA• Restriction digestion and gel electrophoresis• DNA transfer by Southern blotting• DNA hybridisation• Equipment
! RFLP technology in pictures! Interpreting RFLP bands! Advantages and disadvantages of RFLPs! Applications
• Maize• Wheat• Scots pine
3
Copyright: IPGRI and Cornell University, 2003 RFLPs 3
RFLP detection relies on the possibility ofcomparing band profiles generated afterrestriction enzyme digestion of target DNA.The laboratory steps involved are as follows:
! Isolation of DNA! Restriction digestion and gel electrophoresis! DNA transfer by Southern blotting! DNA hybridisation
• The procedure• The DNA probe• Sources of probes
! Equipment
RFLP technology
Restriction fragment length polymorphism (RFLP) analysis was one of the firsttechniques to be widely used for detecting variation at the DNA sequence level. Theprinciple behind the technology rests on the possibility of comparing band profilesgenerated after restriction enzyme digestion in DNA molecules of different individuals.Diverse mutations that might have occurred affect DNA molecules in different ways,producing fragments of variable lengths. These differences in fragment lengths can beseen after gel electrophoresis, hybridisation and visualisation.
4
Copyright: IPGRI and Cornell University, 2003 RFLPs 4
Isolating DNA
!!!!! Total DNA is extracted from plant cells
!!!!! Alternatively, chloroplast and mitochondrialDNA can be used
!!!!! DNA must be clean and of high molecular weight
!!!!! Complications:• Breakage during isolation• DNA degraded by nucleases• Joint isolation of polysaccharides• Isolation of secondary plant metabolites
Isolating DNA is the first step for many DNA-based technologies. DNA is found either innuclear chromosomes or in organelles (mitochondria and chloroplasts). To extract DNAfrom its location, several laboratory procedures are needed to break the cell wall andnuclear membrane, and so appropriately separate the DNA from other cell components.When doing so, care must be taken to ensure the process does not damage the DNAmolecule and that it is recovered in the form of a long thread.

5
Copyright: IPGRI and Cornell University, 2003 RFLPs 5
Restriction digestion and gel electrophoresis
Extracted DNA is digested with specific, carefully chosen, restriction enzymes. Eachrestriction enzyme, under appropriate conditions, will recognise and cut DNA in apredictable way, resulting in a reproducible set of DNA fragments (‘restriction fragments’)of different lengths.
The millions of restriction fragments produced are commonly separated byelectrophoresis on agarose gels. Because the fragments would be seen as a continuous‘smear’ if stained with ethidium bromide, staining alone cannot detect thepolymorphisms. Hybridisation must therefore be used to detect specific fragments.
+ -
-
+
Hybridisation is needed todetect specific fragments
6
Copyright: IPGRI and Cornell University, 2003 RFLPs 6
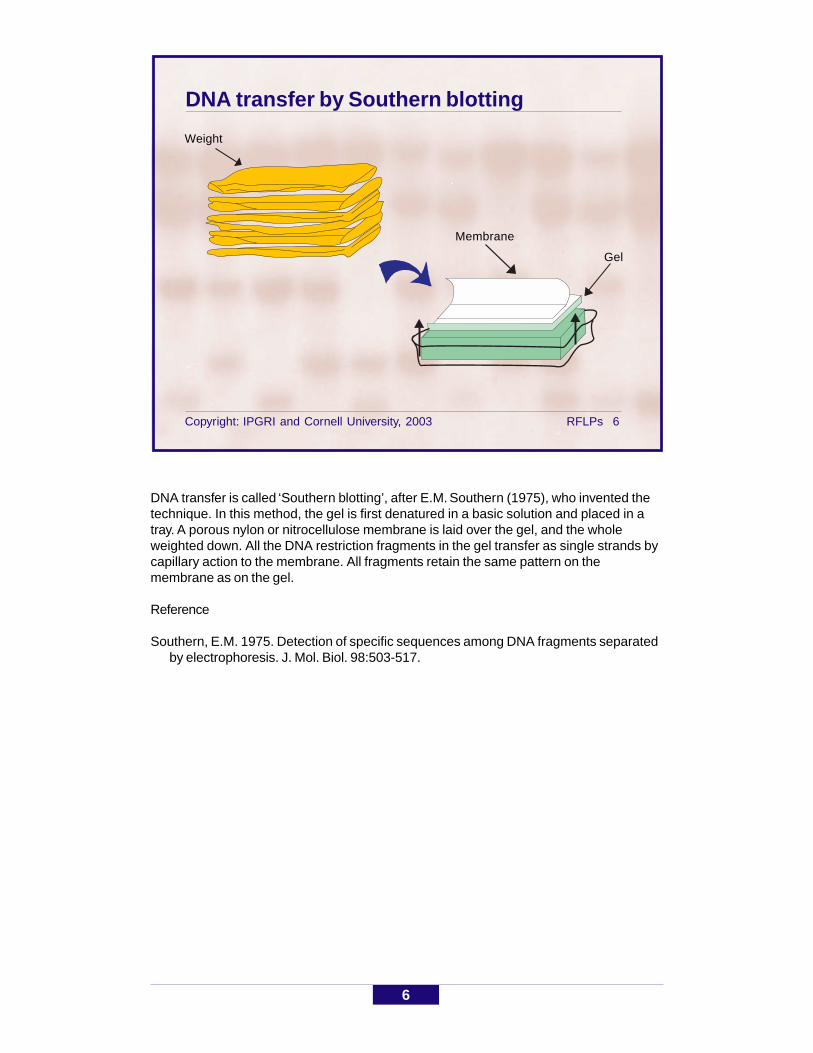
DNA transfer by Southern blotting
DNA transfer is called ‘Southern blotting’, after E.M. Southern (1975), who invented thetechnique. In this method, the gel is first denatured in a basic solution and placed in atray. A porous nylon or nitrocellulose membrane is laid over the gel, and the wholeweighted down. All the DNA restriction fragments in the gel transfer as single strands bycapillary action to the membrane. All fragments retain the same pattern on themembrane as on the gel.
Reference
Southern, E.M. 1975. Detection of specific sequences among DNA fragments separatedby electrophoresis. J. Mol. Biol. 98:503-517.
Weight
Membrane
Gel

7
Copyright: IPGRI and Cornell University, 2003 RFLPs 7
DNA hybridisation: The procedure
The membrane with the target DNA is incubated with the DNA probe. Incubationconditions are such that if strands on the membrane are complementary to those of theprobe, hybridisation will occur and labelled duplexes formed. Where conditions are highlystringent, hybridisation with distantly related or non-homologous DNA does not happen.Thus, the DNA probe picks up sequences that are complementary and 'ideally'homologous to itself among the thousands or millions of undetected fragments thatmigrate through the gel.
Desired fragments may be detected after simultaneous exposure of the hybridisedmembrane and a photographic film.
Hybridisedwith probe
DNA bound to membrane
Extra probewashed away
Probehybridised
Exposed toX-ray film
Adapted from Griffiths et al. 1996
8
Copyright: IPGRI and Cornell University, 2003 RFLPs 8
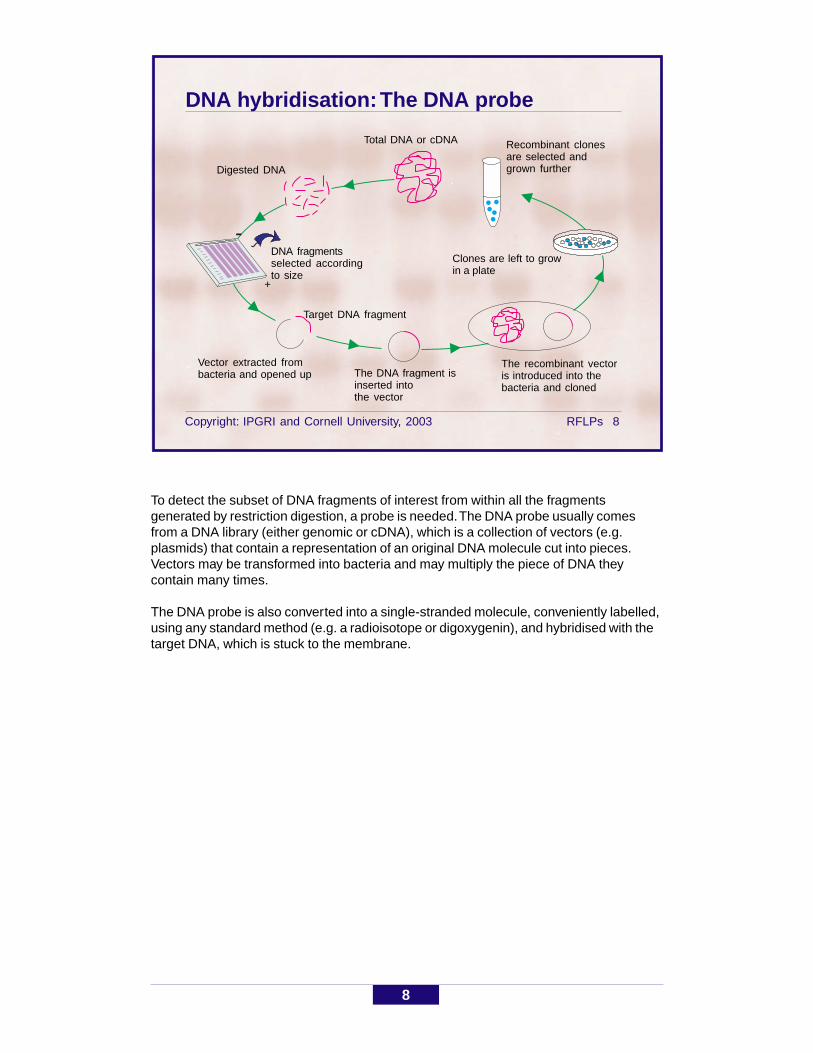
DNA hybridisation: The DNA probe
To detect the subset of DNA fragments of interest from within all the fragmentsgenerated by restriction digestion, a probe is needed. The DNA probe usually comesfrom a DNA library (either genomic or cDNA), which is a collection of vectors (e.g.plasmids) that contain a representation of an original DNA molecule cut into pieces.Vectors may be transformed into bacteria and may multiply the piece of DNA theycontain many times.
The DNA probe is also converted into a single-stranded molecule, conveniently labelled,using any standard method (e.g. a radioisotope or digoxygenin), and hybridised with thetarget DNA, which is stuck to the membrane.
{-
+
Total DNA or cDNA Recombinant clonesare selected andgrown further
Clones are left to growin a plate
The recombinant vectoris introduced into thebacteria and cloned
The DNA fragment isinserted intothe vector
Vector extracted frombacteria and opened up
Target DNA fragment
DNA fragmentsselected accordingto size
Digested DNA
9
Copyright: IPGRI and Cornell University, 2003 RFLPs 9
DNA hybridisation: Sources of probes (1)
! Nuclear DNA:• Genomic libraries• cDNA
! Cytoplasmic DNA
! The species specificity of many single-locusprobes requires that libraries be built whenstudying new species. However, probes fromrelated genera can often be used
Sources of DNA probes include:
• Genomic libraries—total plant DNA is digested with restriction enzymes andindividual fragments cloned into a bacterial or viral vector. Suitable probes areselected from this 'anonymous' library for RFLP analysis.
• cDNA (complementary DNA) libraries—mRNA is isolated and transcribed intoDNA, using the enzyme reverse transcriptase. The cDNA so obtained is clonedinto vectors and used as a library for probes in RFLP analysis.
• Cytoplasmic DNA—mitochondrial and chloroplast DNA libraries.
As a result of the species specificity shown by many single-locus probes, genomic orcDNA libraries must often be built for studies on new species. This can be very timeconsuming. However, given current knowledge about common sequences and genes,probes from related genera can often be used.
10
Copyright: IPGRI and Cornell University, 2003 RFLPs 10
DNA hybridisation: Sources of probes (2)
Repetitive sequences or minisatellite-type:
• Basic ‘motif’ of 10 to 60 bp in tandem• Highly variable between human individuals• Polymorphisms in the number of repeated
units (also called VNTRs)
In plants, probes from an internal repeat from theprotein III gene of the bacteriophage M13 havebeen used to reveal minisatellite sequences
Repetitive sequences of the minisatellite type also have their particular application inRFLP analysis. They are the repeat sequences of a basic 'motif'. They measure 10 to60 bp, are found in tandem (i.e. head to tail) and occur at many loci on the genome.
Work on plant minisatellite markers resulted from pioneering studies on the humangenome by Jeffreys et al. (1985a, b), which showed minisatellite markers to be highlyvariable in humans. Because polymorphisms are related to the number of repeated units,the sequences are also called variable number of tandem repeats (VNTRs; Nakamura etal. 1987). A carefully selected probe can detect restriction fragments that represent alarge number of loci. The patterns of minisatellite-bearing restriction fragments on film(the so-called 'DNA fingerprint') allow clear discrimination between different individuals.
References
Jeffreys, A.J., V. Wilson and S.L. Thein.1985a. Hypervariable 'minisatellite' regions inhuman DNA. Nature 314:67-73.
Jeffreys, A.J., V. Wilson and S.L.Thein.1985b. Individual-specific "fingerprints" of humanDNA. Nature 316:76-79.
Nakamura, Y., M. Leppert, P. O'Connell, R. Wolff, T. Holm, M. Culver, C. Martin, E.Fujimoto, M. Hoff, E. Kumlin and R. White. 1987. Variable Number of Tandem Repeat(VNTR) markers for human gene mapping. Science 235:1616-1622.
Rogstad, S.H., J.C. Patton, II and B.A. Schaal. 1988. M13 repeat probe detects DNAminisatellite-like sequences in gymnosperms and angiosperms. Proc. Natl Acad. Sci.U.S.A. 85:9176-9178.
Ryskov, A.P., A.G. Jincharadze, M.I. Prosnyak, P.L. Ivanov and S.A. Limborska. 1988.M13 phage DNA as a universal marker for DNA fingerprinting of animals, plants andmicroorganisms. FEBS Lett. 233:388-392.

11
Copyright: IPGRI and Cornell University, 2003 RFLPs 11
Equipment
! Resources:• Distilled and/or deionised water• Reagents
! Equipment:• Refrigerator and freezer
• Laminar flow hood
• Centrifuge
• Power supply units
• Hotplate or microwave
• pH meter
• Standard balance
• Gel electrophoresis units
• Dark room
• UV transilluminator
12
Copyright: IPGRI and Cornell University, 2003 RFLPs 12
RFLP technology in pictures
The following slides illustrate the procedures ofthe RFLP technique

Copyright: IPGRI and Cornell University, 2003 RFLPs 13
13
After agarose has been poured into the gel mould, combs are immediately inserted toform wells and left until the gel hardens. The combs are then removed and the gelplaced in an electrophoresis chamber.

Copyright: IPGRI and Cornell University, 2003 RFLPs 14
14
Samples of digested DNA, with bromophenol blue dye added, are loaded into the wellswith a pipettor.

Copyright: IPGRI and Cornell University, 2003 RFLPs 15
15
After electrophoresis, the gel is treated with NaCl to break the DNA double helix bonds andmake it single-stranded. This allows later hybridisation with a single-stranded DNA probe.

Copyright: IPGRI and Cornell University, 2003 RFLPs 16
16
The blotting tray is first prepared by saturating sponges with NaOH. Safety glasses andgloves are required, and a laboratory coat recommended. The safety regulations of theparticipating institution should be followed.
Copyright: IPGRI and Cornell University, 2003 RFLPs 17
17
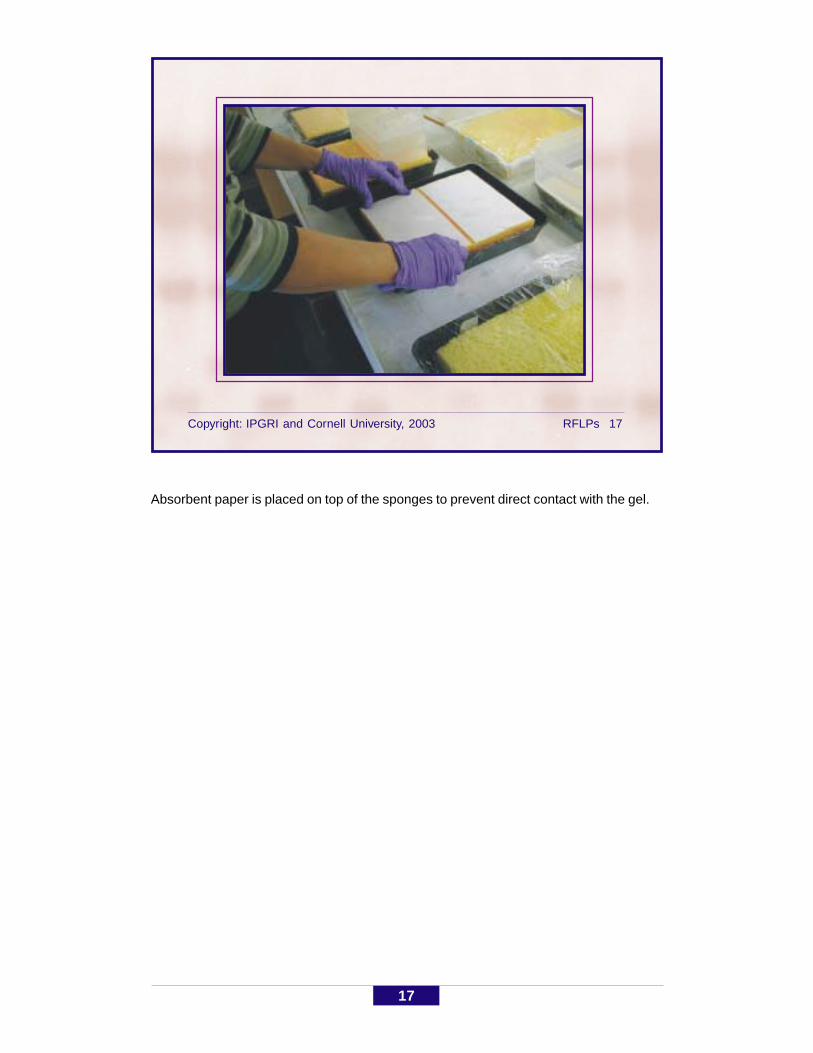
Absorbent paper is placed on top of the sponges to prevent direct contact with the gel.
Copyright: IPGRI and Cornell University, 2003 RFLPs 18
18
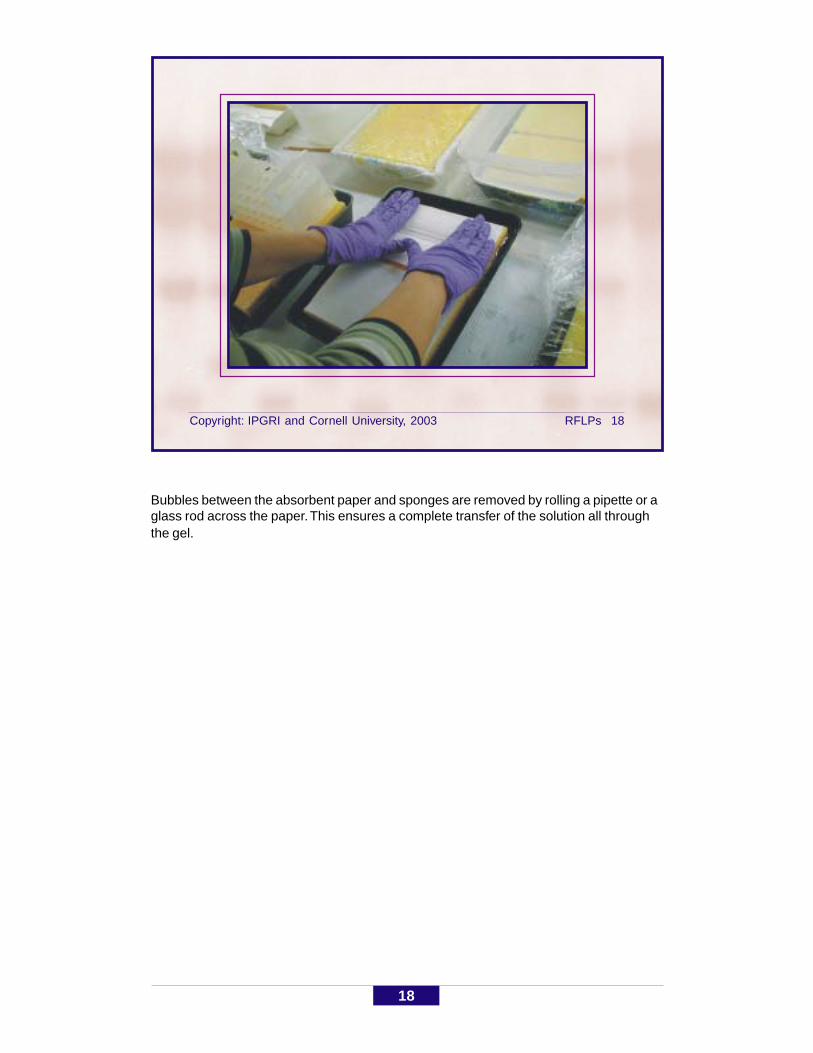
Bubbles between the absorbent paper and sponges are removed by rolling a pipette or aglass rod across the paper. This ensures a complete transfer of the solution all throughthe gel.

Copyright: IPGRI and Cornell University, 2003 RFLPs 19
19
The gaps left between the sponges and tray are covered with strips of plastic sheets toprevent evaporation, which would reduce the efficiency of transfer.
Copyright: IPGRI and Cornell University, 2003 RFLPs 20
20
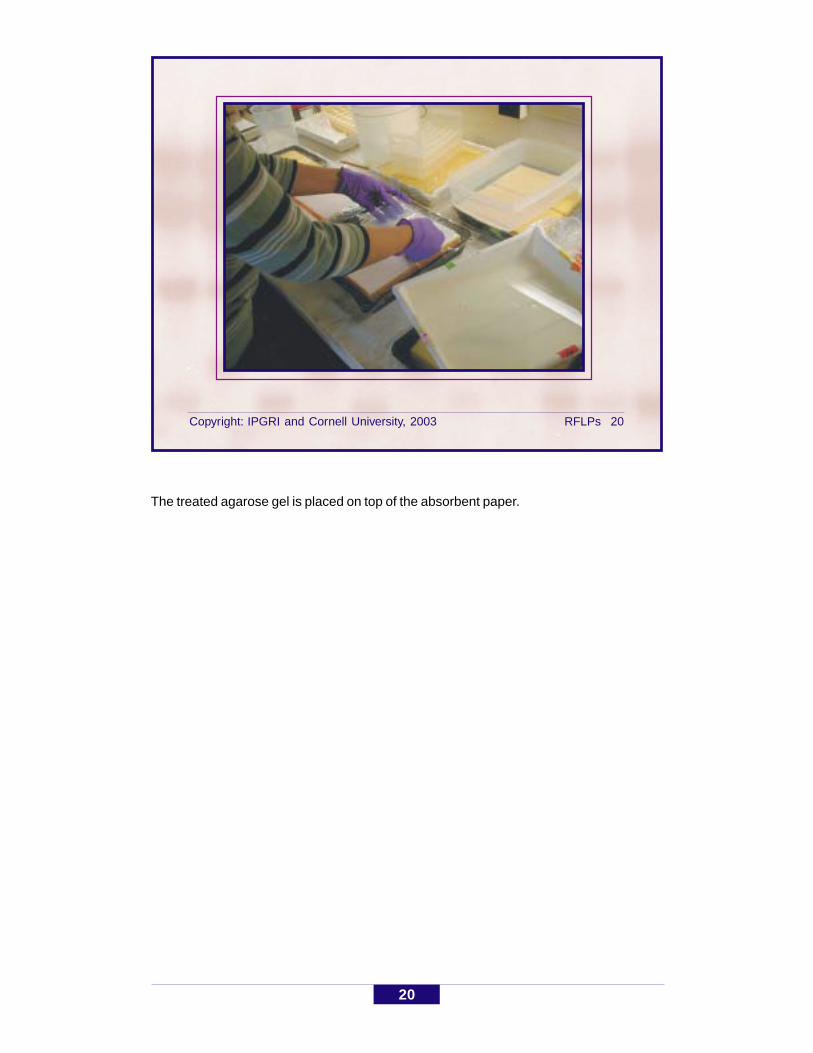
The treated agarose gel is placed on top of the absorbent paper.
Copyright: IPGRI and Cornell University, 2003 RFLPs 21
21
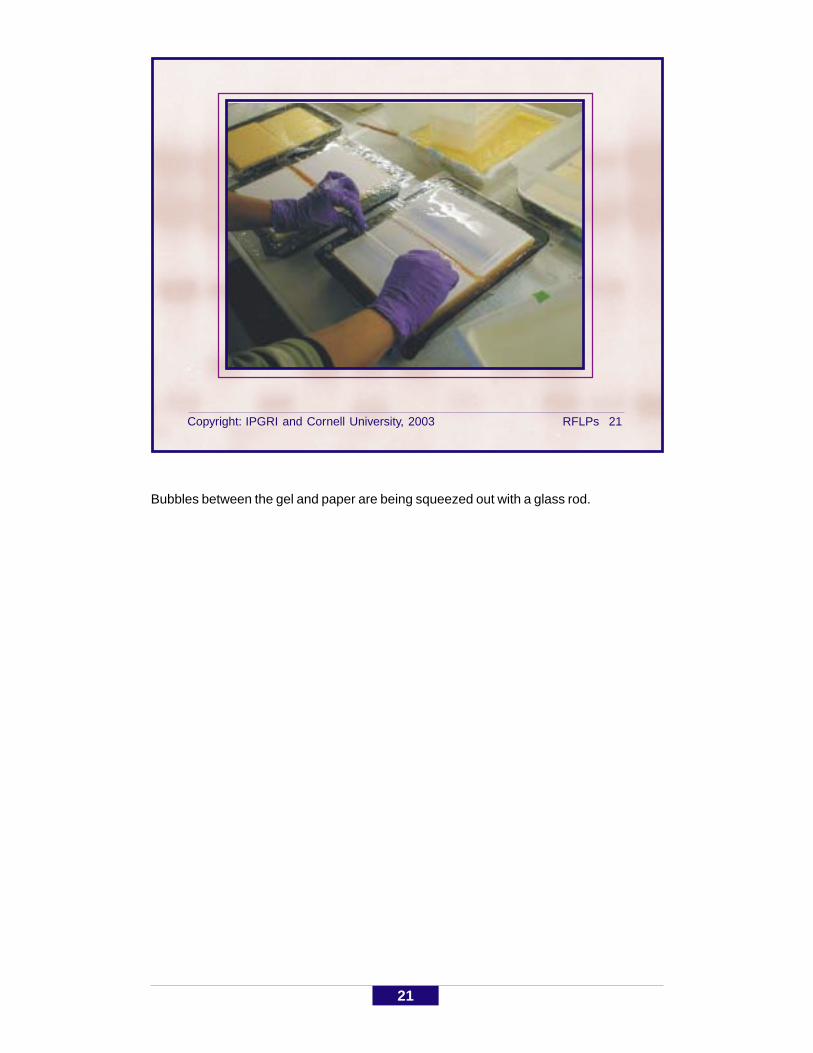
Bubbles between the gel and paper are being squeezed out with a glass rod.
Copyright: IPGRI and Cornell University, 2003 RFLPs 22
22
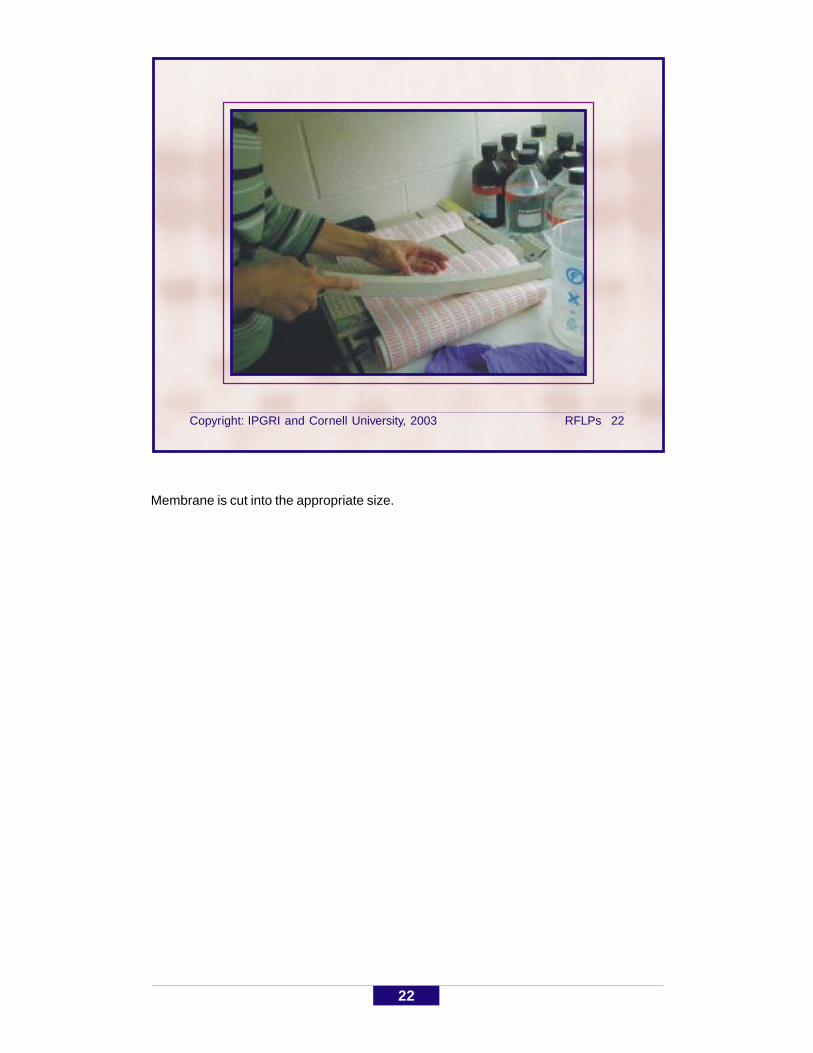
Membrane is cut into the appropriate size.
Copyright: IPGRI and Cornell University, 2003 RFLPs 23
23
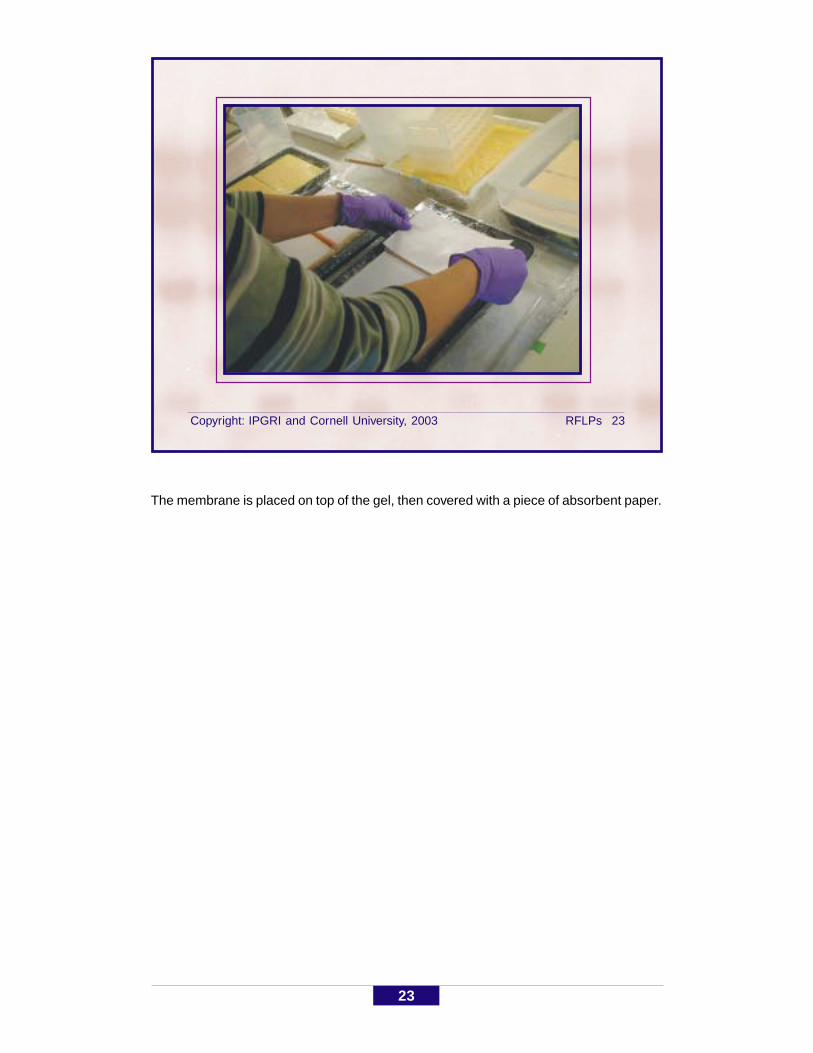
The membrane is placed on top of the gel, then covered with a piece of absorbent paper.

Copyright: IPGRI and Cornell University, 2003 RFLPs 24
24
A stack of porous paper such as paper towels or newspaper is placed on the absorbentpaper protecting the membrane.
Copyright: IPGRI and Cornell University, 2003 RFLPs 25
25
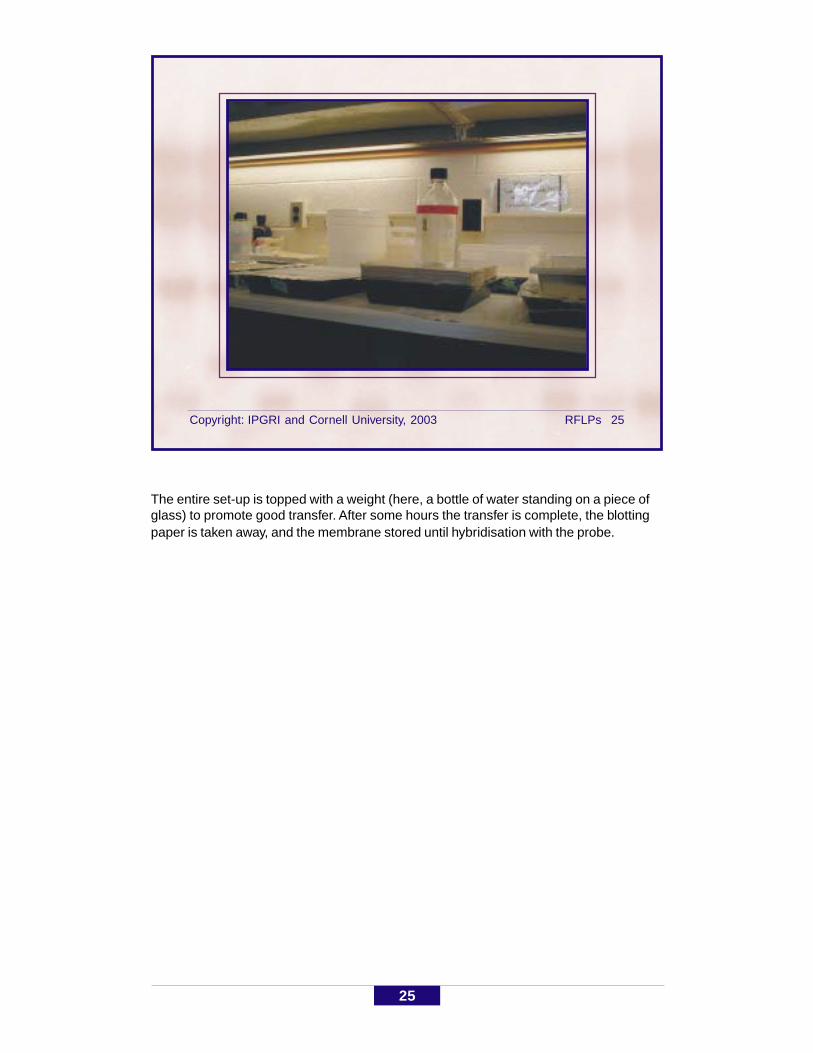
The entire set-up is topped with a weight (here, a bottle of water standing on a piece ofglass) to promote good transfer. After some hours the transfer is complete, the blottingpaper is taken away, and the membrane stored until hybridisation with the probe.

Copyright: IPGRI and Cornell University, 2003 RFLPs 26
26
The process of hybridisation begins. A blocker DNA (to minimise backgroundhybridisation with the membrane) is boiled to denature it to single strands.
Copyright: IPGRI and Cornell University, 2003 RFLPs 27
27
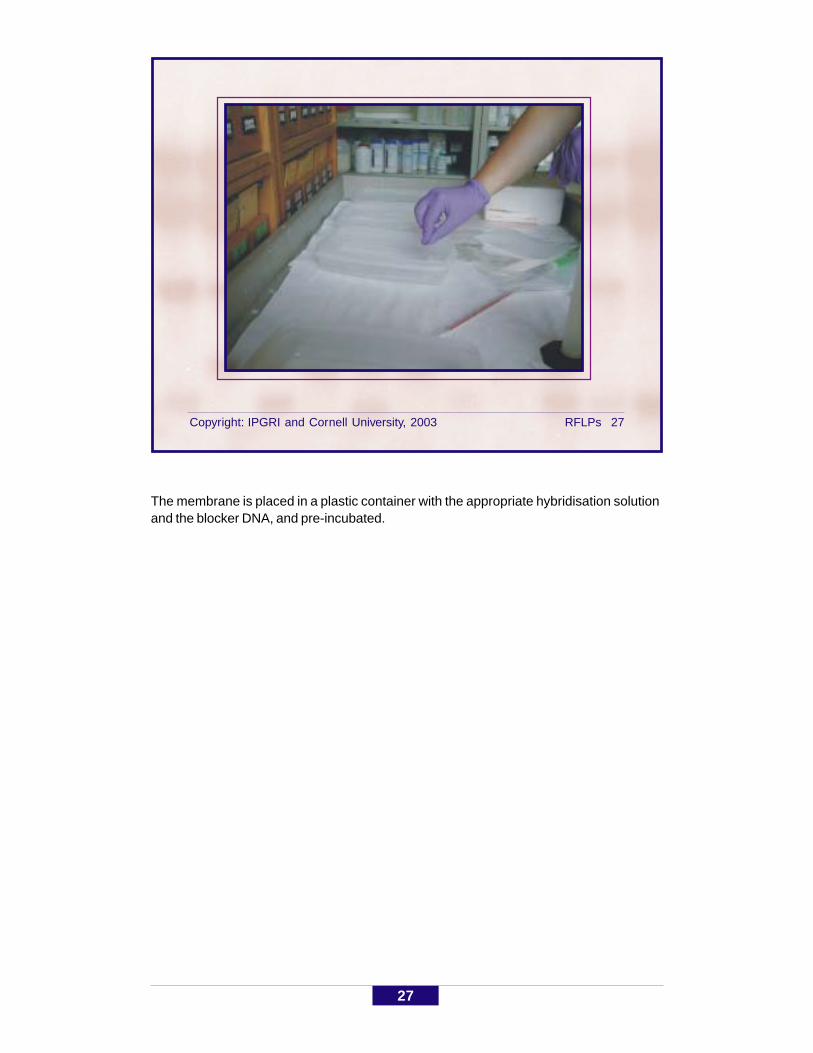
The membrane is placed in a plastic container with the appropriate hybridisation solutionand the blocker DNA, and pre-incubated.
Copyright: IPGRI and Cornell University, 2003 RFLPs 28
28
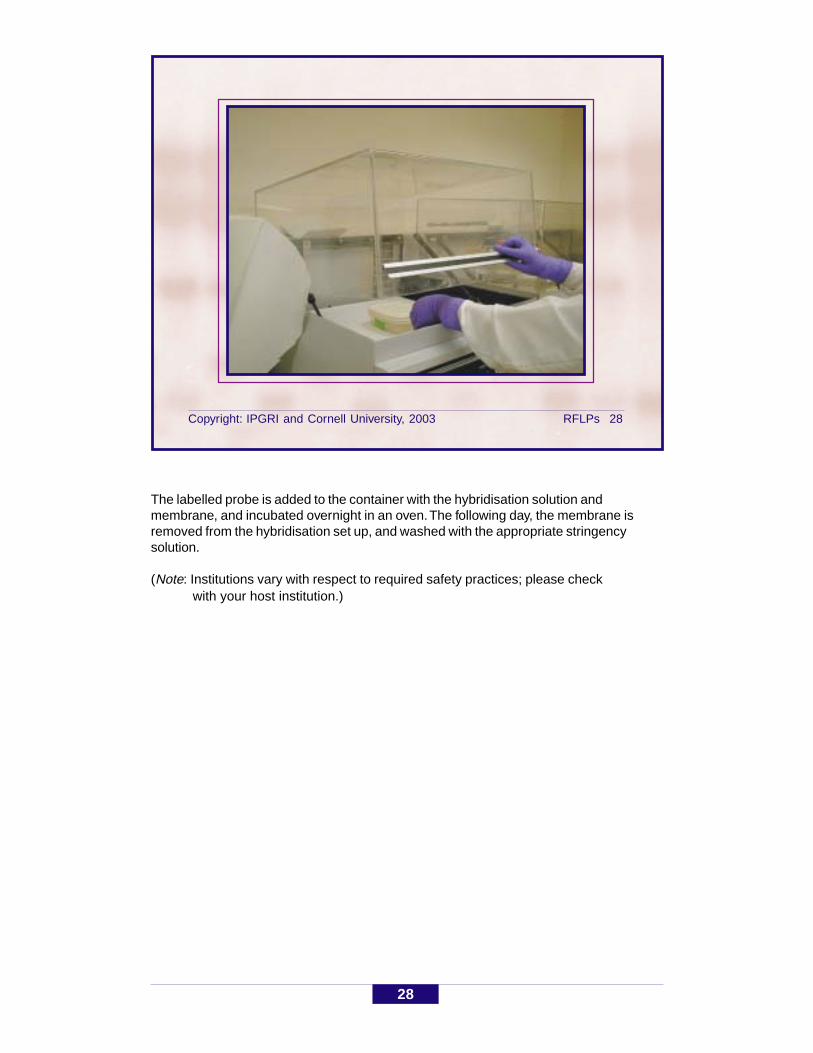
The labelled probe is added to the container with the hybridisation solution andmembrane, and incubated overnight in an oven. The following day, the membrane isremoved from the hybridisation set up, and washed with the appropriate stringencysolution.
(Note: Institutions vary with respect to required safety practices; please check with your host institution.)
Copyright: IPGRI and Cornell University, 2003 RFLPs 29
29
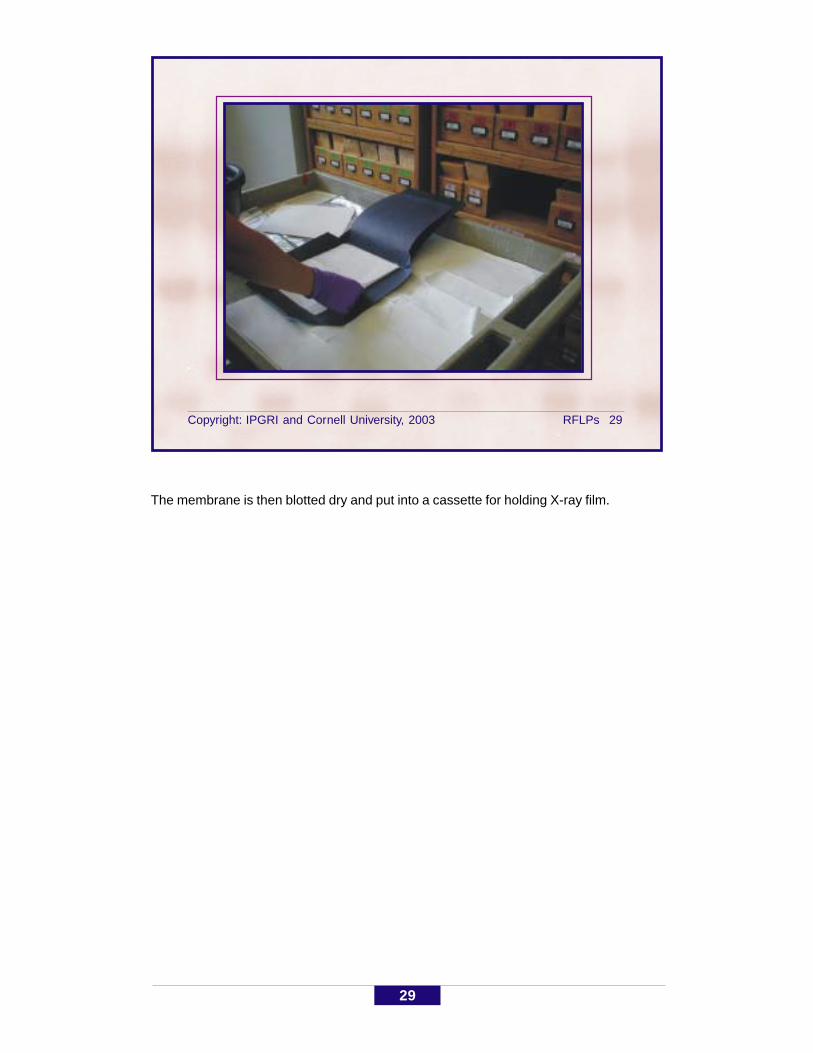
The membrane is then blotted dry and put into a cassette for holding X-ray film.

Copyright: IPGRI and Cornell University, 2003 RFLPs 30
30
Inside a dark room, an X-ray film is also inserted into the cassette.
Copyright: IPGRI and Cornell University, 2003 RFLPs 31
31
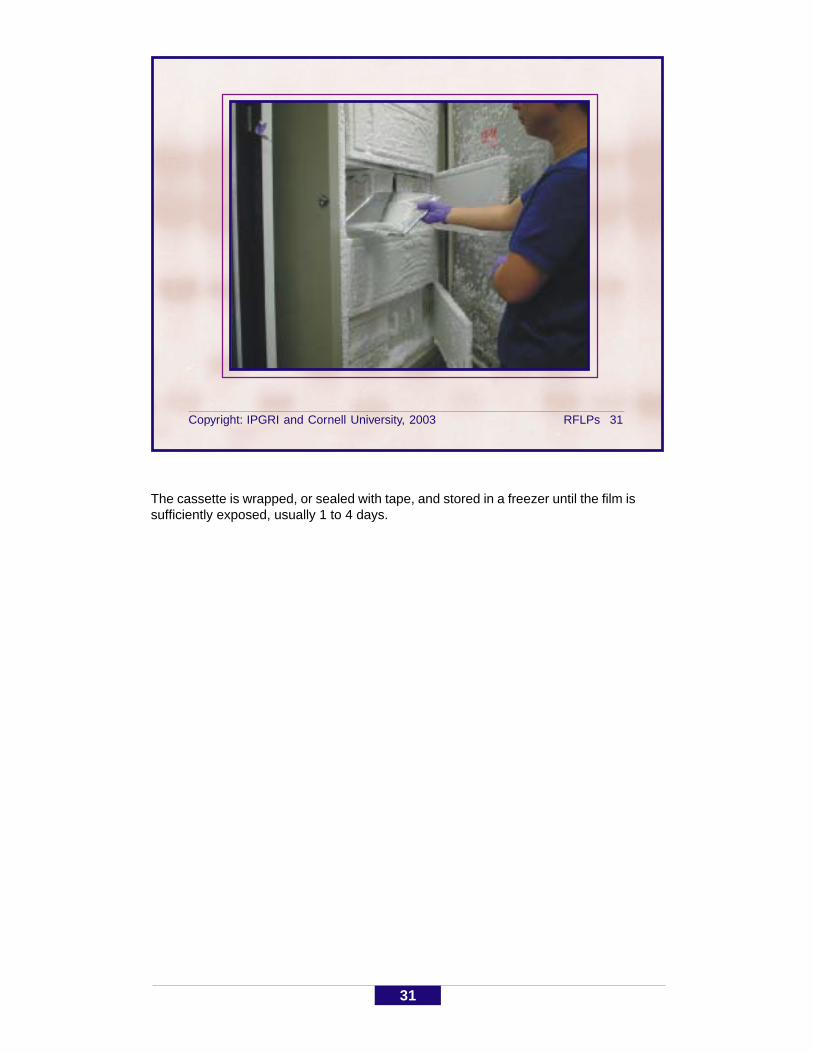
The cassette is wrapped, or sealed with tape, and stored in a freezer until the film issufficiently exposed, usually 1 to 4 days.
Copyright: IPGRI and Cornell University, 2003 RFLPs 32
32
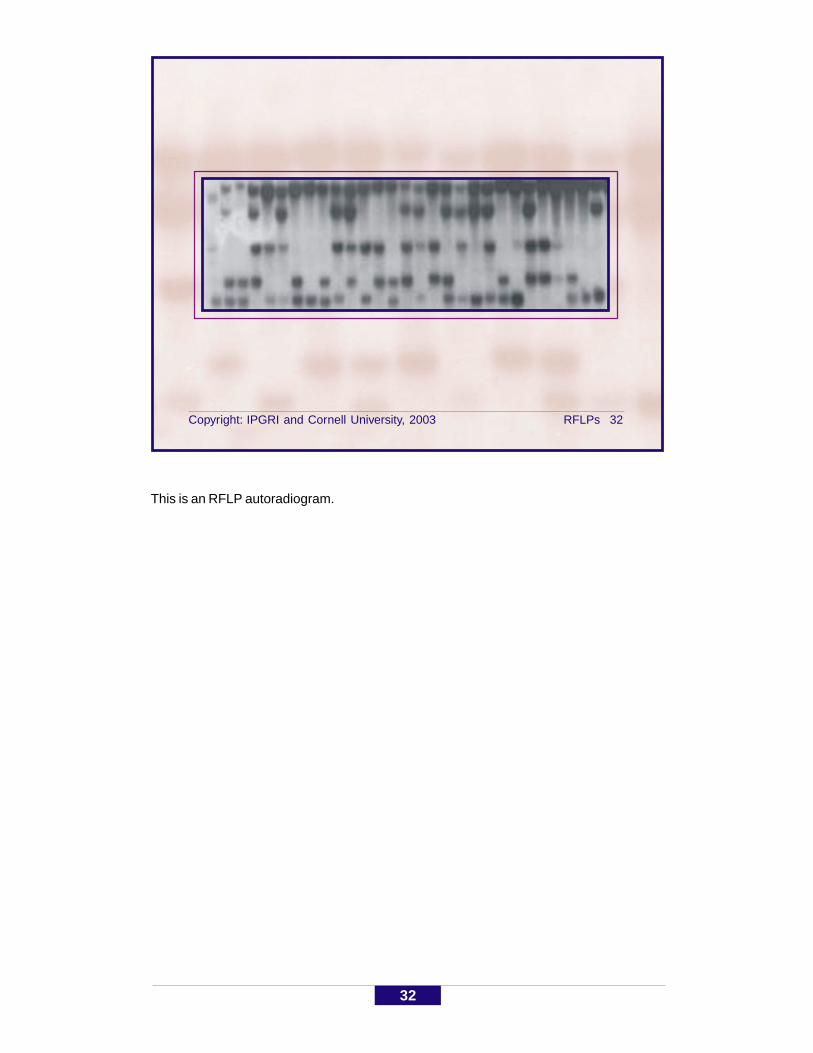
This is an RFLP autoradiogram.

33
Copyright: IPGRI and Cornell University, 2003 RFLPs 33
RFLP in pictures: summary
A
B
A B
digestion
blotting
electrophoresis hybridization
ProbeRestriction site
Mutation = a new restriction site
34
Copyright: IPGRI and Cornell University, 2003 RFLPs 34
Interpreting RFLP bands (1)
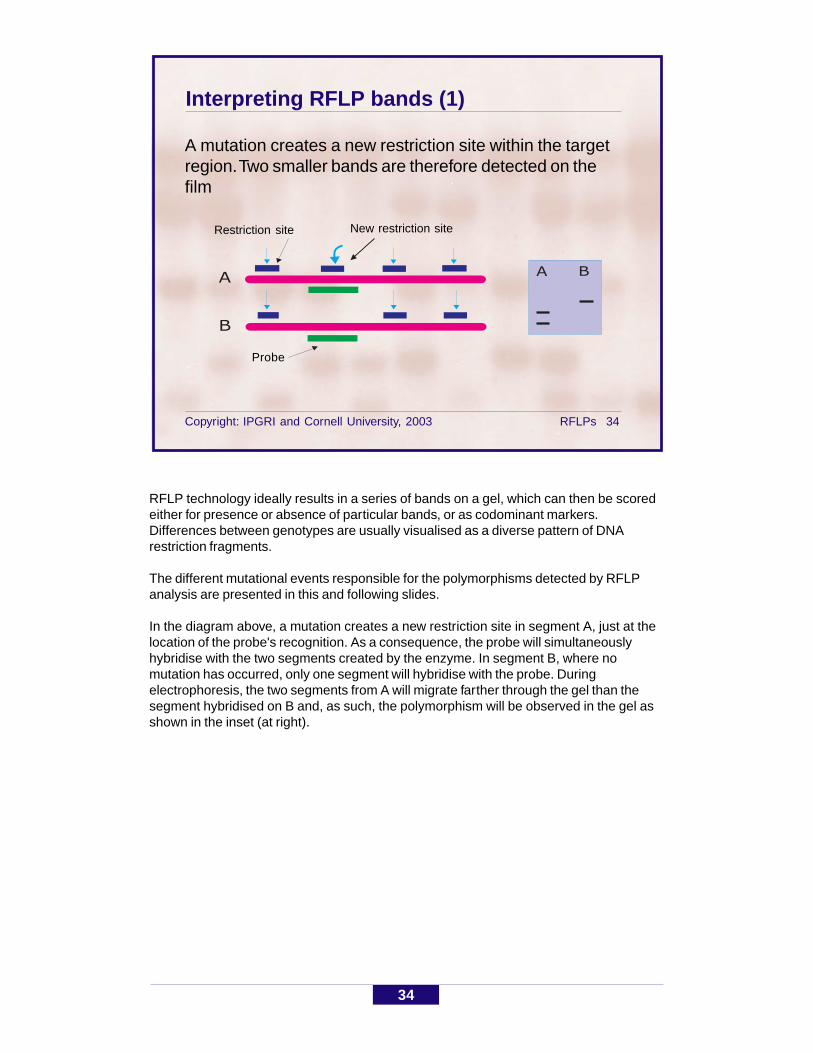
A mutation creates a new restriction site within the targetregion. Two smaller bands are therefore detected on thefilm
A
B
A B
RFLP technology ideally results in a series of bands on a gel, which can then be scoredeither for presence or absence of particular bands, or as codominant markers.Differences between genotypes are usually visualised as a diverse pattern of DNArestriction fragments.
The different mutational events responsible for the polymorphisms detected by RFLPanalysis are presented in this and following slides.
In the diagram above, a mutation creates a new restriction site in segment A, just at thelocation of the probe's recognition. As a consequence, the probe will simultaneouslyhybridise with the two segments created by the enzyme. In segment B, where nomutation has occurred, only one segment will hybridise with the probe. Duringelectrophoresis, the two segments from A will migrate farther through the gel than thesegment hybridised on B and, as such, the polymorphism will be observed in the gel asshown in the inset (at right).
Restriction site
Probe
New restriction site
35
Copyright: IPGRI and Cornell University, 2003 RFLPs 35
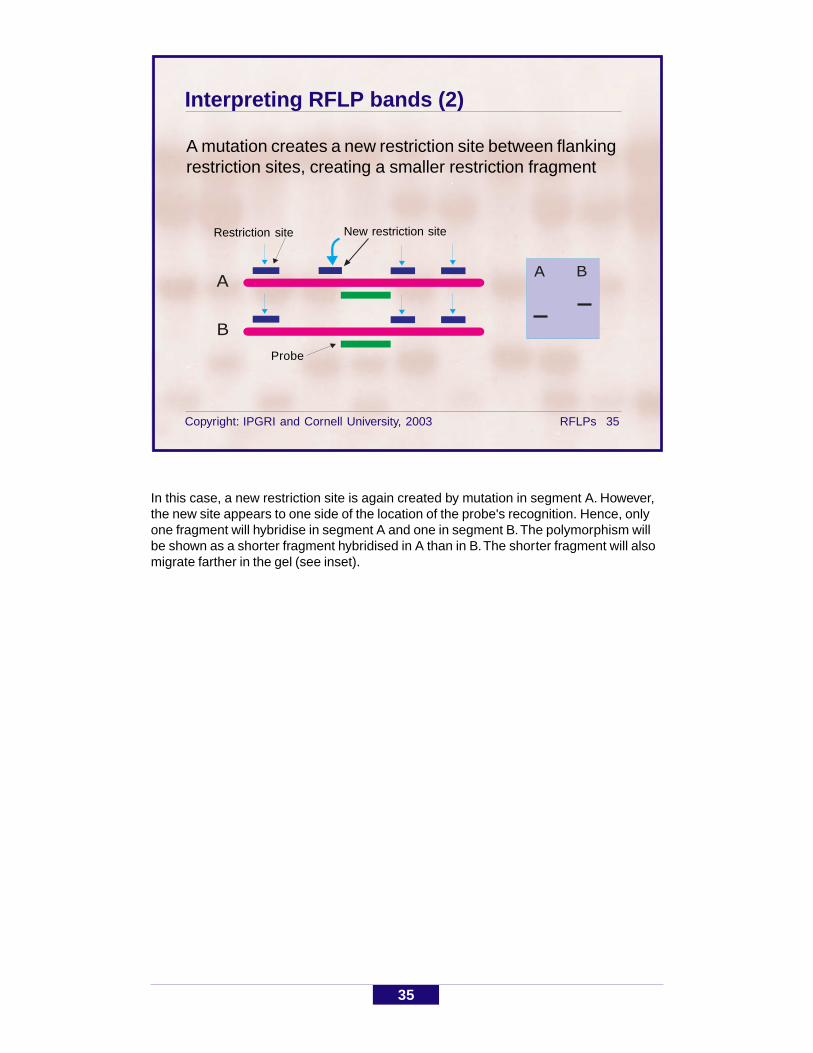
Interpreting RFLP bands (2)
A mutation creates a new restriction site between flankingrestriction sites, creating a smaller restriction fragment
A
B
A B
Restriction site
Probe
In this case, a new restriction site is again created by mutation in segment A. However,the new site appears to one side of the location of the probe's recognition. Hence, onlyone fragment will hybridise in segment A and one in segment B. The polymorphism willbe shown as a shorter fragment hybridised in A than in B. The shorter fragment will alsomigrate farther in the gel (see inset).
New restriction site
36
Copyright: IPGRI and Cornell University, 2003 RFLPs 36
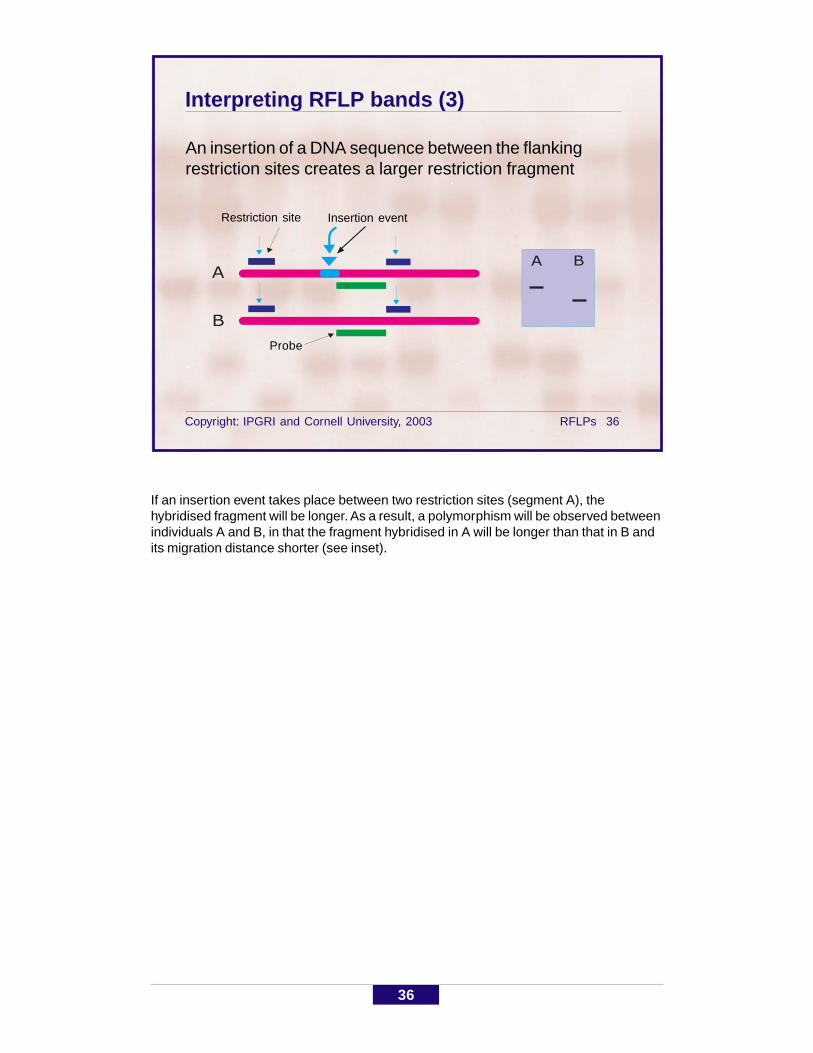
Interpreting RFLP bands (3)
An insertion of a DNA sequence between the flankingrestriction sites creates a larger restriction fragment
A BA
B
Restriction site
Probe
If an insertion event takes place between two restriction sites (segment A), thehybridised fragment will be longer. As a result, a polymorphism will be observed betweenindividuals A and B, in that the fragment hybridised in A will be longer than that in B andits migration distance shorter (see inset).
Insertion event

37
Copyright: IPGRI and Cornell University, 2003 RFLPs 37
Interpreting RFLP bands (4)
A deletion of a DNA sequence between the flankingrestriction sites creates a smaller restriction fragment
A B
A
B
Restriction site
Probe
If a deletion occurs between flanking restriction sites, the probe will hybridise to ashorter segment. This will be observed as a polymorphism in the gel with a fragmentthat migrated farther in the gel for individual A (see inset).
Deletion event
38
Copyright: IPGRI and Cornell University, 2003 RFLPs 38
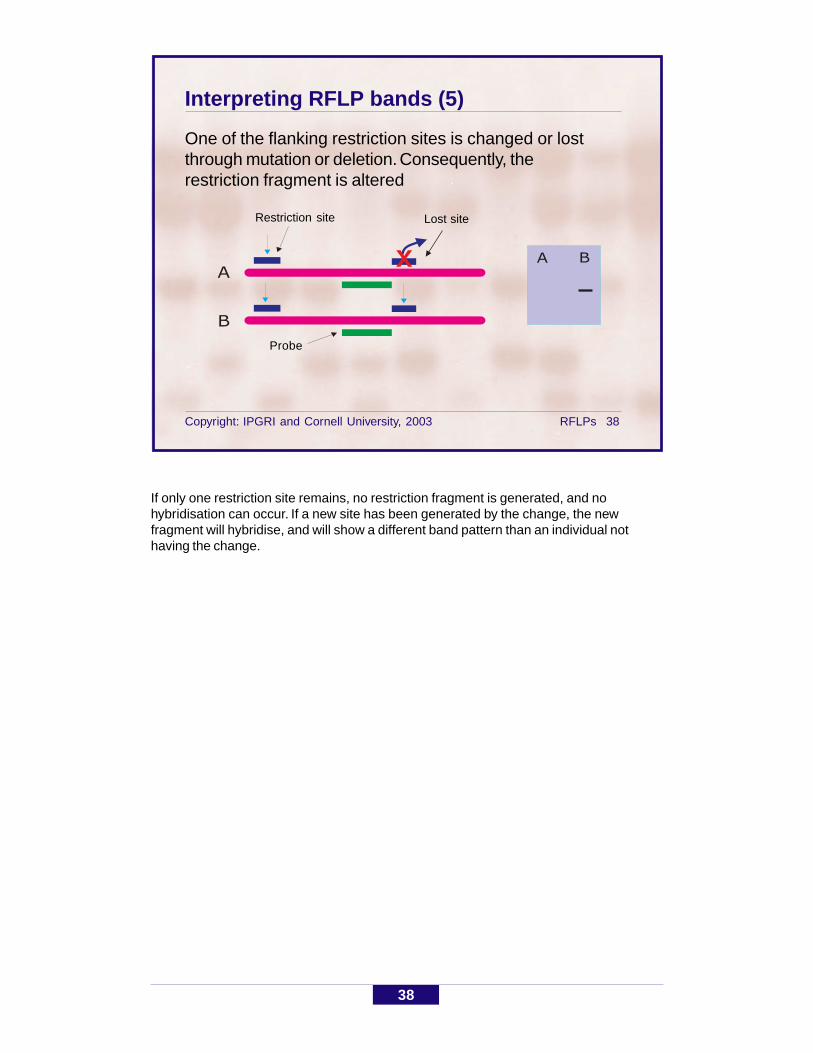
Interpreting RFLP bands (5)
One of the flanking restriction sites is changed or lostthrough mutation or deletion. Consequently, therestriction fragment is altered
A B
A
B
X
If only one restriction site remains, no restriction fragment is generated, and nohybridisation can occur. If a new site has been generated by the change, the newfragment will hybridise, and will show a different band pattern than an individual nothaving the change.
Restriction site
Probe
Lost site
39
Copyright: IPGRI and Cornell University, 2003 RFLPs 39
Advantages of RFLPs! Highly robust methodology with good transferability
between laboratories! Codominantly inherited and, as such, can estimate
heterozygosity! No sequence information required! Because based on sequence homology, highly recommended
for phylogenetic analysis between related species! Well suited for constructing genetic linkage maps! Locus-specific markers, which allow synteny studies! Discriminatory power—can be at the species and/or
population levels (single-locus probes), or individual level(multi-locus probes)
! Simplicity—given the availability of suitable probes, thetechnique can readily be applied to any plant

40
Copyright: IPGRI and Cornell University, 2003 RFLPs 40
Disadvantages of RFLPs! Large amounts of DNA required! Automation not possible! Low levels of polymorphism in some species! Few loci detected per assay! Need a suitable probe library! Time consuming, especially with single-copy probes! Costly! Distribution of probes to collaborating laboratories
required! Moderately demanding technically! Different probe/enzyme combinations may be needed
41
Copyright: IPGRI and Cornell University, 2003 RFLPs 41
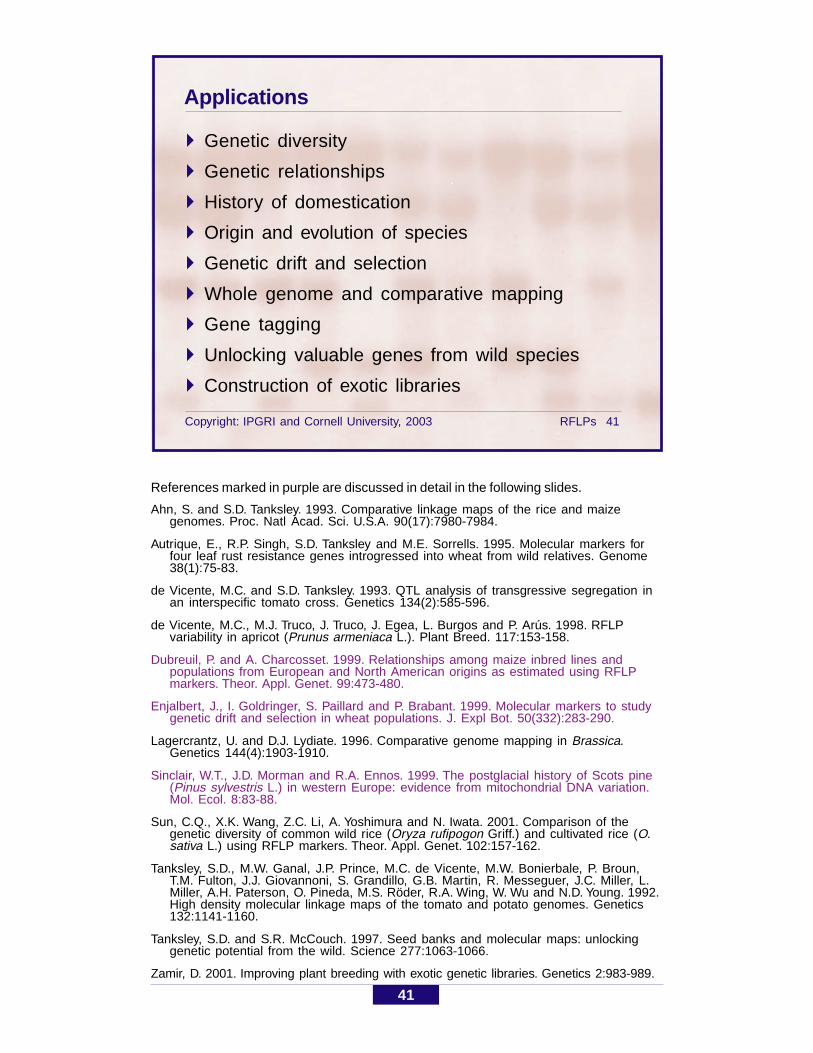
Applications
! Genetic diversity
! Genetic relationships
! History of domestication
! Origin and evolution of species
! Genetic drift and selection
! Whole genome and comparative mapping
! Gene tagging
! Unlocking valuable genes from wild species
! Construction of exotic libraries
References marked in purple are discussed in detail in the following slides.
Ahn, S. and S.D. Tanksley. 1993. Comparative linkage maps of the rice and maizegenomes. Proc. Natl Acad. Sci. U.S.A. 90(17):7980-7984.
Autrique, E., R.P. Singh, S.D. Tanksley and M.E. Sorrells. 1995. Molecular markers forfour leaf rust resistance genes introgressed into wheat from wild relatives. Genome38(1):75-83.
de Vicente, M.C. and S.D. Tanksley. 1993. QTL analysis of transgressive segregation inan interspecific tomato cross. Genetics 134(2):585-596.
de Vicente, M.C., M.J. Truco, J. Truco, J. Egea, L. Burgos and P. Arús. 1998. RFLPvariability in apricot (Prunus armeniaca L.). Plant Breed. 117:153-158.
Dubreuil, P. and A. Charcosset. 1999. Relationships among maize inbred lines andpopulations from European and North American origins as estimated using RFLPmarkers. Theor. Appl. Genet. 99:473-480.
Enjalbert, J., I. Goldringer, S. Paillard and P. Brabant. 1999. Molecular markers to studygenetic drift and selection in wheat populations. J. Expl Bot. 50(332):283-290.
Lagercrantz, U. and D.J. Lydiate. 1996. Comparative genome mapping in Brassica.Genetics 144(4):1903-1910.
Sinclair, W.T., J.D. Morman and R.A. Ennos. 1999. The postglacial history of Scots pine(Pinus sylvestris L.) in western Europe: evidence from mitochondrial DNA variation.Mol. Ecol. 8:83-88.
Sun, C.Q., X.K. Wang, Z.C. Li, A. Yoshimura and N. Iwata. 2001. Comparison of thegenetic diversity of common wild rice (Oryza rufipogon Griff.) and cultivated rice (O.sativa L.) using RFLP markers. Theor. Appl. Genet. 102:157-162.
Tanksley, S.D., M.W. Ganal, J.P. Prince, M.C. de Vicente, M.W. Bonierbale, P. Broun,T.M. Fulton, J.J. Giovannoni, S. Grandillo, G.B. Martin, R. Messeguer, J.C. Miller, L.Miller, A.H. Paterson, O. Pineda, M.S. Röder, R.A. Wing, W. Wu and N.D. Young. 1992.High density molecular linkage maps of the tomato and potato genomes. Genetics132:1141-1160.
Tanksley, S.D. and S.R. McCouch. 1997. Seed banks and molecular maps: unlockinggenetic potential from the wild. Science 277:1063-1066.
Zamir, D. 2001. Improving plant breeding with exotic genetic libraries. Genetics 2:983-989.
42
Copyright: IPGRI and Cornell University, 2003 RFLPs 42
Example: Maize! Title:
Relationships among maize inbred lines andpopulations from European and North Americanorigins as estimated using RFLP markers. Theor.Appl. Genet. 1999. 99:473-480
! Objective:To examine the genetic relationships among inbredlines from known heterotic groups and landraces ofgreat historical importance in the development of elitematerial
! Materials and methods:Sixty-two inbred lines of known heterotic groups and10 maize populations (about 30 individuals perpopulation) were assayed at 28 RFLP loci (29 differentprobe/enzyme combinations)
(continued on next slide)

43
Copyright: IPGRI and Cornell University, 2003 RFLPs 43
Example: Maize (continued)
Results:Comparing alleles specific to each type of germplasmshowed a deficit of alleles within lines accounting for about22% of the total allelic richness of the populations:
• Associations among inbreds and populations provedconsistent with pedigree data of the inbreds andprovided new information on the genetic basis ofheterotic groups
• European flint inbreds were revealed to be as close tothe north-eastern U.S. flint population studied as tothe typical European populations
(continued on next slide)
44
Copyright: IPGRI and Cornell University, 2003 RFLPs 44
Examples: Maize (continued)
! Discussion:The populations represent significant reservoirs ofdiversity, and elite germplasm is not likely to contain alluseful alleles
Question: How can the European heterotic group becloser to the north-eastern U.S. flint 'Compton's Early'populations than to other U.S. populations?
! Conclusions:Results suggest that a larger set of populationsshould be studied with molecular markers to developappropriate strategies for the most effective use of thesegenetic resources in breeding programs
45
Copyright: IPGRI and Cornell University, 2003 RFLPs 45
Example: Wheat
! Title:Molecular markers to study genetic drift and selection inwheat populations. J. Expl. Bot. 1999. 50(332):283-290
! Objective:To compare allelic frequencies in wheat populations thathave been subjected to natural selection
! Materials and methods:Two initial populations and six derived subpopulationscultivated for 10 years in contrasting sites were studiedat 30 loci
(continued on next slide)
46
Copyright: IPGRI and Cornell University, 2003 RFLPs 46
Examples: Wheat (continued)
! Results and discussion:Differentiation between subpopulations based on RFLPdiversity was highly significant:
• Allelic frequency variation was found to be muchgreater than expected under genetic drift only.Selection greatly influenced the evolution ofpopulations
• Some loci revealed higher differentiation than other.This may have indicated that they were geneticallylinked to other polymorphic loci involved in adaptation
! Conclusions:Variations of allelic frequencies observed for the RFLPmarkers cannot be explained by evolution under geneticdrift only but by direct or indirect effects of selection
47
Copyright: IPGRI and Cornell University, 2003 RFLPs 47
Examples: Scots pine! Title:
The postglacial history of Scots pine (Pinus sylvestris L.)in western Europe: evidence from mitochondrial DNAvariation. Mol. Ecol. 1999. 8:83-888
! Objective:To investigate the geographical structure of mitochondrialDNA variants in western European populations of Scotspine
! Materials and methods:Twenty populations of P. sylvestris from Scotland and 18from continental Europe (an average of 21 individualsper population) were studied, using RFLP analysis oftotal DNA
(continued on next slide)

48
Copyright: IPGRI and Cornell University, 2003 RFLPs 48
Example: Scots pine (continued)
! Results:Three major mtDNA RFLP patterns (mitotypes a, b, and d)were detected:
• Within Spain, all three mitotypes were found. Gene diversity washigh, being distributed predominantly among, rather than within,populations. Mitotype d was present only in the southernmostpopulation (Sierra Nevada, Spain)
• Italian populations were fixed for mitotype b. Populations fromnorthern France, Germany, Poland, Russia and southern Swedenwere fixed for mitotype a. Populations in northern Fennoscandia(Norway, Sweden and Finland) were fixed for mitotype b
• In Scotland, mitotype a was largely fixed. Mitotype b was presentin some polymorphic populations
(continued on next slide)

49
Copyright: IPGRI and Cornell University, 2003 RFLPs 49
Example: Scots pine (continued)
! Discussion:• The detection of different mitoypes was unequivocal
proof of genetic differences in the mtDNA genome.The diversity of mitotypes in Spanish populationsindicates that these either descend from survivors inrefugia during the last glaciation or represent Tertiaryrelics that have survived as isolated populations
• In Europe, after glaciation, P. sylvestris apparentlybegan developing in at least three evolutionarydirections, each of which had a different origin—Spain,north central Europe and northern Fennoscandia
! Conclusions:Studies of maternally inherited mtDNA markers canprovide useful insights into the history of species andhelp define geographical areas with germplasm that maybe conserved
50
Copyright: IPGRI and Cornell University, 2003 RFLPs 50
In summary
! The RFLP technology detects length changes in targetDNA molecules after restriction enzyme digestion
! RFLP bands are detected by hybridising the target DNAwith a DNA probe
! RFLP banding patterns reflect different mutational eventsat the hybridisation site of the probe or its neighbouringregion
! RFLP is a highly robust technology, but time consumingand technically demanding
51
Copyright: IPGRI and Cornell University, 2003 RFLPs 51
By now you should know
! Main steps required for detecting RFLPs
! Different sources of probes
! The effect of different mutational events ondetecting RFLP banding patterns
! The advantages and disadvantages of the RFLPtechnology for genetic diversity analysis
Basic references
Botstein, D., R.L. White, M. Skolnick and R.W. Davis. 1980. Construction of a geneticlinkage map in man using restriction fragment length polymorphisms. Am. J. HumanGenet. 32:314-331.
Griffiths, A.J.F., J.H. Miller, D.T. Suzuki, R.C. Lewontin and W.M. Gelbart. 1996. Anintroduction to genetic analysis (6th edn.). W.H. Freeman and Co., NY.
Jeffreys, A.J., V. Wilson and S.L. Thein.1985a. Hypervariable 'minisatellite' regions inhuman DNA. Nature 314:67-73.
Jeffreys, A.J., V. Wilson and S.L.Thein.1985b. Individual-specific "fingerprints" of humanDNA. Nature 316:76-79.
Nakamura, Y., M. Leppert, P. O'Connell, R. Wolff, T. Holm, M. Culver, C. Martin, E.Fujimoto, M. Hoff, E. Kumlin and R. White. 1987. Variable Number of Tandem Repeat(VNTR) markers for human gene mapping. Science 235:1616-1622.
Rogstad, S.H., J.C. Patton, II and B.A. Schaal. 1988. M13 repeat probe detects DNAminisatellite-like sequences in gymnosperms and angiosperms. Proc. Natl Acad. Sci.U.S.A. 85:9176-9178.
Ryskov, A.P., A.G. Jincharadze, M.I. Prosnyak, P.L. Ivanov and S.A. Limborska. 1988.M13 phage DNA as a universal marker for DNA fingerprinting of animals, plants andmicroorganisms. FEBS Lett. 233:388-392.
Southern, E.M. 1975. Detection of specific sequences among DNA fragments separatedby electrophoresis. J. Mol. Biol. 98: 503-517.
52
53
Copyright: IPGRI and Cornell University, 2003 RFLPs 53
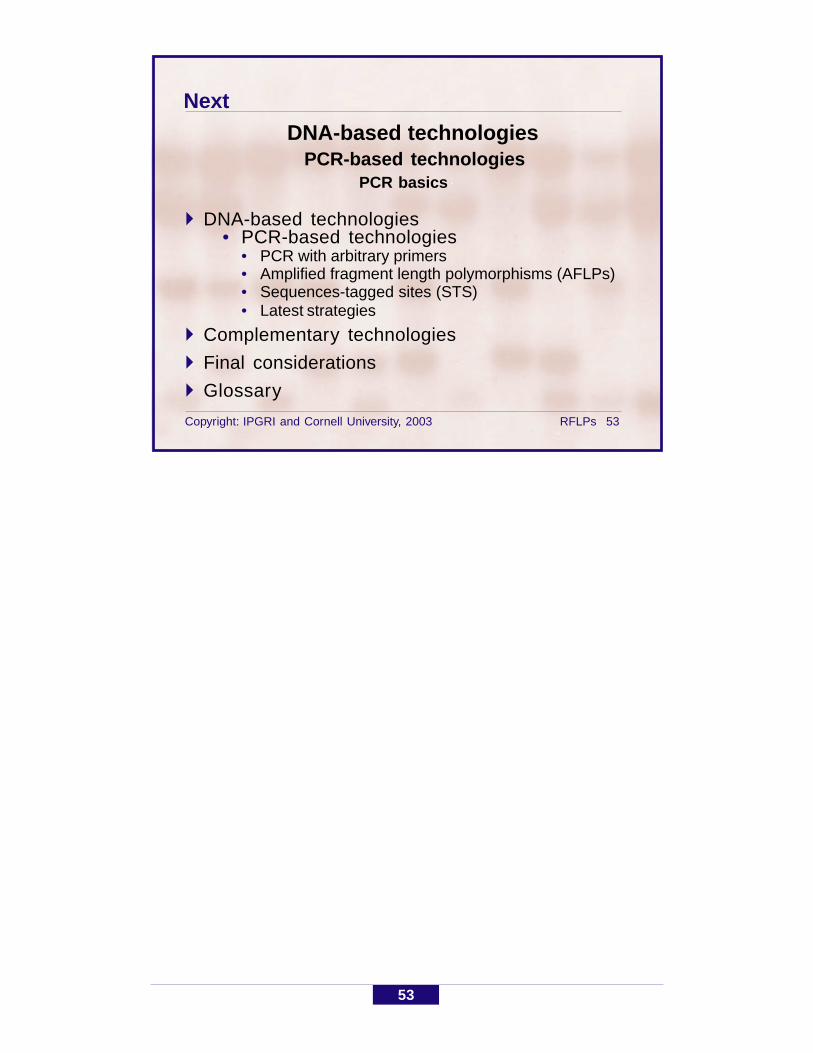
Next
DNA-based technologies PCR-based technologies
PCR basics
! DNA-based technologies• PCR-based technologies
• PCR with arbitrary primers• Amplified fragment length polymorphisms (AFLPs)• Sequences-tagged sites (STS)• Latest strategies
! Complementary technologies
! Final considerations
! Glossary