Embed Size (px)
Citation preview

Using, Misusing and (Mis)Understanding Statistics.
Mark Schirmer, Straus & Boies, [email protected]; 901-230-4697

Schirmer’s Laws for Examining Statistics and Empirical Research1. The More One Manipulates Data, the More Likely One Is to Find The “Right” Answer (With a Nod to Ronald Coase – “If you torture data enough, it will confess”)2. More Data is Generally Better than Less.3. Do Not Multiply “Dependent Probabilities. Where one event influences the probabilities of another, make sure you understand the relationship between the events (and whether the events may be influenced by other factors you are not seeing) before multiplying their “probabilities.”4. Where the Data Comes From and How it Was Gathered Matters – A Lot.5. Doubt Any Number Applied to Judgmental Analyses.6. Causation is Not Correlation. Understanding causation requires understanding probability, correlation and experimental/observational analysis of cause and effect. No matter what statisticians say, statistics do not prove causation. Statistics merely provide evidence consistent or inconsistent with a conclusion regarding causation.7. Averages May Provide the Only Way to Understanding Relationships in the Real World. But Beware of Averages.

Other Stuff You Should Remember
› Lawyers are Advocates, NOT Statisticians or Social Scientists (for the most part)
› Judges are Educated Lawyers, NOT Statisticians or Social Scientists (for the most part)
› Statistics Provide Evidence for Propositions, NOT Proof (See No. 6 above)– Remember the LEGAL standards for proving the case
› Understanding Data Composition and Data Sources is More Important than Understanding the Math– You probably can’t compete with mathematicians and computers
so don’t try› Improbable Stuff Happens a Lot

What Are We Discussing? Statistics
› What Do I Mean By Statistics?– Statistics is the Mathematical Representation of
Uncertainty or the Science of Measuring Uncertainty.– Statistics studies data collection, analysis, interpretation,
and organization.– For Our Purposes: “Statistics” means the presentation of
data to help reach or buttress conclusions.

Categorizing Statistics
› Descriptive Statistics Present What IS
› Inferential Statistics Relate One Type of Event (or Set of Events) to Another
– Probability Relationships Are Expressly Critical to Inferential Statistics.
› This is an Artificial Dichotomy – We Almost Always Use Statistics to Buttress (or Infer) Something Other Than the Nature of the Data Itself.
› Descriptive Statistics: Pie Charts, Scatterplots, Bar Graphs, Polls Showing Current Attitudes
› Inferential Statistics: Association, Causation and Correlation (or Lack Thereof)

Key Concept: Know Where the Data Comes From› Almost All Statistics are Samples, Averages, or Specific Data Collections.– Poll and Survey data are effectively always “sample” data.
› Many Statistical Inferences are Based on Samples.– One must ensure that the Sample provides a rational comparison to the relevant circumstanes.
– The supposed Gold Standard – random selection – may be misleading depending on the context.
– For example, a random selection from the population at large may mislead one about the probability of and factors leading to diseases, car accidents and promotions.
› Thus, How Data was Gathered and Where it Came From is Highly Relevant.

020406080
Catego
ry 1
Catego
ry 3
Bar Chart
Series 1
Series 2
Series 3
Pie and Bar Charts Don’t Tell You Much

Scatter Plots May or May Not Help Scatterplot of Prices/Transactions
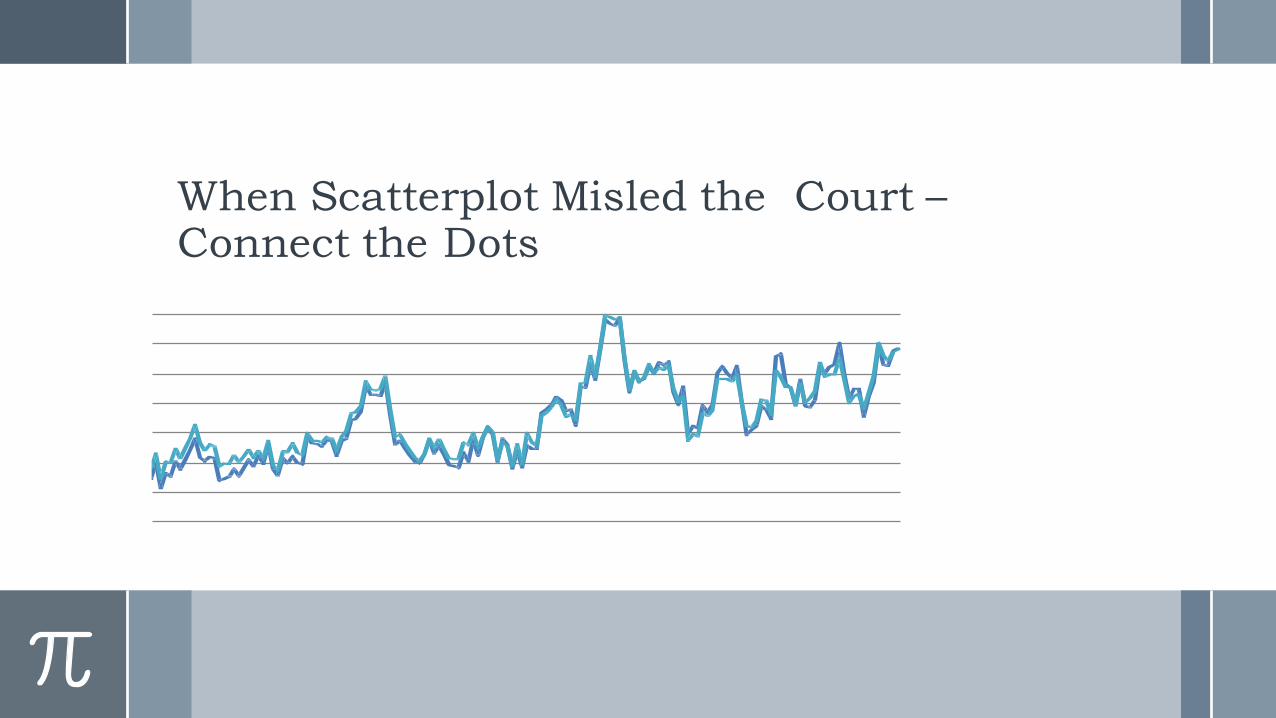
When Scatterplot Misled the Court –Connect the Dots

Misuse of Descriptive Data – Biased SampleItem: Statistical Expert Incorrectly Opines a Decreasing Failure Rate

How the Expert Determined an Incorrect Decreasing Failure Rate• Poor Sample Selection: Data Came from
Warranty Claim Files for an Inexpensive, Unmarked Item
• No Attempt to Account for Unreported Failures
• Did Not Consult with Relevant Subject Matter Experts
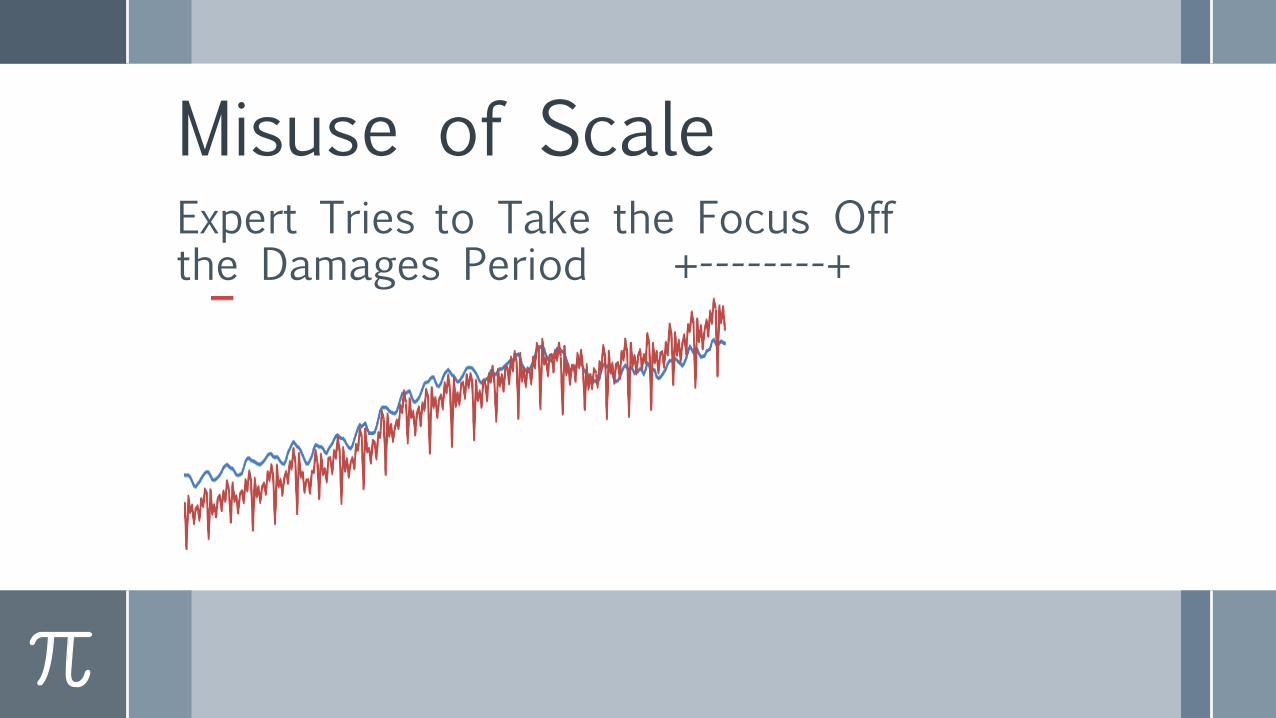
Misuse of ScaleExpert Tries to Take the Focus Off the Damages Period +--------+
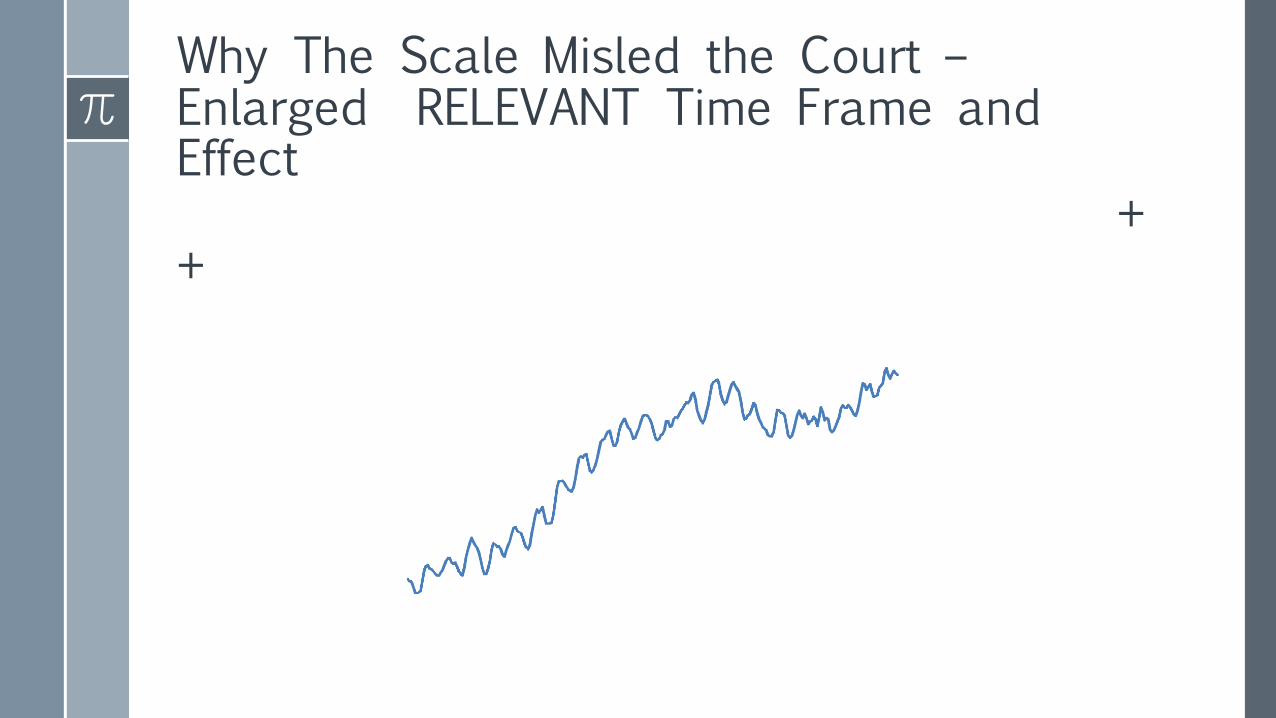
Why The Scale Misled the Court –Enlarged RELEVANT Time Frame and Effect
+ +

• Inappropriate Basis or Starting Point --Where You Start Makes a Difference.
>Example: A company claims a new treatment improved patient outcomes by 20%. Real Difference in Effect: 95% vs 96%.
> Example: Prosecution Claims The Chance That Death Came from Natural Causes/Innocent Causes is 75,000,000 to 1. Real Probability of an Innocent Explanation 2 of 3.
Averages and AggregationAverages – A Method of Examining “Central Tendency” The Mean, Median and Mode.

Inferential Statistics and Averages› In most instances, inferential statistical analyses attempt to draw conclusions about populations from analysis of data samples.
› All regressions attempt to isolate the effects of one variable on another on average. – Why on average? Because the real world is “noisy.” Examining data over time in light of experimental and theoretical analyses helps illuminate the relationship between factors leading to changes in human behavior. (Kevin Phillips, University of Chicago economist)
– One must analyze and question what else can cause the observed changes in behavior (social and physical sciences) and if possible control for it.

The Cult of Statistical Significance
› Statisticians and Courts Often Require Statistical Associations to Be “Statistically Significant.”– But given the large number of real world transactions, statistical significance may not mean much – Improbable Stuff happens often.
– .05 Level means that 1 in 20 times pure chance will lead to the outcome.
› The more tests and more data, the better.

Proper Use of Averages: Separating the Signal From the Noise› Example: Price Effects of A Market Change.
– Comparing Low Prices from Pre-Change Period to Post Change Period (and taking into account other potential causes for average price changes) real prices post change are higher than before.› Because there are so many transactions and players, examining one player (especially over a limited time) may not provide any real relevant information about the effects of a market change on the market or even on the price a plaintiff is likely to pay.
› Improbable things happen a lot where there are lots of potential data points (transactions or observations)
› Example: Product Failures.– Absolute Number of Reported Failures Fluctuates Over Time.– Average Number of Reported Failures Before and After Manufacturing Change Shows a Decrease in Failures.

Misusing Averages: Averaging Things That Don’t Belong TogetherExample: Experts Average Wages on Jobs with Different Hiring, Promotional Criteria.Example: Experts Average Market prices for Products with Different Market Characteristics. (In re Flash Memory Antitrust Litigation, 2010 WL 2332081 (N.D. Cal. June 9, 2010); In re Graphics Processing Units (GPU) Antitrust Litigation, 253 F.R.D. 478 (N.D.Cal.2008).)

Misunderstanding Probabilities: When Unrelated Occurrences Are “Related”• An earlier event may influence the likelihood
of a later event or both may be influenced by a separate underlying cause. • Example: a “coin flip” does not affect the
odds on the next coin flip, but taking one card from a deck changes the odds that any other card will be drawn from 1 in 52 to 1 in 51.

Misunderstanding Probabilities: What Seems Unreal Almost Certainly Is.• The Profusion of Data means one must
be very careful in understanding data sources, drawing conclusions and checking assumptions and causal links.
• Almost all statistical analyses require some “judgment” for example – whether fingerprints “match” -- or what constitutes a “match” for purposes of most comparisons for that matter.

An Interesting Statistical AssociationDo Lawyers in Tennessee Cause Suicides? Probably Not.
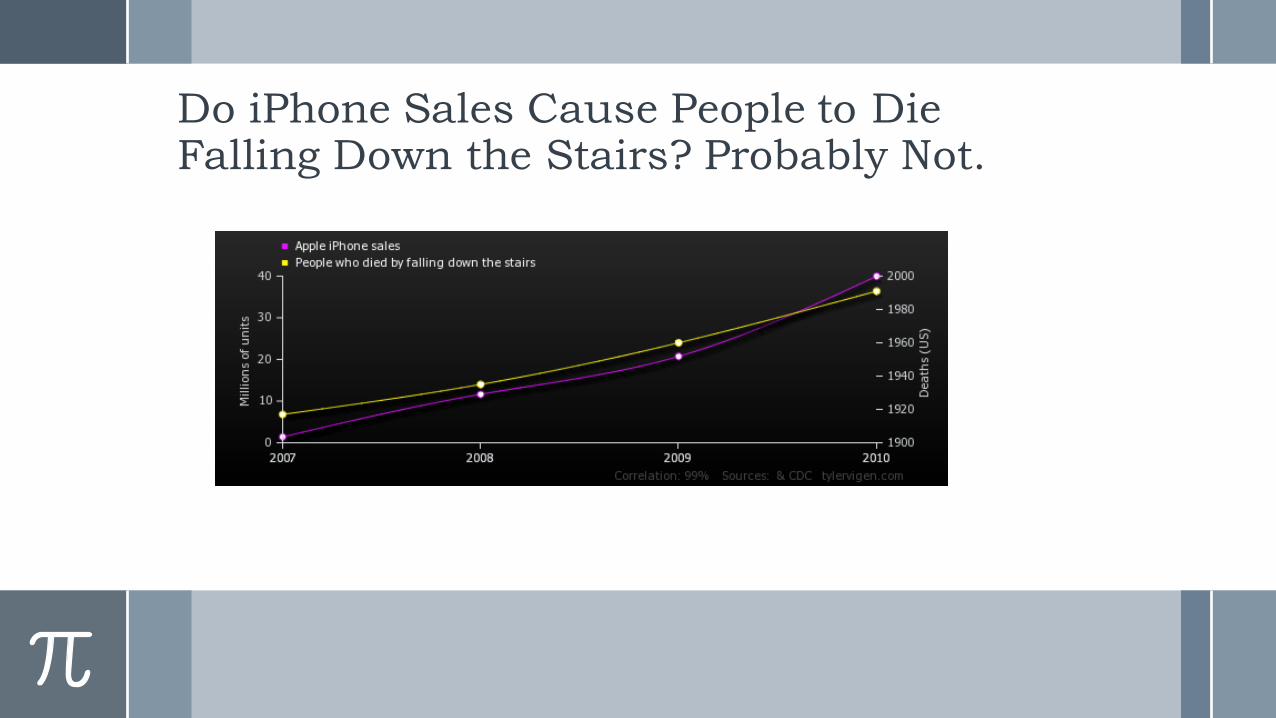
Do iPhone Sales Cause People to Die Falling Down the Stairs? Probably Not.
What This Means for Lawyers –Especially Litigators1. Question Experts About the Sources of their
Data. You may find that they are not using data relevant to the problem at hand or that is unrepresentative.
2. Consult with statistical experts regarding statistical analyses. They may see things you don’t.
3. Causation is an analytic matter, not generally or necessarily purely a statistical matter. Make sure the argument for or against causality makes sense in light of other evidence.

Ethical Issues: Using Statistics1. Check any graphs you pan to use and make sure they don’t mislead as to relationships among events and their significance.2. Don’t use proportional statistics if the proportion could mislead a reader about the difference’s actual significance.3. Remember what happens if you are exposed. Misusing data in an easily demonstrable manner can destroy your credibility and support exclusion of an expert.4. Ask yourself: is this fair?

For Further Reading:Causal Inference for Statistics, Social, and Biomedical Sciences: An Introduction, 2015, Guido W. Imbens and Donald B. Rubin.Doctoring Data: How to Sort Out Medical Advice from Medical Nonsense, Malcom Kendrick, 2015.Statistics Done Wrong: The Woefully Complete Guide, Alex Reihnart, 2015.Superforecasting: The Art and Science of Prediction, Philip E. Tetlock and Dan Gardner; 2015. The Improbability Principle, David J. Hand, 2014.Statistics Explained, Perry Hinton, 2014. Standard Deviations: Flawed Assumptions, Tortured Data, and Other Ways to Lie with Statistics, Gary Smith, 2015.Spurious Correlations, 2015, Tyler Vigen.Willful Ignorance: The Mismeasure of Uncertainty, Herbert Weisberg, 2014. Math on Trial, How Numbers Get Used and Abused in the Courtroom, Leila Schneps and Coralie Colmez, 2013.The Signal and the Noise, Nate Silver, 2012.Reference Guide to Scientific Evidence, Federal Judicial Center, 2011 (Chapters on Statistics, Survey Evidence and Multiple Regression).An Introduction to Causal Inference, 2010, Judea Pearl.Basic Concepts of Probability and Statistics in the Law, Michael O. Finkelstein, 2009.Statistics for Lawyers, 2d Ed., Michael O. Finkelstein and Bruce Levin, 2001.How To Lie With Statistics, Darrell Huff, 1993 ed.Time Series Analysis: Regression Techniques, Second Edition, Charles W. Ostrom, Jr., 1990.

Some Reading for Those Who Don’t Like Math and/or Statistics• How Not to be Wrong: The Power of Mathematical
Thinking, Jordan Ellenburg, 2015.• Naked Statistics: Stripping the Dread from the Data,
Charles Wheelan, 2014.• The Signal and the Noise, Nate Silver, 2012.• Statistics for Dummies, 2d Edition, 2011, Deborah
J. Rumsey.• Statistics II for Dummies, 2009, Deborah J. Rumsey.• Even You Can Learn Statistics: A Guide for Everyone
Who Has Ever Been Afraid of Statistics, 2010, David M. Levine and David F. Stephan.
• The Cartoon Guide to Statistics, 2005 ed., Larry Gonick.

Some Internet Resourceshttp://digitalcommons.law.villanova.edu/cgi/viewcontent.cgi?article=2159&context=vlr (The Misuse of Statistics in Civil Rights Litigation)http://knowledge.wharton.upenn.edu/article/the-use-and-misuse-of-statistics-how-and-why-numbers-are-so-easily-manipulated/