Embed Size (px)
Citation preview

www.userfocus.co.uk 1
Using Microsoft Excel to Collect Usability Data
Todd Zazelenchuk, Ph.D.

www.userfocus.co.uk 2
Table of Contents
Introduction............................................................................................................3
Defining and collecting usability data............................................................................4
Paper-based data collection........................................................................................5
Electronic data collection...........................................................................................6 A survey of usability data logging software ................................................................6 Pros and cons of commercial software data loggers ......................................................7 Using Microsoft Excel for data logging ......................................................................7
The Usability DataLogger v.1.0 ....................................................................................8 What it is..........................................................................................................8 What it is not.....................................................................................................8 Overview ..........................................................................................................8 The test preparation sheets ...................................................................................8 Recording an individual’s performance......................................................................9 Analyzing the data ............................................................................................ 10
Creating a Visual Basic Macro in Excel to Record Time .................................................... 12
Conclusion ............................................................................................................ 14
References ........................................................................................................... 15
Acknowledgements ................................................................................................. 16
www.userfocus.co.uk 3
Introduction
Anyone who has ever conducted a usability evaluation, whether it be of a website, a computer application, or a consumer product, knows that human behavior research often produces reams of data and takes significant time to digest and analyze. To be productive, researchers must be able to reduce these data and organize them effectively so that they can more efficiently perform their analysis and get on with improving the product. For many usability engineers and human factors researchers, basic note-taking on a paper form or laptop computer represents the common data collection strategy. Unfortunately, this approach can be cumbersome and slow to compile the data following the completion of a study. More complex and powerful tools exist, but they can also be expensive and more than most researchers need or want for many studies. In addition, such proprietary tools are frequently limited to the Windows operating system, and fail to permit customization, making it difficult for practitioners to tailor a tool to meet their own needs. This paper briefly reviews the data collection process for usability research and provides a cursory view of the data logging solutions available in the North American marketplace. It then examines the use of Microsoft Excel with Visual Basic macros as a potential data collection tool for usability research. Advantages and disadvantages associated with Microsoft Excel are discussed, and a sample data collection tool is presented.

www.userfocus.co.uk 4
Defining and collecting usability data
The International Standards Organization (ISO, 1998) has identified Effectiveness, Efficiency, and Satisfaction as the three primary attributes that comprise usability. It defines usability as the “extent to which a product can be used by specified users to achieve specified goals with effectiveness, efficiency and satisfaction in a specified context of use”. While others in the field have identified additional contributing elements such as learnability and retention, the following table illustrates how these three factors continue to encapsulate the essence of usability.
Table 1: Three popular definitions of usability (van Welie, van der Veer et al. 1999)
ISO 9241-11 (Nielsen 1993) (Shneiderman 1998) Efficiency Efficiency Speed of Performance Learnability Time to Learn Effectiveness Memorability Retention over Time Errors/Safety Rate of Errors by Users Satisfaction Satisfaction Subjective Satisfaction
Collecting quantitative data on each of these attributes commonly involves measuring the time taken to complete given tasks during a test (efficiency), the success or error rate associated with completing each task (effectiveness), and a subjective measure of how pleased users are with the system or product (satisfaction). In addition to these quantitative data, qualitative observations of user behaviour are commonly recorded and analyzed to identify common patterns and problem areas associated with a product. Together, these quantitative and qualitative data are transformed into information, analyzed, and used to generate solutions and recommendations for designers, programmers, and engineers to consider as they strive to improve the product.

www.userfocus.co.uk 5
Paper-based data collection
For many usability and human factors practitioners, data recording consists of a paper notepad or laptop computer. In some cases, a predesigned form or template enhances the activity somewhat by anticipating in advance some of the patterns to be recorded and taking a checklist approach to reporting certain observations. Even with a well-designed paper form however, the researcher frequently faces a significant “paper shuffle” at the end of the study. Multiple pages of documents with scribbled notes and numbers, often out of order and poorly labelled, must then be collated, coded, entered into some type of sorting software, and categorized by task or question - all of this just so the analysis phase can begin! Paper-based data collection is further limited when efficiency measures are to be collected during the research. Typically, measuring efficiency requires the use of a stopwatch or some external timekeeping tool whose results are then manually recorded onto the printed form. During analysis, these efficiency data must then be manually entered a second time from the paper form into some analysis software or directly into the final report. This re-entry of data is highly undesirable, both from a usability perspective and a data integrity standpoint.
www.userfocus.co.uk 6
Electronic data collection
As with so many other examples in our daily lives, computer software solutions for what were once tedious, repetitious, time-consuming tasks have had an increasing impact in the field of usability research in recent years. A number of software packages now exist that support usability researchers in collecting, coding, analyzing, and even reporting their usability data. Several of these programs provide particularly excellent solutions for managing the video data captured from a usability study. Like any solution, however, these applications have their strengths and weaknesses. The following section presents a quick review of some of the available solutions on the market.
A SURVEY OF USABILITY DATA LOGGING SOFTWARE
The following software products are currently available in the North American marketplace and represent a range of solutions, each with its own particular set of strengths.
OvoStudios
URL: http://ovostudios.com/ OVO Logger 4.1 comes in three different flavours (freeware, a la carte, fully featured) and provides extensive logging options for both notes and “tapeless” video as well as powerful bookmarking and reporting features designed to optimize the analysis and reporting phase of a study. While the fully featured version may be more than many researchers need or have a budget for, the freeware version may be just the right ticket. OVO Logger is a Windows-only product.
Techsmith
URL: http://www.techsmith.com/ Morae is touted as “the only fully integrated, all-digital solution for analyzing human-computer interaction”. This application takes advantage of digital video technology to allow researchers to capture, store, locate, and edit their video data from a usability study. Priced at $1298.00 USD, this application may be an attractively priced solution for managing video data. In its current form, the system focuses entirely on the video data and does not include any note taking or reporting functionality. Morae is Windows only.
Noldus
URL: http://www.noldus.com/ The Noldus Observer is “a professional system for the collection, analysis, presentation and management of observational data.” This application is able to accommodate data entry directly from a computer, a handheld device, or a video recorder, and offers extensive coding and analysis options to the researcher. While the Observer is packed with powerful features that may be needed for extensive qualitative research, it may be overkill for many usability researchers. Observer is Windows only.
Bit Debris
URL: http://www.bitdebris.com/ The Usability Activity Log v2.3 “offers an effective means to easily and unobtrusively document observational data and task performance”. This application can be synchronized with existing video equipment so that recorded observations are directly ‘linked’ to the accompanying video data for easy access by the researcher. The product is a Windows application (NT recommended) and costs $300.00 USD per license.
Usability Systems/Alucid
URL: http://www.usabilitysystems.com/ UsabilityWare 4.0 is “a single program that can be relied upon as a beginning-to-end tool for all of your data collection, analysis, and final deliverables.” This program allows you to enter your recruitment and scheduling details prior to a study, record your observations during the study,

www.userfocus.co.uk 7
analyze the results, and build a report based on the data. The product is a Windows application and costs $4500.00 USD per license.
PROS AND CONS OF COMMERCIAL SOFTWARE DATA LOGGERS
Pros Incorporate many, if not all aspects of a usability study in a single tool (e.g. test protocols
and participant details, observations and measurements, summary and analysis, and automatic report generation).
Ability to bookmark or flag specific points on the videotape to facilitate easy retrieval and editing following completion of the study.
Automatic linking within the final report to desired video selections.
Cons
Expensive, ranging from a few hundred dollars to several thousand dollars. Complex to learn and master depending on the number of features included in the product. Limited to the PC platform, making it difficult for Macintosh-based researchers to take
advantage of them. Often focus exclusively on the recording, storage, and retrieval of selected video data to
the exclusion of recording and analyzing observational data. Lack of customization available. Require significant hard drive space for installation.
USING MICROSOFT EXCEL FOR DATA LOGGING
Ever since VisiCalc (short for ‘visible calculator’) arrived on the scene in 1978, the computer spreadsheet has been considered by many to be the first ‘killer software application’. A few years later, Lotus 1-2-3 assumed the lead position in the spreadsheet category, and shortly after that Microsoft Excel moved into first place. Today, Microsoft Excel safely holds one of the largest installed bases of any software application as an integral part of the Microsoft Office suite of business applications.
Pros
Ubiquitous quality of Microsoft Excel makes it a familiar option for many people. Ability to accommodate numbers, text, formulas, and Visual Basic programming, allow easy
customization to meet specific needs. Cross-platform nature permits PC and Macintosh users to use the application. Ability to chart results in various ways facilitates analysis. Small hard drive space requirement for actual tool (assuming that Microsoft Excel
application already exists on the computer).
Cons Limited layout and formatting abilities given that columns and rows are based on a fixed
grid pattern. Limited timing ability even with Visual Basic programming enhancements, Visual Basic knowledge is required in order to include special components such as a timer. Entering the cursor into a cell interrupts any visible Visual Basic macros that are currently
running (e.g. timer feature).

www.userfocus.co.uk 8
The Usability DataLogger v.1.0
The remainder of this paper describes the Usability DataLogger, an Excel-based tool designed to facilitate the recording of observational data and measurements during a usability evaluation. The first sections describe what the tool offers and what it does not. The sections that follow describe the basic architecture of the tool, and provide screen shots and instructions for use.
WHAT IT IS
A Microsoft Excel file (requires Microsoft Excel to run) Cross-platform for either PC or Macintosh Free of charge (download it at: http://www.userfocus.co.uk/) Customizable (a password is provided to unprotect worksheets) Allows entry of participant details, tasks, task order, and pre and post questions Accommodates up to 12 participants, 20 tasks, 12 pre and 12 post test questions Allows data entry of qualitative observations for each task Allows menu selection of preset effectiveness scores (customizable by researcher) Includes a built-in timer to record efficiency scores for each task Provides a summary of pre and post test questions and observations organized according to
question and task to facilitate data analysis and pattern recognition Allows manual entry of satisfaction survey data Automatically generates visual charts illustrating task effectiveness and efficiency and user
satisfaction with the product
WHAT IT IS NOT
A video data logging tool An automatic report generator
OVERVIEW
The Usability DataLogger is essentially a collection of worksheets contained within a single Microsoft Excel file. Table 2 displays the complete set of worksheet tabs, each with its own description of the information contained on that sheet.
Table 2: List of worksheets and their descriptions
Worksheet Description About Title screen, credits, and basic introduction to tool Admin Test protocol data (participant details, task order, etc.) Tasks & Qs Tasks, pre-test and post-test questions P1 Data collection for participant 1 (scores, time per task, etc.) P2…12 Data collection for participants 2-12 Satisfaction Manual entry of satisfaction survey data Charts Automatic chart generation of effectiveness, efficiency and satisfaction Pre-Qs Summary of individual pre-question responses organized by question Observations Summary of individual observations organized by task Post-Qs Summary of individual post-question responses organized by question DataSum Data summary sheet used to populate charts worksheet
THE TEST PREPARATION SHEETS
The Admin worksheet is used to enter the necessary test parameters and details prior to conducting an evaluation. These details include: Project name, participant names, dates, session times, gender, age, additional demographics, and task order per participant. Also contained on this page are the abilities to customize the scoring criteria to be used for the study and the ability to tailor the name of the tool

www.userfocus.co.uk 9
Figure 1: Admin sheet
The Task & Qs worksheet is used to enter a long and short version of the tasks, pre-test and post-test questions for your research study. The long version captures the complete version of each item as it is presented to the users, whereas the short version is an abbreviated version intended to capture the essence of the item for auto-populating the individual participant worksheets that follow.
Figure 2: Task & Qs sheet
RECORDING AN INDIVIDUAL’S PERFORMANCE
The Participant worksheets are used to record the data for each participant’s session. On these worksheets, basic project and participant details, tasks, task order, pre-test and post-test questions are all pulled automatically from the Admin and Tasks & Qs worksheets. The researcher then records observations, time per task, and effectiveness for each task that the user performs in the white portion of the screen.

www.userfocus.co.uk 10
Figure 3: Participant sheet
ANALYZING THE DATA
On the Pre-Qs, Observations, and Post-Qs worksheets, the researcher is able to view a summary of these respective data organized by task or question. The sheet is formatted for easy printing and facilitates pattern recognition by grouping all related observations and responses together.
Figure 4: Observations sheet
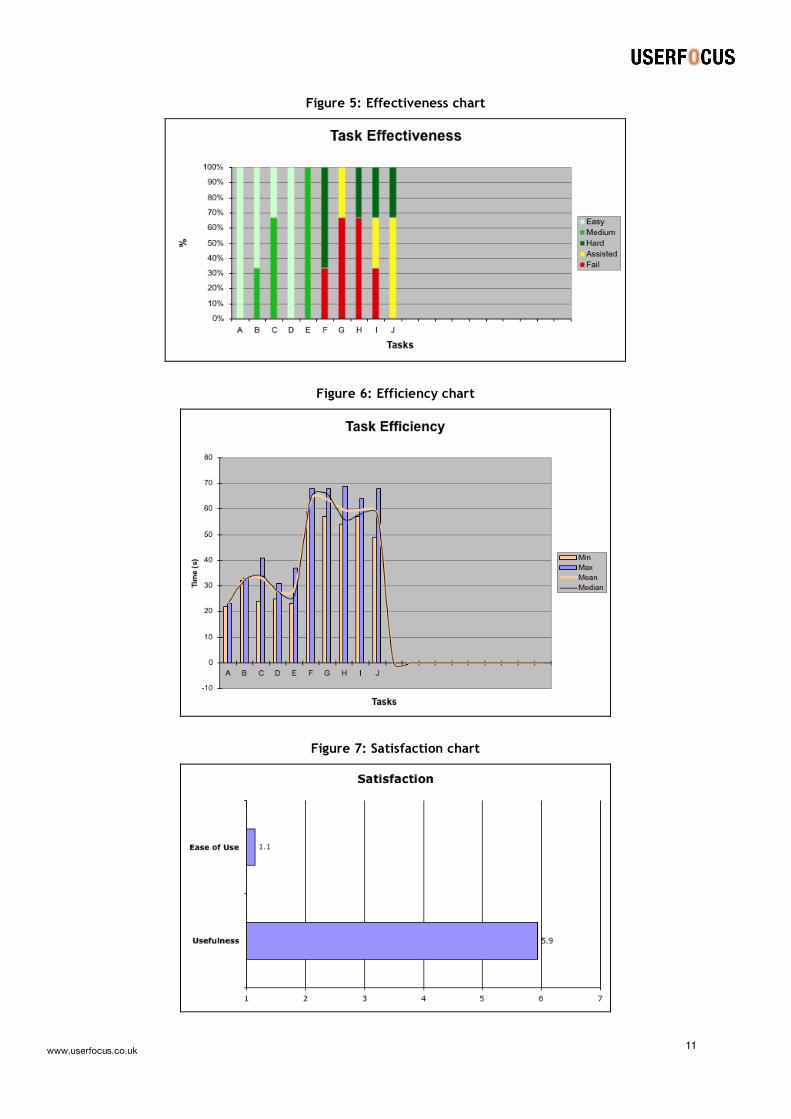
On the Charts worksheets, the researcher can view an automatically generated set of charts that display the overall effectiveness and efficiency measures for the tasks performed in the study, and the satisfaction scores as rated by users. These charts can be copied and pasted into final reports or tailored accordingly to meet specific needs the researcher may have. NOTE: the Satisfaction instrument that comes incorporated into the tool may be used as is or replaced with the researcher’s favourite satisfaction instrument and associated with the Satisfaction Chart as desired.
www.userfocus.co.uk 11
Figure 5: Effectiveness chart
Figure 6: Efficiency chart
Figure 7: Satisfaction chart

www.userfocus.co.uk 12
Creating a Visual Basic Macro in Excel to Record Time
Entire books have been written on using Visual Basic (VB) and writing various scripts to achieve specific goals. The purpose of this section is only to help get you started locating and understanding the existing scripts. Additional VB learning may be necessary for you to extend the capabilities of the Usability DataLogger to meet your needs. As with any scripting language, Visual Basic allows you to make use of a predefined vocabulary and syntax to construct your code. A script that you write for a given file is called a macro and allows you to automate or extend the standard features of a given application. In the Usability DataLogger, Visual Basic macros are used to display, start, stop, and reset a stopwatch timer into the tool. In Microsoft Excel, you can access your Visual Basic macros by selecting the Tools menu and choosing Macros.
Figure 8: Accessing Visual Basic Macros
Once selected, the Macros option presents you with a dialog box displaying the current list of macros and allowing you to edit them.
Figure 9

www.userfocus.co.uk 13
Figure 10: The Visual Basic macro scripts for the Usability DataLogger Public totaltime As Variant Public segmenttime As Variant Dim RunWhen Sub start_time() If Range("d2").Value = "START Timer" Then segmenttime = 0 Range("d2").Value = ("") Range("d4").Value = ("STOP Timer") Range("e2").Value = Format(Now(), "h:mm:ss") Range("e3").Value = ("00:00:00") Range("e4").Value = segmenttime RunClock Else: Beep End If End Sub Public Sub RunClock() Range("e3").Value = Format(Now(), "h:mm:ss") RunWhen = Now + TimeSerial(0, 0, 1) Application.OnTime RunWhen, "RunClock", , True End Sub Sub stop_time() If Range("d4").Value = "STOP Timer" Then Range("d2").Value = ("START Timer") Range("d4").Value = ("") Range("e3").Value = Format(Now(), "h:mm:ss") segmenttime = (Abs(Range("e2") - Range("e3"))) Range("e4").Value = segmenttime totaltime = totaltime + segmenttime Range("e5").Value = totaltime Application.OnTime RunWhen, "RunClock", , False Else: Beep End If End Sub Sub reset() segmenttime = 0 totaltime = 0 Range("d2").Value = ("START Timer") Range("d4").Value = ("") Range("e2").Value = ("00:00:00") Range("e3").Value = ("00:00:00") Range("e4").Value = segmenttime Range("e5").Value = totaltime End Sub NOTE: One of the limitations discovered with a Visual Basic script in Microsoft Excel is its inability to visibly update while a given spreadsheet cell is in edit mode. In the case of the stopwatch timer, this means that the running clock is only appears to work when the cursor is not inserted into a cell. As soon as the user double-clicks on a cell to edit text, the running clock continues to keep track of time, but the display is disabled, making it appear that the clock has been suspended.

www.userfocus.co.uk 14
Conclusion
Any usability study is only as good as the data that are collected and the method by which they are analyzed and interpreted. Several excellent commercial software applications have been developed over recent years to help support these activities. Microsoft Excel offers yet one more possibility for usability researchers to consider when it comes to collecting and organizing data for analysis. The Usability DataLogger represents one such freeware tool that provides usability researchers with an inexpensive, customizable solution for collecting usability data.

www.userfocus.co.uk 15
References
ISO 9241-11:1998 Ergonomic requirements for office work with visual display terminals (VDTs) -- Part 11: Guidance on usability.
Nielsen, J. (1993). Usability Engineering. Cambridge, MA, Academic Press. Shneiderman, B. (1998). Designing the user interface: Strategies for effective human-computer
interaction. Reading, MA, Addison-Wesley Longman. van Welie, M., G. C. van der Veer, et al. (1999). ‘Breaking down usability’. INTERACT '99,
Edinburgh, Scotland.

www.userfocus.co.uk 16
Acknowledgements
The author would like to thank Ananth Uggirala of Whirlpool Corporation for his contribution to the Visual Basic script that helped produce a running clock for the tool, and to David Travis of Userfocus for his encouragement on developing and sharing this tool with the usability community.
ABOUT THE AUTHOR
Todd Zazelenchuk is a human factors researcher at Whirlpool Corporation in Benton Harbor, MI where he applies a userfocus on KitchenAid portable appliances. Todd has consulted on the usability of products and web applications for the Centers for Disease Control, Palm Inc., and numerous universities, including Indiana University where he earned his PhD in Instructional Design and led the user-centred design efforts at IU's University Information Technology Services from 1999-2003.


![(5) C n & Excel Excel 7 v) Excel Excel 7 )Þ77 Excel Excel ... · (5) C n & Excel Excel 7 v) Excel Excel 7 )Þ77 Excel Excel Excel 3 97 l) 70 1900 r-kž 1937 (filllß)_] 136.8cm 136.8cm](https://img.pdfslide.us/doc/110x75/5f71a890b98d435cfa116d55/5-c-n-excel-excel-7-v-excel-excel-7-77-excel-excel-5-c-n-.jpg)