Embed Size (px)
Citation preview
USING LOCATION-BASED TECHNIQUES FOR COSTCONTROL
Olli Seppänen1, Russell Kenley2
ABSTRACT
Performance measurement is an important component of lean-based management systems, howevercost management systems or analysis have largely been applied at a high level and have not attemptedto measure or model the production cost impacts of disruption on a lean project. While it is importantto develop systems for practical site management, it is equally important to ensure that such systemscan accommodate mainstream performance measurement systems. In this paper, the performance sys-tem known as Earned Value Analysis is adapted to a location-based method for planning and control-ling work known as flowline or line-of-balance.
The resultant method for forecasting cash flow, modeling the costs of interference and controllingcosts, is described. The method is compatible with location-based scheduling methods. It useslocation-based quantities and their unit prices as starting data. Because the location-based quantitiesare also used in developing the flowline schedule, the start and finish date for each quantity is alsoknown. This information can be used to calculate cash flow more accurately than previously. In thepreplanning phase, quantity estimates and estimated prices are used to create a location-based costestimate. During the production phase, more accurate quantity data is available and prices fromcontracts can be used directly to arrive at a first cost forecast, before commencing the work. When thework is being done, cost controlling can be done by surveying the actual quantities of each location.The cost forecast is then updated based on these actual quantities and using the contract prices. Thelocation-based schedule forecast can be used to forecast overhead costs and to forecast costs ofinterference.
The paper contributes to our understanding of monitoring and control in a flowline-basedmanagement system in a lean-construction methodology. It also demonstrates that effective location-based control of the payment system allows better management of sub-contractors during production.
KEY WORDS
Cash flow, Earned value, Cost forecasting, Cost control, Flowline, Location-based.
INTRODUCTION
Lean construction is a philosophy of production,and one which is making significant and growingchanges in the way that we build. There is no needto introduce the lean construction approach in thisconference, nor is there need to explain in detailthe various methods which have been proposedfor managing construction work according to leanprinciples. However, an overview of the paperspresenting these various ideas, models and case
studies, generally make the claim that the conse-quence of poor management of the constructionprocess will be increased cost—as well factorswhich have as their consequence increased cost,such as: as longer production times and reducedquality.
Koskela’s interpretation of Ronin (Koskela2004), even though discussing the concept of‘making do’ as the eighth category of waste,delightfully summarizes the cost chain as follows:“Regarding technical consequences, the starting
Yet to be allocated
375
1 PhD Student, Department of Civil and Environmental Engineering, Helsinki University of Technology,Technology Manager Dynamic System Solutions Ltd., Pohjoinen Rautatiekatu 29B, FIN-00100 Helsinki,Finland, E-Mail [email protected], website www.dss.fi
2 Professor of Construction. School of Built Environment, Unitec New Zealand, Private Bag 92025, Auckland,New Zealand, Phone +64 9815 4321 (7374), FAX +64 9815, [email protected]
point is in an increase in processing time and itsvariability caused by making do. The increasedvariability leads to more working-in-process, orequivalently to longer lead times. The increasedprocessing time leads to a decline in productivityand to more operating expenses (emphasis byKoskela 2004). Here is a clear statement that inef-ficient production leads directly to cost, and a farreaching explanation.
This obfuscates the real cause. More work-in-progress, greater operating expenses and reducedefficiency are blamed. Yet these are higher levelterms and few would dispute the underlyingcauses, of double-handling, mobilization anddemobilization, increased effort per unit of pro-duction. Interestingly, while there is a great dealof literature in the lean construction body of workon productivity and other higher level issues,there is relatively little dealing with the quantifi-cation or modeling of direct cost.
Cost management must not be isolated frommanagerial functions and Kern and Formoso
(2004) argue that traditional cost management isstrongly based on the transformational view ofproduction, by quantification of finished ele-ments, and is not suitable for lean construction—where flow activities are recognized in the costsystem. Kern and Formoso’s work proposes acomposite costing system, with the particularmethod chosen according to circumstance. How-ever, the proposal remains aloof from detail, uti-lizing holistic techniques to assess the impact ofthe schedule or method of work. Selected tech-niques are operational costing (traditionalapproach), target costing (product developmentemphasis) and S curves (integrated program andcost). These do not unearth the gritty detail ofoperational issues and costs—in the way that alean focus on flow demands. Similarly, Ballardand Reiser’s (2004) extremely useful case studyof target costing, ignored the process costs in theanalysis.
It may therefore be seen that while cost is uni-versally seen as a justification for lean methodolo-
Proceedings IGLC-13, July 2005, Sydney, Australia
376 Using Location-Based Techniques For Cost Control
Location
ItemConsumption
( manhours/m2)
€ / units 1 2 3 Unit
SCHEDULE TASK 1
Quantity 1 2 40 56 54 23 M2
Quantity 2 3 60 43 23 43 M2
Quantity 3 1 20 50 40 20 M2
Manhours / location 291 217 195 Hrs
Cost / location 5820 4340 3900 €
TOTAL MANHOURS 703 Hrs
TOTAL COST 14,060 €
SCHEDULE TASK 2
Quantity 4 0,1 3 90 120 150 M2
Quantity 5 0,3 5 100 200 300 M2
Quantity 6 0,6 9 400 500 200 M2
Manhours / location 279 372 225 Hrs
Cost / location 4370 5860 3750 €
TOTAL MANHOURS 876 Hrs
TOTAL COST 13,980 €
SCHEDULE TASK 3
Quantity 7 2 80 300 100 50 M2
Quantity 8 1,5 60 90 70 100 M2
Quantity 9 1 40 120 30 40 M2
Manhours / location 855 335 290 Hrs
Cost / location 34200 13400 11600 €
TOTAL MANHOURS 1480 Hrs
TOTAL COST 59,200 €
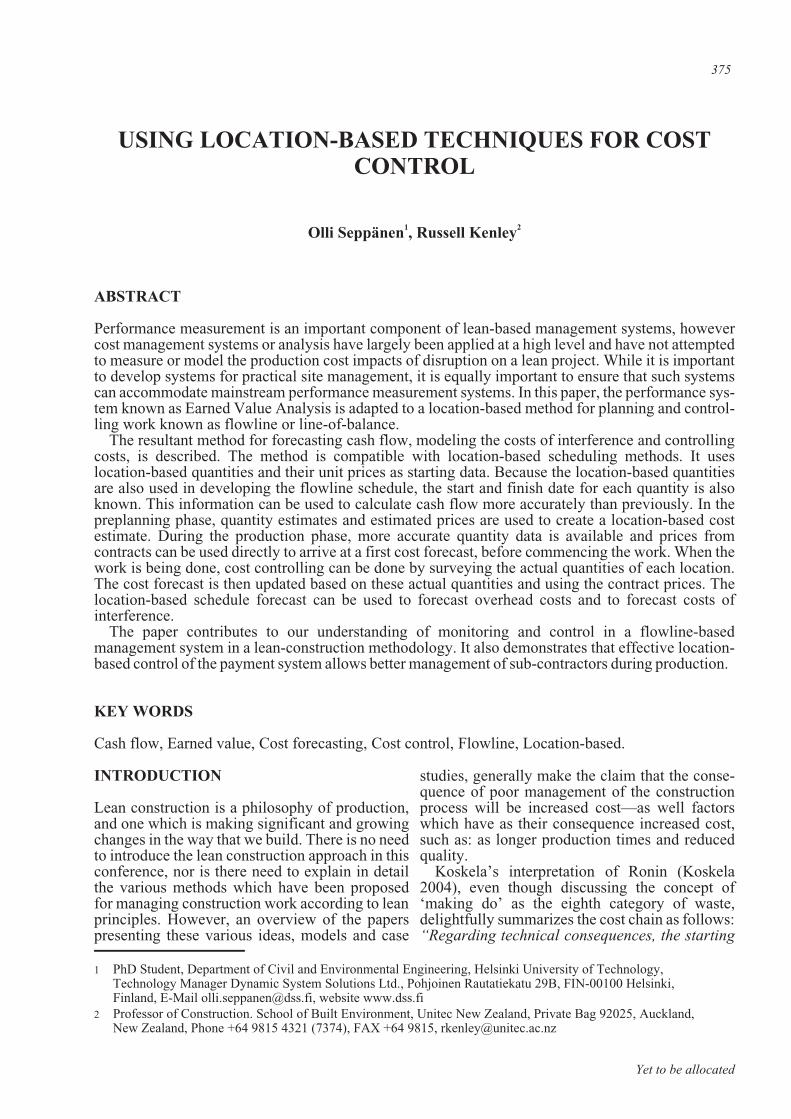
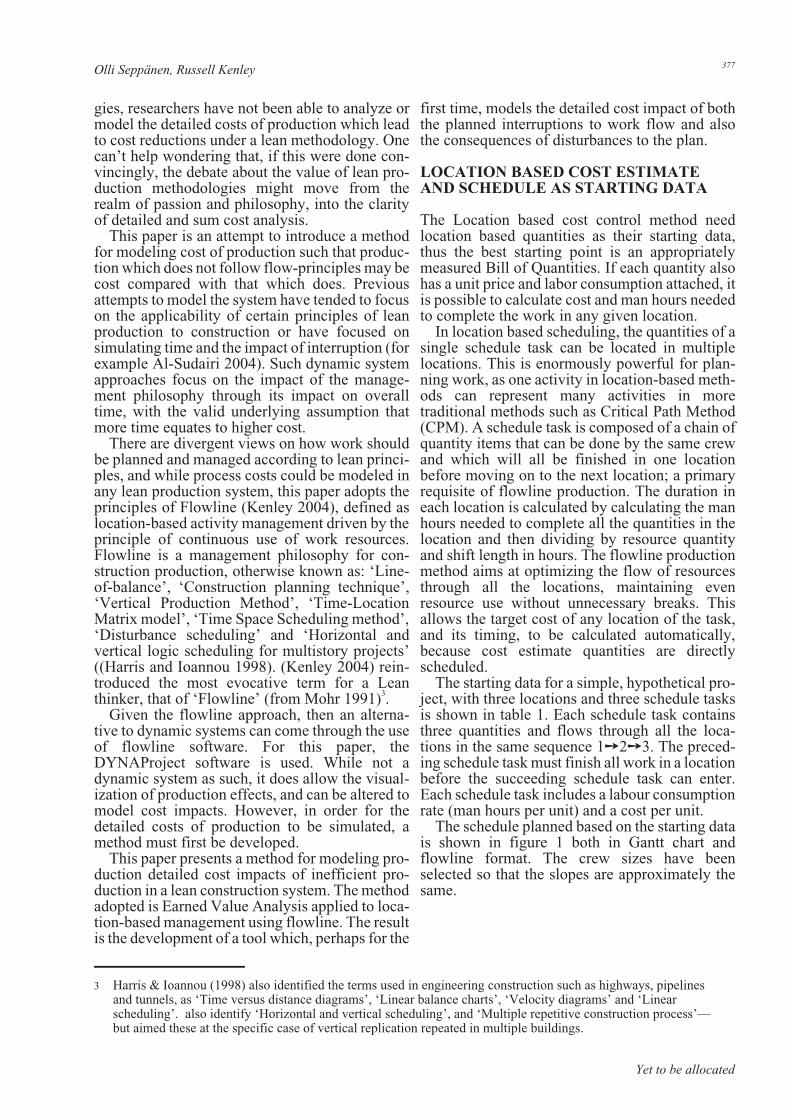
Table 1: Quantity and cost data of the hypothetical example project
gies, researchers have not been able to analyze ormodel the detailed costs of production which leadto cost reductions under a lean methodology. Onecan’t help wondering that, if this were done con-vincingly, the debate about the value of lean pro-duction methodologies might move from therealm of passion and philosophy, into the clarityof detailed and sum cost analysis.
This paper is an attempt to introduce a methodfor modeling cost of production such that produc-tion which does not follow flow-principles may becost compared with that which does. Previousattempts to model the system have tended to focuson the applicability of certain principles of leanproduction to construction or have focused onsimulating time and the impact of interruption (forexample Al-Sudairi 2004). Such dynamic systemapproaches focus on the impact of the manage-ment philosophy through its impact on overalltime, with the valid underlying assumption thatmore time equates to higher cost.
There are divergent views on how work shouldbe planned and managed according to lean princi-ples, and while process costs could be modeled inany lean production system, this paper adopts theprinciples of Flowline (Kenley 2004), defined aslocation-based activity management driven by theprinciple of continuous use of work resources.Flowline is a management philosophy for con-struction production, otherwise known as: ‘Line-of-balance’, ‘Construction planning technique’,‘Vertical Production Method’, ‘Time-LocationMatrix model’, ‘Time Space Scheduling method’,‘Disturbance scheduling’ and ‘Horizontal andvertical logic scheduling for multistory projects’((Harris and Ioannou 1998). (Kenley 2004) rein-troduced the most evocative term for a Leanthinker, that of ‘Flowline’ (from Mohr 1991)3.
Given the flowline approach, then an alterna-tive to dynamic systems can come through the useof flowline software. For this paper, theDYNAProject software is used. While not adynamic system as such, it does allow the visual-ization of production effects, and can be altered tomodel cost impacts. However, in order for thedetailed costs of production to be simulated, amethod must first be developed.
This paper presents a method for modeling pro-duction detailed cost impacts of inefficient pro-duction in a lean construction system. The methodadopted is Earned Value Analysis applied to loca-tion-based management using flowline. The resultis the development of a tool which, perhaps for the
first time, models the detailed cost impact of boththe planned interruptions to work flow and alsothe consequences of disturbances to the plan.
LOCATION BASED COST ESTIMATEAND SCHEDULE AS STARTING DATA
The Location based cost control method needlocation based quantities as their starting data,thus the best starting point is an appropriatelymeasured Bill of Quantities. If each quantity alsohas a unit price and labor consumption attached, itis possible to calculate cost and man hours neededto complete the work in any given location.
In location based scheduling, the quantities of asingle schedule task can be located in multiplelocations. This is enormously powerful for plan-ning work, as one activity in location-based meth-ods can represent many activities in moretraditional methods such as Critical Path Method(CPM). A schedule task is composed of a chain ofquantity items that can be done by the same crewand which will all be finished in one locationbefore moving on to the next location; a primaryrequisite of flowline production. The duration ineach location is calculated by calculating the manhours needed to complete all the quantities in thelocation and then dividing by resource quantityand shift length in hours. The flowline productionmethod aims at optimizing the flow of resourcesthrough all the locations, maintaining evenresource use without unnecessary breaks. Thisallows the target cost of any location of the task,and its timing, to be calculated automatically,because cost estimate quantities are directlyscheduled.
The starting data for a simple, hypothetical pro-ject, with three locations and three schedule tasksis shown in table 1. Each schedule task containsthree quantities and flows through all the loca-tions in the same sequence 1➙2➙3. The preced-ing schedule task must finish all work in a locationbefore the succeeding schedule task can enter.Each schedule task includes a labour consumptionrate (man hours per unit) and a cost per unit.
The schedule planned based on the starting datais shown in figure 1 both in Gantt chart andflowline format. The crew sizes have beenselected so that the slopes are approximately thesame.
Yet to be allocated
Olli Seppänen, Russell Kenley 377
3 Harris & Ioannou (1998) also identified the terms used in engineering construction such as highways, pipelinesand tunnels, as ‘Time versus distance diagrams’, ‘Linear balance charts’, ‘Velocity diagrams’ and ‘Linearscheduling’. also identify ‘Horizontal and vertical scheduling’, and ‘Multiple repetitive construction process’—but aimed these at the specific case of vertical replication repeated in multiple buildings.

MODELLING TIME-DEPENDENTOVERHEAD COSTS
Overhead costs vary as a function of duration.They are usually proportional to the duration ofthe project, the duration of some particular tasks,or the utilization of a resource. For example, aproject engineer might be present for the durationof the whole project. A mobile crane is presentonly when needed as a resource in some scheduletasks. In the developed location-based planningmethod, overheads may be applied in two ways,but arising from many sources. For each overheadcost factor, overheads have a unit price, which ismultiplied by a time variable calculated fromeither the duration of the project or from the dura-tions of selected schedule tasks.
In the simple example of this paper, let’sassume that we have three overhead items eachwith a unit price of 100 € / shift. The first item’sduration is calculated based on the whole project.The second item’s duration is calculated based onthe effective duration of tasks 1 and 2 and the thirditem’s duration is calculated based on the dura-tions of tasks 2 and 3. Table 2 shows the durationsand planned costs of these overhead quantities.Note: the duration is not the sum of the durationsfor each task, but rather the envelope duration ofboth tasks.
Table 2: Costs of overhead items based on the schedule
OverheadQuantity
Durationbasis
Unitprice Shifts Total
cost €
1 Project 100 € 48 4,800
2 Tasks 1,2 100 € 40 4,000
3 Tasks 2,3 100 € 36 3,600
PAYMENT SCHEDULE BASED ON COSTTYPES AND QUANTITIES
The timing of payments varies between subcon-tractors, material purchases and to direct labour(Kenley 2004). Usually they can be divided intotwo types: time-based or milestone based pay-ments. Time based payments most commonlyoccur monthly, but can also occur biweekly andbimonthly, for the work in progress. Milestonebased payments are paid when a milestone hasbeen reached (for example a given completionrate for the whole task or completing somelocations).
Traditional CPM contract administrations sys-tems are, as has been said, based on activities.Typically progress payments are based on per-centage complete of the entire activity withoutreference to the amount of work in specific loca-tions. Essentially this arises because standard
Proceedings IGLC-13, July 2005, Sydney, Australia
378 Using Location-Based Techniques For Cost Control
Figure 1: Schedule of the hypothetical example project in flowline and Gantt chart format
methods of measuring Bills of Quantities ignorelocations, and because scheduling systems areactivity-based rather than location-based. Analternative common in Finland is for payments tobe linked to completion of locations. The merits ofthis are beyond the scope of this paper, but linkback to the principles of lean construction, butinclude completing work prior to hand-over andconstraining flow of work.
The example used in this paper has enoughinformation to calculate estimated paymentsregardless of the payment type. This is becausethe quantities, start and finish dates and produc-tion rates in each location are known. Thus com-pleted quantities in any location can be calculatedeasily for any given date (assuming that all thequantities of the task are completed linearly in alocation). These completion rates are used to cal-culate the amount of payment if the location hasnot been completely finished.
Interestingly, this level of control removessome of the underlying reasons for requiringEarned Value Analysis – while greatly empower-ing it in practice.
In this paper’s example let us assume that task 1is paid monthly, task 2 is paid on completion ofeach location, task 3 is paid biweekly and all over-head tasks are paid monthly. Table 3 shows thepayments. For simplicity, the example doesn’thave pre- or post-payments.
Client payments to the General Contractor dependon the project type. They can be tied to milestoneor fixed dates or progress of the work. Because the
Finnish construction industry has widely adoptedlocation-based planning and controlling tools, theclients will in the future tie the payment scheduleto locations of the most critical schedule tasks.However, mostly payment schedules are tied tocompletion rate of the schedule or fixed monthlypayments. The timing of income payments can bemodeled the same way as expenses, based oncompletion rates of quantities in locations regard-less of the payment reason.
In this example, let us assume that the clientwants the General Contractor to use location-based methods and pays 20 % in advance, 60 %based on location completions (each taskweighted equally) and 20 % after all work is fin-ished. Total contract is 120,000 €. This results inthe income payments as shown in table 4. Theimportant component here is payment by location,which empowers a flowline (and therefore lean)management philosophy.
Table 4: Table of income payments
Reason Date Payment
Prepayment 6.5.2005 24 000,00 €
Task 1, location 1 24.5.2005 8 000,00 €
Task 1, location 2 6.6.2005 8 000,00 €
Task 2, location 1 6.6.2005 8 000,00 €
Task 1, location 3 16.6.2005 8 000,00 €
Task 2, location 2 21.6.2005 8 000,00 €
Task 3, location 1 27.6.2005 8 000,00 €
Task 2, location 3 30.6.2005 8 000,00 €
Task 3, location 2 5.7.2005 8 000,00 €
Task 3, location 3,project finished 12.7.2005 32 000,00 €
PLANNED CASH FLOW
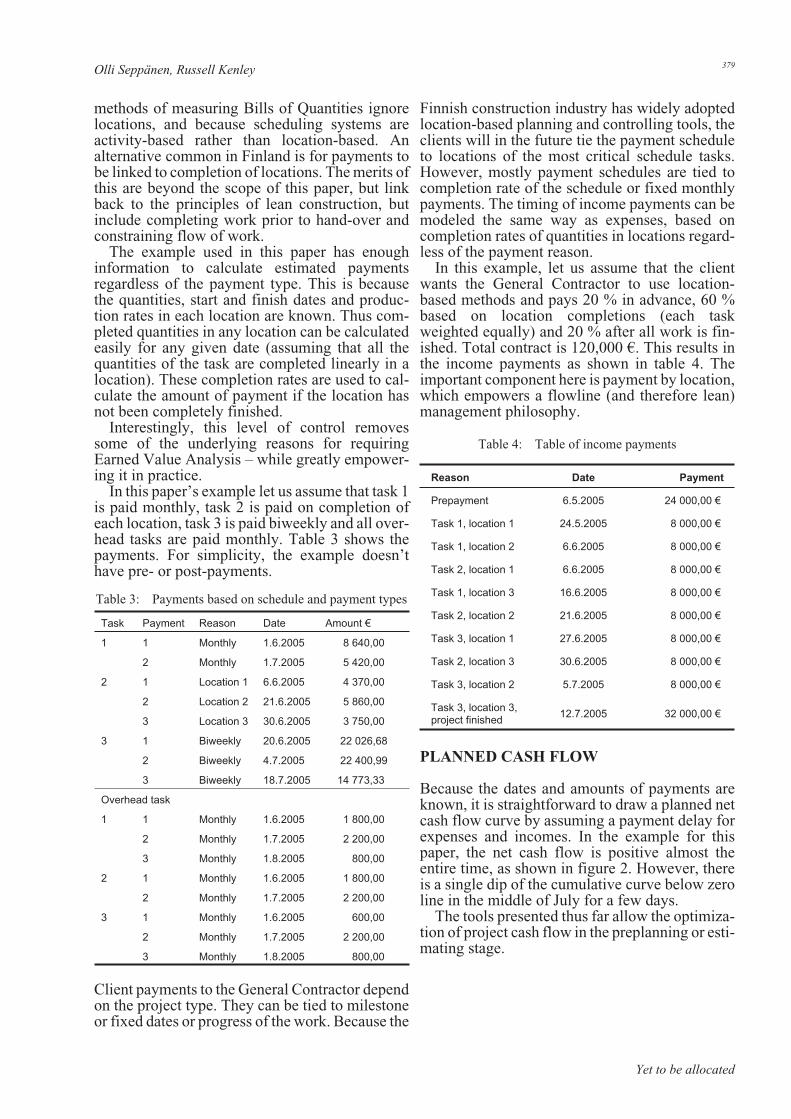
Because the dates and amounts of payments areknown, it is straightforward to draw a planned netcash flow curve by assuming a payment delay forexpenses and incomes. In the example for thispaper, the net cash flow is positive almost theentire time, as shown in figure 2. However, thereis a single dip of the cumulative curve below zeroline in the middle of July for a few days.
The tools presented thus far allow the optimiza-tion of project cash flow in the preplanning or esti-mating stage.
Yet to be allocated
Olli Seppänen, Russell Kenley 379
Task Payment Reason Date Amount €
1 1 Monthly 1.6.2005 8 640,00
2 Monthly 1.7.2005 5 420,00
2 1 Location 1 6.6.2005 4 370,00
2 Location 2 21.6.2005 5 860,00
3 Location 3 30.6.2005 3 750,00
3 1 Biweekly 20.6.2005 22 026,68
2 Biweekly 4.7.2005 22 400,99
3 Biweekly 18.7.2005 14 773,33
Overhead task
1 1 Monthly 1.6.2005 1 800,00
2 Monthly 1.7.2005 2 200,00
3 Monthly 1.8.2005 800,00
2 1 Monthly 1.6.2005 1 800,00
2 Monthly 1.7.2005 2 200,00
3 1 Monthly 1.6.2005 600,00
2 Monthly 1.7.2005 2 200,00
3 Monthly 1.8.2005 800,00
Table 3: Payments based on schedule and payment types
COST FORECASTING DURING PROJECT
Costs are committed during various stages of theproject. Usually only the income payment sched-ule is fixed before the project begins. Actual unitcosts are fixed only after an agreement is madewith a subcontractor, material is ordered or menare hired to do the work. Quantities are not usuallyaccurate in the preplanning phase. There may bemistakes in the take-off, the design may not becompleted or change orders may occur. The loca-tion-based cost forecast takes into account theseissues by always using the most accurateinformation available:
• in the estimating stage prior to contract thecost estimate is used;
• after agreement when the bill has been rated,the agreed unit prices can be used;
• and when the project is in production, on theactual quantities in each location (rather thanthe measure if there is variance) along withthe contract rates may be combined with theadjusted schedule - to forecast based on ac-tual production rates.
The cost forecast is calculated separately for eachschedule and overhead task. The total project costforecast is the sum of the schedule and overheadtask forecasts.
FORECAST 1: USE THE ADJUSTED TARGET
The initial cost estimate is used in forecasting aslong as there isn’t more accurate informationavailable. This is the case when subcontract ormaterial deliveries haven’t yet been agreed on.The cost forecast can be adjusted if earlier taskshave consistently exceeded their target cost andover 30 % of the project has been completed(Pekanpalo 2004).
FORECAST 2: USE THE AGREED UNIT PRICESAND THE CURRENT INFORMATION ABOUTQUANTITIES
The second forecast is based on agreed unit pricesor total price for the subcontract and the currentinformation about quantities. If the quantitieshave changed, this has two effects on the costforecast: the schedule forecast changes if the sameamount of resources is used as in the original planand the cost of the quantity changes. Scheduleforecast affects the forecast time of the paymentand the forecast cost of the overhead tasks. Byusing the same method as applied when calculat-ing the original target estimate, it is straightfor-ward to calculate the adjusted cost forecast. Themodeling of interference effects on other tradesare described below in section about cost ofinterference.
Proceedings IGLC-13, July 2005, Sydney, Australia
380 Using Location-Based Techniques For Cost Control
Figure 2: Project net cash flow

FORECAST 3: USE THE ACTUAL PRODUCTIONRATE INFORMATION AND ACTUALQUANTITIES
After production has started on a task, actualstatus information can be used in forecasting, inthe same way that Earned Value Analysis usespercentage completion of activities. Actual startdate, end date and quantities can be used to esti-mate the average actual production rate in a loca-tion. This production rate can be used in makingthe schedule forecast for the succeeding locations.The actual quantities themselves are useful inmaking cost forecasts for the rest of the task. If thequantity exceeds planned quantity in a location, itcan be assumed that the quantity overrun occursalso in the succeeding locations if control actionsare not taken. When actual information for at leastone completed location is available, the forecast iscalculated using the following steps:1. For each quantity item, calculate the quantity
overrun ratio: total actual quantity / totalplanned quantity
2. Calculate forecast quantity in each locationwhich has not been finished: quantity overrunratio × current estimate of quantity
3. Calculate the forecast cost of the task: sum offorecast/actual quantities × agreed unit prices
The method warns of impending cost overrunsearlier than using information from accounting
because it is real time and based on actual quanti-ties in each location (Pekanpalo 2004).
FORECAST 4: COST OF INTERFERENCE
Lean construction methods recognize the impactof waste, or non-value adding activities, in theproduction process. Interruptions in work flowcause direct and indirect waste which incur cost.The main assumption of location-based planningand controlling systems is that breaks of resourceflow either cost money or decrease predictabilitybecause of return delay risk. Projects currentlynormally choose to accept the risk of return delaysrather than added direct cost. For modeling theimpact of delay or variance from the plan, and thepreceding activity causes the successor to breakresource flow, the schedule or the cost forecast ismodified, depending on the chosen option:1. If extra cost is chosen, the subcontractor or
the workers are compensated their normalhourly wage for idle time (resourceamount × hourly cost × amount of interruptedhours). This is equivalent to requiring theworkers to sit in the shed – a mechanismfamiliar to lean construction researchers.
2. If added risk is chosen, the schedule forecastof the successor is shifted forwards until itcan continue without interruptions until thenext milestone of the subcontractor.
Yet to be allocated
Olli Seppänen, Russell Kenley 381
Figure 3: Detail of cost forecast of interference

FORECAST 5: OVERHEAD COSTS
After all the schedule forecast modifications havebeen done, the durations of the overhead tasks arerecalculated based on the schedule forecast andtheir cost forecast is based on the agreed on unitprices.
EXAMPLE
The example project has proceeded to Friday ofweek 22. To make the example simpler, it isassumed that the agreed unit prices are the same asplanned. The subcontractor of task 1 provided twoworkers instead of the planned three and theactual quantities in the first location were largerthan planned, so there has already been a scheduledeviation of two weeks. It is known beforehandthat the quantities of task 2 had been underesti-
Proceedings IGLC-13, July 2005, Sydney, Australia
382 Using Location-Based Techniques For Cost Control
Location
ItemConsumption
( manhours/m2)
€ / units 1 2 3 Unit
SCHEDULE TASK 1
Quantity 1 2 40 75 54 23 M2
Quantity 2 3 60 50 23 43 M2
Quantity 3 1 20 60 40 20 M2
Manhours / location 360 217 195 Hrs
Cost / location 7200 4340 3900 €
TOTAL MANHOURS 772 Hrs
TOTAL COST 15,440 €
SCHEDULE TASK 2
Quantity 4 0,1 3 90 200 150 M2
Quantity 5 0,3 5 100 250 300 M2
Quantity 6 0,6 9 400 570 200 M2
Manhours / location 279 437 225 Hrs
Cost / location 4370 6980 3750 €
TOTAL MANHOURS 876 Hrs
TOTAL COST 13,980 €
SCHEDULE TASK 3
Quantity 7 2 80 300 100 50 M2
Quantity 8 1,5 60 90 70 100 M2
Quantity 9 1 40 120 30 40 M2
Manhours / location 855 335 290 Hrs
Cost / location 34200 13400 11600 €
TOTAL MANHOURS 1480 Hrs
TOTAL COST 59,200 €
TOTAL COST OF QUANTITIES 89,740 €
Overheads Durationbasis
Unitprice Duration Total
cost
OVERHEAD QUANTITY 1 Project 100 € 62 shifts 6 200 €
OVERHEAD QUANTITY 2 Tasks 1,2 100 € 56 shifts 5 600 €
OVERHEAD QUANTITY 3 Tasks 2,3 100 € 47 shifts 4 700 €
TOTAL COST OF OVERHEADS 16 500 €
TOTAL COST OF INTERFERENCE 960,00 €
TOTAL COST FORECAST 107 200,00 €
Table 5: Cost forecast of the sample project

mated in the second location. However, the sub-contractor started one week after the scheduledstart date with the correct amount of resources andhas so far achieved the planned production rate.Figure 3 shows graphically the current situation.
Unless the management reacts, the subcontrac-tor of task 2 must be compensated for a waitingtime of two weeks. Unless the previous tasks canbe accelerated there is no point in getting the sub-contractor of task 3 to the site until week 26because otherwise he would also have breaks. Thecost forecast for the project is 107,200 €. Of thistotal, 89,740 € comes from quantities, 16,500 €from overheads, 960 € for interference. The origi-nal cost estimate was 99 640 € so the project so theforecast is 7,6 % over budget. Because the fore-cast of the final task is after deadline there may beadditional penalties. Also the times of paymentshave changed. Table 5 shows in detail the calcula-tions of the cost forecast.
CONCLUSION
One of the greatest problems with site manage-ment is poor sub-contractor performance, in par-ticular getting them to complete work in locationsprogressively. Leaving incomplete work is one ofthe major factors driving the failure of followingtrades to complete their work.
One of the primary reasons is the payment forpercentage complete problem. Traditional con-tractual methods pay sub-contractors progres-sively based on their percentage complete.Unfortunately, this means that it is far more prof-itable for them to complete 80% or 90% in eachlocation and then progress to the next, also com-pleting 80% to 90%. Getting them to return andcomplete the work in time for the next trade isoften a real struggle.
Management of payments by location drivescompletions and therefore supports lean construc-tion. The best solution is to only pay a sub-con-tractor progressively for work within the allocatedlocation. Work done out of sequence will not berecognized or paid. Thus they must complete allsequential work before they would get paid. Pay-ment is a major motivator of behavior!
The cost system demonstrated in this paper is amajor contribution to lean management strategies
which adopt a flowline, or location-based man-agement methodology.
REFERENCES
Al-Sudairi, A. A. (2004). “Simulation as an aidtool to the best utilisation of lean principles”.12th Conference of the International Groupfor Lean Construction, Helsingør, Denmark.306–316.
Ballard, G. and P. Reiser (2004). “The St. OlafCollege Fieldhouse project: a case study indesigning to target cost”. 12th Conference ofthe International Group for Lean Construc-tion, Helsingør, Denmark. 234–249.
Harris, R. B. and P. G. Ioannou (1998). “Schedul-ing projects with repeating activities.” Jour-nal of Construction Engineering andManagement 124(4): 269–278.
Kang, L. S., I. C. Park, et al. (2001). “Optimalschedule planning for multiple, repetitive con-struction processes.” Journal of ConstructionEngineering and Management 127(5): 382–390.
Kenley, R. (2004). Project micromanagement:practical site planning and management ofwork flow. The 12th Annual Conference onLean Construction, Copenhagen, Denmark.194–205.
Kern, A. P. and C. T. Formoso (2004). “Guide-lines for improving cost management in fast,complex and uncertain construction projects”.12th Conference of the International Groupfor Lean Construction, Helsingør, Denmark.220–233.
Koskela, L. (2004). “Making do - the eighth cate-gory of waste”. 12th Conference of the Inter-national Group for Lean Construction,Helsingør, Denmark. 3–12.
Pekanpalo, H. (2004). “Rakennustyömaankustannusvalvonta ja kustannustenennustaminen” (Cost control and cost fore-casting of a construction project). Master’sThesis, Construction Economics and Manage-ment, Department of Civil and EnvironmentalEngineering, Helsinki University of Technol-ogy, Espoo, Finland. 97 pp.
Yet to be allocated
Olli Seppänen, Russell Kenley 383


![Facility Location with Client Latencies: Linear ... · arXiv:1009.2452v1 [cs.DS] 13 Sep 2010 Facility Location with Client Latencies: Linear-Programming based Techniques for Minimum-Latency](https://img.pdfslide.us/doc/110x75/6041c5819b550d61623485f5/facility-location-with-client-latencies-linear-arxiv10092452v1-csds-13.jpg)