Embed Size (px)
Citation preview

Using Injury Data to Understand Traffic and Vehicle Safety
Carol A. Flannagan, Ph.D.Center for the Management of Information for Safe and
Sustainable Transportation (CMISST),Biosciences, UMTRI

Injury Data in Traffic Safety
1. Background2. Policy
a. Motorcycle helmet law in Michigan3. Vehicle design for occupant protection systems
a. Adaptive restraints and occupant characteristicsb. Low-mass vehiclesc. Crash-mitigation in a crash-avoidance world
4. Improved injury responsea. AACN

Collaborators
• Jonathan Rupp• Jingwen Hu• Kathleen Klinich• Patrick Bowman• Patrick Carter• Doug Kononen

The Current Problem• Motor-vehicle crashes:
– account for 40% of trauma admission to US hospitals,
– are the fourth most common cause of non-fatal injuries treated in emergency departments, and
– are the leading cause of death for people between ages 1-44.
• 33,000 fatalities and 2.2 million injuries each year in road-traffic crashes. (NHTSA, 2011). Likely to increase in coming years, as economy (and travel) recover.
• The annual economic cost of these injuries is estimated at $231 billion.

Working with Injury Data in Traffic Safety Research
Primary data sources for injury:• National Automotive Sampling System—
Crashworthiness Data System (NASS-CDS)– Include medical diagnosis data, accident
investigation, and detailed crash data– Small (but nationally weighted) sample
• State police-report data– Uses police-reported injury severity (KABCO scale)– Data linkage to trauma/hospital needed,
encouraged by USDOT, in progress in many states…

Working with Injury Data in Traffic Safety Research
Policy Analysis

Policy Analysis
Helmet law change in Michigan
On April 13, 2012, a modified helmet law went into effect in Michigan allowing motorcyclists 21 and over to choose not to wear a helmet. What was the effect and how is fatality/injury risk affected by helmet use?

Motorcycle Fatalities and InjuriesApr 13-Dec 31
Year(s)Helmet
Use
Fatalities(per year)
Serious Injuries
(per year)
Percent Fatal
Percent Serious Injury
2011 Yes 97 574 3.2% 19%
No 6 23 7.2% 31%
2012 Yes 56 390 2.3% 16%
No 55 194 6.5% 23%

Motorcycle Fatalities and InjuriesApr 13-Dec 31
• Overall fatality rate in 2011 = 3.3%
• Overall fatality rate for 2012 = 3.4%
• Fatality rate was 2.8 times higher for those who didn’t wear helmets in 2012 compared to those who did

Who Wears Helmets?
Driver Drinking Year(s)Helmet Use
Rate
Driver Not Drinking
2008-11 98%
2012 76%
Driver Drinking 2008-11 90%
2012 54%

Separating the Effect of Alcohol from the Effect of the Helmet
How do we figure out what effect the helmet has, separate from risk-taking factors like alcohol use?
Regression models allow us to predict risk of fatality or injury account for alcohol, speed, age, and other factors

Bottom Line…
Taking risk-taking factors into account, we find:
• Alcohol more than quadruples the risk of deathand nearly triples the risk of serious injury
• After accounting for other risk factors, not wearing a helmet doubles the risk of fatality and increases the risk of serious injury by 60%
• 24 fatalities and 67 serious injuries estimated to have resulted from reduced helmet use after the helmet-law modification

Working with Injury Data in Traffic Safety Research
Vehicle Design

Source: US Census Bureau, 2004
Demographic Changes: Aging of the U.S. Population

Effects of Age on Fatality Rate
Source: IIHS (2007), FHWA
0
2
4
6
8
10
12
14
16
Num
ber o
f Fat
aliti
es
Age Group (year)
Per 100 Million Miles Driven

Serious Injury Risk by Age in Frontal Crashes
Head
Thorax
Abd
SpineUX
LX
0%
5%
10%
15%
20%
25%
30%
35%
20 30 40 50 60 70 80
Ris
k of
AIS
3+
Inju
ry (%
)
Age (yr)
Male, Belted, Driver, BMI=24, Pass Car, 35 mph DV
Head (OR=4.10)Thorax (OR=15.90)Abdomen (OR=11.30)Spine (OR=5.99)UX (OR=2.99)LX (OR=3.49)

Load limiting seatbeltsDeformable element in the retractor allows belt to spool out at
a fixed force to limit chest loading and chest deformation and thus minimize the potential for thoracic injury.
1999
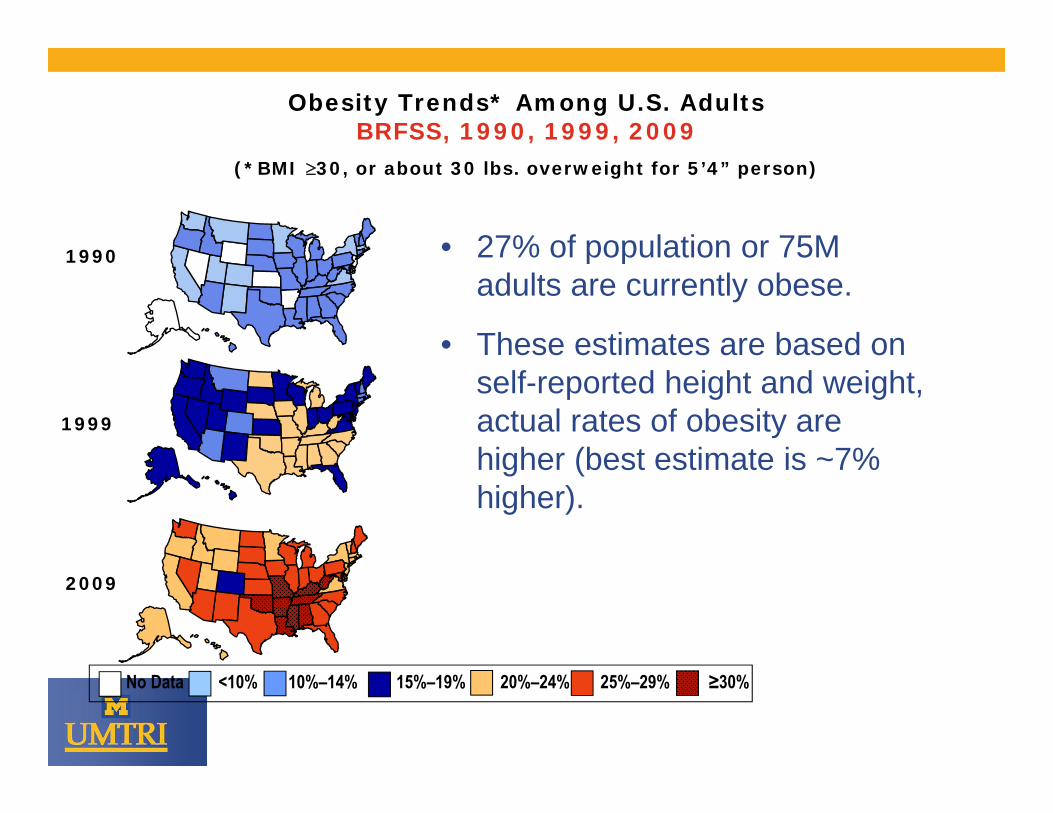
Obesity Trends* Among U.S. AdultsBRFSS, 1990, 1999, 2009
(*BMI 30, or about 30 lbs. overweight for 5’4” person)
2009
1990
No Data <10% 10%–14% 15%–19% 20%–24% 25%–29% ≥30%
• 27% of population or 75M adults are currently obese.
• These estimates are based on self-reported height and weight, actual rates of obesity are higher (best estimate is ~7% higher).

Serious Injury by BMI in Frontal Crashes
Obesity mainly affects injury risk in frontal crashes.– More mass to stop higher force to stop occupant.– Worse belt fit tougher to apply forces to bony
anatomy, especially the pelvis.
Abd
UXLX
Spine
0%
5%
10%
15%
20%
25%
15 20 25 30 35 40 45
Ris
k of
AIS
3+
Inju
ry (%
)
BMI (kg/m2)
35YO, driver, belted, malepassenger car, 35 mph V
Abdomen (OR=1.81)UX (OR=2.30)LX (OR=1.76)Spine (OR=8.17)

Parametric Study on Obesity
BMI 25 BMI 40

Future Improvements in Occupant Restraint Technologies
• Inflatable belts (2011 Ford Explorer, Lexus FXL) and 4-point belts
• Adaptive restraints (customize belt forces for individual occupants)
• Ejection mitigation in rollovers (FMVSS 226)
• and many more…
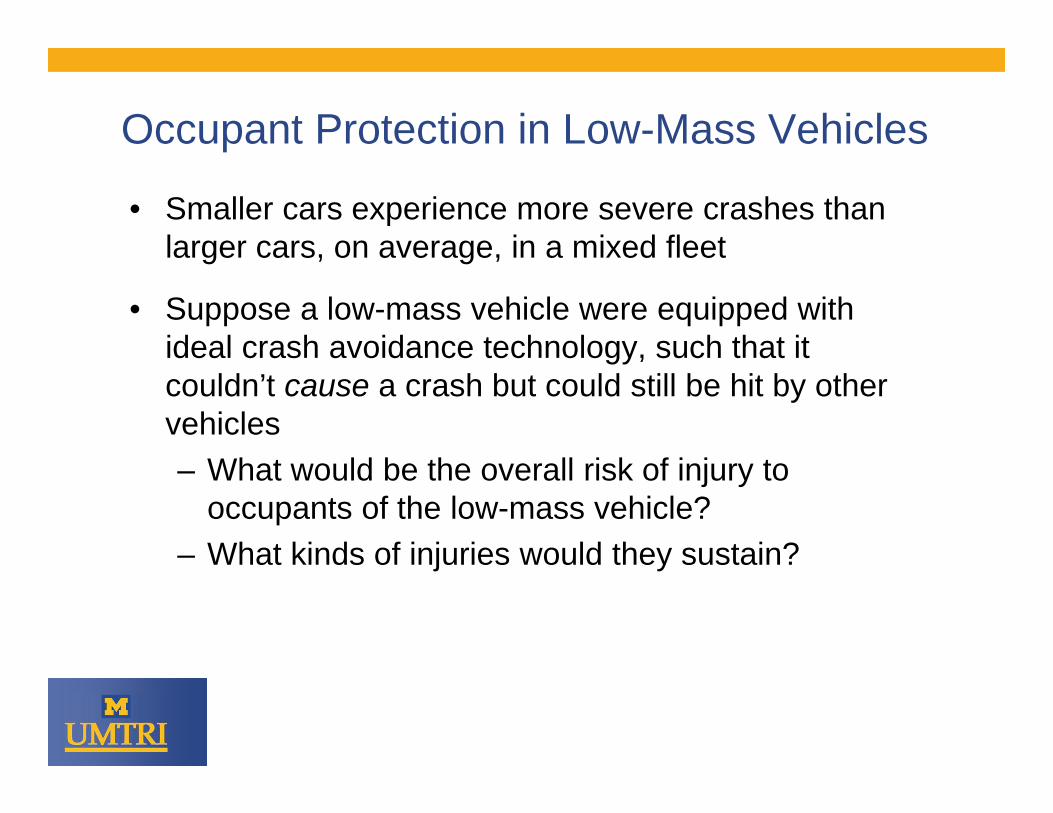
Occupant Protection in Low-Mass Vehicles
• Smaller cars experience more severe crashes than larger cars, on average, in a mixed fleet
• Suppose a low-mass vehicle were equipped with ideal crash avoidance technology, such that it couldn’t cause a crash but could still be hit by other vehicles– What would be the overall risk of injury to
occupants of the low-mass vehicle?– What kinds of injuries would they sustain?
Research Approach
1. Identify crashes that remain for a vehicle that never causes a crash (change in exposure)
2. Identify changes in crash-severity distribution for LMV given a crash (change in risk)
– Average crash severity increases by 80% for a single low-mass vehicle traveling with the current fleet
3. Estimate change in overall injury incidence in each crash type resulting from combination of decreased involvement and increased risk
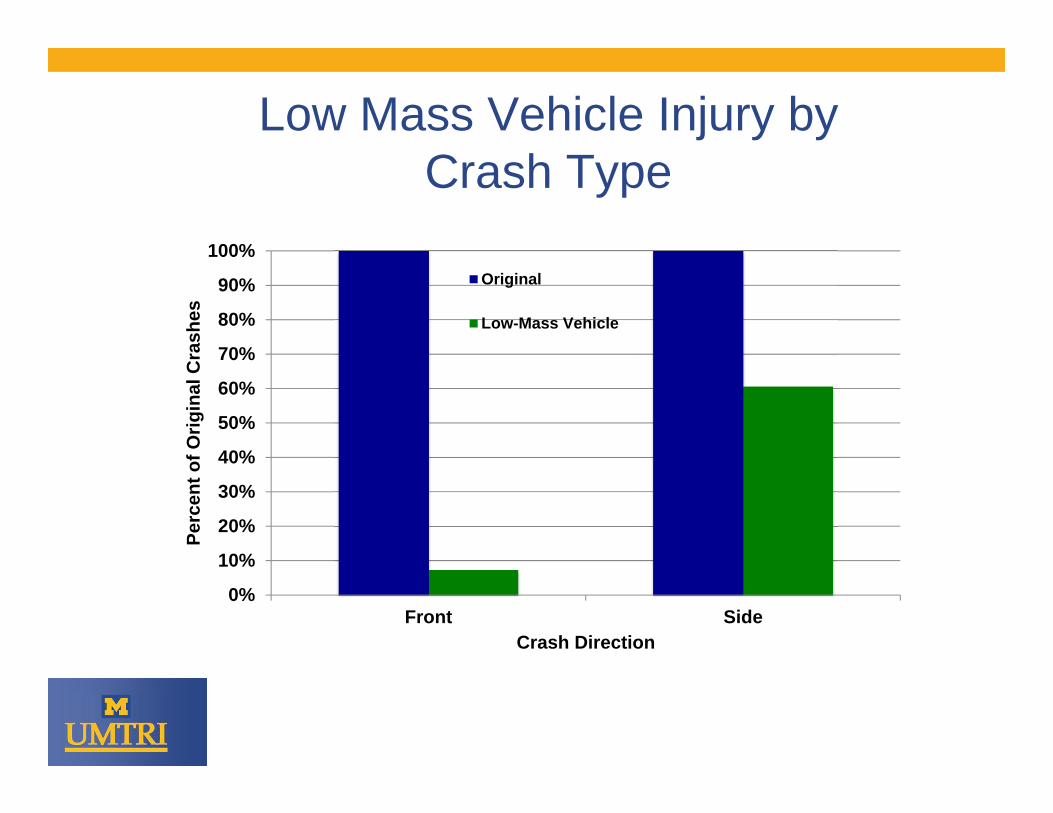
Low Mass Vehicle Injury by Crash Type
0%
10%
20%
30%
40%
50%
60%
70%
80%
90%
100%
Front Side
Perc
ent o
f Orig
inal
Cra
shes
Crash Direction
Original
Low-Mass Vehicle

LMV increased severity of remaining crashes
0.00
0.02
0.04
0.06
0.08
0.10
0.12
Front Side
Ris
k of
Hea
d In
jury
Crash Direction
Original
Low-Mass Vehicle

Occupant Protection in a Crash-Avoidance World
• As more vehicles are equipped with forward collision assistance systems (warnings, brake assist or automatic braking), the makeup of frontal collisions will change
– Some crashes are avoided, others are mitigated
• Currently occupant protection is aimed at the 95th
percentile frontal crash severity (~35 mph)
Research Question: How can occupant protection be improved by linking it to information from crash avoidance systems?

Occupant Protection in a Crash-Avoidance World
Computational Modeling
Field Data Analysis
Naturalistic Driving Data Analysis
Integration of Active and Passive Safety

Occupant Protection in a Crash-Avoidance World
• Some crashes will be avoided (ests from 20-40%)
• Crash severity distribution for remaining crashes will shift to lower levels (so most crashes will be milder than current)
• Occupant protection systems “know” when a crash is imminent and can be prepped (e.g., fire pretensioners)
• Systems can also predict impending crash severity, so systems can be optimized (e.g., tune airbag force and timing)

Working with Injury Data in Traffic Safety Research
Improved Injury Response

Automatic Collision Notification and the Injury Severity Prediction Algorithm
EDR
EDR = Event Data RecorderA car’s “black box”

• Used NASS-CDS to predict risk of serious injury given EDR-reportable crash factors
• Algorithm output is continuous (risk from 0-1)
• Cutoff of 0.2 chosen by expert panel and implemented by OnStar
• When serious injury risk >20%, advisor alerts dispatch to high risk of serious injury for faster triage
Automatic Collision Notification and the Injury Severity Prediction Algorithm

Crash Severity
Crash direction
Belt status
1 or 2 events
Vehicle TypeAge
Gender
ModelPredicted
risk of serious injury
Automatic Collision Notification and the Injury Severity Prediction Algorithm

Current work:
1. Refine algorithm to use details of the crash pulse to improve prediction
2. Focus prediction algorithm only on injuries for which timing is critical
3. Determine additional sensors that might enhance algorithm performance (e.g., more occupant sensors, occupant weight sensors, crush sensors in siderails, etc.)
Automatic Collision Notification and the Injury Severity Prediction Algorithm

• Injury data are essential to improving safety at both the policy and technology levels
• Injury is an increasing focus of safety efforts as fatalities drop, but datasets must support development of safety technology and assessment of benefits
• Data linkage between state crash and medical outcome datasets would significantly improve sample sizes and analysis results (linkage to EDR reports would make datasets even better!)
Final Comments

Thanks for your attention.
University of Michigan Transportation Research Institute (UMTRI)
36
Benefits Assessment for Crash Mitigation Technology
Simulation• Identify crash-relevant situations in driving data• Simulate driver non-response and play out until “crash”
occurs• Simulate effect of safety technology
Example: Collision Mitigation Braking in Heavy Trucks

Track Testing

38
Benefits Assessment for Crash Avoidance Technology
Collision Mitigation Braking in Heavy Trucks Simulation
1) Use real-world braking scenarios and simulate out-of-the-loop truck driver to create “crashes” where none actually happened
2) Model injury potential of simulated crashes3) Simulate effect of technology (based on track tests)4) Model reductions in injury

Results….injury reductions
Injury Reductions for CMB (LV Decel and Stopped):
Percent Reduction in Injuries
KilledSerious Injury
Moderate Injury
Minor Injury
Property Damage
Only
CMB1 6.7% 5.8% 4.1% 1.9% -1.6%
CMB3 53.9% 52.7% 50.5% 46.1% 14.0%