Embed Size (px)
Citation preview
USING INFRA-RED MOTION CAPTURE DATA TO MEASURE THE BOW PRESSING FORCE IN
BOWED STRING INSTRUMENTS
Raquel Victoria Baez Fernández
MASTER THESIS UPF/ 2013
Master in Sound and Music Computing
Master thesis supervisor:
Esteban Maestre
Department of Information and Communication Technologies
Universitat Pompeu Fabra, Barcelona

II
Using infra-red motion capture data to measure the bow pressing force in bowed string instruments
Raquel Victoria Baez Fernández
Music Technology Group Universitat Pompeu Fabra Tanger, 122-140, 3rd Floor 08018 Barcelona, SPAIN. Master’s thesis
Abstract: A method for estimation of bow pressing force is proposed. Infra-red motion capture data are processed and some descriptors are computed; tilt angle, bow transversal position, bow deformation and hair ribbon deflection. Using the descriptors, machine learning and the force data observe, a model is obtained and trained in order to estimate the bow pressing force. Several processes were followed to get the highest correlation and a lower error. The best results were obtained using a classification process of the data into “force” and “no force” existing, followed by a regression process. The models obtained were used with data of real performance but the result wasn’t good. The movement of the bow during calibration process and real performance data is different, and the calibration bow movement was done by non-musician, so it could be possible that the calibration data doesn’t cover all the possible behave of the bow as in a real performance.
Copyright: © 2013 Raquel Victoria Baez Fernández. This is an open-access document distributed under the terms of the Creative Commons Attribution License 3.0 Unported, which permits unrestricted use, distribution, and reproduction in any medium, provided the original author and source are credited.
IV
V
Acknowledgements
I wish to thank my supervisor Esteban for his guidance and advice, also thank to Marco and Jie to help me during the thesis. Also thank my classmates for sharing with them the master and the stay in Barcelona, without them this experience wouldn’t be such as fun. Thanks to my flatmate for be my second family and thank to David for the amazing 3D bow pictures.
Thank to my family, for their confidence in me and their support during this hard year. And finally thank to Xavier Serra and MTG for let me be part of SMC master.

VI
VII
Contents
1. Introduction…………………………………………………………………………….1
1.1 Motivation……………………………………………………………………1
1.2 Goals…………………………………………………………………………2
1.3 Structure of the thesis………………………………………………………..2
2. State of the art…………………………………………………………………………3
2.1 Violin…………………………………………………………….…………..3
2.2 Bowing force……………………………...……………………….…………4
3. Methodology……………………………………………………………………...……9
3.1 Data processing……………………………………………………………..9
3.1.1 Motion Capture data…………………...……………………………..9
3.1.2 Data force during calibration process……………………………….10
3.1.3 Data synchronization ……………………………………………….10
3.1.4 Virtual Hair ribbon end points………………………………………11
3.1.5 Bow descriptors……………………………………………………..13
3.2 Bow force estimation………………………………………………………20
3.2.1 Regression model……………………………………………………20
3.2.2 Classification model…………………………………………………23
3.2.3 Classification and Regression…………....…………………………….24
VIII
4. Results……………………………………………………………………………….27
4.1 Bow descriptors…………………………………………………………….27
4.1.1 Violin…………………………………………………………………27
4.1.2 Viola………………………………………………………………….27
4.1.3 Violoncello………………………………………………………...…29
4.2 Pressing force estimated……………………………………………………30
5. Conclusions………………………………………………………………………….43
5.1 Contributions a conclusions……………………………………………………43
6. Appendix……………………………………………………………………………..45
7. Bibliography………..………………………………………………………………..53
IX
CHAPTER 1: INTRODUCTION
1
Chapter 1
Introduction
A score is only a piece of paper without a performer. The performer has de power to
bring to live the music writes in this paper.
The score has the composer’s indications and the performer has to interpret them. The
aim of some indications are expression, like dynamic, piano, forte, etc., and other
indications are for gestures, like staccato, legato, pizzicato, etc. All the musicians know
the meaning of each indication, but each performer plays them in different way. The
composition could have different meanings depending on how it’s performed.
The quality of a performer depends on the way of play a musical composition and how
the musician transmits emotions with his/her performance.
1.1 Motivation
Music performance has been always in the point of view of research to try to understand
how the physical action applied by the performer affects to the sound and the instrument
behavior. Thus computational performance approaches appears.
Within computational performance modeling, four main tasks can be differentiated:
measuring, analysis, modeling and synthesis. Measuring deals with acquiring data from
real performance, i.e. note onset times, blowing pressure, pitch or blow velocity. Two
main methods exist for acquiring data, direct or indirect acquisition. For example, to
know what the position of a finger is when you are playing the guitar, it can do it
CHAPTER 1: INTRODUCTION
2
directly using a camera or a capacitive sensor, or indirectly using the pitch from the
audio.
The following step is to analyze the data in order to find some similarity with reality.
Then a model could be generating to predict patterns or behaviors of the instruments.
And finally it can be generate a synthetic performance from the model.
Bowed string instruments are one of the most difficult instrument to play, to measure
and to synthesize because the complexity of how it is performance. The most difficult
parameter to measure in bowed string instrument is the force.
This project is focused on measuring and analysis force during violin performance.
1.2 Goals
Obtain a method to estimate the bowing pressing force, depending on the bow
deformation, bow position, tilt and pseudo force applied.
This aims are related to a sort of secondary goals:
1. State of the art review of bowing force and fingering force.
2. Bowing force:
a. Analysis and identification of motion capture data from calibration
process.
b. Extraction of descriptors from motion captures data to calculate the bow
deformation, position and tilt.
c. Develop of a regression model using machine learning to obtain force
estimation from real performance.
1.3 Structure of the thesis
1. Introduction: Motivations and goal.
2. State of the art: relevant existing research about force estimation in bowing.
3. Methodology.
4. Results.
5. Conclusions and future work.
6. Appendix.
7. Bibliography.
CHAPTER 2: STATE OF THE ART
3
Chapter 2
State of the art
2.1 Violin
The violin is a bowed string instrument, so it is played using a bow to control the sound
level, timbre and articulation. Using the left hand, the violinist selects the pitch and
gives expressivity to the performance using, for instance, the vibrato.
The training of a violinist consists basically in get knowledge and control over the
instrument. In the beginning, the student has the challenge of control the finger, wrist,
and elbow movement among others. This movements are tiny and imperceptibles but
with importance in the sound. The violin technique is complex and it covers the position
of the body, the hands, the body movements, the bow position and movement, etc.
The base of a good violin technique is to control a high variety of bow strokes, which
gives variety and richness in musical dynamic of the performance. The bow strokes has
a huge important in the sound and helps to express the violinist personality. Each bow
strokes requires a certain force, a particular position and velocity to have the right
execution. Measure this parameters is a difficult task due the complexity of measure
without any intrusiveness system.
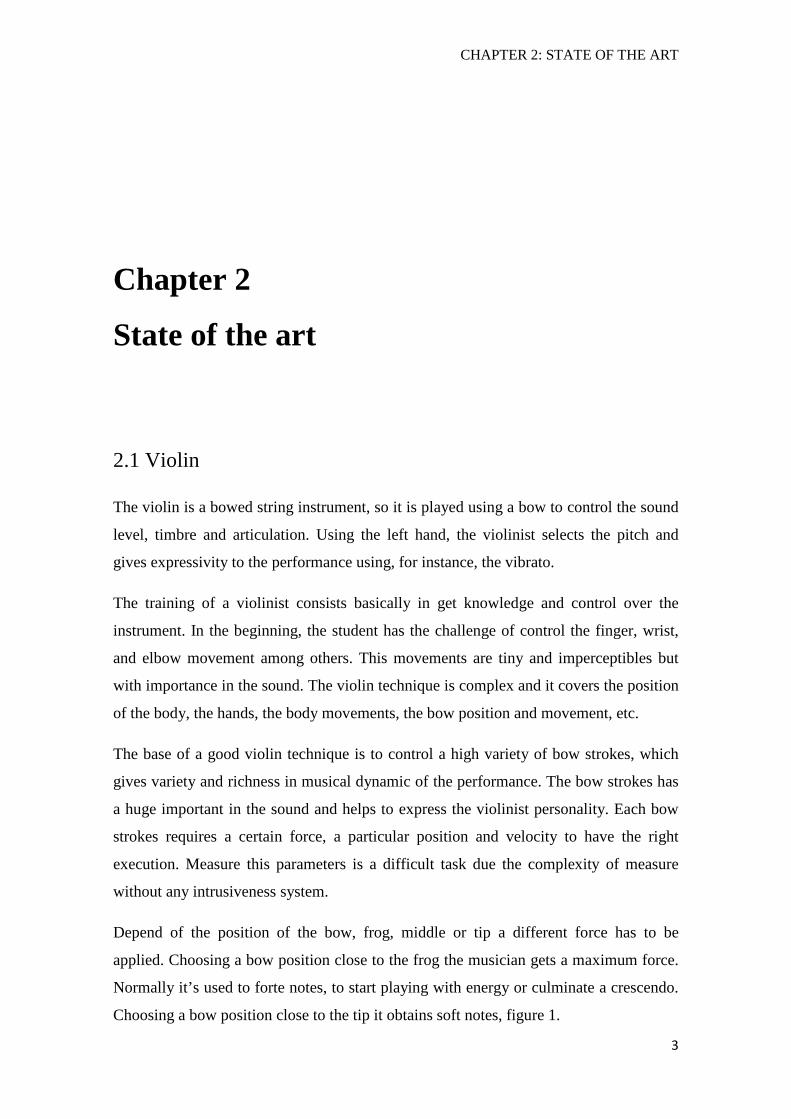
Depend of the position of the bow, frog, middle or tip a different force has to be
applied. Choosing a bow position close to the frog the musician gets a maximum force.
Normally it’s used to forte notes, to start playing with energy or culminate a crescendo.
Choosing a bow position close to the tip it obtains soft notes, figure 1.
CHAPTER 2: STATE OF THE ART
4
Figure 1 Part of a bow
In relation with finger force, the left hand finger press the string against the fingerboard
of the string instrument to control pitch. It’s necessary a force to press the string down
so it barely touches the fingerboard.
The interest of measuring control parameters in playing could help in the study of
musical instruments by physical modeling, the control parameters of the model become
the same as for the real instrument.
2.2 Bowing force
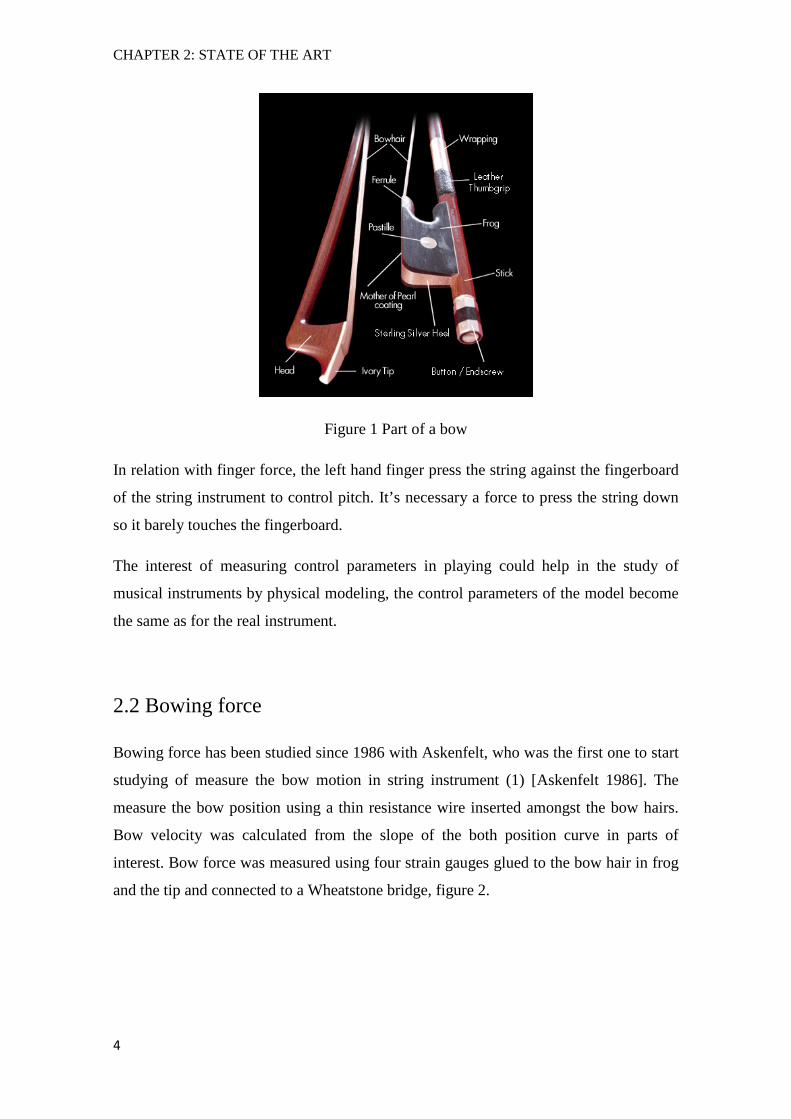
Bowing force has been studied since 1986 with Askenfelt, who was the first one to start
studying of measure the bow motion in string instrument (1) [Askenfelt 1986]. The
measure the bow position using a thin resistance wire inserted amongst the bow hairs.
Bow velocity was calculated from the slope of the both position curve in parts of
interest. Bow force was measured using four strain gauges glued to the bow hair in frog
and the tip and connected to a Wheatstone bridge, figure 2.
CHAPTER 2: STATE OF THE ART
5
Figure 2 Equipment used for registration of bow motion
Paradiso propose a new method to measure the bow position using wireless (2)
[Paradiso 1997]. He built two drivers in the bow and used the antenna in the bridge of
the violin as a receiver. The bow pressing force is measured using a force-sensitive
resistor below the forefinger. The main problem of these systems is the intrusiveness
that affects to the player.
Young measured the bow pressure with strain gages and the bow position was measured
in a similar way as in Askenfelt. The strain gages are the midpoint of the bow stick, the
force data is sent via a wireless to a computer (3) (4) [Young 2002 and Young 2003].
Rasamimanana used accelerometers attached to the bow and force sensitive resistors
(FSRs) to measure of bow pressure, obtaining the strain of the bow hair. This system
can be attached to any bow, so it is a big advantage (5) [Rasamimanana 2003]
Demoucron proposed to use two strain gages, one at the frog and other on the tip, to
detect the bow pressing force in function of the hair ribbons deformation and the bow
position (6)[Demoucron 2006].
Guaus worked in a system to measure the pressing force that a violinist applies to the
string through the bow using two string gages attached one to the frog and the other to
the tip. The deformation of the hair ribbons modify the behavior off an electronic circuit
CHAPTER 2: STATE OF THE ART
6
which was connected to a microcontroller to converts the data to MIDI format
(7)[Guaus 2007].
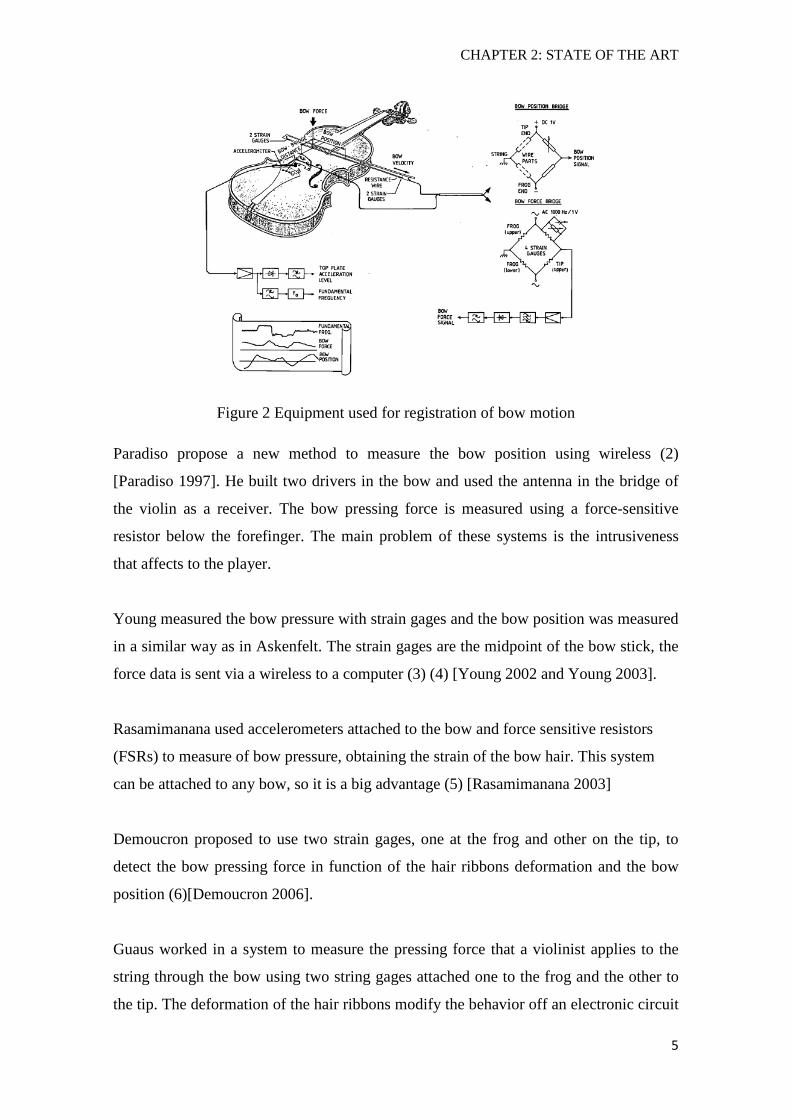
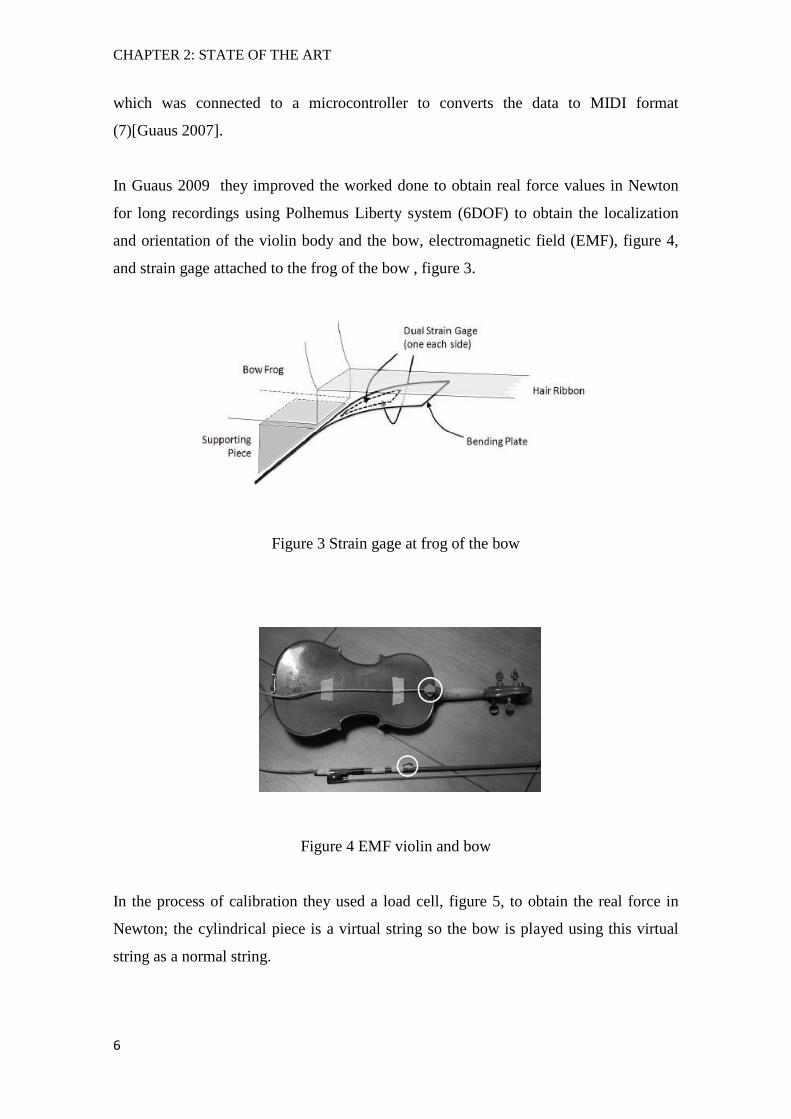
In Guaus 2009 they improved the worked done to obtain real force values in Newton
for long recordings using Polhemus Liberty system (6DOF) to obtain the localization
and orientation of the violin body and the bow, electromagnetic field (EMF), figure 4,
and strain gage attached to the frog of the bow , figure 3.
Figure 3 Strain gage at frog of the bow
Figure 4 EMF violin and bow
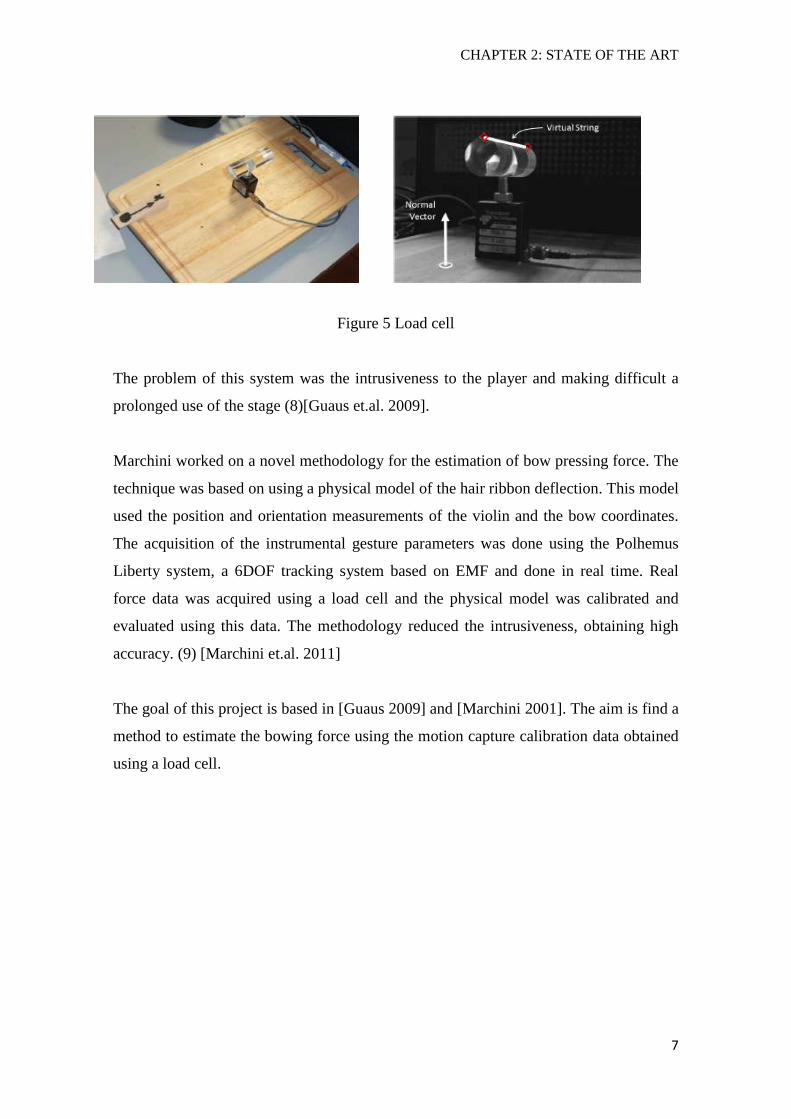
In the process of calibration they used a load cell, figure 5, to obtain the real force in
Newton; the cylindrical piece is a virtual string so the bow is played using this virtual
string as a normal string.
CHAPTER 2: STATE OF THE ART
7
Figure 5 Load cell
The problem of this system was the intrusiveness to the player and making difficult a
prolonged use of the stage (8)[Guaus et.al. 2009].
Marchini worked on a novel methodology for the estimation of bow pressing force. The
technique was based on using a physical model of the hair ribbon deflection. This model
used the position and orientation measurements of the violin and the bow coordinates.
The acquisition of the instrumental gesture parameters was done using the Polhemus
Liberty system, a 6DOF tracking system based on EMF and done in real time. Real
force data was acquired using a load cell and the physical model was calibrated and
evaluated using this data. The methodology reduced the intrusiveness, obtaining high
accuracy. (9) [Marchini et.al. 2011]
The goal of this project is based in [Guaus 2009] and [Marchini 2001]. The aim is find a
method to estimate the bowing force using the motion capture calibration data obtained
using a load cell.
CHAPTER 2: STATE OF THE ART
8
CHAPTER 3: METHODOLOGY
9
Chapter 3
Methodology 3.1 Data Processing
To develop this work, we had infra-red motion capture data and load cell calibration data provided by MTG from SIEMPRE project (Social Interaction and Entrainment using
Music Performance Experimentation) in collaboration with McGill.
The data base consists in recording of violin I’s bow, violin II’s bow, viola’s bow and violoncello’s bow of three different days during force calibration process. Each recording has duration of 1:30 minutes approx. and the sample rate is 300Hz.
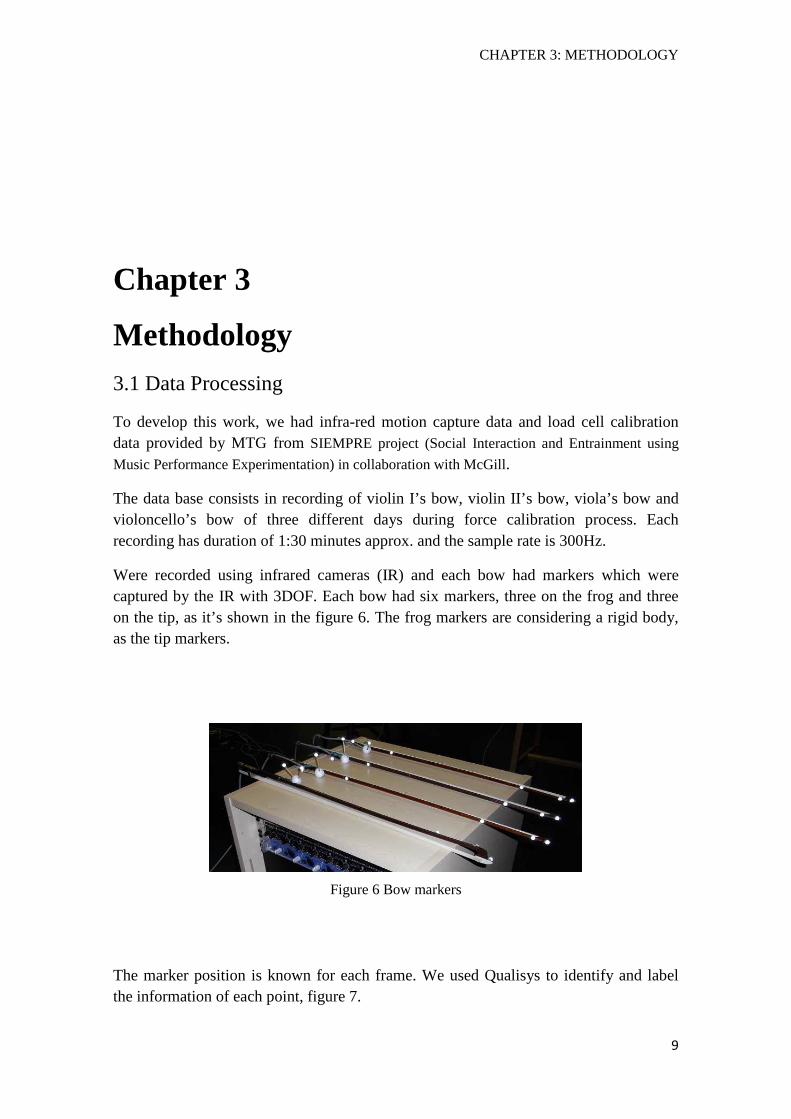
Were recorded using infrared cameras (IR) and each bow had markers which were captured by the IR with 3DOF. Each bow had six markers, three on the frog and three on the tip, as it’s shown in the figure 6. The frog markers are considering a rigid body, as the tip markers.
Figure 6 Bow markers
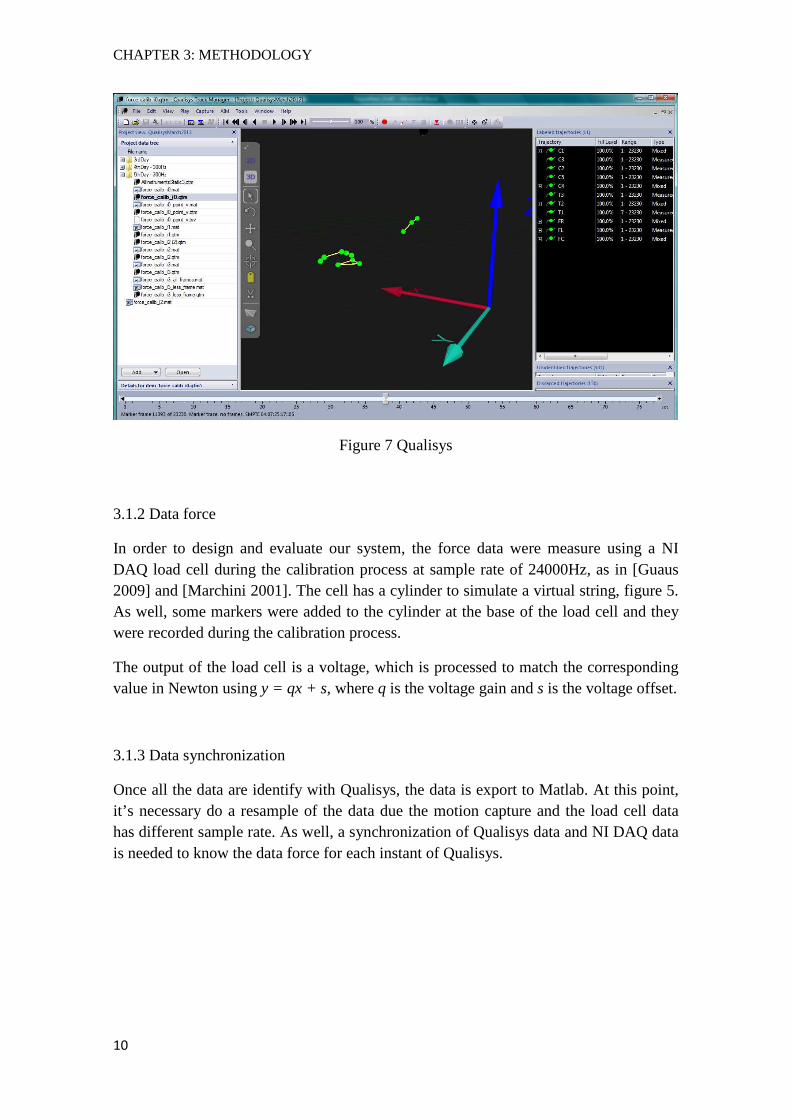
The marker position is known for each frame. We used Qualisys to identify and label the information of each point, figure 7.
CHAPTER 3: METHODOLOGY
10
Figure 7 Qualisys
3.1.2 Data force
In order to design and evaluate our system, the force data were measure using a NI DAQ load cell during the calibration process at sample rate of 24000Hz, as in [Guaus 2009] and [Marchini 2001]. The cell has a cylinder to simulate a virtual string, figure 5. As well, some markers were added to the cylinder at the base of the load cell and they were recorded during the calibration process.
The output of the load cell is a voltage, which is processed to match the corresponding value in Newton using y = qx + s, where q is the voltage gain and s is the voltage offset.
3.1.3 Data synchronization
Once all the data are identify with Qualisys, the data is export to Matlab. At this point, it’s necessary do a resample of the data due the motion capture and the load cell data has different sample rate. As well, a synchronization of Qualisys data and NI DAQ data is needed to know the data force for each instant of Qualisys.
CHAPTER 3: METHODOLOGY
11
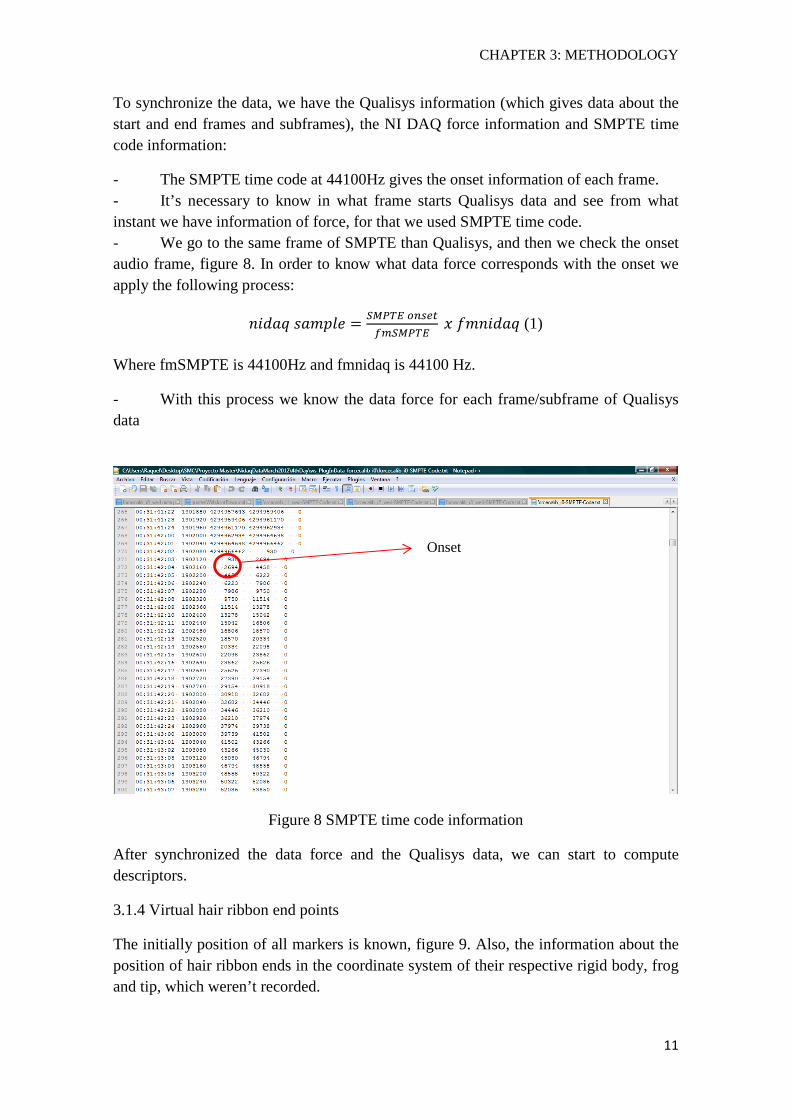
To synchronize the data, we have the Qualisys information (which gives data about the start and end frames and subframes), the NI DAQ force information and SMPTE time code information:
- The SMPTE time code at 44100Hz gives the onset information of each frame. - It’s necessary to know in what frame starts Qualisys data and see from what instant we have information of force, for that we used SMPTE time code. - We go to the same frame of SMPTE than Qualisys, and then we check the onset audio frame, figure 8. In order to know what data force corresponds with the onset we apply the following process:
��������� = ���������
�� ������������ (1)
Where fmSMPTE is 44100Hz and fmnidaq is 44100 Hz.
- With this process we know the data force for each frame/subframe of Qualisys data
Figure 8 SMPTE time code information
After synchronized the data force and the Qualisys data, we can start to compute descriptors.
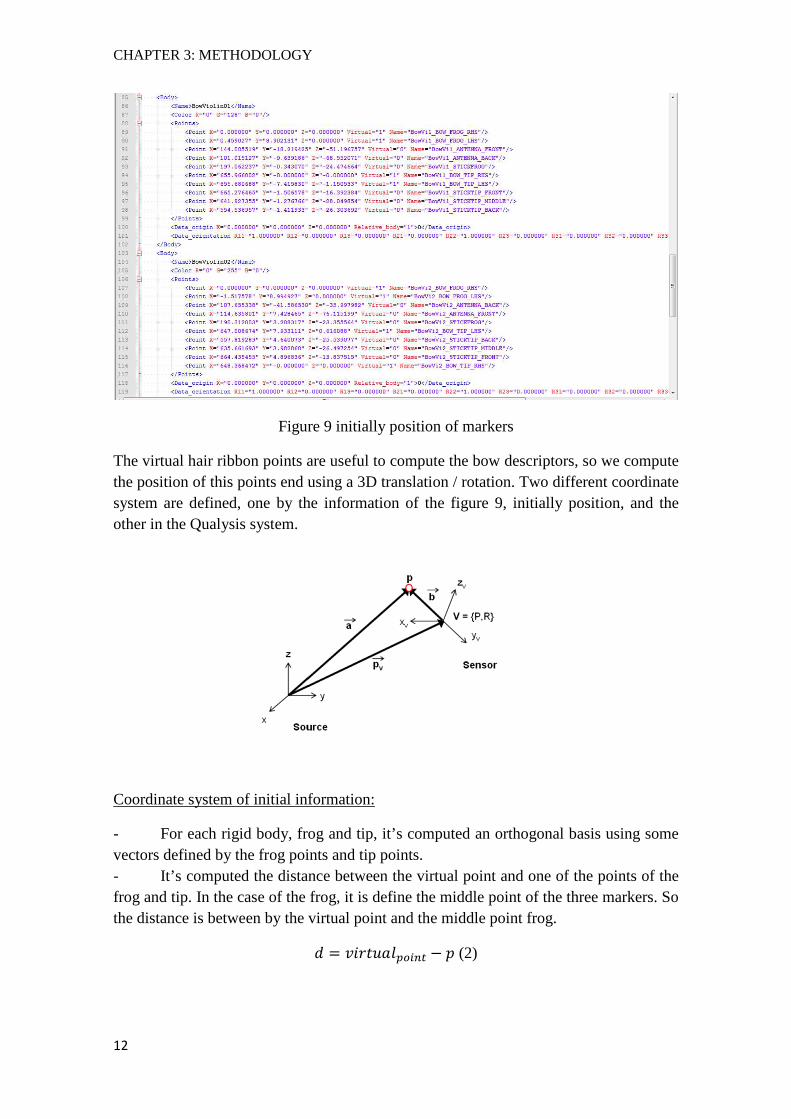
3.1.4 Virtual hair ribbon end points
The initially position of all markers is known, figure 9. Also, the information about the position of hair ribbon ends in the coordinate system of their respective rigid body, frog and tip, which weren’t recorded.
Onset
CHAPTER 3: METHODOLOGY
12
Figure 9 initially position of markers
The virtual hair ribbon points are useful to compute the bow descriptors, so we compute the position of this points end using a 3D translation / rotation. Two different coordinate system are defined, one by the information of the figure 9, initially position, and the other in the Qualysis system.
Coordinate system of initial information:
- For each rigid body, frog and tip, it’s computed an orthogonal basis using some vectors defined by the frog points and tip points. - It’s computed the distance between the virtual point and one of the points of the frog and tip. In the case of the frog, it is define the middle point of the three markers. So the distance is between by the virtual point and the middle point frog.
� = �������� �� ! (2)
CHAPTER 3: METHODOLOGY
13
Where d is the distance between the virtual point and the rigid body, the virtualpoint is the virtual point’s coordinates and p is the coordinate of one of the point on the frog or tip, it depends of in with rigid body is the calculation.
- The coordinates of the virtual point in the local coordinate system is done by:
"��� � =#$��%&'(%
) (3)
Where pointini is the local position of the virtual point in the orthogonal local base, Baselocal and d is the distance defined previously.
- The aim is to define the pointinil in the Qualisys coordinate system of each rigid body.
Qualisys coordinate system:
- The orthogonal base of each rigid body is computed, Baseq and the local position of the virtual point is defined using:
"���* = * + ,���* ∗ "��� � (4)
Where pointq is the position of the virtual point in the Qualisys coordinate system, pq is the selected point to calculate the distance of the virtual point to the rigid body, same point as in the initial coordinate system but express in the actual system, baseq is the orthogonal base of the rigid body and pointini is the localization of the virtual point in the initial coordinate system.
We follow this process to compute the virtual hair ribbons point of the frog and the tip in the Qualisys coordinate system. Finally the descriptors are computed using all the information of Qualisys data and virtual hair ribbons end points.
3.1.5 Bow descriptors
Bow descriptors were computed using the infra-red motion capture data and the virtual hair ribbon points. The descriptor gives the information about tilt angle, bow transversal position, bow stick deformation and hair ribbon deflection.
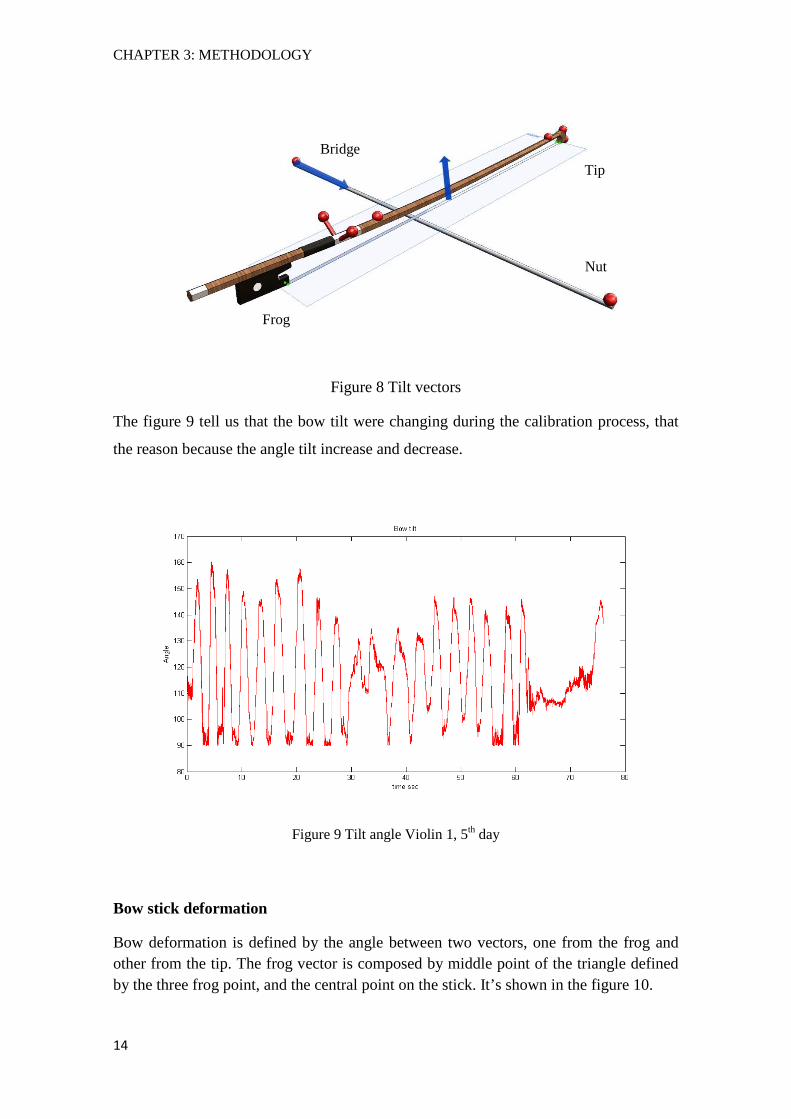
Tilt angle
The tilt is defined by the angle between the string vector and the normal of the frog plane form by the three points on the frog, figure 8.
CHAPTER 3: METHODOLOGY
14
Figure 8 Tilt vectors
The figure 9 tell us that the bow tilt were changing during the calibration process, that
the reason because the angle tilt increase and decrease.
Figure 9 Tilt angle Violin 1, 5th day
Bow stick deformation
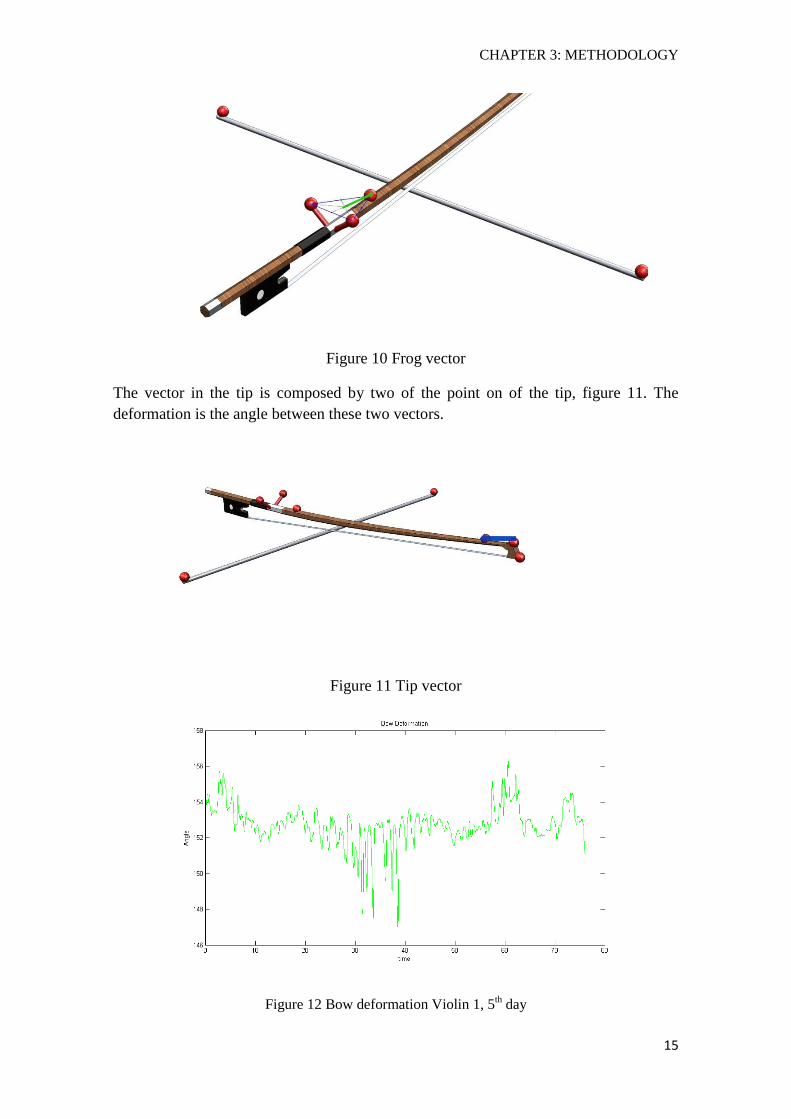
Bow deformation is defined by the angle between two vectors, one from the frog and other from the tip. The frog vector is composed by middle point of the triangle defined by the three frog point, and the central point on the stick. It’s shown in the figure 10.
Tip
Frog
Nut
Bridge
CHAPTER 3: METHODOLOGY
15
Figure 10 Frog vector
The vector in the tip is composed by two of the point on of the tip, figure 11. The deformation is the angle between these two vectors.
Figure 11 Tip vector
Figure 12 Bow deformation Violin 1, 5th day
CHAPTER 3: METHODOLOGY
16
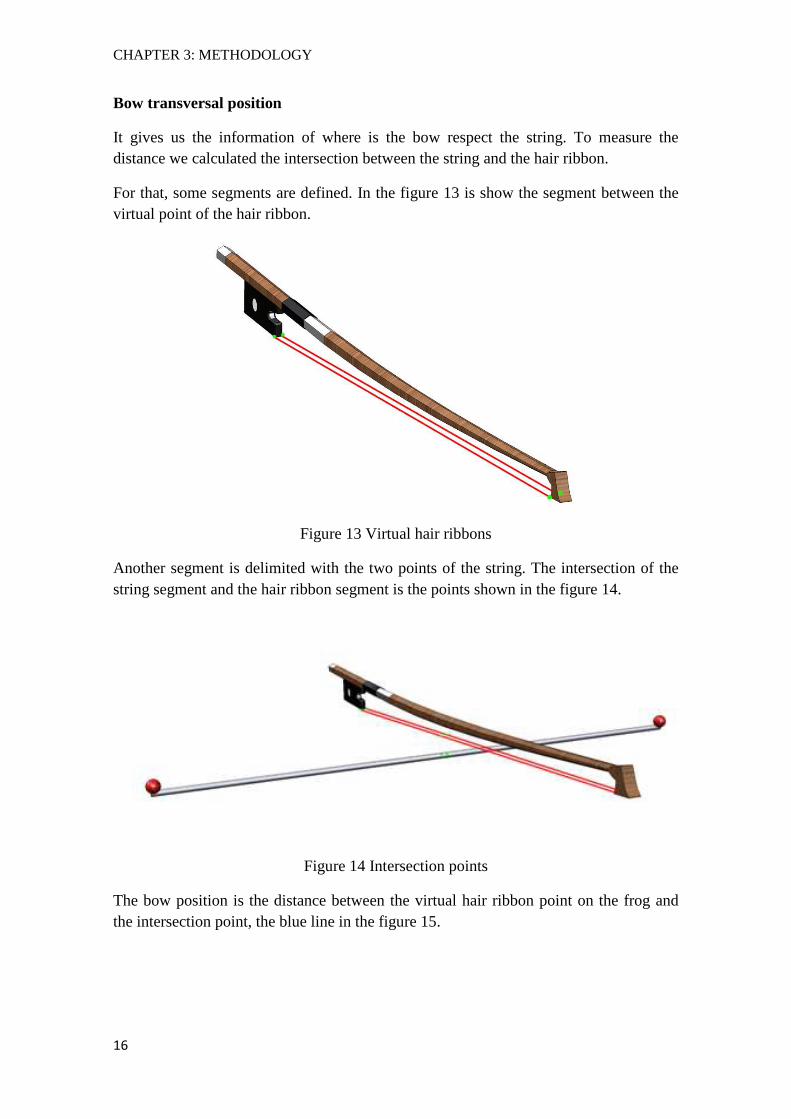
Bow transversal position
It gives us the information of where is the bow respect the string. To measure the distance we calculated the intersection between the string and the hair ribbon.
For that, some segments are defined. In the figure 13 is show the segment between the virtual point of the hair ribbon.
Figure 13 Virtual hair ribbons
Another segment is delimited with the two points of the string. The intersection of the string segment and the hair ribbon segment is the points shown in the figure 14.
Figure 14 Intersection points
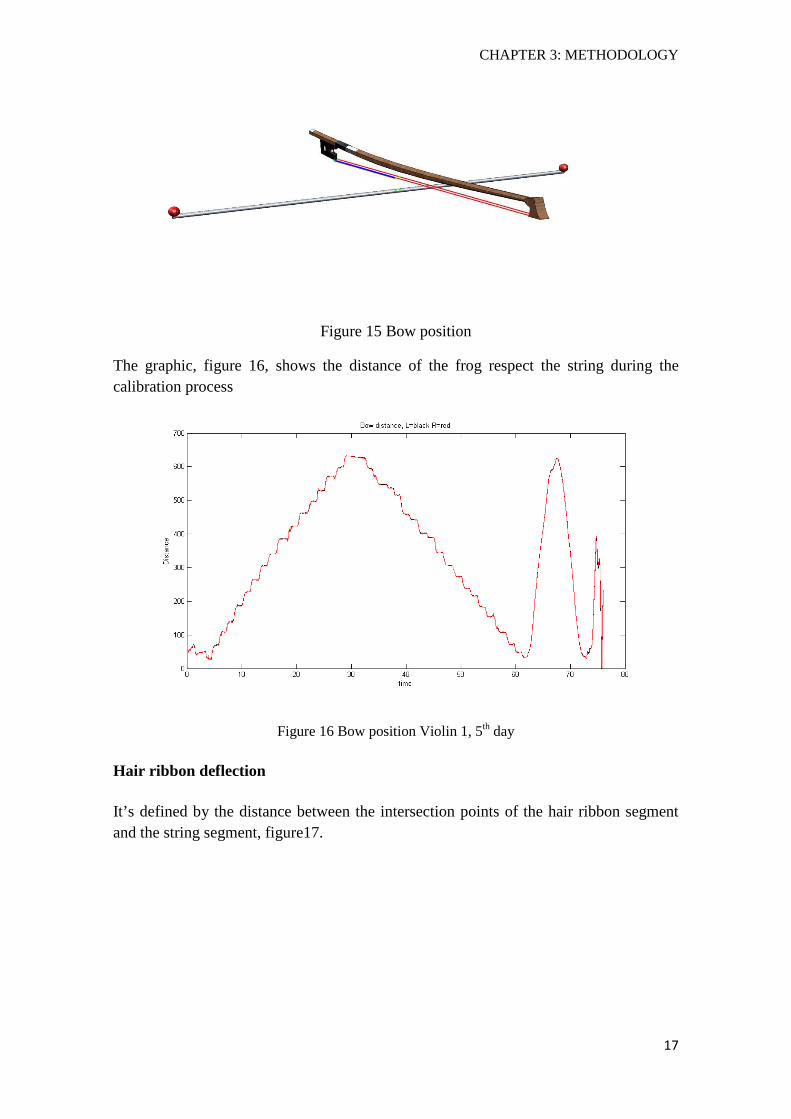
The bow position is the distance between the virtual hair ribbon point on the frog and the intersection point, the blue line in the figure 15.
CHAPTER 3: METHODOLOGY
17
Figure 15 Bow position
The graphic, figure 16, shows the distance of the frog respect the string during the calibration process
Figure 16 Bow position Violin 1, 5th day
Hair ribbon deflection
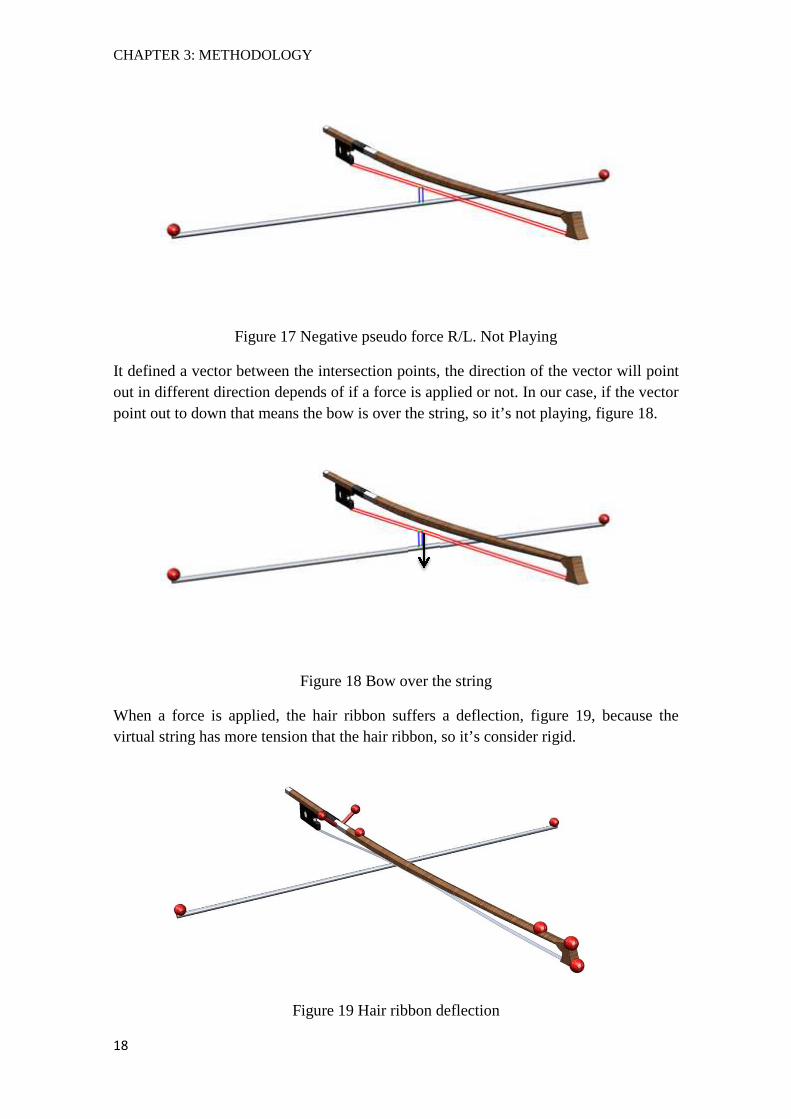
It’s defined by the distance between the intersection points of the hair ribbon segment and the string segment, figure17.
CHAPTER 3: METHODOLOGY
18
Figure 17 Negative pseudo force R/L. Not Playing
It defined a vector between the intersection points, the direction of the vector will point out in different direction depends of if a force is applied or not. In our case, if the vector point out to down that means the bow is over the string, so it’s not playing, figure 18.
Figure 18 Bow over the string
When a force is applied, the hair ribbon suffers a deflection, figure 19, because the virtual string has more tension that the hair ribbon, so it’s consider rigid.
Figure 19 Hair ribbon deflection
CHAPTER 3: METHODOLOGY
19
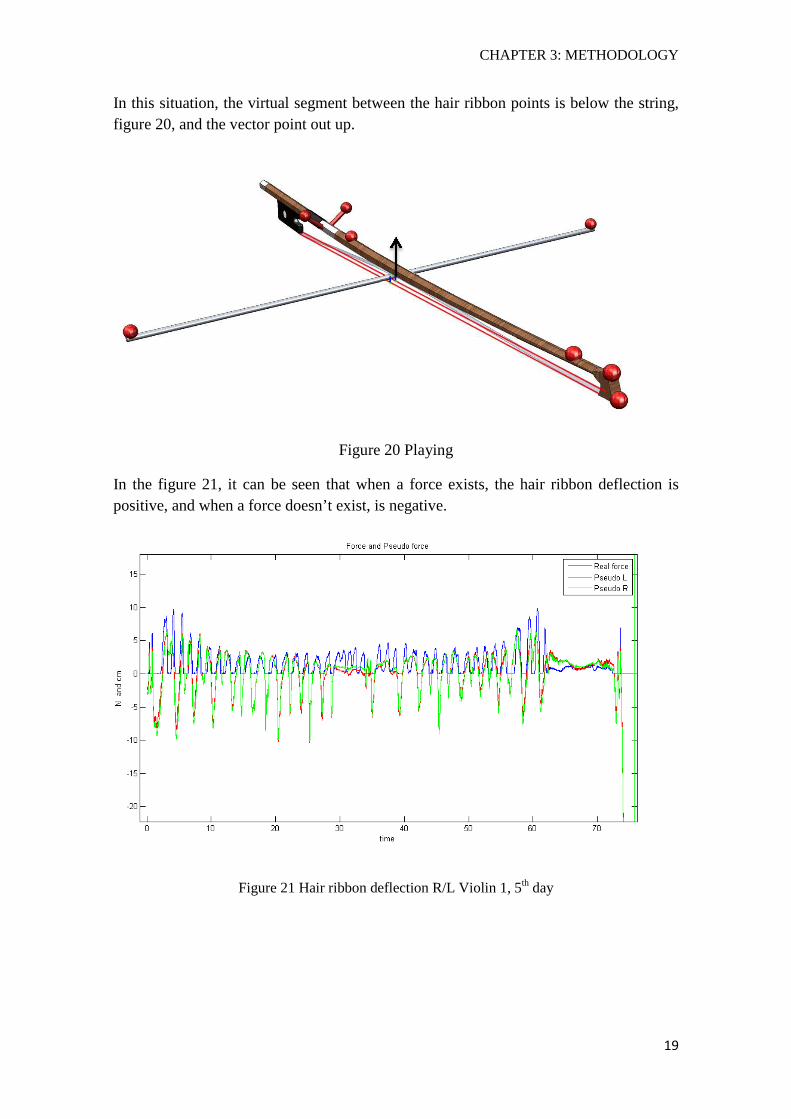
In this situation, the virtual segment between the hair ribbon points is below the string, figure 20, and the vector point out up.
Figure 20 Playing
In the figure 21, it can be seen that when a force exists, the hair ribbon deflection is positive, and when a force doesn’t exist, is negative.
Figure 21 Hair ribbon deflection R/L Violin 1, 5th day
CHAPTER 3: METHODOLOGY
20
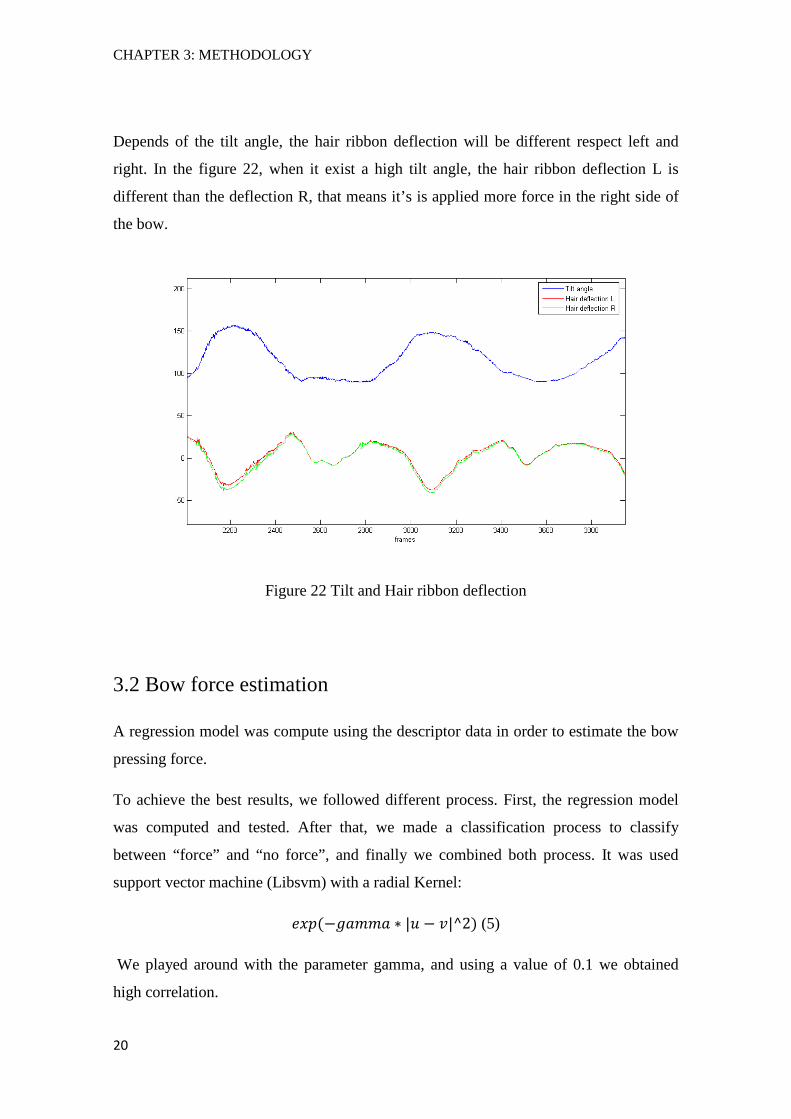
Depends of the tilt angle, the hair ribbon deflection will be different respect left and
right. In the figure 22, when it exist a high tilt angle, the hair ribbon deflection L is
different than the deflection R, that means it’s is applied more force in the right side of
the bow.
Figure 22 Tilt and Hair ribbon deflection
3.2 Bow force estimation
A regression model was compute using the descriptor data in order to estimate the bow
pressing force.
To achieve the best results, we followed different process. First, the regression model
was computed and tested. After that, we made a classification process to classify
between “force” and “no force”, and finally we combined both process. It was used
support vector machine (Libsvm) with a radial Kernel:
��(!/���� ∗ |� ! �|^2) (5)
We played around with the parameter gamma, and using a value of 0.1 we obtained
high correlation.
CHAPTER 3: METHODOLOGY
21
3.2.1 Regression model
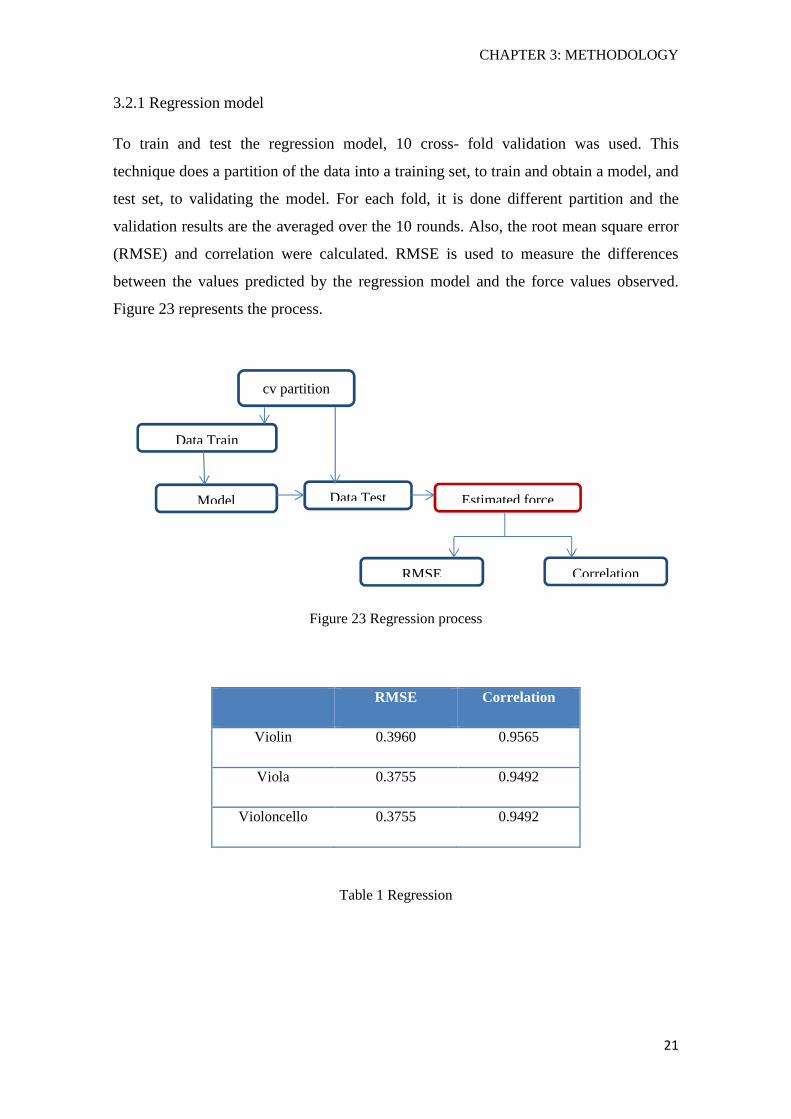
To train and test the regression model, 10 cross- fold validation was used. This
technique does a partition of the data into a training set, to train and obtain a model, and
test set, to validating the model. For each fold, it is done different partition and the
validation results are the averaged over the 10 rounds. Also, the root mean square error
(RMSE) and correlation were calculated. RMSE is used to measure the differences
between the values predicted by the regression model and the force values observed.
Figure 23 represents the process.
Figure 23 Regression process
RMSE Correlation
Violin 0.3960 0.9565
Viola 0.3755 0.9492
Violoncello 0.3755 0.9492
Table 1 Regression
Data Train
Data Test Model Estimated force
cv partition
Correlation RMSE
CHAPTER 3: METHODOLOGY
22
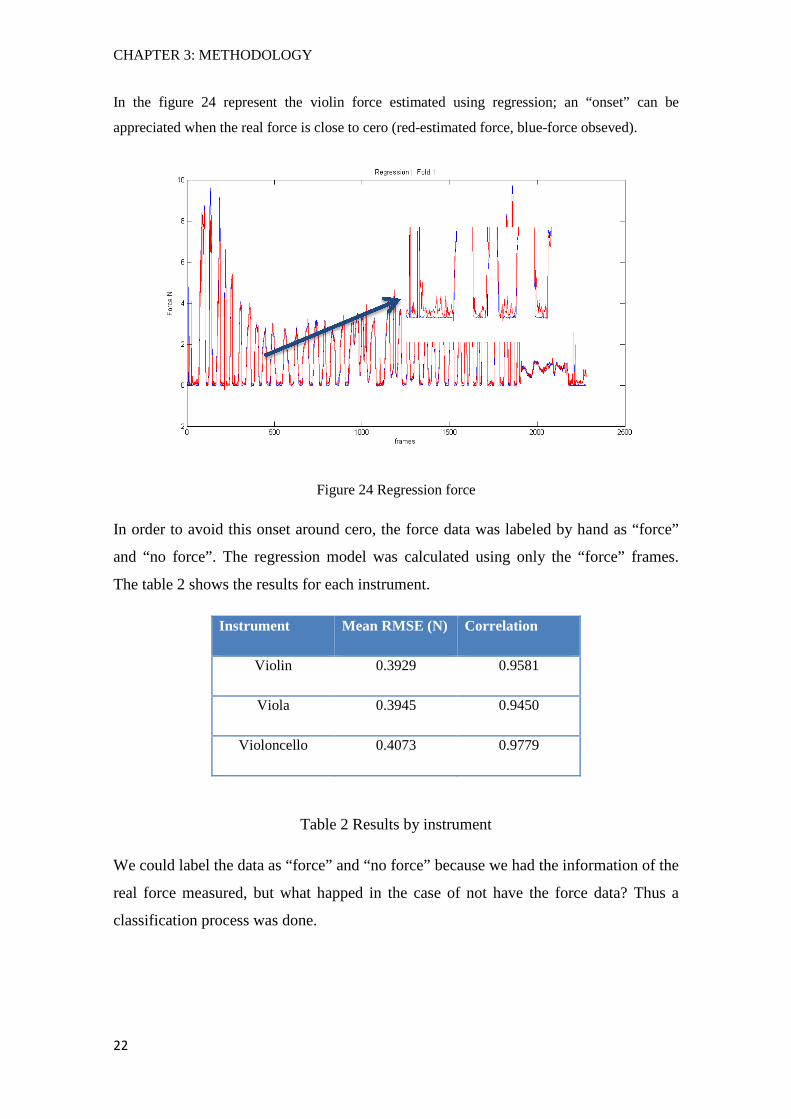
In the figure 24 represent the violin force estimated using regression; an “onset” can be
appreciated when the real force is close to cero (red-estimated force, blue-force obseved).
Figure 24 Regression force
In order to avoid this onset around cero, the force data was labeled by hand as “force”
and “no force”. The regression model was calculated using only the “force” frames.
The table 2 shows the results for each instrument.
Instrument Mean RMSE (N) Correlation
Violin 0.3929 0.9581
Viola 0.3945 0.9450
Violoncello 0.4073 0.9779
Table 2 Results by instrument
We could label the data as “force” and “no force” because we had the information of the
real force measured, but what happed in the case of not have the force data? Thus a
classification process was done.
CHAPTER 3: METHODOLOGY
23
3.2.2 Classification model
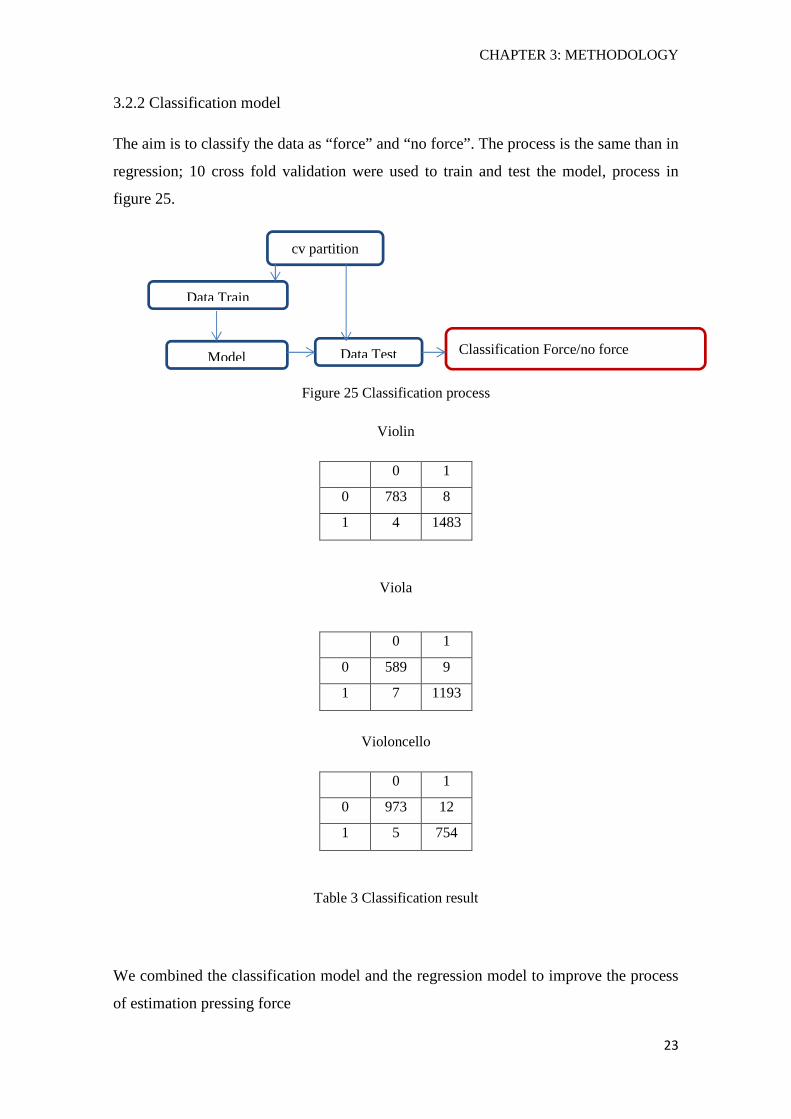
The aim is to classify the data as “force” and “no force”. The process is the same than in
regression; 10 cross fold validation were used to train and test the model, process in
figure 25.
Figure 25 Classification process
Violin
0 1
0 783 8
1 4 1483
Viola
Violoncello
0 1
0 973 12
1 5 754
Table 3 Classification result
We combined the classification model and the regression model to improve the process
of estimation pressing force
0 1
0 589 9
1 7 1193
Data Train
Data Test Model Classification Force/no force
cv partition
CHAPTER 3: METHODOLOGY
24
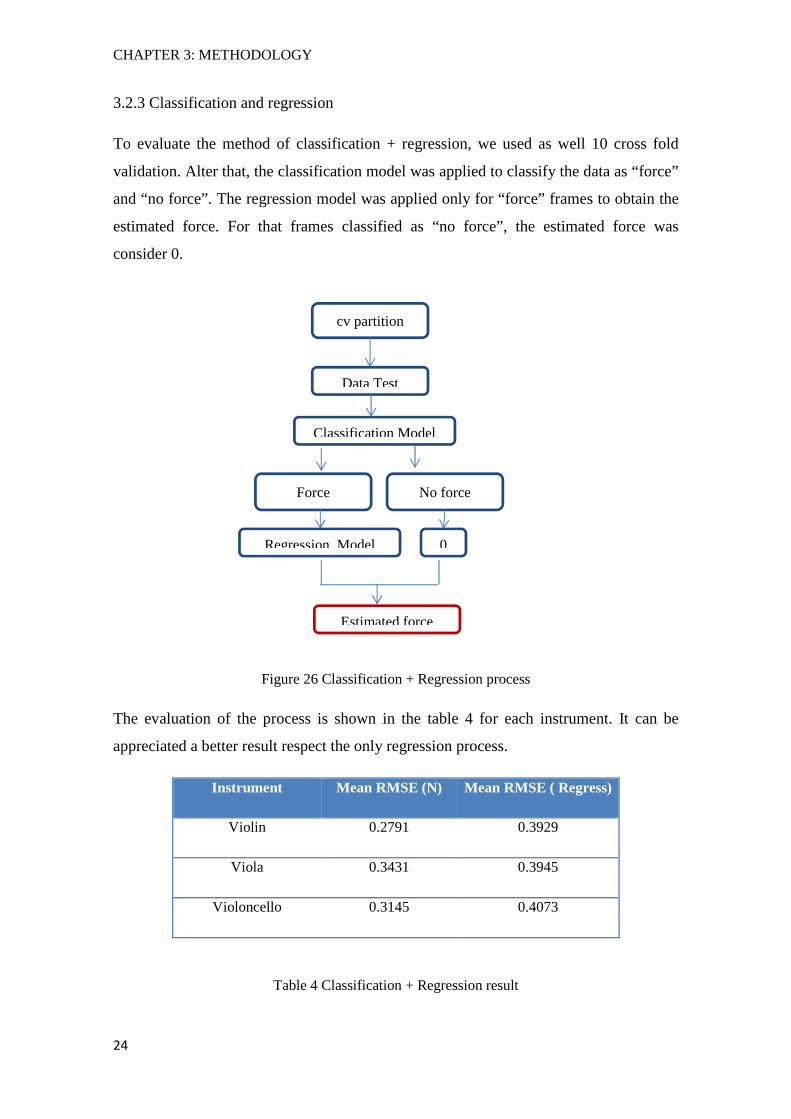
3.2.3 Classification and regression
To evaluate the method of classification + regression, we used as well 10 cross fold
validation. Alter that, the classification model was applied to classify the data as “force”
and “no force”. The regression model was applied only for “force” frames to obtain the
estimated force. For that frames classified as “no force”, the estimated force was
consider 0.
Figure 26 Classification + Regression process
The evaluation of the process is shown in the table 4 for each instrument. It can be
appreciated a better result respect the only regression process.
Instrument Mean RMSE (N) Mean RMSE ( Regress)
Violin 0.2791 0.3929
Viola 0.3431 0.3945
Violoncello 0.3145 0.4073
Table 4 Classification + Regression result
Estimated force
cv partition
Data Test
Classification Model
Force No force
Regression Model 0
CHAPTER 3: METHODOLOGY
25
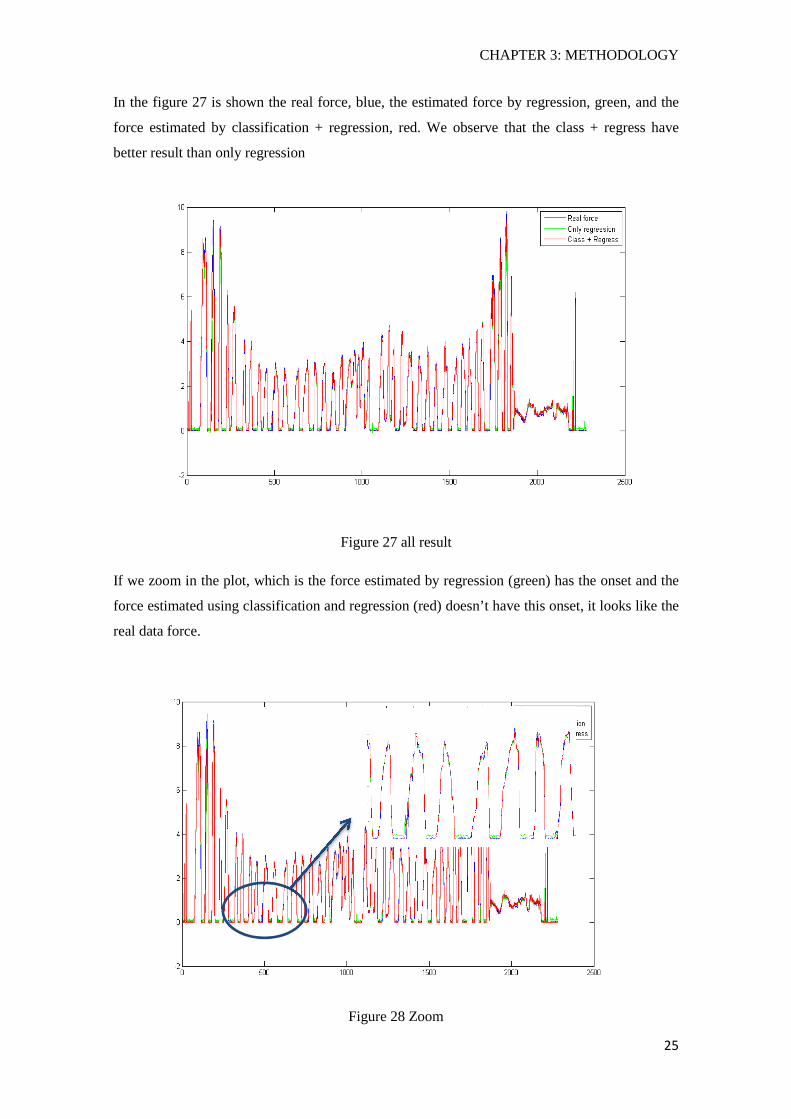
In the figure 27 is shown the real force, blue, the estimated force by regression, green, and the
force estimated by classification + regression, red. We observe that the class + regress have
better result than only regression
Figure 27 all result
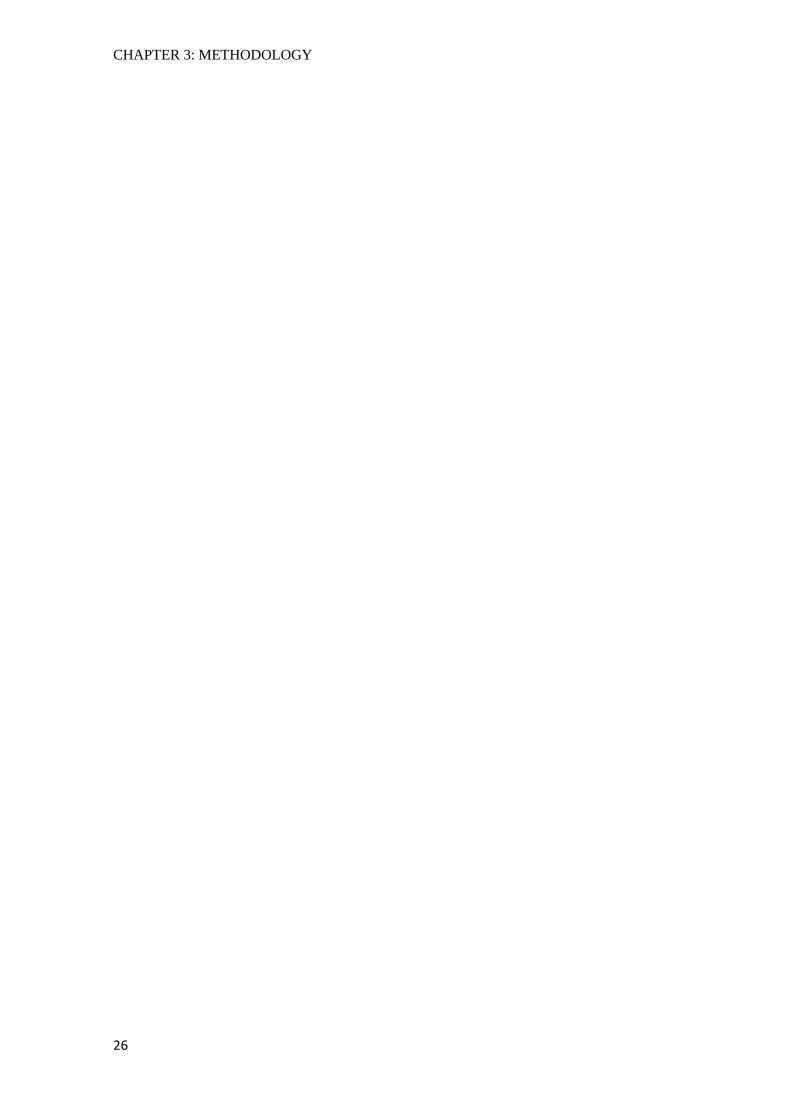
If we zoom in the plot, which is the force estimated by regression (green) has the onset and the
force estimated using classification and regression (red) doesn’t have this onset, it looks like the
real data force.
Figure 28 Zoom
CHAPTER 3: METHODOLOGY
26
CHAPTER 4: RESULTS
27
Chapter 4
Results
4.1 Bow descriptors
The descriptors for violin, viola and violoncello were computed. The results showed in this
chapter corresponds with the recordings of the 5th day of the database, approx. 1:30 min each
one. Thanks to the descriptors we have the information of the movement and the behavior of the
bow during the recordings.
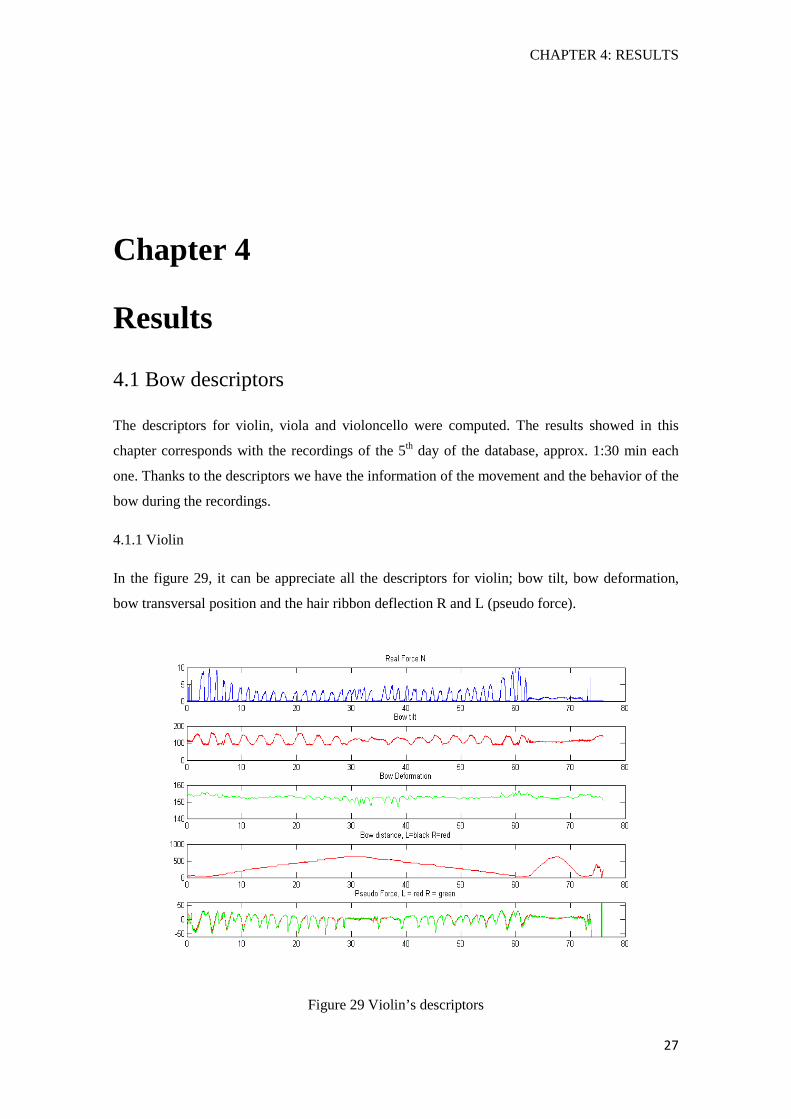
4.1.1 Violin
In the figure 29, it can be appreciate all the descriptors for violin; bow tilt, bow deformation,
bow transversal position and the hair ribbon deflection R and L (pseudo force).
Figure 29 Violin’s descriptors
CHAPTER 4: RESULTS
28
During all the calibration process, the tilt is changing, we can see this in the descriptor, which
increases and decreases.
The bow transversal position indicates the position of the frog respects the string, so with the
plot, we can figure out the movement of the bow during the calibration process (it starts in frog-
tip – frog – tip - frog).
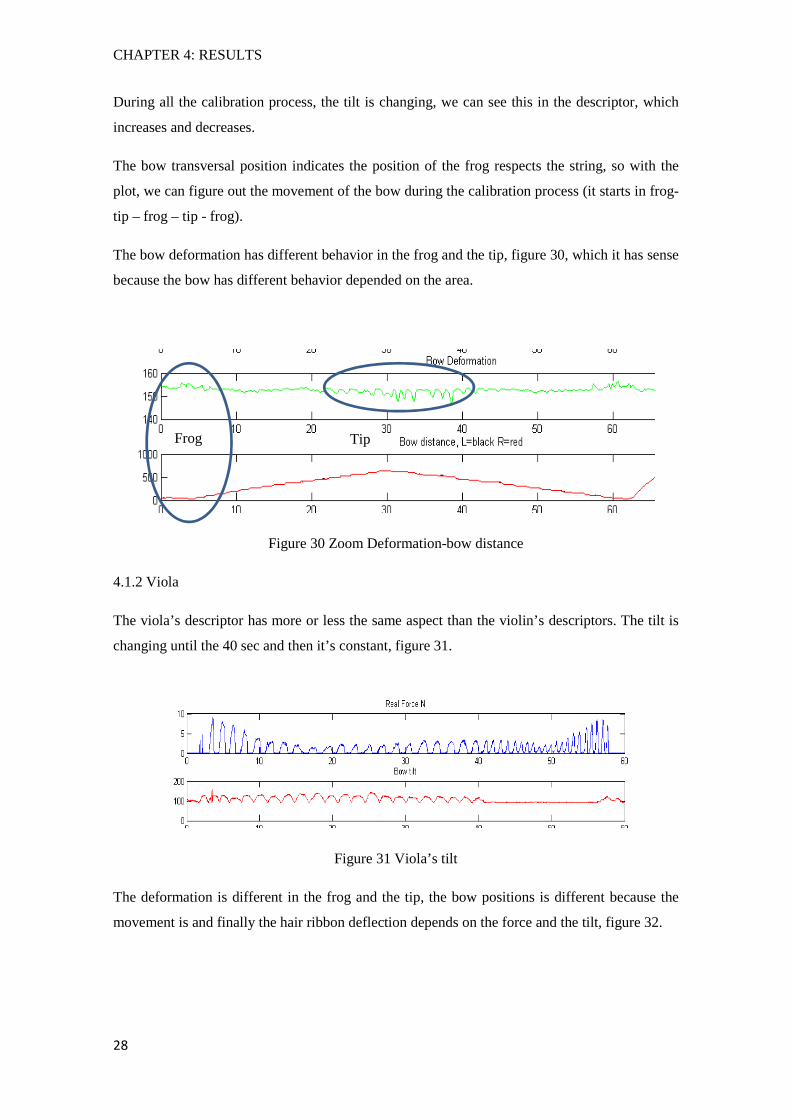
The bow deformation has different behavior in the frog and the tip, figure 30, which it has sense
because the bow has different behavior depended on the area.
Figure 30 Zoom Deformation-bow distance
4.1.2 Viola
The viola’s descriptor has more or less the same aspect than the violin’s descriptors. The tilt is
changing until the 40 sec and then it’s constant, figure 31.
Figure 31 Viola’s tilt
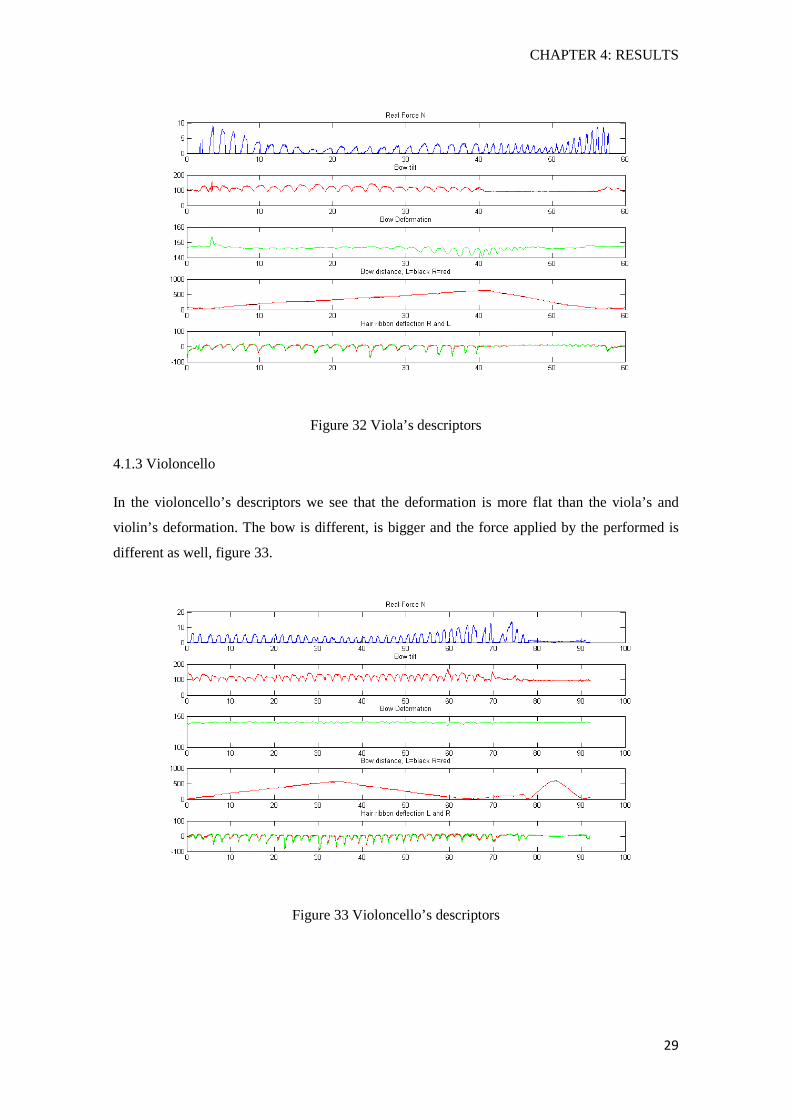
The deformation is different in the frog and the tip, the bow positions is different because the
movement is and finally the hair ribbon deflection depends on the force and the tilt, figure 32.
Frog Tip
CHAPTER 4: RESULTS
29
Figure 32 Viola’s descriptors
4.1.3 Violoncello
In the violoncello’s descriptors we see that the deformation is more flat than the viola’s and
violin’s deformation. The bow is different, is bigger and the force applied by the performed is
different as well, figure 33.
Figure 33 Violoncello’s descriptors
CHAPTER 4: RESULTS
30
4.2 Pressing force estimated
In chapter 3 was explained the process to estimate the pressing bow force. Regression process
and classification plus regression process was compared. To improve the results of the
estimated force, different process to select the best parameters to train and test models were
followed.
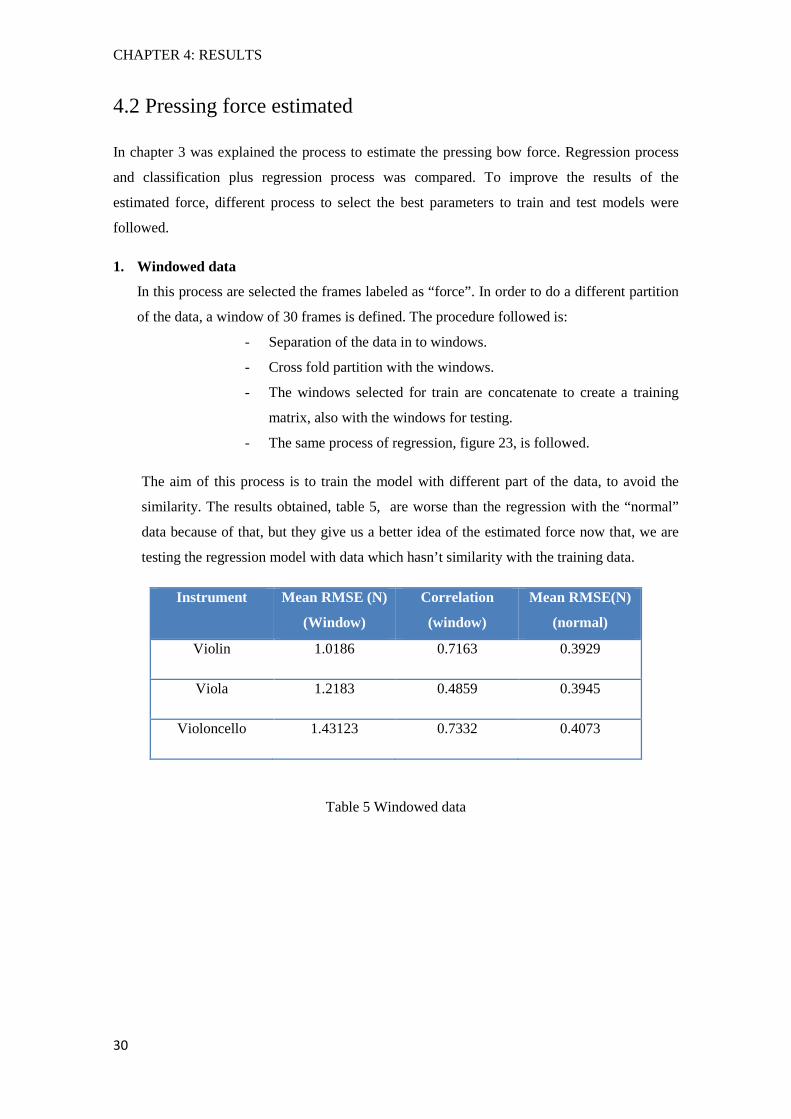
1. Windowed data
In this process are selected the frames labeled as “force”. In order to do a different partition
of the data, a window of 30 frames is defined. The procedure followed is:
- Separation of the data in to windows.
- Cross fold partition with the windows.
- The windows selected for train are concatenate to create a training
matrix, also with the windows for testing.
- The same process of regression, figure 23, is followed.
The aim of this process is to train the model with different part of the data, to avoid the
similarity. The results obtained, table 5, are worse than the regression with the “normal”
data because of that, but they give us a better idea of the estimated force now that, we are
testing the regression model with data which hasn’t similarity with the training data.
Instrument Mean RMSE (N)
(Window)
Correlation
(window)
Mean RMSE(N)
(normal)
Violin 1.0186 0.7163 0.3929
Viola 1.2183 0.4859 0.3945
Violoncello 1.43123 0.7332 0.4073
Table 5 Windowed data
CHAPTER 4: RESULTS
31
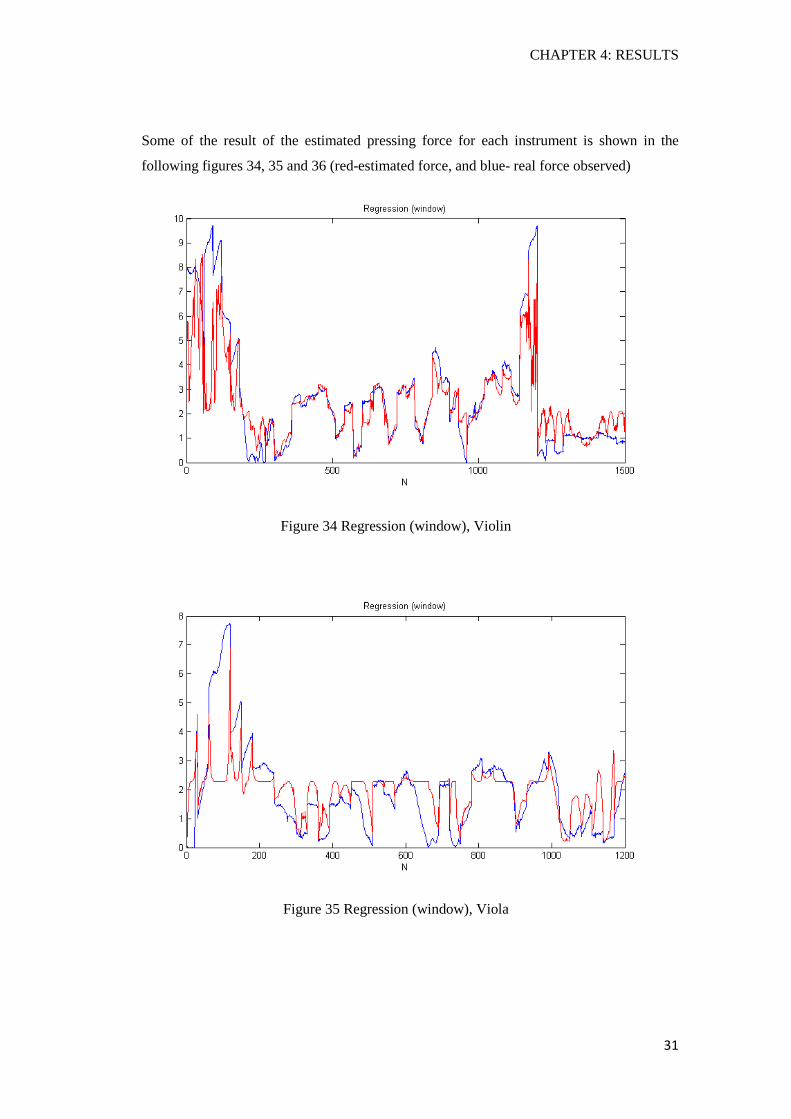
Some of the result of the estimated pressing force for each instrument is shown in the
following figures 34, 35 and 36 (red-estimated force, and blue- real force observed)
Figure 34 Regression (window), Violin
Figure 35 Regression (window), Viola
CHAPTER 4: RESULTS
32
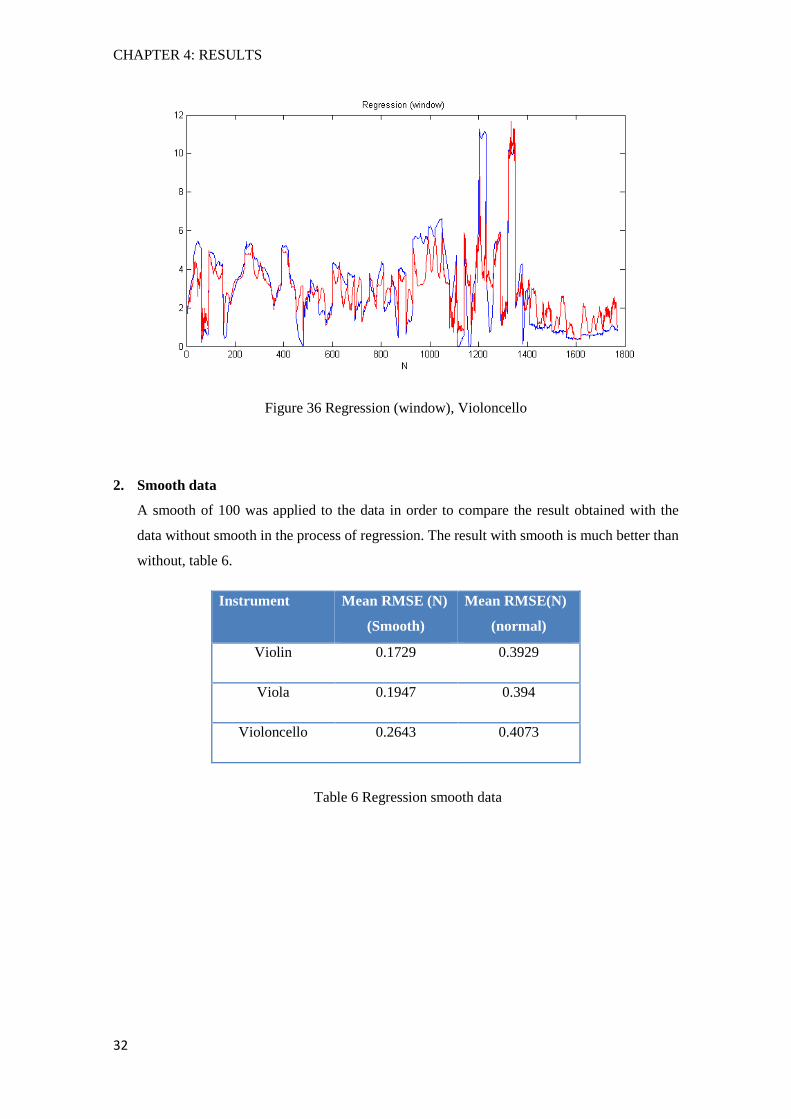
Figure 36 Regression (window), Violoncello
2. Smooth data
A smooth of 100 was applied to the data in order to compare the result obtained with the
data without smooth in the process of regression. The result with smooth is much better than
without, table 6.
Instrument Mean RMSE (N)
(Smooth)
Mean RMSE(N)
(normal)
Violin 0.1729 0.3929
Viola 0.1947 0.394
Violoncello 0.2643 0.4073
Table 6 Regression smooth data
CHAPTER 4: RESULTS
33
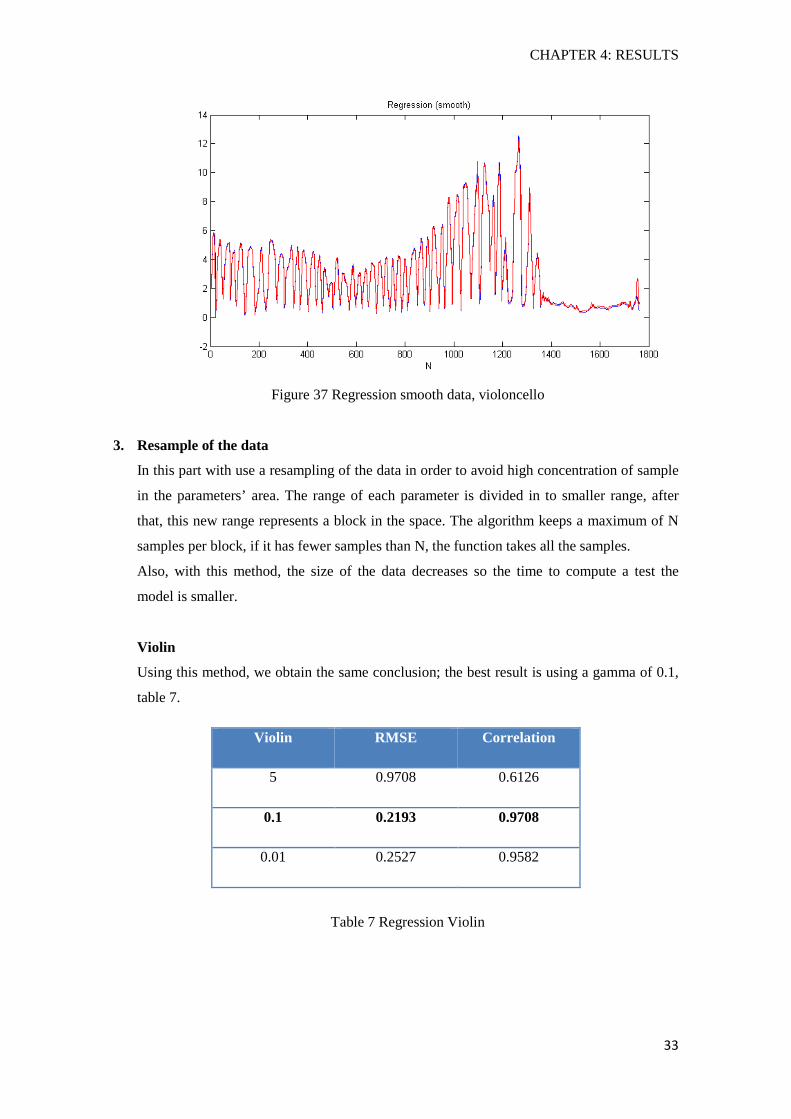
Figure 37 Regression smooth data, violoncello
3. Resample of the data
In this part with use a resampling of the data in order to avoid high concentration of sample
in the parameters’ area. The range of each parameter is divided in to smaller range, after
that, this new range represents a block in the space. The algorithm keeps a maximum of N
samples per block, if it has fewer samples than N, the function takes all the samples.
Also, with this method, the size of the data decreases so the time to compute a test the
model is smaller.
Violin
Using this method, we obtain the same conclusion; the best result is using a gamma of 0.1,
table 7.
Violin RMSE Correlation
5 0.9708 0.6126
0.1 0.2193 0.9708
0.01 0.2527 0.9582
Table 7 Regression Violin
CHAPTER 4: RESULTS
34
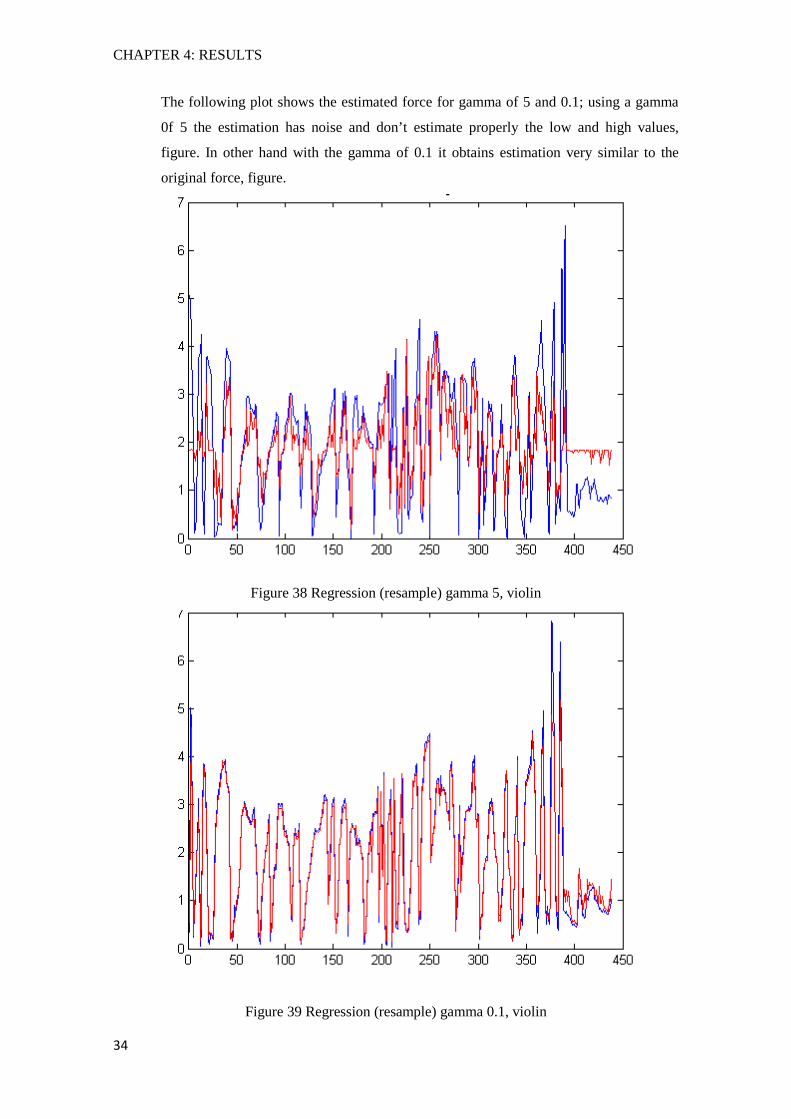
The following plot shows the estimated force for gamma of 5 and 0.1; using a gamma
0f 5 the estimation has noise and don’t estimate properly the low and high values,
figure. In other hand with the gamma of 0.1 it obtains estimation very similar to the
original force, figure.
Figure 38 Regression (resample) gamma 5, violin
Figure 39 Regression (resample) gamma 0.1, violin
CHAPTER 4: RESULTS
35
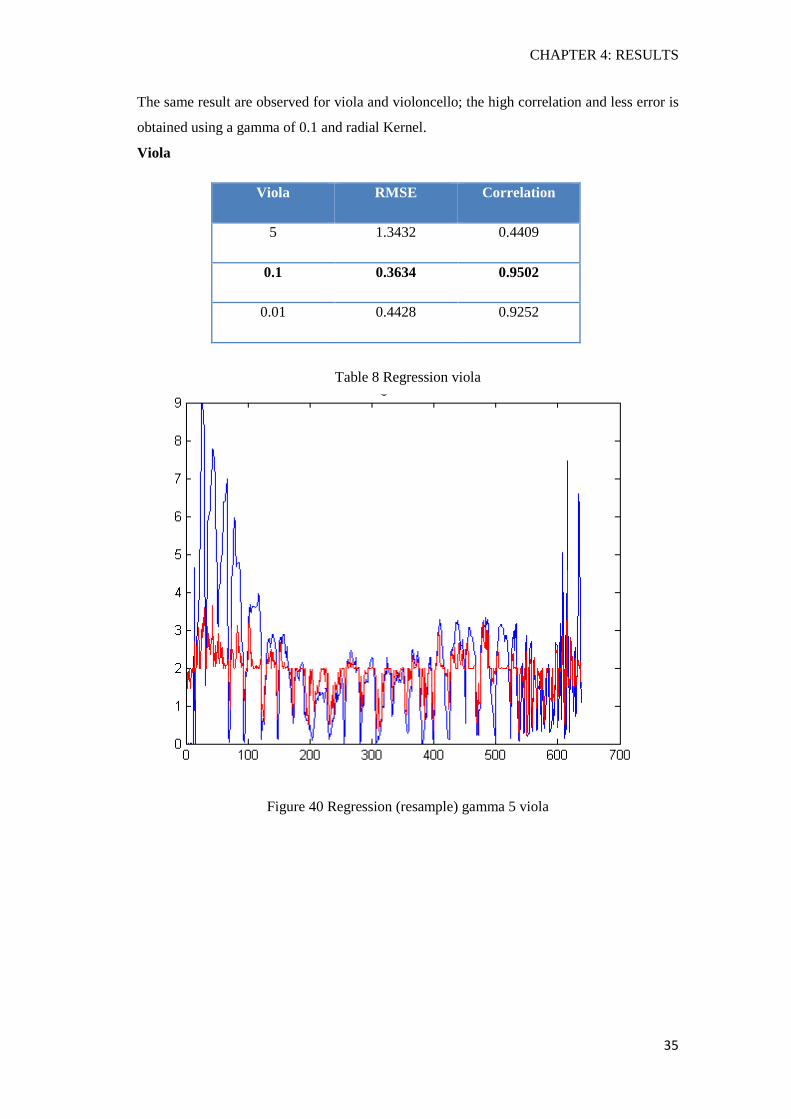
The same result are observed for viola and violoncello; the high correlation and less error is
obtained using a gamma of 0.1 and radial Kernel.
Viola
Viola RMSE Correlation
5 1.3432 0.4409
0.1 0.3634 0.9502
0.01 0.4428 0.9252
Table 8 Regression viola
Figure 40 Regression (resample) gamma 5 viola
CHAPTER 4: RESULTS
36
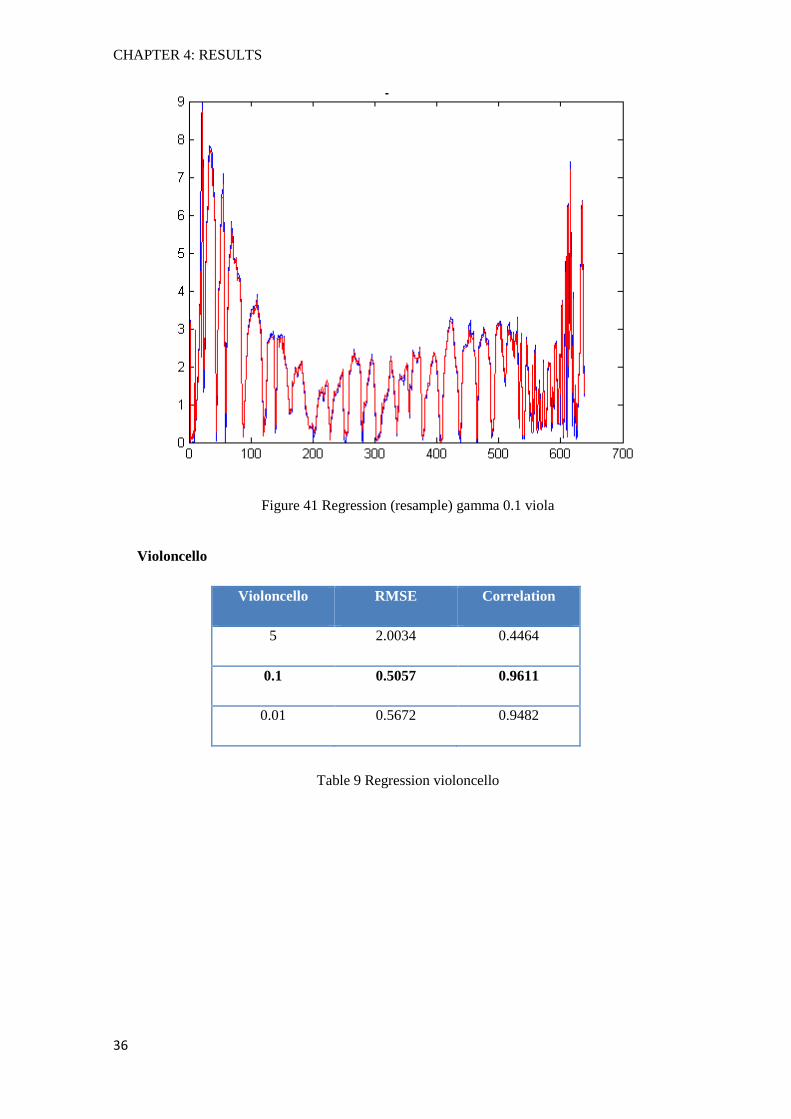
Figure 41 Regression (resample) gamma 0.1 viola
Violoncello
Violoncello RMSE Correlation
5 2.0034 0.4464
0.1 0.5057 0.9611
0.01 0.5672 0.9482
Table 9 Regression violoncello
CHAPTER 4: RESULTS
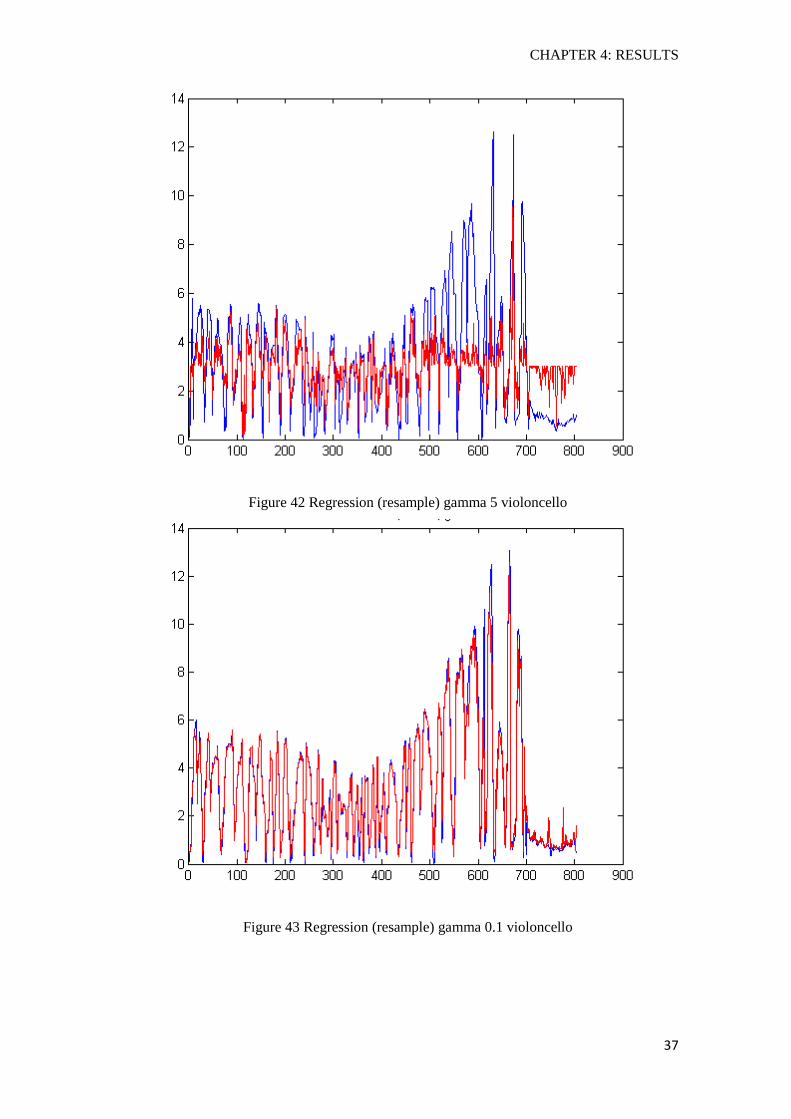
37
Figure 42 Regression (resample) gamma 5 violoncello
Figure 43 Regression (resample) gamma 0.1 violoncello
CHAPTER 4: RESULTS
38
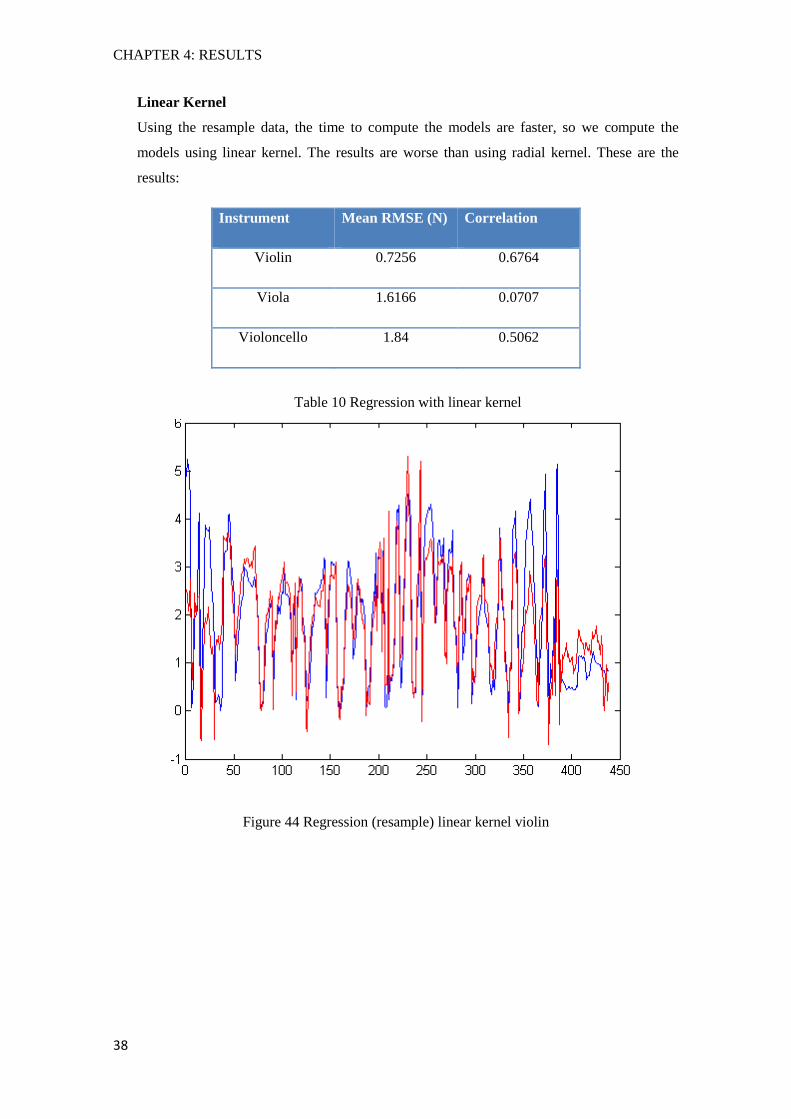
Linear Kernel
Using the resample data, the time to compute the models are faster, so we compute the
models using linear kernel. The results are worse than using radial kernel. These are the
results:
Instrument Mean RMSE (N) Correlation
Violin 0.7256 0.6764
Viola 1.6166 0.0707
Violoncello 1.84 0.5062
Table 10 Regression with linear kernel
Figure 44 Regression (resample) linear kernel violin
CHAPTER 4: RESULTS
39
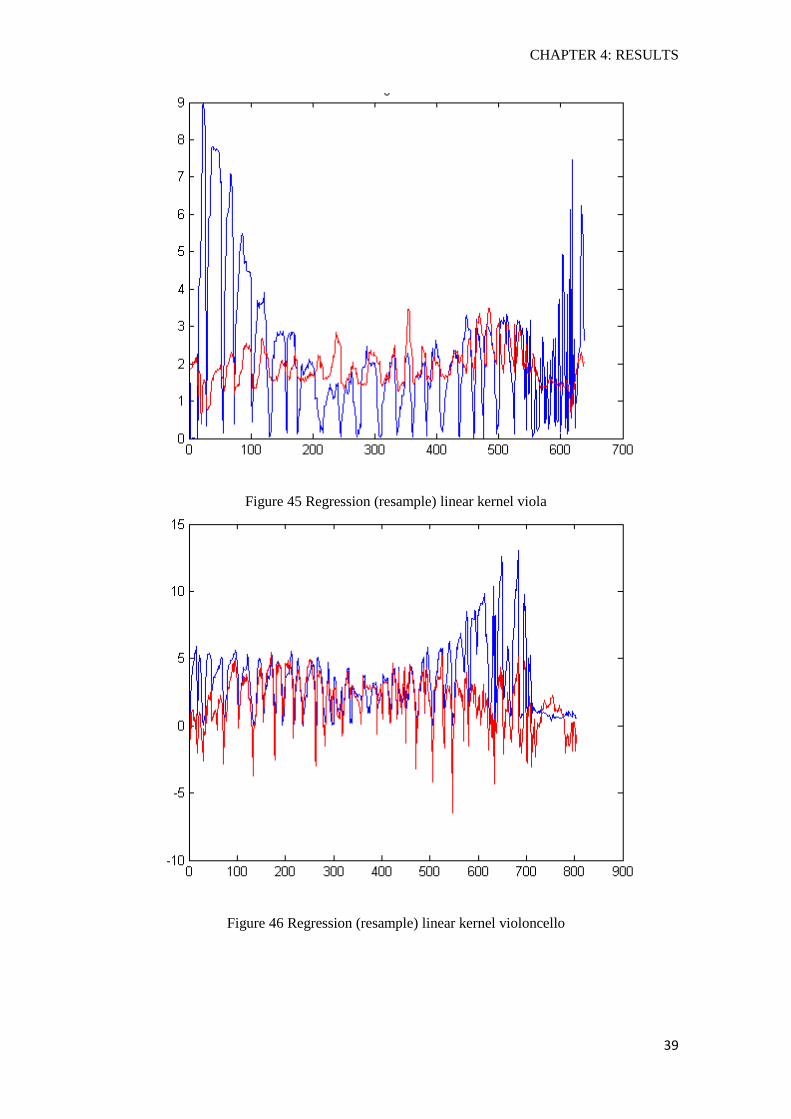
Figure 45 Regression (resample) linear kernel viola
Figure 46 Regression (resample) linear kernel violoncello
CHAPTER 4: RESULTS
40
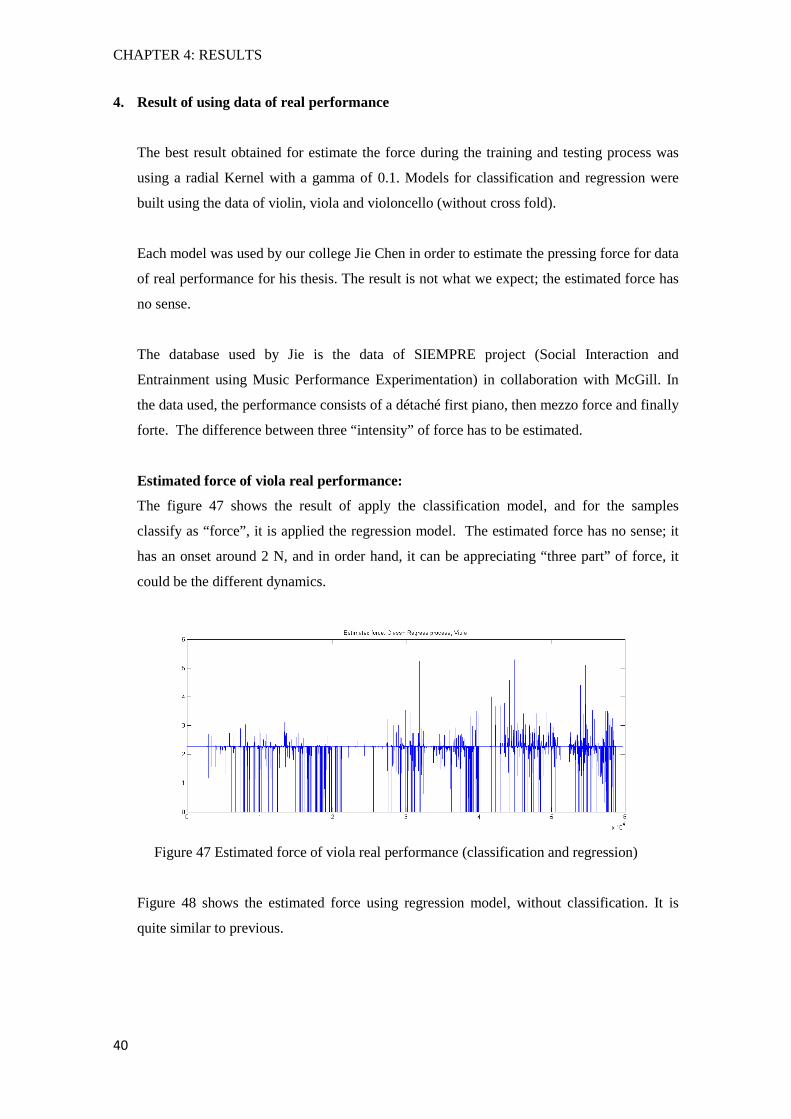
4. Result of using data of real performance
The best result obtained for estimate the force during the training and testing process was
using a radial Kernel with a gamma of 0.1. Models for classification and regression were
built using the data of violin, viola and violoncello (without cross fold).
Each model was used by our college Jie Chen in order to estimate the pressing force for data
of real performance for his thesis. The result is not what we expect; the estimated force has
no sense.
The database used by Jie is the data of SIEMPRE project (Social Interaction and
Entrainment using Music Performance Experimentation) in collaboration with McGill. In
the data used, the performance consists of a détaché first piano, then mezzo force and finally
forte. The difference between three “intensity” of force has to be estimated.
Estimated force of viola real performance:
The figure 47 shows the result of apply the classification model, and for the samples
classify as “force”, it is applied the regression model. The estimated force has no sense; it
has an onset around 2 N, and in order hand, it can be appreciating “three part” of force, it
could be the different dynamics.
Figure 47 Estimated force of viola real performance (classification and regression)
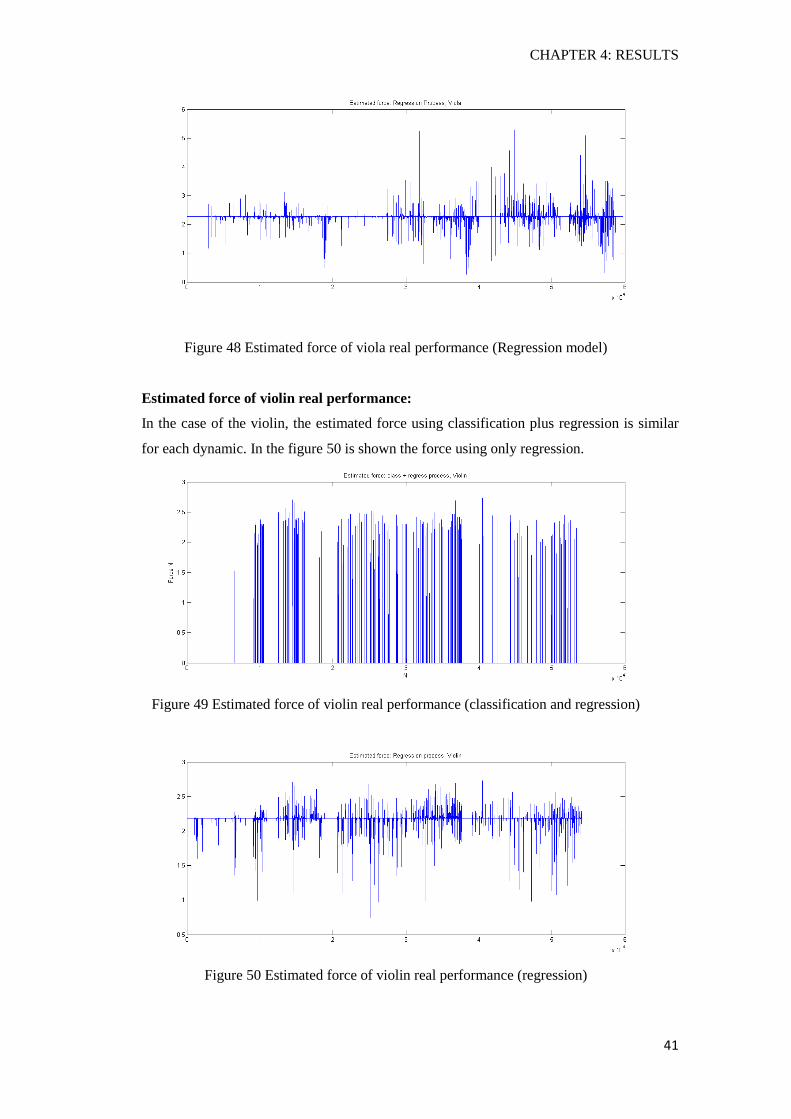
Figure 48 shows the estimated force using regression model, without classification. It is
quite similar to previous.
CHAPTER 4: RESULTS
41
Figure 48 Estimated force of viola real performance (Regression model)
Estimated force of violin real performance:
In the case of the violin, the estimated force using classification plus regression is similar
for each dynamic. In the figure 50 is shown the force using only regression.
Figure 49 Estimated force of violin real performance (classification and regression)
Figure 50 Estimated force of violin real performance (regression)
CHAPTER 4: RESULTS
42
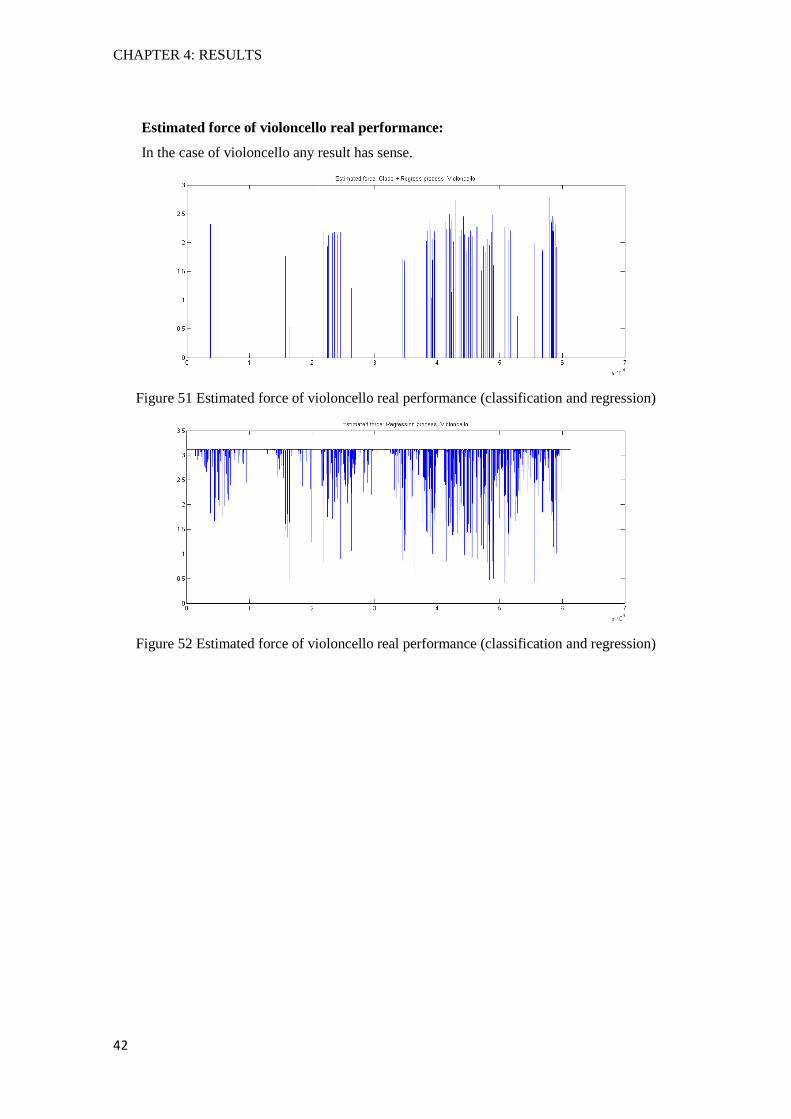
Estimated force of violoncello real performance:
In the case of violoncello any result has sense.
Figure 51 Estimated force of violoncello real performance (classification and regression)
Figure 52 Estimated force of violoncello real performance (classification and regression)
CHAPTER 5: CONCLUSIONS
43
Chapter 5
Conclusions
5.1 Contributions and conclusions
We obtain a method to estimate the bow pressing force using infra-red motion capture data.
Some bow descriptors were developed in order to know the physical behave of the bow. With
the descriptors data, a model was built to estimate the bow pressing force. We saw that if we
combine the classification process and regression, the result is better than only used regression
using a radial kernel with a gamma of 0.1. Correlation of ≈ 0.9 and RMSE of less than 0.2 were
obtained.
The models computed with the calibration data were applied to data of real performance but the
result wasn’t what we expected, it was wrong. The movement of the bow during calibration
process and real performance data is different, and the calibration bow movement was done by a
different person than the real performance (non-experts musicians), so it could be possible that
the calibration data doesn’t cover all the possible behave of the bow as in a real performance.
It could be good acquire new calibration data in other to have the similar bow movement than in
a real performance, and then it obtained the descriptors and computed the models for the
estimation force
In conclusion, the goals proposed for this thesis in 1.2 were achieved; a method to estimate the
bowing pressing force, depending on the bow deformation, bow position, tilt and
pseudo force applied. Also, the methodology avoids the problems of previous work, as
intrusiveness in [Guaus 2009] because the strange gages, and ferromagnetic distortion in
[Marchini 2011] because the electromagnetic field sensing. It could be good reproduce the way
to move the bow during the calibration process (using the load cell) as in the real performance,
in order to train the models with the similar data in the both situation. The force estimated by
the models will be more faithful.

CHAPTER 5: CONCLUSIONS
44
APPENDIX
45
Appendix
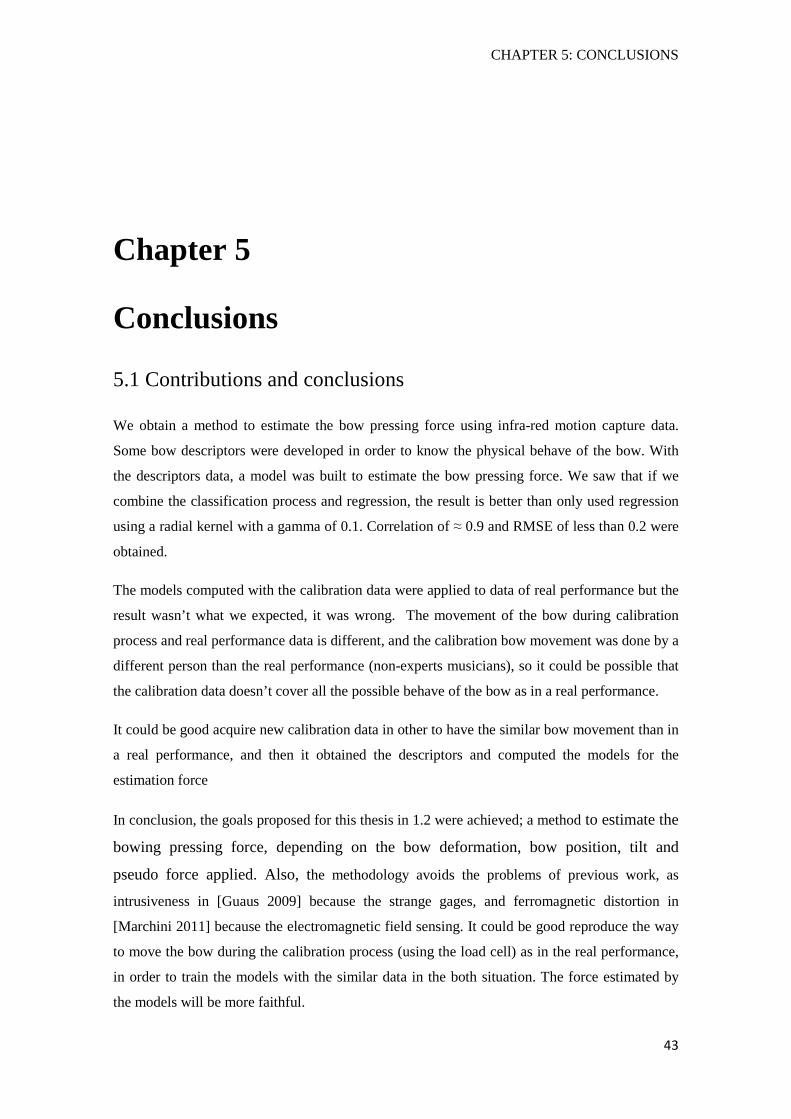
In this part of the memory are shown the most important and relevant plots.
A.1 Violin
Figure 53 estimated force by regression
APPENDIX
46
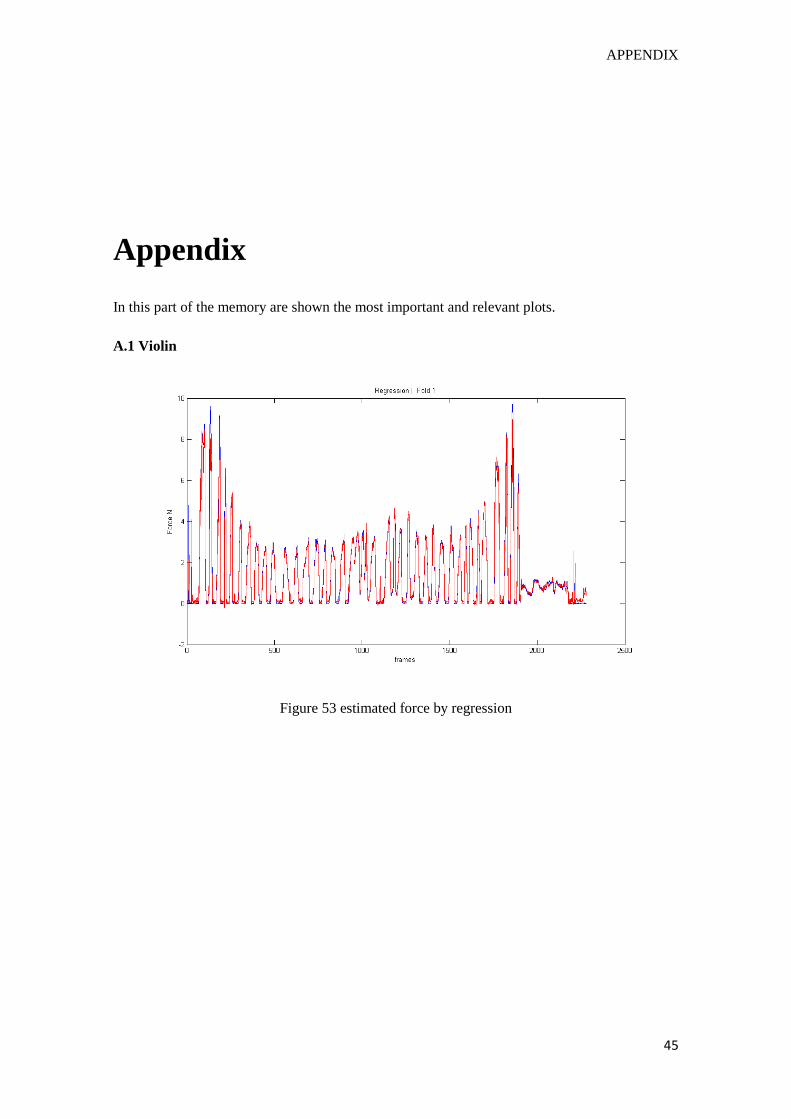
Figure 54 Gamma 0.1 Only “force applied” Regression – Violin1
Figure 55 Gamma 10 Only Regression - Violin1
APPENDIX
47
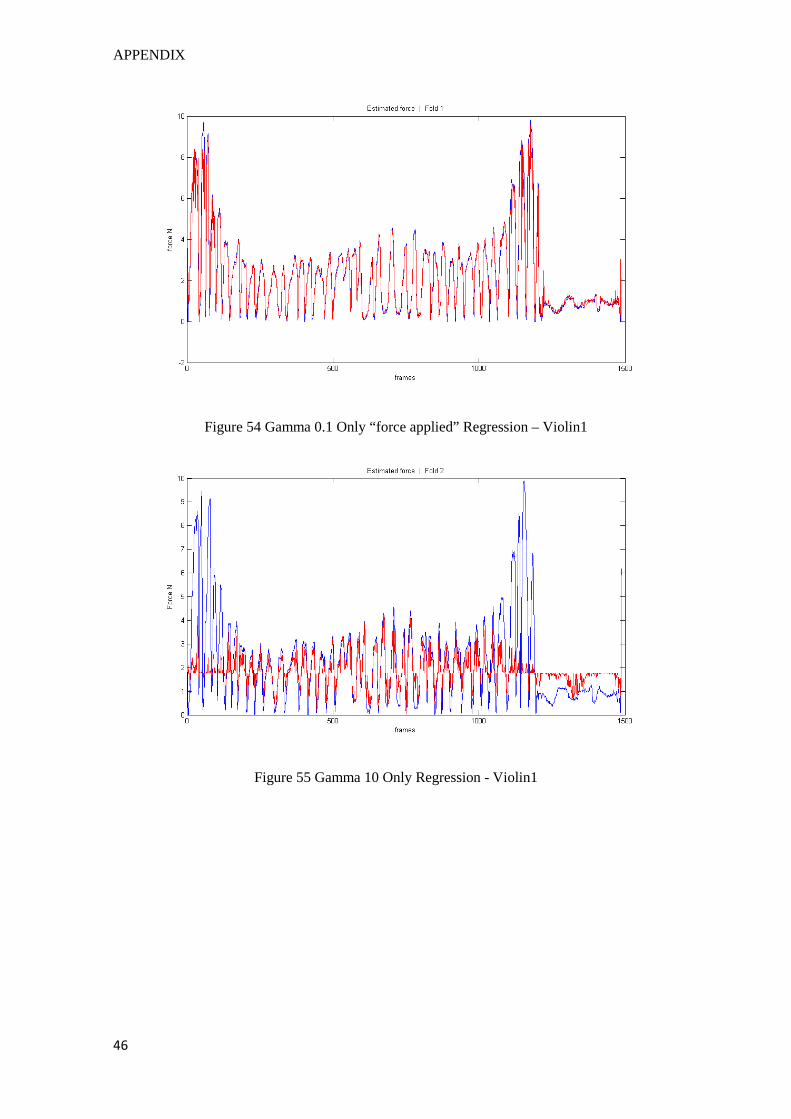
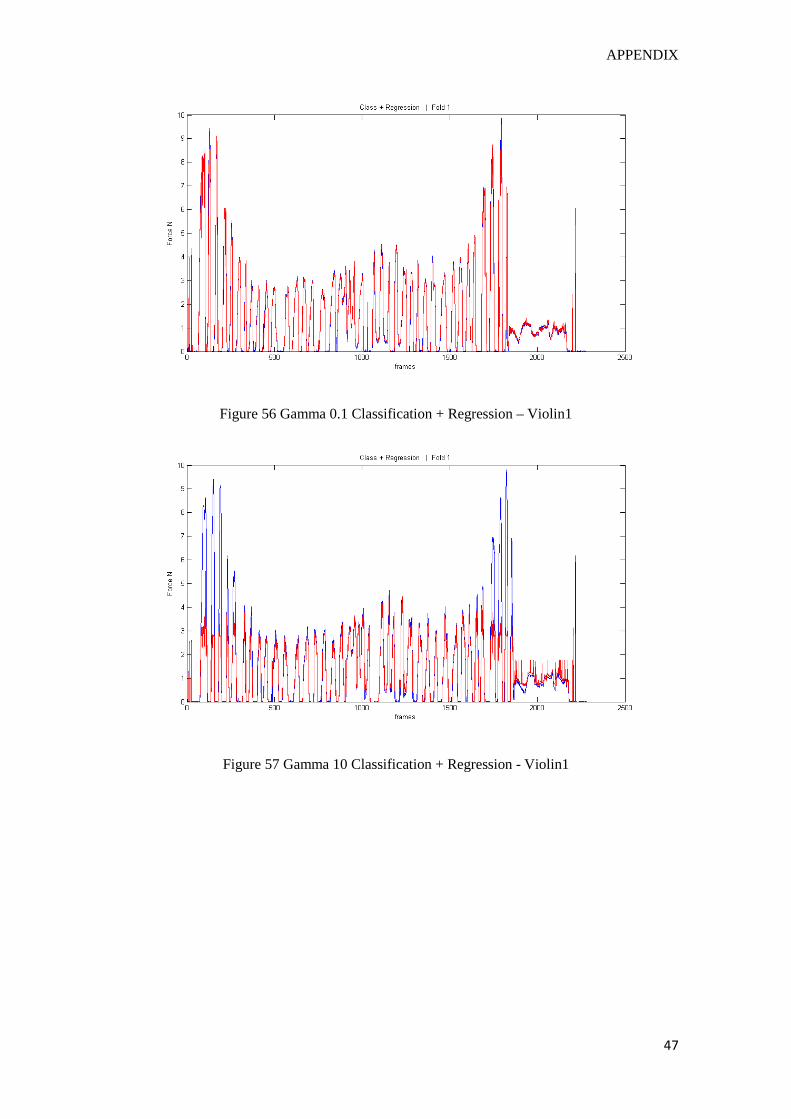
Figure 56 Gamma 0.1 Classification + Regression – Violin1
Figure 57 Gamma 10 Classification + Regression - Violin1
APPENDIX
48
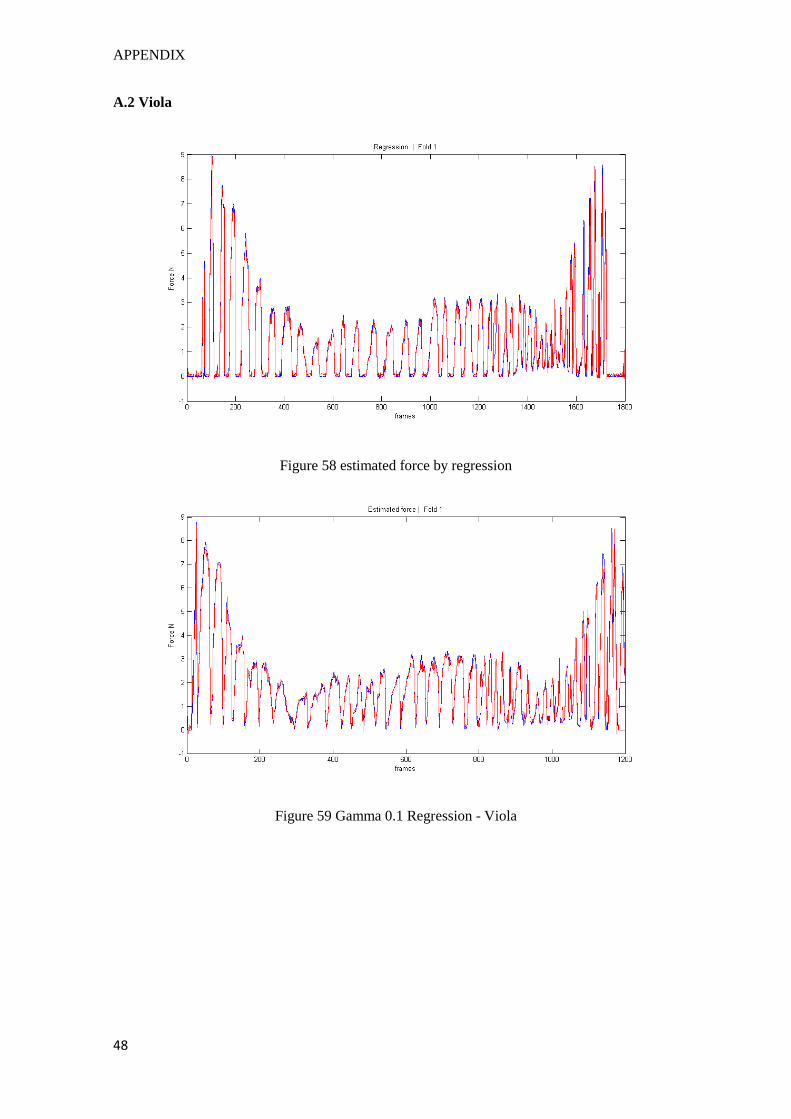
A.2 Viola
Figure 58 estimated force by regression
Figure 59 Gamma 0.1 Regression - Viola
APPENDIX
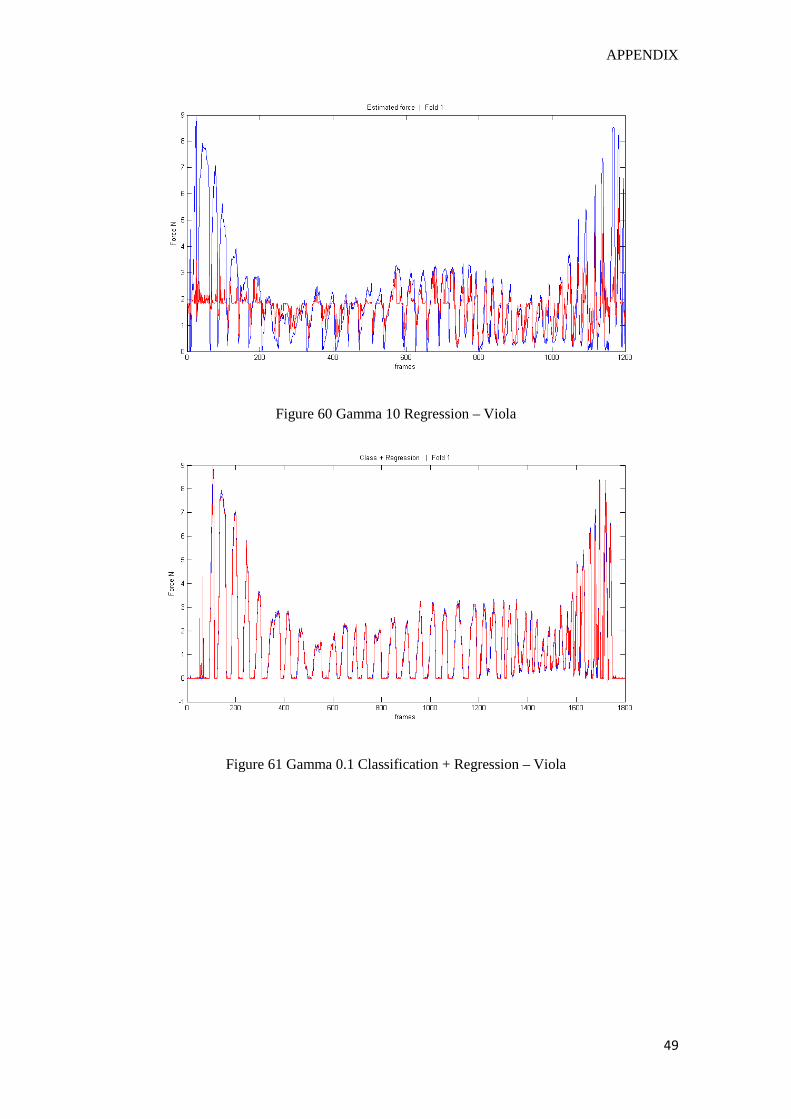
49
Figure 60 Gamma 10 Regression – Viola
Figure 61 Gamma 0.1 Classification + Regression – Viola
APPENDIX
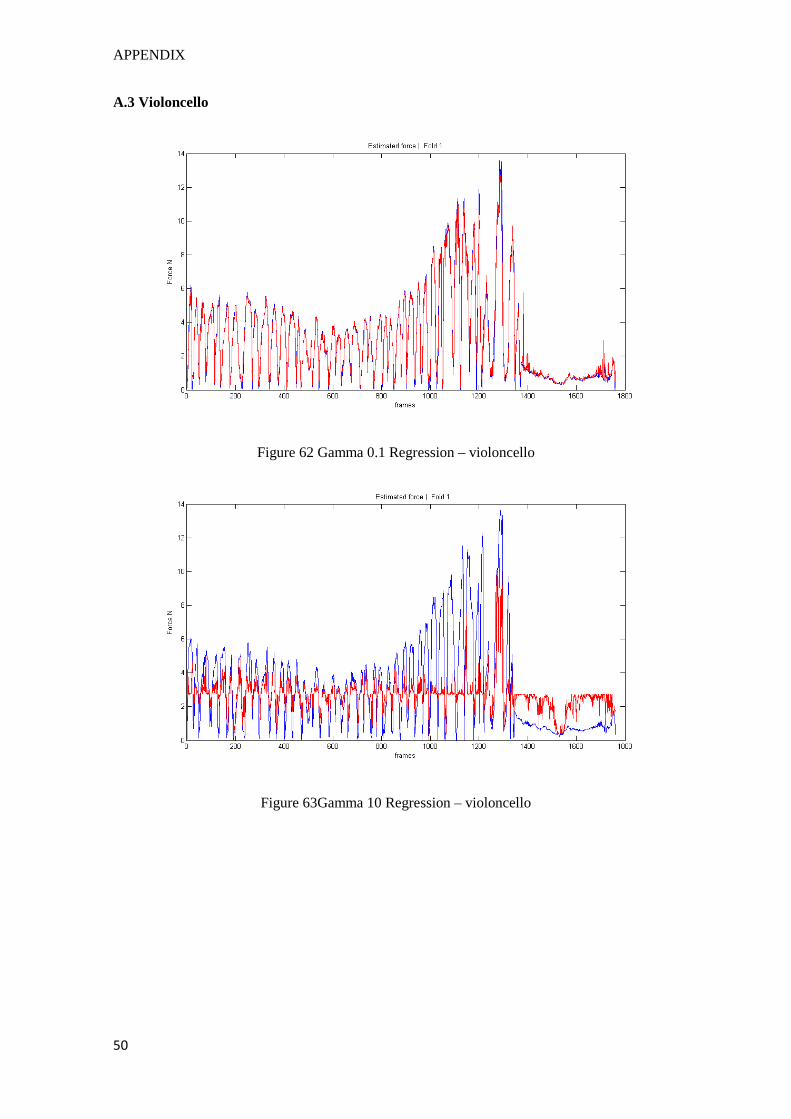
50
A.3 Violoncello
Figure 62 Gamma 0.1 Regression – violoncello
Figure 63Gamma 10 Regression – violoncello
APPENDIX
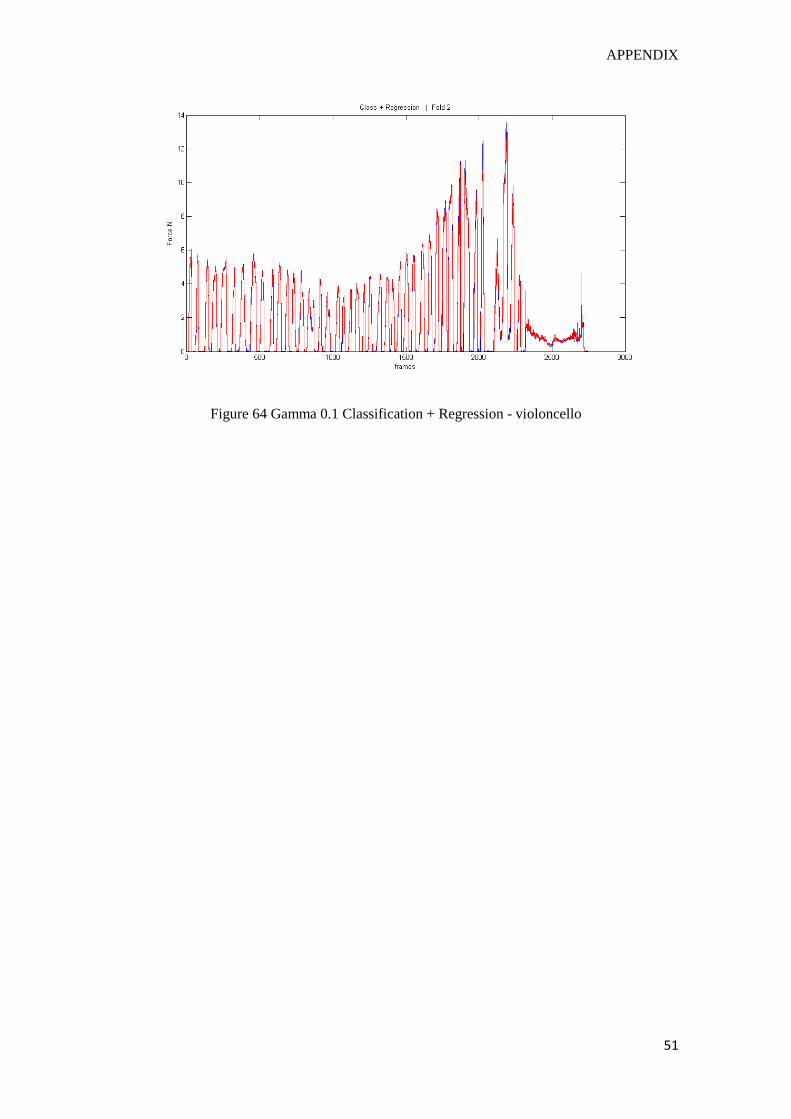
51
Figure 64 Gamma 0.1 Classification + Regression - violoncello
APPENDIX
52
53
Bibliography
(1 )[Askenfelt 1986]. Measurement of bow motion and bow force in violin paying. Anders
Askenfelt. Department of Speech Communication and Music Acoustics, Royal Institure of
Technology. Stockholm, Sweden
(2) Paradiso 1997. Musical applications of electric field sensing. Computer Music Journal, 21.
Paradiso J.A, Gershendield, N.A.
(3) Young 2002. The hyperbow controller: Real-time dynamics measurement of violin
performance. Conference on New Interfaces for Musical Expression.
(4) Young 2003. Wireless sensor system for measyrement of violin bowing parameters.
Young D. S. Stockholm Music Acoustics Conference.
(5) Rasamimanana 2003. Gesture analysis of bow strokes using an augmented violin . Ircam
DEA.
(6) Demoucron 2006. Mesure de la pression d’archet des instruments à corde frottée.
Application à la synthèse sonore. 8ème Congrès Français d’Acoustique. Demoucron,
M.Askenfelt, A. Causse,R 2006
(7)[Guaus 2007]. Measuring the bow pressing force in a real violin performance. Enric
Guaus, Jordi Bonada, Alfonso Perez, Esteban Maestre, Merlijn Blaauw. Music Technology
Group, Pompeu Fabra University. Barcelona
(8)[Guaus 2009]. Calibration method to measure accurate bow force for real violin
performances. Enric Guaus, Jordi Bonada, Esteban Maestre, Alfonso Pérez, Merlijn Blaauw.
Music Technology Group, Pompeu Fabra University. Barcelona
(9)[Marchini 2011]. A hair ribbon deflection model for low-intrusiveness measurement of
bow forcé in violin performance. Marco Marchini, Panos Papiotis, Alfonso Pérez, Esteban
Maestre. Music Technologu Grouop, Universitat Pompeu Fabra. Barcelona. Center for
Computer Research in Music and Acoustics, Stanford University, USA.