Embed Size (px)
Citation preview

March 1, 2016
Using Health Center Dashboards for Quality Improvement
Sarah Vander Beek, DMDMartin Lieberman, DDS


Participants Will Be Able To:
Understand the 15 measures that make up the dashboardReview the principles of Quality Improvement Use the Dashboard to identify targeted areas
for improvement and develop improvement goalsLeave the session with a plan for next steps
to implement the Dashboard

Session Overview• Quality Improvement Overview• History of the Project• How we use our Dashboard and why we
would never go back• What are the 15 Oral Health Measures?• How to Use the Online Dashboard & User’s
Guide• Develop operational definitions of the
metrics • Prioritize metrics for use within your
organization

Our Quality Improvement Journey
Dr. Vander Beek
• Neighborcare Health• Mentorship via CDO/CEO• Institute for Healthcare
Improvement• NNOHA
– CHC partners
• External Partners• Healthcare Home Concept
Dr. Lieberman
• Private Practice Dentist• Neighborcare Health• Quality Improvement• Institute for Healthcare
Improvement• IMPACT• NNOHA• Measure, Measure,
Measure

Who Uses Dashboards?
• “Shorter, more focused dashboards that are reviewed on a frequent basis are associated with higher performance. According to the results of this dashboard analysis, hospitals that use dashboards with fewer measures are more likely to be in the high-performance group, suggesting that higher-performing hospitals have developed dashboards that focus on areas they see as critical for quality.”
Kroch et al. (2006)

Measure, Measure, Measure• Management
tool• Clinic Leadership• Clinic• Senior
Management• Board• Telling our story
7


Model for Improvement
• The Model for Improvement enables an organization to approach quality improvement through rapid cycles of change and continual feedback on the effectiveness of those changes.
• When used in conjunction with the Chronic Care Model, the Model for Improvement can lead to positive, sustainable changes in the quality of health care.
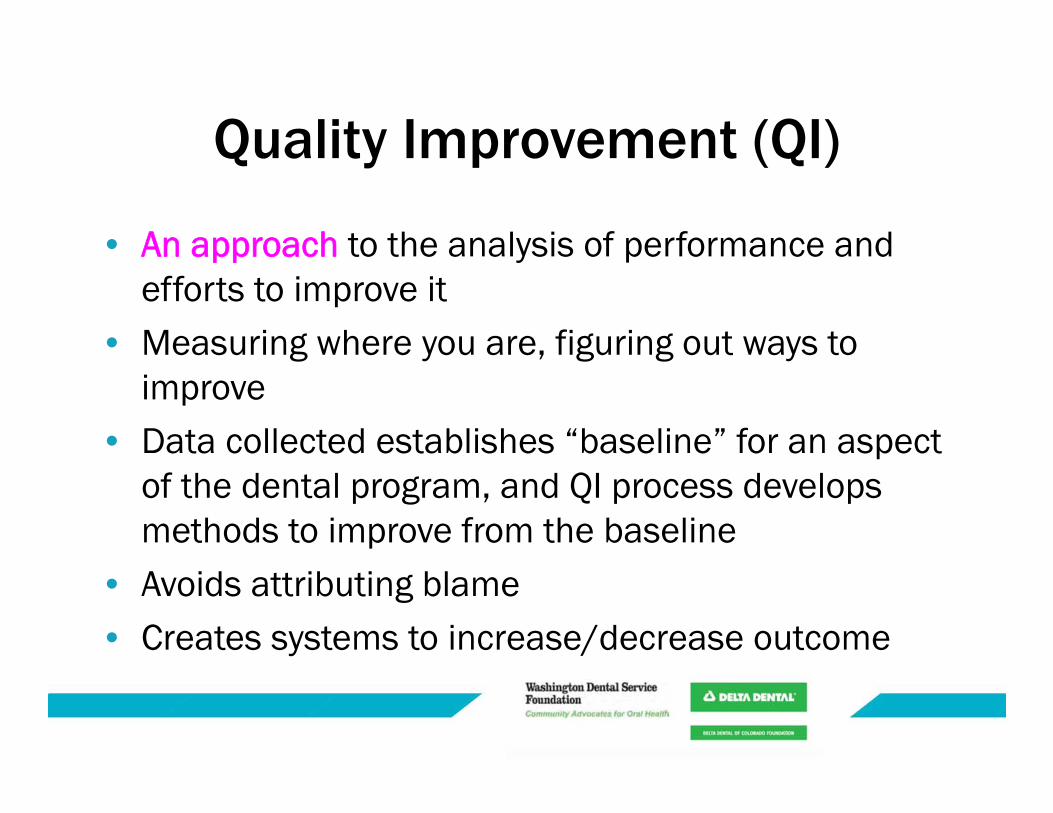
Quality Improvement (QI)
• An approach to the analysis of performance and efforts to improve it
• Measuring where you are, figuring out ways to improve
• Data collected establishes “baseline” for an aspect of the dental program, and QI process develops methods to improve from the baseline
• Avoids attributing blame• Creates systems to increase/decrease outcome

Old Way(Quality Assurance)
QualityBetter Worse
New Way(Quality Improvement)
Reject defectives
Profound Knowledge in ActionRequirement,Specification,Goal
No action taken here
QualityBetter Worse
Action taken on all
occurrences

Opportunity for Improvement
Actual
DesiredThe Gap
• Access to care (visit)• Type of service (sealant)• Cost (lower)• Adverse patient event (latex allergy) • Oral health outcomes (BP)

Plan-Do-Study-Act Cycle
Ideas Action Learning Improvement
DoStudy
Act Plan
• Identify problems and create a plan
• Implement the plan• Monitor and documentresults
• Begin analysis of the data
• Complete the data analysis• Compare data to predictions• Summarize what was learned
• Demonstrate improvement• What changes are to be made?• What is the next cycle?

Using the Cycle to Improve
DSPA
D SP A
Ideas
Improvement
Very Small Scale Test
Follow-up Tests
Wide-Scale Tests of Change
Implementation of Change
Spread

What Do We Do Next ?

Use the Dashboard for Quality Improvement
• There are differing levels of capability to effectively and efficiently use the data and implement quality improvement plans
• Readiness questionnaire in the User’s Guide – designed to help you and your organization think through how to best use a dashboard before initiating its use.

Use the Dashboard for Quality Improvement
• Start small • Establish baseline data for the Dental
Dashboard measures• Develop specific goals• Identify areas for improvement (don’t just watch
the dashboard, use the dashboard)• PDSAs• Over time, make course corrections• Regularity
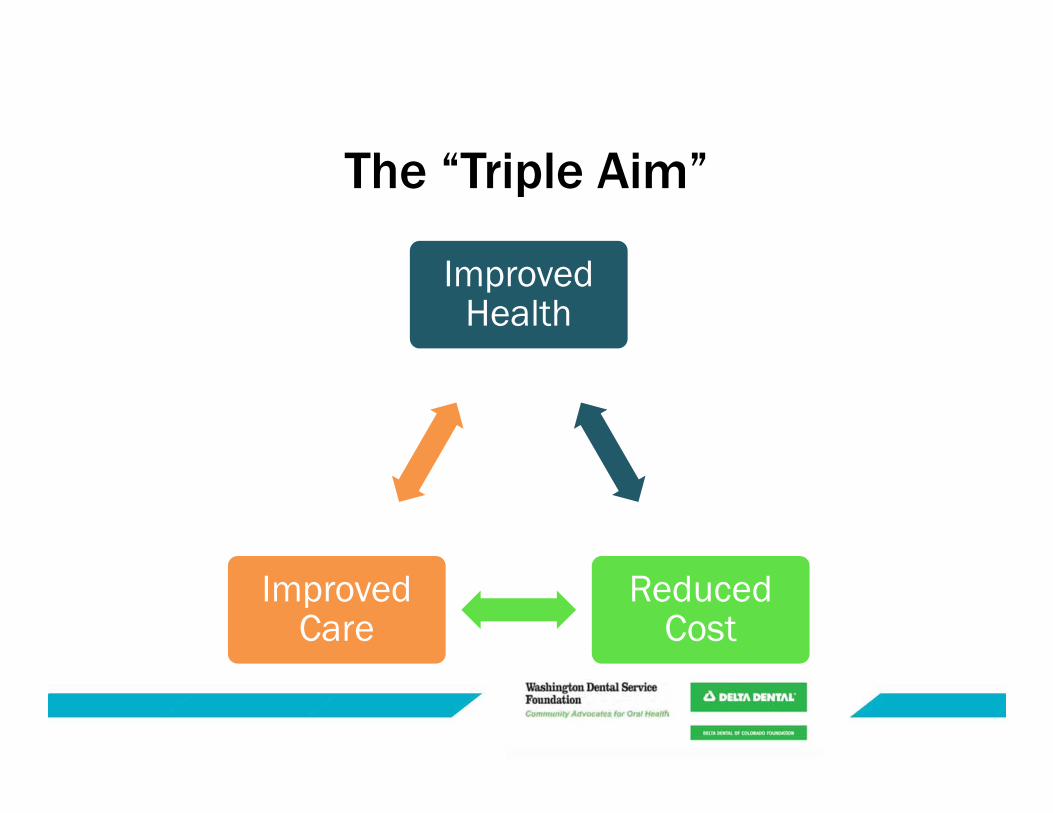
The “Triple Aim”
Improved Health
Reduced Cost
Improved Care

Discussion

History Of The Project
• Delta Dental of Colorado Foundation and Washington Dental Service Foundation have been working with expert advisers to develop a set of recommended oral health measures for High-Performing Health Centers.
• We have also developed an online, interactive tool to help Health Centers gather data for the measures.

Development
Participants from:• CMS• NNOHA• Institute for Oral Health• Colorado and Washington CHC• CHCs working on oral health• WA Dental Service Foundation• Delta Dental of Colorado
Foundation

Vision For This Work
Health Centers are sustainable, high performing healthcare providers with strong operations to ensure high productivity and health improvements (including oral health
improvements) among their patients.

Quality Improvement And Data
• Health Centers are required to have an ongoing Quality Improvement/Quality Assurance (QI/QA) program that includes clinical services and management.
• The QI/QA program must include:Clinical director who supports the QI/QA program
and provision of high quality patient carePeriodic assessment of the appropriateness of the
utilization of services provided or proposed to be provided to individuals served by the health center

Attention To Dental Metrics Expanding
• 1st Dental UDS Measure this year!• National Quality Measures Clearinghouse• CHIPRA Pediatric Quality Measures Program• Meaningful Use measures• Dental Quality Alliance• Healthy People 2020• National Committee on Quality Assurance HEDIS• NNOHA• National Oral Health Quality Improvement Committee• National Quality Forum• Oregon Dental Quality Metrics Workgroup

How To Use The Oral Health Measures
• You cannot improve what you don’t measure.• Selecting oral health measures places a value on
oral health and focuses quality improvement efforts towards them.
• You do not need to select all 15 measures. Start with 1-2 measures that are inline with your center’s mission, your strategic plan, or parallel national standards.
• Collect data regularly, share with the appropriate people, use the data to instigate action.
• Add additional measures when you’re ready.
Why Use A Dashboard • Dashboards give a quick status update
for key measures.
• They are a snapshot, not an in-depth analysis.
• Regularly seeing the data makes it much easier to respond quickly to areas of concern, or to change courses of action.
• Dashboards can be used to facilitate communication between departments, highlight successful strategies, to maintain momentum in QI activities, and identify operational deficiencies.
• It is a tool to take action!

How Neighborcare Health Uses Our Dashboard And Why We
Would Never Go Back

Our Organization’s Dashboard
= Goal

Dashboard (continued)
0.00%10.00%20.00%30.00%40.00%50.00%60.00%70.00%80.00%90.00%
100.00%%No Risk
%Low Risk
%Medium Risk
%High Risk
%New Decay
%SMGs
Caries Rate, Self Management Goal Setting, and Self Management Goal Review 0-5 year olds
0.00%10.00%20.00%30.00%40.00%50.00%60.00%70.00%80.00%90.00%
100.00%% No Risk
% Low Risk
% Medium Risk
% High Risk
% New Decay
% SMGs
Caries Rate, Self Management Goal Setting, and Self Management Goal Review 6+

How We Use Our Dashboard
• Reviewed monthly by dental leadership team– Takes the temperature of each clinic and program– Highlight one achievement from last month and one
area of concern/focus for improvement– Share ideas with colleagues about metrics
• Has driven quality improvement projects– Examples: kids, supply costs, models
• Accountability and transparency– Currently clinic level data on report

Day-to-day Implementation
• Background data is collected via:– Automated reports– Weekly person reports (no show and enc/hour)
• See weekly productivity and no shows by provider for closer monitoring
• On the portal for reference at any time• Goals (no show, productivity, treatment plan
completion) are tied to dashboard

Best Practices• Supply costs for clinics
– Process improvement team– Digging deeper– Formulary– Lead DA duties and training
• No Show work started here– Reminder calls– Rolling 5 week schedule– New RDH model (pilot)– Monitoring 3rd available

Possible Roadblocks
• Have to make sure the data is reliable– Example: RVU’s
• Hard to discover the “why” behind some data and what the actionable item is– Example: Encounters per hour
• Too much data- not focused on what matters!• Hard to get data out of EDR; measures
ask and EDR cannot deliver
Advice
• Buy in• Start small. If you do not currently utilize a dashboard,
pick 1-3 measures• If you are part of an organization with medical, what do
they measure? Why? Opportunity to build off their metrics
• Pick things that are not just easy to measure, but that MATTER to you– The why. What gets measured, gets worked on
• Set goals- focuses people and providers– Clarity around expectations
• Work with your IT/BI team/program

The Dental Dashboard
• The Dental Dashboard is a set of measures that is an optional tool for Health Centers to use as part of their quality improvement program to…– More effectively monitor and measure factors that
affect quality– Establish baselines for key measures – Set targeted improvements for individual measures– Develop methods to improve performance– Track improvements over time

The Dental Dashboard

①TREATMENT PLAN COMPLETION
②CARIES AT RECALL

④ORAL EVALUATION AND/OR RISK ASSESSMENT OF ALL PRIMARY CARE PATIENTS
③RISK ASSESSMENT OF ALL DENTAL PATIENTS
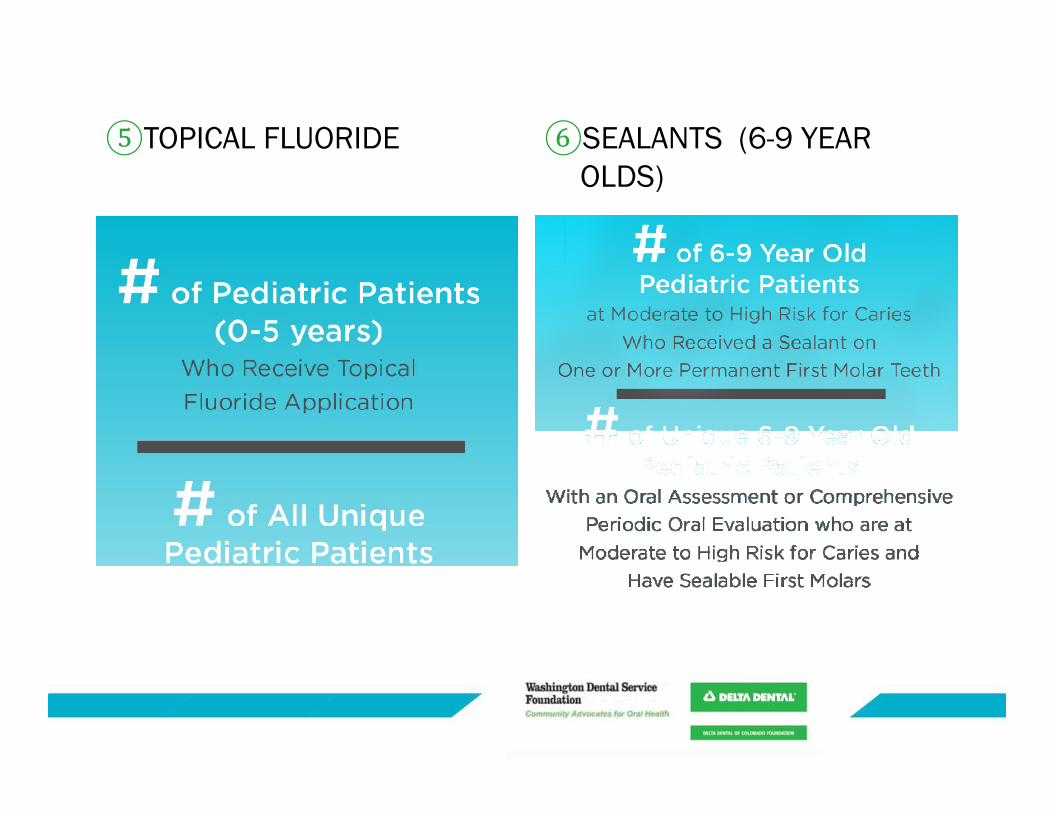
⑥SEALANTS (6-9 YEAR OLDS)
⑤TOPICAL FLUORIDE

⑧SELF-MANAGEMENT GOAL SETTING
⑦SEALANTS (10-14 YEAR OLDS)

⑩GROSS CHARGES (PRODUCTION) PER ENCOUNTER
⑨SELF-MANAGEMENT GOAL REVIEW

12) NO SHOWS11) ENCOUNTERS PER HOUR

14) RECALL RATES13) DIRECT COST PER VISIT

⑮ RECOMMENDATION TO FAMILY AND FRIENDS
How to Use the Online Dashboard & User’s Guide

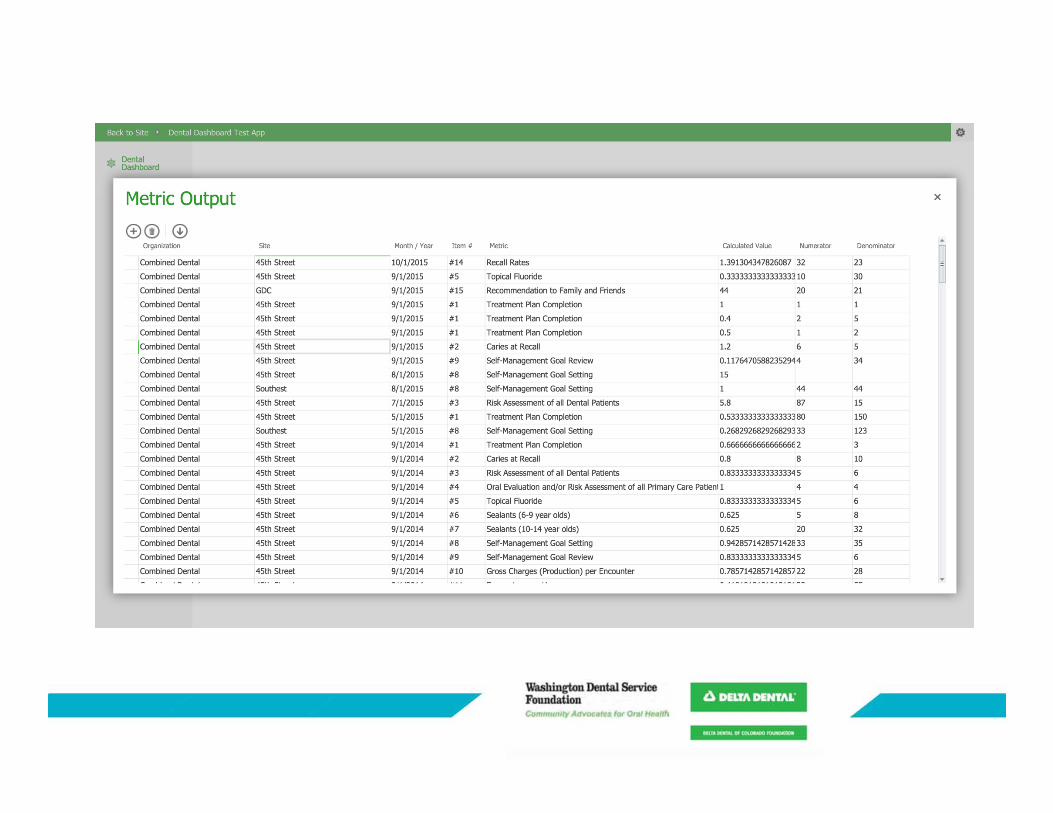
Overview
• The Dental Dashboard combines two processes: data entry and data charting.– The data entry system uses a browser-based
form to gather and store the data. – The data charting function uses Microsoft Excel
to display the data graphically.
Getting Started
• System Requirements– Computer – Internet connection & browser– Microsoft Excel
• Requesting Access– http://www.nnoha.org/resources/dental-dashboard-
information/dental-dashboard-access/– Fill out form– An email will be sent to you with invitation link– Click on invitation link

Login to tool
• Afl-enterprises.com/dentaldashboardapp


Data Entry Tool


Data Charting Tool

User’s Guide • Complete instructions for
accessing the Dental Dashboard are included in the User’s Guide.
• The User’s Guide gives more details about:– How the recommended measures
were selected– Specifies the numerators and
denominators– What codes are needed to track the
measures– Tips for how to collect the data

Discussion/Questions

Develop operational definitions of the metrics
• Worksheet:• If you don’t currently use a dashboard, think
about 3 measures you want to try. Fill out the worksheet.– What is the measure – how will you define it?– Why measure this?
• If you do use a dashboard think about a measure you might want to add or expand– What is the measure – how will you define it?– Why measure this?

Breakout Session
• What metrics should you prioritize for your organization?

Small Group Breakout
• Break into 3 Groups• Appoint a presenter to share key themes
discussed in your group• Discussion Questions: • What did you choose/What did you prioritize, • Why choose these measures? What
challenges do you anticipate?

Debrief
• What are the most commonly selected metrics?
• Themes about the why?• Major challenges?• Did you come up with any solutions that you
could share with the larger group? • Areas where you need more support?

Create a Balanced View

First…any questions?

Wrap Up
• What is one thing (or the 1st thing) you will try when you get back to work?

Contact Information
Dashboard Questions: Debra A Schmidt MPH CHESProject Coordinator, NNOHA [email protected]