Embed Size (px)
Citation preview
Designing BIRT Dashboards

Information in this document is subject to change without notice. Examples provided are fictitious. No part of this document may be reproduced or transmitted in any form, or by any means, electronic or mechanical, for any purpose, in whole or in part, without the express written permission of Actuate Corporation.
© 1995 - 2014 by Actuate Corporation. All rights reserved. Printed in the United States of America.
Contains information proprietary to:Actuate Corporation, 951 Mariners Island Boulevard, San Mateo, CA 94404
www.actuate.com
The software described in this manual is provided by Actuate Corporation under an Actuate License agreement. The software may be used only in accordance with the terms of the agreement. Actuate software products are protected by U.S. and International patents and patents pending. For a current list of patents, please see http://www.actuate.com/patents.
Actuate Corporation trademarks and registered trademarks include:Actuate, ActuateOne, the Actuate logo, Archived Data Analytics, BIRT, BIRT 360, BIRT Analytics, The BIRT Company, BIRT Content Services, BIRT Data Analyzer, BIRT for Statements, BIRT iHub, BIRT Metrics Management, BIRT Performance Analytics, Collaborative Reporting Architecture, e.Analysis, e.Report, e.Reporting, e.Spreadsheet, Encyclopedia, Interactive Viewing, OnPerformance, The people behind BIRT, Performancesoft, Performancesoft Track, Performancesoft Views, Report Encyclopedia, Reportlet, X2BIRT, and XML reports.
Actuate products may contain third-party products or technologies. Third-party trademarks or registered trademarks of their respective owners, companies, or organizations include: Mark Adler and Jean-loup Gailly (www.zlib.net): zLib. Adobe Systems Incorporated: Flash Player, Source Sans Pro font. Amazon Web Services, Incorporated: Amazon Web Services SDK. Apache Software Foundation (www.apache.org): Ant, Axis, Axis2, Batik, Batik SVG library, Commons Command Line Interface (CLI), Commons Codec, Commons Lang, Commons Math, Crimson, Derby, Hive driver for Hadoop, Kafka, log4j, Pluto, POI ooxml and ooxml-schema, Portlet, Shindig, Struts, Thrift, Tomcat, Velocity, Xalan, Xerces, Xerces2 Java Parser, Xerces-C++ XML Parser, and XML Beans. Daniel Bruce (www.entypo.com): Entypo Pictogram Suite. Castor (www.castor.org), ExoLab Project (www.exolab.org), and Intalio, Inc. (www.intalio.org): Castor. Alessandro Colantonio: CONCISE. Day Management AG: Content Repository for Java. Eclipse Foundation, Inc. (www.eclipse.org): Babel, Data Tools Platform (DTP) ODA, Eclipse SDK, Graphics Editor Framework (GEF), Eclipse Modeling Framework (EMF), Jetty, and Eclipse Web Tools Platform (WTP). Dave Gandy: Font Awesome. Gargoyle Software Inc.: HtmlUnit. GNU Project: GNU Regular Expression. Groovy project (groovy.codehaus.org): Groovy. Guava Libraries: Google Guava. HighSlide: HighCharts. headjs.com: head.js. Hector Project: Cassandra Thrift, Hector. Jason Hsueth and Kenton Varda (code.google.com): Protocole Buffer. H2 Database: H2 database. Groovy project (groovy.codehaus.org): Groovy. IDAutomation.com, Inc.: IDAutomation. IDRsolutions Ltd.: JBIG2. InfoSoft Global (P) Ltd.: FusionCharts, FusionMaps, FusionWidgets, PowerCharts. Matt Inger (sourceforge.net): Ant-Contrib. Matt Ingenthron, Eric D. Lambert, and Dustin Sallings (code.google.com): Spymemcached. International Components for Unicode (ICU): ICU library. JCraft, Inc.: JSch. jQuery: jQuery. Yuri Kanivets (code.google.com): Android Wheel gadget. LEAD Technologies, Inc.: LEADTOOLS. The Legion of the Bouncy Castle: Bouncy Castle Crypto APIs. Bruno Lowagie and Paulo Soares: iText. MetaStuff: dom4j. Microsoft Corporation (Microsoft Developer Network): CompoundDocument Library. Mozilla: Mozilla XML Parser. MySQL Americas, Inc.: MySQL Connector. Netscape Communications Corporation, Inc.: Rhino. nullsoft project: Nullsoft Scriptable Install System. OOPS Consultancy: XMLTask. OpenSSL Project: OpenSSL. Oracle Corporation: Berkeley DB, Java Advanced Imaging, JAXB, JDK, Jstl, Oracle JDBC driver. PostgreSQL Global Development Group: pgAdmin, PostgreSQL, PostgreSQL JDBC driver. Progress Software Corporation: DataDirect Connect XE for JDBC Salesforce, DataDirect JDBC, DataDirect ODBC. Quality Open Software: Simple Logging Facade for Java (SLF4J), SLF4J API and NOP. Rogue Wave Software, Inc.: Rogue Wave Library SourcePro Core, tools.h++. Sam Stephenson (prototype.conio.net): prototype.js. Sencha Inc.: Ext JS, Sencha Touch. Shibboleth Consortium: OpenSAML, Shibboleth Identity Provider. Matteo Spinelli: iscroll. StAX Project (stax.codehaus.org): Streaming API for XML (StAX). SWFObject Project (code.google.com): SWFObject. ThimbleWare, Inc.: JMemcached. Twittr: Twitter Bootstrap. VMWare: Hyperic SIGAR. Woodstox Project (woodstox.codehaus.org): Woodstox Fast XML processor (wstx-asl). World Wide Web Consortium (W3C) (MIT, ERCIM, Keio): Flute, JTidy, Simple API for CSS. XFree86 Project, Inc.: (www.xfree86.org): xvfb. ZXing Project (code.google.com): ZXing.
All other brand or product names are trademarks or registered trademarks of their respective owners, companies, or organizations.
Document No. 131215-2-549303 October 15, 2014
i
ContentsDesigning a dashboard . . . . . . . . . . . . . . . . . . . . . . . . . . . . . . . . . . . . . . . . . 1About dashboard applications . . . . . . . . . . . . . . . . . . . . . . . . . . . . . . . . . . . . . . . . . . . . . . . . . . . . . . . 2Planning dashboard layout . . . . . . . . . . . . . . . . . . . . . . . . . . . . . . . . . . . . . . . . . . . . . . . . . . . . . . . . . . 3Creating a dashboard . . . . . . . . . . . . . . . . . . . . . . . . . . . . . . . . . . . . . . . . . . . . . . . . . . . . . . . . . . . . . . . 3
Adding a dashboard tab . . . . . . . . . . . . . . . . . . . . . . . . . . . . . . . . . . . . . . . . . . . . . . . . . . . . . . . . . . 5Choosing a dashboard layout . . . . . . . . . . . . . . . . . . . . . . . . . . . . . . . . . . . . . . . . . . . . . . . . . . . . . 5Formatting a dashboard tab . . . . . . . . . . . . . . . . . . . . . . . . . . . . . . . . . . . . . . . . . . . . . . . . . . . . . . . 7Adding data objects to a dashboard . . . . . . . . . . . . . . . . . . . . . . . . . . . . . . . . . . . . . . . . . . . . . . . . 8Importing an existing dashboard . . . . . . . . . . . . . . . . . . . . . . . . . . . . . . . . . . . . . . . . . . . . . . . . . . 9Saving a dashboard . . . . . . . . . . . . . . . . . . . . . . . . . . . . . . . . . . . . . . . . . . . . . . . . . . . . . . . . . . . . . . 9Opening a dashboard file . . . . . . . . . . . . . . . . . . . . . . . . . . . . . . . . . . . . . . . . . . . . . . . . . . . . . . . . 10
Adding gadgets to a dashboard . . . . . . . . . . . . . . . . . . . . . . . . . . . . . . . . . . . . . . . . . . . . . . . . . . . . . 10Placing a gadget . . . . . . . . . . . . . . . . . . . . . . . . . . . . . . . . . . . . . . . . . . . . . . . . . . . . . . . . . . . . . . . . .11Formatting a gadget . . . . . . . . . . . . . . . . . . . . . . . . . . . . . . . . . . . . . . . . . . . . . . . . . . . . . . . . . . . . 13Testing dashboard content . . . . . . . . . . . . . . . . . . . . . . . . . . . . . . . . . . . . . . . . . . . . . . . . . . . . . . . 14

ii
C h a p t e r 1 , D e s i g n i n g a d a s h b o a r d 1
C h a p t e r
1Chapter 1Designing a dashboard
This chapter contains the following topics:
■ About dashboard applications
■ Planning dashboard layout
■ Creating a dashboard
■ Adding gadgets to a dashboard
2 D e s i g n i n g B I R T D a s h b o a r d s
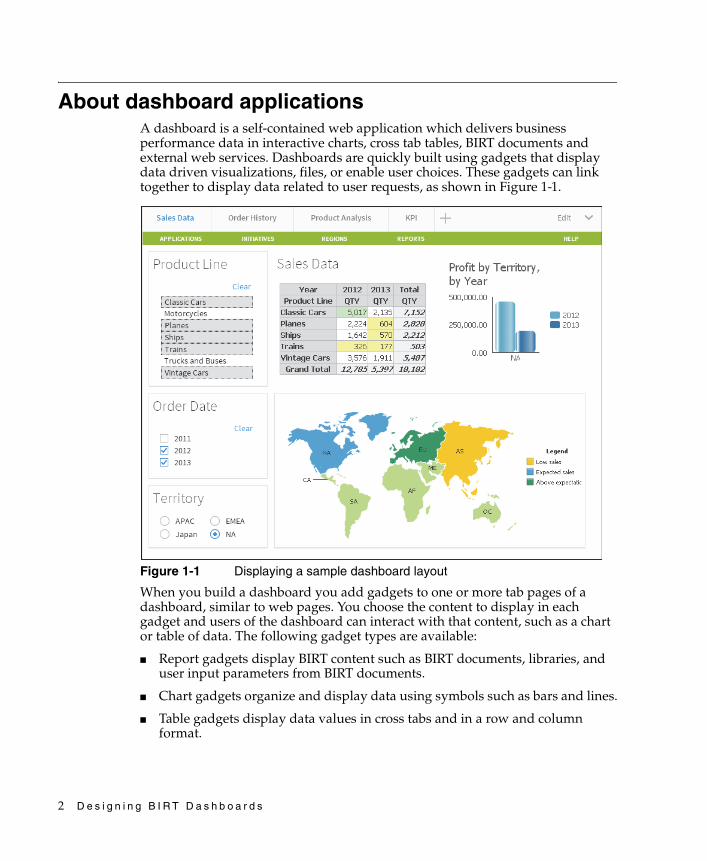
About dashboard applicationsA dashboard is a self-contained web application which delivers business performance data in interactive charts, cross tab tables, BIRT documents and external web services. Dashboards are quickly built using gadgets that display data driven visualizations, files, or enable user choices. These gadgets can link together to display data related to user requests, as shown in Figure 1-1.
Figure 1-1 Displaying a sample dashboard layout
When you build a dashboard you add gadgets to one or more tab pages of a dashboard, similar to web pages. You choose the content to display in each gadget and users of the dashboard can interact with that content, such as a chart or table of data. The following gadget types are available:
■ Report gadgets display BIRT content such as BIRT documents, libraries, and user input parameters from BIRT documents.
■ Chart gadgets organize and display data using symbols such as bars and lines.
■ Table gadgets display data values in cross tabs and in a row and column format.
C h a p t e r 1 , D e s i g n i n g a d a s h b o a r d 3
■ Data selector gadgets show values for users to query data in other gadgets.
■ Extras gadgets display external content such as web applications, video, HTML, JavaScript code, and Google gadgets.
You can create dashboards using the BIRT Designer Professional desktop application. Finished dashboards are deployed to a BIRT iHub or cloud server, such as BIRT onDemand and available to users in the following formats:
■ A dashboard file in Visualization Platform
■ A URL address when deployed as a BIRT application
■ A web page using Actuate JavaScript API (JSAPI) to embed the dashboard
Users can then interact with, export, or print data displayed in existing dashboards or include your published dashboard as a page in their own dashboard file when using Visualization Platform.
Planning dashboard layoutPlanning dashboard usage assures that users receive and interact with the expected data. After choosing the content and data to display on the dashboard select the gadgets to display this information. Verify that user permissions, such as file permissions necessary to view BIRT documents or BIRT data objects, enable target users to access this information. Then consider how you want users to interact with these gadgets. For example, do you filter the displayed data for the user or do you enable users to select filter values with data selection gadgets.
Finally, determine the dashboard layout for the expected web browser and screen size. Each dashboard supports four different layout formats; one column, two column, three column and free form. You can change gadget placement on the dashboard to find the best balance of presentation and interaction. For example, keep related user interaction gadgets together. Users can also view any gadget, except the data selection gadgets at full screen.
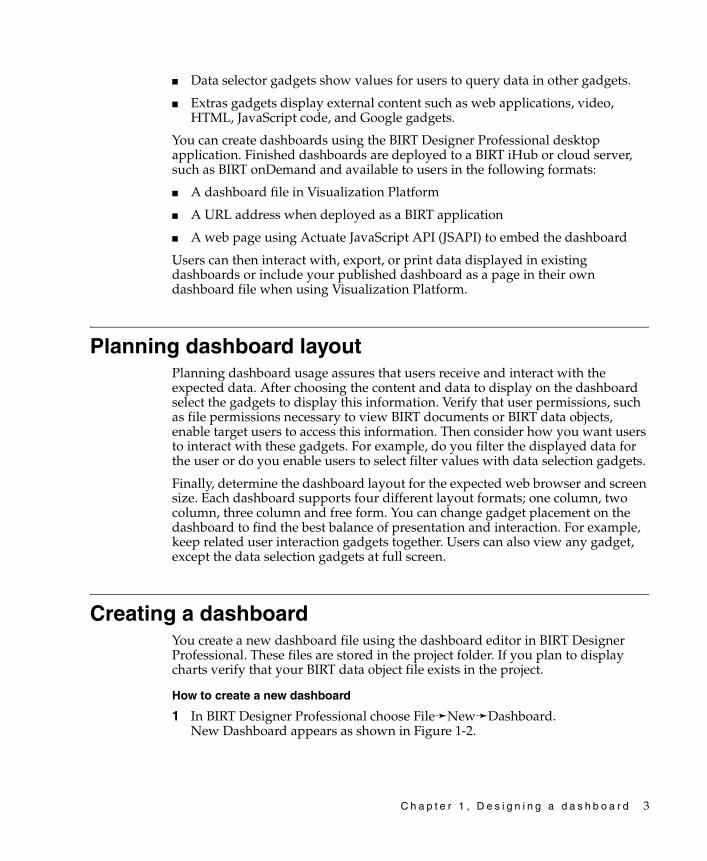
Creating a dashboardYou create a new dashboard file using the dashboard editor in BIRT Designer Professional. These files are stored in the project folder. If you plan to display charts verify that your BIRT data object file exists in the project.
How to create a new dashboard
1 In BIRT Designer Professional choose File➛New➛Dashboard. New Dashboard appears as shown in Figure 1-2.
4 D e s i g n i n g B I R T D a s h b o a r d s
Figure 1-2 Displaying the dashboard editor
2 The current project and the default folder for dashboards is selected.
■ If you want to use a different project or folder to store the dashboard file, remove the selection Use Default Location to access the tree view of the available folders.
■ If you want to change the dashboard file name, type the new name in File name.
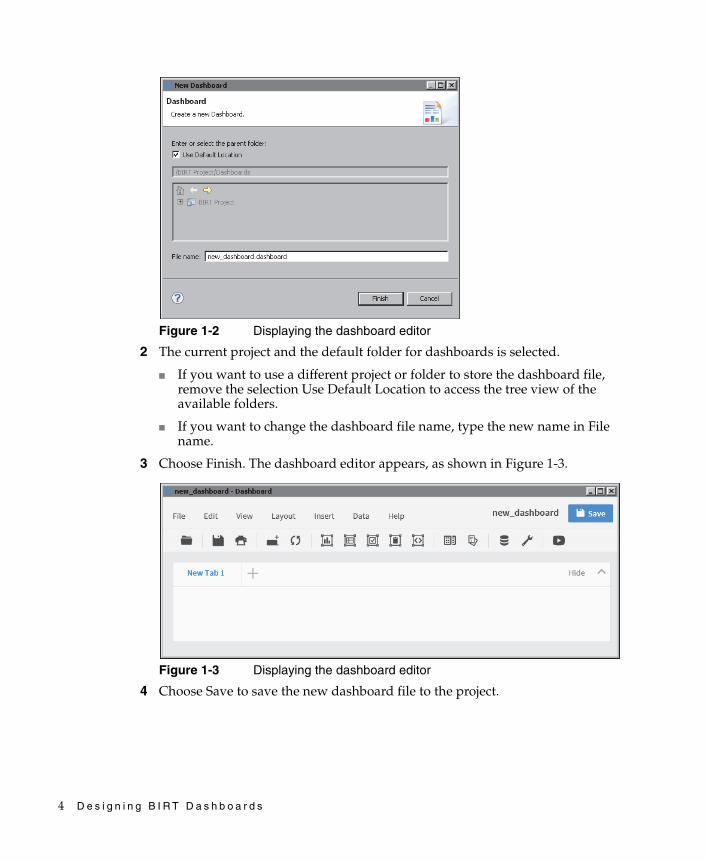
3 Choose Finish. The dashboard editor appears, as shown in Figure 1-3.
Figure 1-3 Displaying the dashboard editor
4 Choose Save to save the new dashboard file to the project.
C h a p t e r 1 , D e s i g n i n g a d a s h b o a r d 5
Adding a dashboard tabA dashboard is divided into one or more pages called tabs. These tab pages enable you to organize the gadgets. For example, one tab page contains gadgets necessary to make a new customer order and another tab page can contain gadgets displaying a customer’s order history. You can name each tab page to identify its contents and change the order that the tab appears in relation to other tabs.
How to add a dashboard tab
1 In the dashboard editor, choose Edit➛New Tab to create an empty, new tab page.
2 Choose Edit➛Rename Tab to change the tab name.
Choosing a dashboard layoutDashboard layout defines how gadgets appear on a dashboard. Each gadget uses either a column or free form layout. Gadgets in column layouts do not overlap and appear either above or below another gadget in the same column. You can place gadgets in free form layout anywhere on the dashboard. If a free form gadget overlaps another gadget, the user can move the gadget to the front or back of the other gadgets.
Dashboards support a one-, two-, or three-column layout in addition to a free form layout. You can use the columns to organize gadgets on the dashboard. Dashboard columns are a percentage of the user’s web browser size. If the web browser changes size, the dashboard columns are resized. Gadgets in a resized column also resize to match the new width of the column.
Choose the free form layout if you need to move or resize gadgets anywhere on the dashboard. Free form layout supports overlapping gadgets and changing the width of individual gadgets.
For example, a single-column dashboard expands to fill the width of the web browser, and the gadgets in the column are resized accordingly. Floating gadgets, such as gadgets in a free form layout, do not change their width or location on the dashboard when the browser size changes.
For complex visualization layout, use BIRT design features available in BIRT Designer Professional. For example, use BIRT Designer Professional to put multiple charts into a grid element or cross tab container. You can display the finished BIRT design file on a dashboard using a report gadget.
How to change a dashboard layout
In the dashboard editor, choose Layout➛Two Columns, as shown in Figure 1-4.
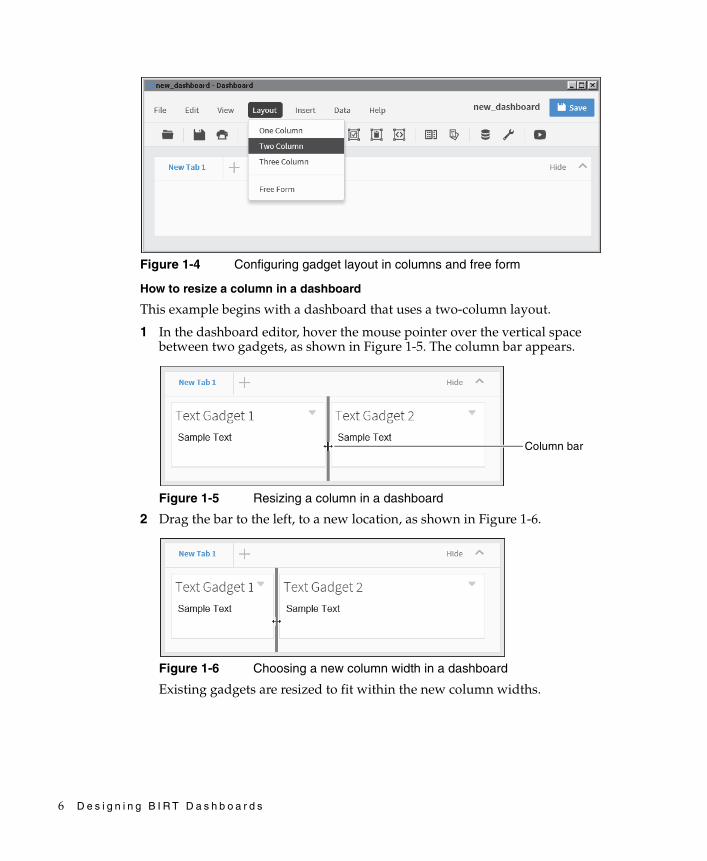
6 D e s i g n i n g B I R T D a s h b o a r d s
Figure 1-4 Configuring gadget layout in columns and free form
How to resize a column in a dashboard
This example begins with a dashboard that uses a two-column layout.
1 In the dashboard editor, hover the mouse pointer over the vertical space between two gadgets, as shown in Figure 1-5. The column bar appears.
Figure 1-5 Resizing a column in a dashboard
2 Drag the bar to the left, to a new location, as shown in Figure 1-6.
Figure 1-6 Choosing a new column width in a dashboard
Existing gadgets are resized to fit within the new column widths.
Column bar
C h a p t e r 1 , D e s i g n i n g a d a s h b o a r d 7
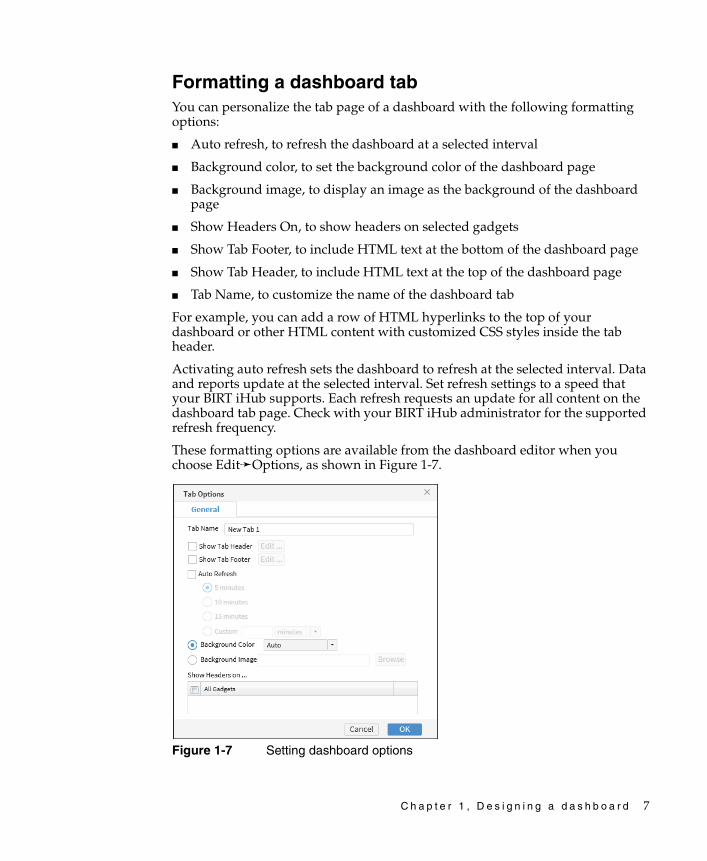
Formatting a dashboard tabYou can personalize the tab page of a dashboard with the following formatting options:
■ Auto refresh, to refresh the dashboard at a selected interval
■ Background color, to set the background color of the dashboard page
■ Background image, to display an image as the background of the dashboard page
■ Show Headers On, to show headers on selected gadgets
■ Show Tab Footer, to include HTML text at the bottom of the dashboard page
■ Show Tab Header, to include HTML text at the top of the dashboard page
■ Tab Name, to customize the name of the dashboard tab
For example, you can add a row of HTML hyperlinks to the top of your dashboard or other HTML content with customized CSS styles inside the tab header.
Activating auto refresh sets the dashboard to refresh at the selected interval. Data and reports update at the selected interval. Set refresh settings to a speed that your BIRT iHub supports. Each refresh requests an update for all content on the dashboard tab page. Check with your BIRT iHub administrator for the supported refresh frequency.
These formatting options are available from the dashboard editor when you choose Edit➛Options, as shown in Figure 1-7.
Figure 1-7 Setting dashboard options
8 D e s i g n i n g B I R T D a s h b o a r d s
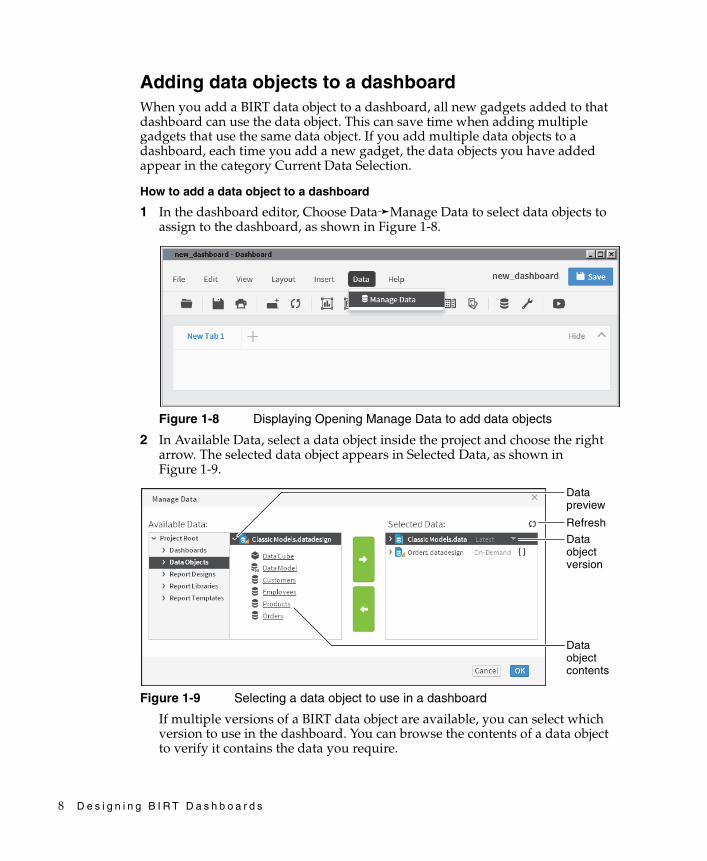
Adding data objects to a dashboardWhen you add a BIRT data object to a dashboard, all new gadgets added to that dashboard can use the data object. This can save time when adding multiple gadgets that use the same data object. If you add multiple data objects to a dashboard, each time you add a new gadget, the data objects you have added appear in the category Current Data Selection.
How to add a data object to a dashboard
1 In the dashboard editor, Choose Data➛Manage Data to select data objects to assign to the dashboard, as shown in Figure 1-8.
Figure 1-8 Displaying Opening Manage Data to add data objects
2 In Available Data, select a data object inside the project and choose the right arrow. The selected data object appears in Selected Data, as shown in Figure 1-9.
Figure 1-9 Selecting a data object to use in a dashboard
If multiple versions of a BIRT data object are available, you can select which version to use in the dashboard. You can browse the contents of a data object to verify it contains the data you require.
Data object version
Refresh
Data preview
Data object contents
C h a p t e r 1 , D e s i g n i n g a d a s h b o a r d 9
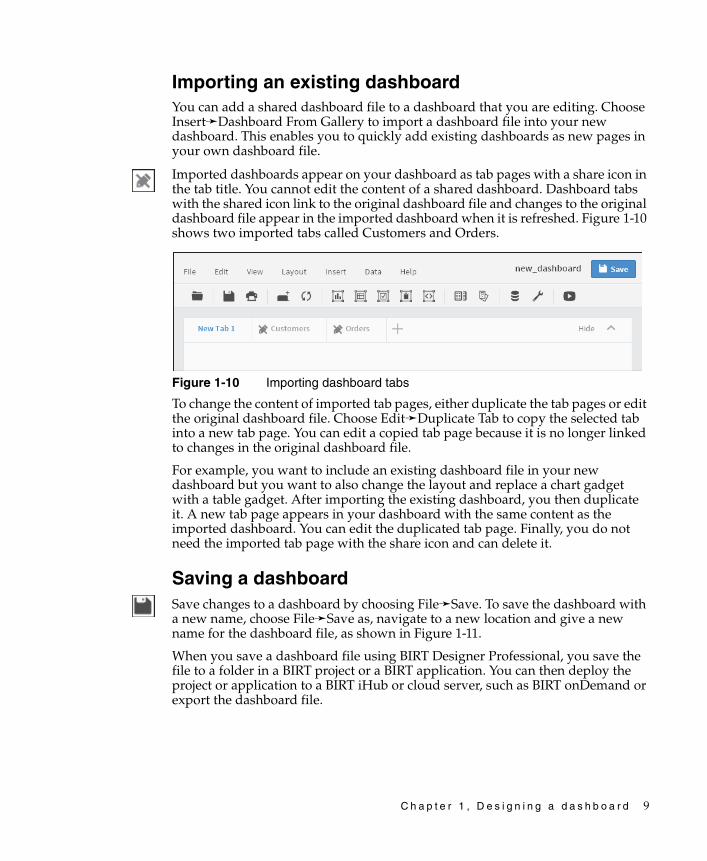
Importing an existing dashboardYou can add a shared dashboard file to a dashboard that you are editing. Choose Insert➛Dashboard From Gallery to import a dashboard file into your new dashboard. This enables you to quickly add existing dashboards as new pages in your own dashboard file.
Imported dashboards appear on your dashboard as tab pages with a share icon in the tab title. You cannot edit the content of a shared dashboard. Dashboard tabs with the shared icon link to the original dashboard file and changes to the original dashboard file appear in the imported dashboard when it is refreshed. Figure 1-10 shows two imported tabs called Customers and Orders.
Figure 1-10 Importing dashboard tabs
To change the content of imported tab pages, either duplicate the tab pages or edit the original dashboard file. Choose Edit➛Duplicate Tab to copy the selected tab into a new tab page. You can edit a copied tab page because it is no longer linked to changes in the original dashboard file.
For example, you want to include an existing dashboard file in your new dashboard but you want to also change the layout and replace a chart gadget with a table gadget. After importing the existing dashboard, you then duplicate it. A new tab page appears in your dashboard with the same content as the imported dashboard. You can edit the duplicated tab page. Finally, you do not need the imported tab page with the share icon and can delete it.
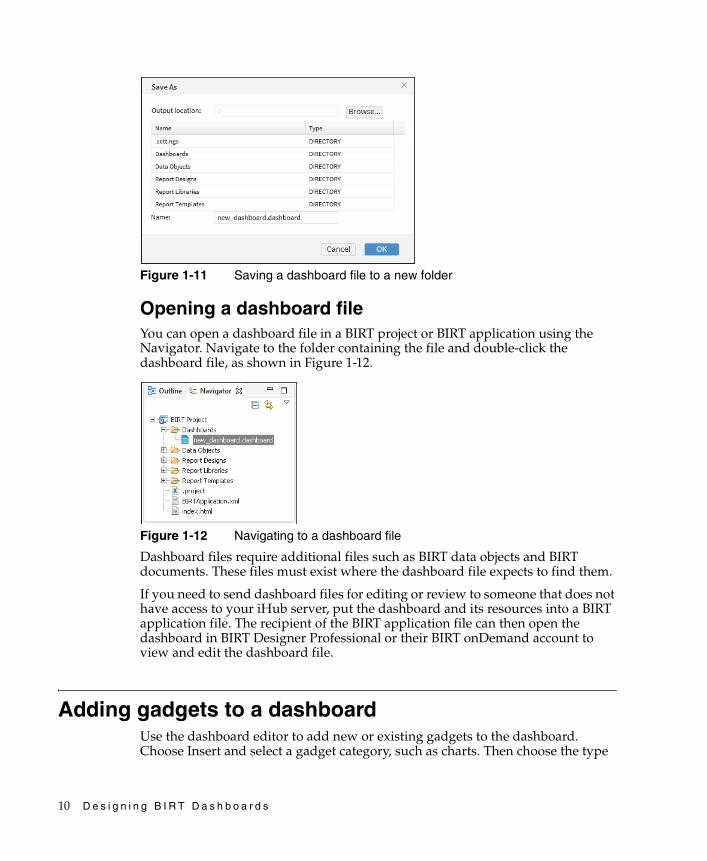
Saving a dashboardSave changes to a dashboard by choosing File➛Save. To save the dashboard with a new name, choose File➛Save as, navigate to a new location and give a new name for the dashboard file, as shown in Figure 1-11.
When you save a dashboard file using BIRT Designer Professional, you save the file to a folder in a BIRT project or a BIRT application. You can then deploy the project or application to a BIRT iHub or cloud server, such as BIRT onDemand or export the dashboard file.
10 D e s i g n i n g B I R T D a s h b o a r d s
Figure 1-11 Saving a dashboard file to a new folder
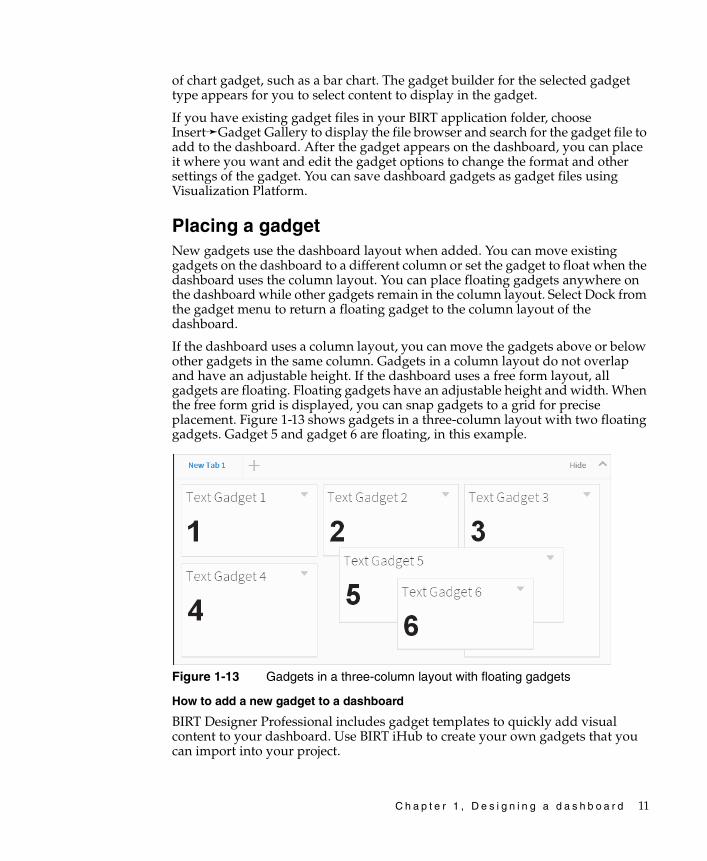
Opening a dashboard fileYou can open a dashboard file in a BIRT project or BIRT application using the Navigator. Navigate to the folder containing the file and double-click the dashboard file, as shown in Figure 1-12.
Figure 1-12 Navigating to a dashboard file
Dashboard files require additional files such as BIRT data objects and BIRT documents. These files must exist where the dashboard file expects to find them.
If you need to send dashboard files for editing or review to someone that does not have access to your iHub server, put the dashboard and its resources into a BIRT application file. The recipient of the BIRT application file can then open the dashboard in BIRT Designer Professional or their BIRT onDemand account to view and edit the dashboard file.
Adding gadgets to a dashboardUse the dashboard editor to add new or existing gadgets to the dashboard. Choose Insert and select a gadget category, such as charts. Then choose the type
C h a p t e r 1 , D e s i g n i n g a d a s h b o a r d 11
of chart gadget, such as a bar chart. The gadget builder for the selected gadget type appears for you to select content to display in the gadget.
If you have existing gadget files in your BIRT application folder, choose Insert➛Gadget Gallery to display the file browser and search for the gadget file to add to the dashboard. After the gadget appears on the dashboard, you can place it where you want and edit the gadget options to change the format and other settings of the gadget. You can save dashboard gadgets as gadget files using Visualization Platform.
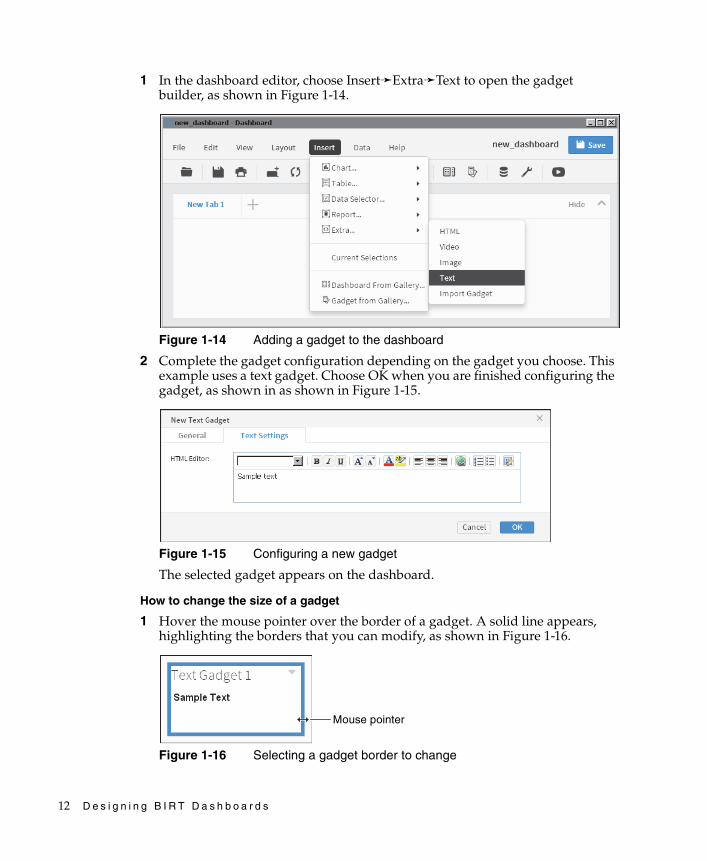
Placing a gadgetNew gadgets use the dashboard layout when added. You can move existing gadgets on the dashboard to a different column or set the gadget to float when the dashboard uses the column layout. You can place floating gadgets anywhere on the dashboard while other gadgets remain in the column layout. Select Dock from the gadget menu to return a floating gadget to the column layout of the dashboard.
If the dashboard uses a column layout, you can move the gadgets above or below other gadgets in the same column. Gadgets in a column layout do not overlap and have an adjustable height. If the dashboard uses a free form layout, all gadgets are floating. Floating gadgets have an adjustable height and width. When the free form grid is displayed, you can snap gadgets to a grid for precise placement. Figure 1-13 shows gadgets in a three-column layout with two floating gadgets. Gadget 5 and gadget 6 are floating, in this example.
Figure 1-13 Gadgets in a three-column layout with floating gadgets
How to add a new gadget to a dashboard
BIRT Designer Professional includes gadget templates to quickly add visual content to your dashboard. Use BIRT iHub to create your own gadgets that you can import into your project.
12 D e s i g n i n g B I R T D a s h b o a r d s
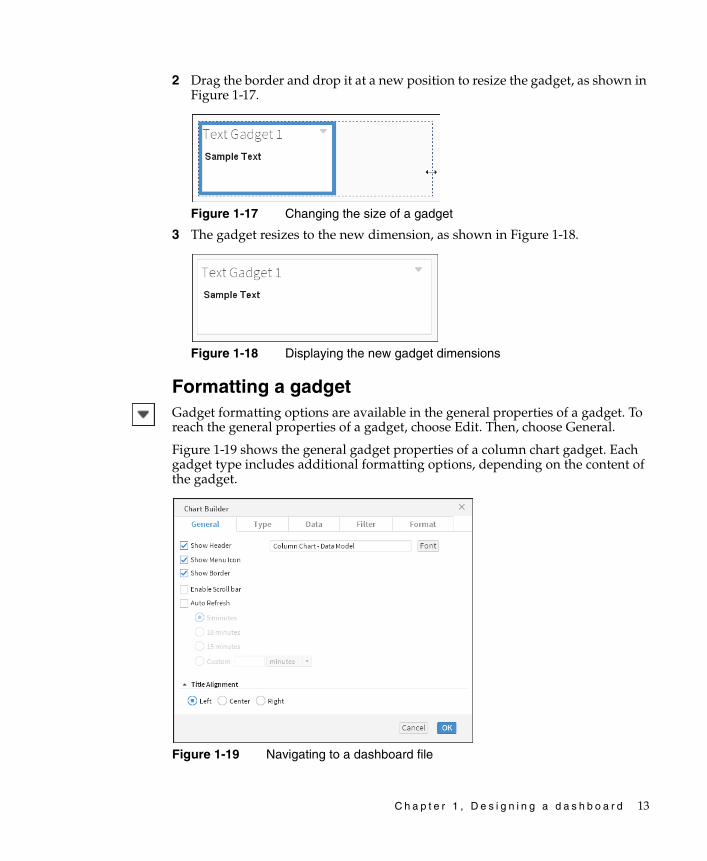
1 In the dashboard editor, choose Insert➛Extra➛Text to open the gadget builder, as shown in Figure 1-14.
Figure 1-14 Adding a gadget to the dashboard
2 Complete the gadget configuration depending on the gadget you choose. This example uses a text gadget. Choose OK when you are finished configuring the gadget, as shown in as shown in Figure 1-15.
Figure 1-15 Configuring a new gadget
The selected gadget appears on the dashboard.
How to change the size of a gadget
1 Hover the mouse pointer over the border of a gadget. A solid line appears, highlighting the borders that you can modify, as shown in Figure 1-16.
Figure 1-16 Selecting a gadget border to change
Mouse pointer
C h a p t e r 1 , D e s i g n i n g a d a s h b o a r d 13
2 Drag the border and drop it at a new position to resize the gadget, as shown in Figure 1-17.
Figure 1-17 Changing the size of a gadget
3 The gadget resizes to the new dimension, as shown in Figure 1-18.
Figure 1-18 Displaying the new gadget dimensions
Formatting a gadgetGadget formatting options are available in the general properties of a gadget. To reach the general properties of a gadget, choose Edit. Then, choose General.
Figure 1-19 shows the general gadget properties of a column chart gadget. Each gadget type includes additional formatting options, depending on the content of the gadget.
Figure 1-19 Navigating to a dashboard file
14 D e s i g n i n g B I R T D a s h b o a r d s
You can personalize gadgets with the following formatting options:
■ Auto Refresh, to refresh the gadget at a selected interval
■ Dimensions, to set the width and height of the gadget after it is added to the dashboard
■ Enable Scroll Bar, to display a scrollbar if the gadget is too small for the content it displays
■ Font, to select a font for the gadget title
■ Gadget Title, to customize the name of the gadget
■ Show Border, to display the gadget border
■ Show Header, to display the header
■ Show Menu Icon, to display a gadget’s editing icon
■ Show Toolbar, to display a toolbar for a cross tab, parameter, report, or table gadget
■ Title Alignment, to set the alignment of the gadget title
Testing dashboard contentAfter adding the gadgets you require, it is important to verify that the dashboard meets your expectations. In the dashboard editor you can choose View➛Run to open the dashboard in a read-only mode.
The following considerations assist in optimizing a dashboard:
■ Avoid long queries when on-demand data is not required by using data object store files instead of data object design files. Object store files are cached in the BIRT iHub, enabling multiple users to quickly access data.
■ Avoid delays in rendering BIRT content by using BIRT report document files in place of BIRT report design files when possible. This avoids the additional time necessary for data population of a report design file.
■ If you are showing only selected parts of a BIRT design file, consider using a BIRT library. A BIRT design file renders every item in the file, even if only part of the file is being used, such as content displayed in a Reportlet gadget. A BIRT library only renders the requested content.
■ Activate dashboard auto refresh only when necessary to monitor changing data.
■ If you display data selection gadgets, such as a list, consider using data objects with optimized indexes for quick population of the gadget.
■ Consider building data cubes to aggregate data before the data is displayed. For example, a table gadget that aggregates values requires the browser to

C h a p t e r 1 , D e s i g n i n g a d a s h b o a r d 15
load all values before it can calculate the aggregate values. If a cross tab was used to display a data cube of the same data, there is less network traffic and less processing done by the web browser.

16 D e s i g n i n g B I R T D a s h b o a r d s