Embed Size (px)
Citation preview

Using GIS to Identify the Potential of Transit-Oriented Development (TOD)
in City of Santa Monica
Yining TanUniversity of Southern California
Price School of Public PolicyPPD 631 GIS for Policy, Planning and Development
Introduction and Problem Identification
Transit-Oriented Development (TOD) is proposed as a method to curb the urban sprawl phenomena and to improve the sustainability of cities. The major characteristics of a TOD neighborhood include a center with a transit station and mixed-use residential and commer-cial development around it. The TOD pattern encourages people to use more public trans-portation, bikes and walking to get around, instead of highly depending on automobiles. Further, one-half mile radius is an important concept in designing a TOD neighborhood as it is generally considered to be an appropriate scale for pedestrians’ walking.
The City of Santa Monica is a beautiful seaside city which attracts visitors for the beaches, Third Street Promenade, arts and galleries and shopping and dining places. The city is also well known as a pioneer in sustainable development with its promotion of using recycle en-ergy, adopting green building standards and the ongoing cleanup efforts of the bay area. To make the city even more sustainable, this project aims to examine the TOD potential within the city and to further identify areas appropriate for transit oriented development.
ArcGIS is a useful tool to analyze large amounts of information through different layers and provide a structured, traceable, and flexible analysis. To analyze the TOD potential, it is im-portant to have a base map and attribute data corresponding to different areas in the base map. ArcGIS could help us understand the characteristics of each area (each census tract, specifically) and thus determine which area is most suitable for TOD.
Methodology, Data Collection and Combination
The project first determines the elements we should take into consideration in order to ana-lyze TOD and then finds data and makes them usable in ArcGIS program, which ultimately deals with the analysis process.
1. Determine which data to collectTo identify the potential for TOD, it is essential to firstly determine which sets of data to ex-amine in order to capture the social and physical dimensions of an ideal TOD.
This project focuses on the following categories:-Demographics. Examine the travel habits of residents with indicators including household income, means of transportation to work, automobile ownership, age and so on.While TOD can be expensive to develop and generates a high demand and real estate value, it is very important to ensure future transit-oriented developments are equitable and within reach of lower income households. What is also important is to identify the percent-age of teenagers and the elderly who are more likely to use public transit.
-Existent transportation infrastructures, including freeways, bus routes, bike routes and bike paths. A TOD neighborhood encourages the use of various transit modes, such as buses, bikes, rails and walking. It is more preferable for developing a TOD neighborhood if it al-ready has many modes of transit for people to use.
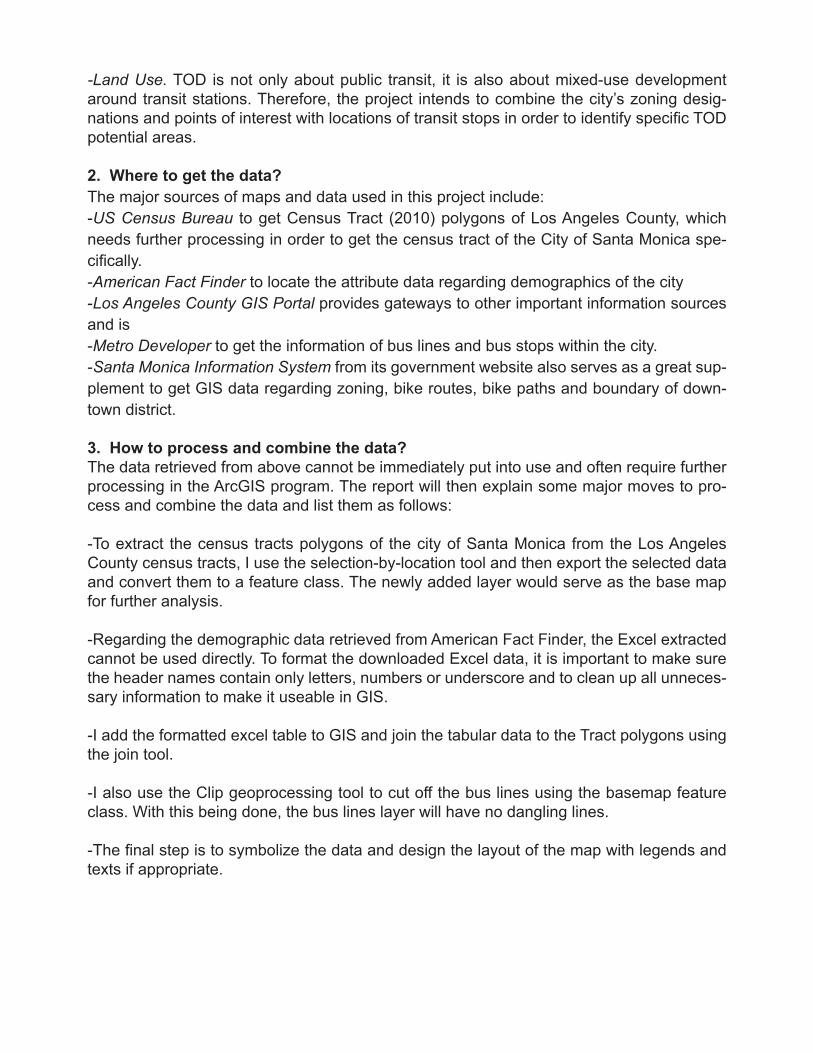
-Land Use. TOD is not only about public transit, it is also about mixed-use development around transit stations. Therefore, the project intends to combine the city’s zoning desig-nations and points of interest with locations of transit stops in order to identify specific TOD potential areas.
2. Where to get the data?The major sources of maps and data used in this project include:-US Census Bureau to get Census Tract (2010) polygons of Los Angeles County, which needs further processing in order to get the census tract of the City of Santa Monica spe-cifically.-American Fact Finder to locate the attribute data regarding demographics of the city-Los Angeles County GIS Portal provides gateways to other important information sources and is -Metro Developer to get the information of bus lines and bus stops within the city.-Santa Monica Information System from its government website also serves as a great sup-plement to get GIS data regarding zoning, bike routes, bike paths and boundary of down-town district.
3. How to process and combine the data?The data retrieved from above cannot be immediately put into use and often require further processing in the ArcGIS program. The report will then explain some major moves to pro-cess and combine the data and list them as follows:
-To extract the census tracts polygons of the city of Santa Monica from the Los Angeles County census tracts, I use the selection-by-location tool and then export the selected data and convert them to a feature class. The newly added layer would serve as the base map for further analysis.
-Regarding the demographic data retrieved from American Fact Finder, the Excel extracted cannot be used directly. To format the downloaded Excel data, it is important to make sure the header names contain only letters, numbers or underscore and to clean up all unneces-sary information to make it useable in GIS.
-I add the formatted excel table to GIS and join the tabular data to the Tract polygons using the join tool.
-I also use the Clip geoprocessing tool to cut off the bus lines using the basemap feature class. With this being done, the bus lines layer will have no dangling lines.
-The final step is to symbolize the data and design the layout of the map with legends and texts if appropriate.

Analysis and Discussion
1. Household Income
From the diagram above, we can locate areas with relatively higher percentage of low in-come residents (annual household income less than 25,000 dollars). Census tract 701902 has the highest percentage of low income residents with percentage rate of 29.31%-36.81% while other five census tracts (701701, 701702, 701801, 701802, 701402) as a group has the second highest rate of low income residents (24.04%-29.3%). As we all know, low in-come residents are more likely to be disadvanteged in mobility if they cannot afford a car. Public transportation, as a result, would play an important role in getting them around.
This correlation betwwen income levels and means of transportaion could be confirmed from the second research result about use of public transit to work.

2. Use of Public Transportation to Work
The diagram above shows the percentage of use of public transportation to work among all transit methods. People living in census tracts 701702 and 701708 have the highest percentage of commuting to work by public transit (6.11%-9.54%). Census tracts 701602, 701701, 701801 and 701902 have the second highest rate (4.3%-6.1%). This trend re-sponds to the distribution of low income residents in the city.
This trend generally corresponds to the household income level, suggesting that low-in-come residetns are more likely to use public transit to work.
In addition to looking at the demographic characteristics and travelling habits, it is equally important to examine the existent transportation infrastructures.
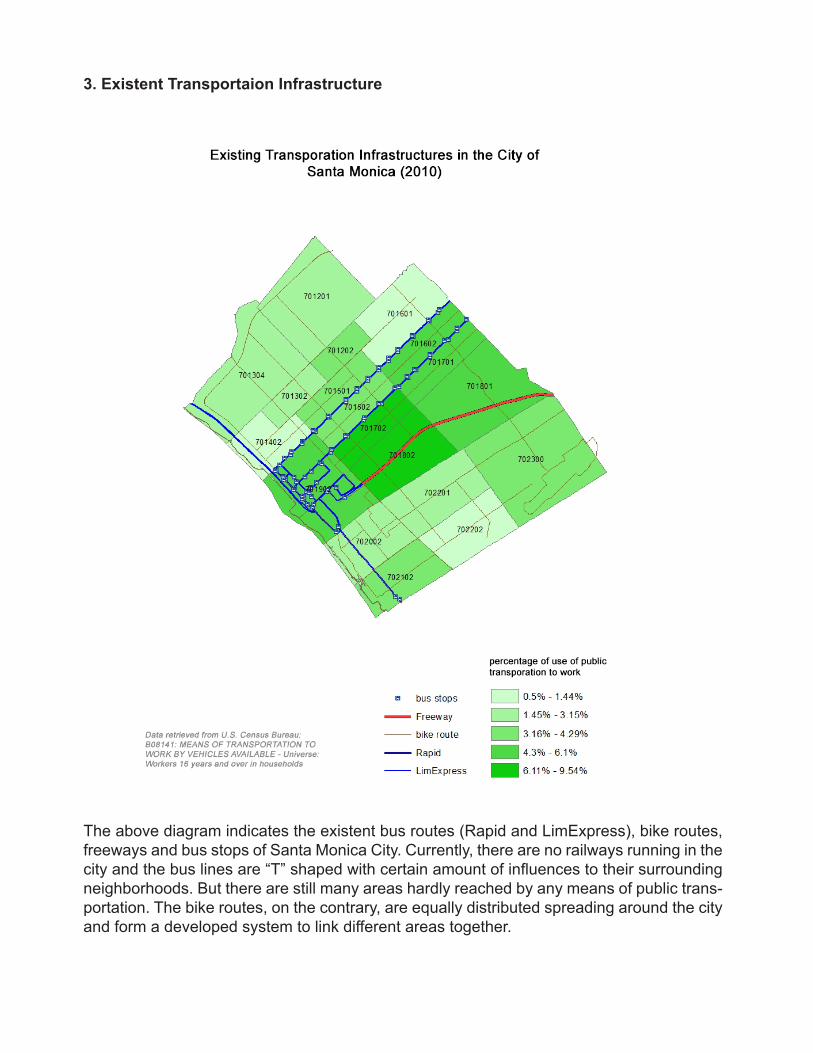
3. Existent Transportaion Infrastructure
The above diagram indicates the existent bus routes (Rapid and LimExpress), bike routes, freeways and bus stops of Santa Monica City. Currently, there are no railways running in the city and the bus lines are “T” shaped with certain amount of influences to their surrounding neighborhoods. But there are still many areas hardly reached by any means of public trans-portation. The bike routes, on the contrary, are equally distributed spreading around the city and form a developed system to link different areas together.
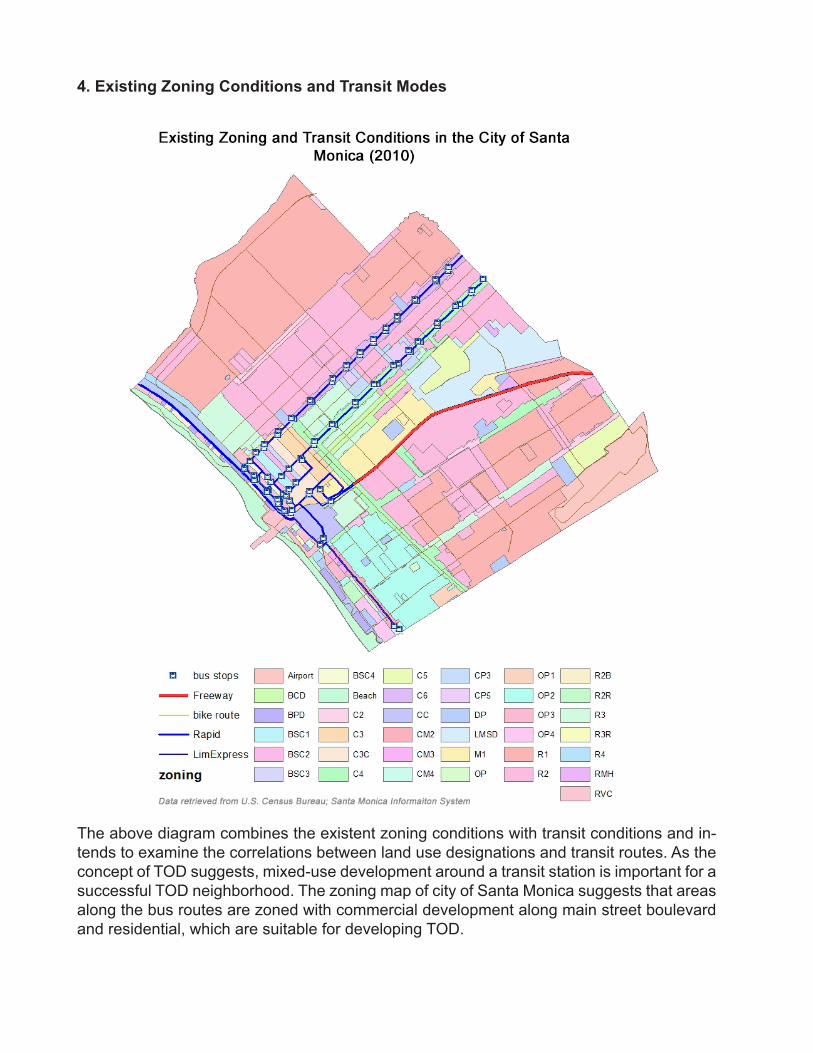
4. Existing Zoning Conditions and Transit Modes
The above diagram combines the existent zoning conditions with transit conditions and in-tends to examine the correlations between land use designations and transit routes. As the concept of TOD suggests, mixed-use development around a transit station is important for a successful TOD neighborhood. The zoning map of city of Santa Monica suggests that areas along the bus routes are zoned with commercial development along main street boulevard and residential, which are suitable for developing TOD.
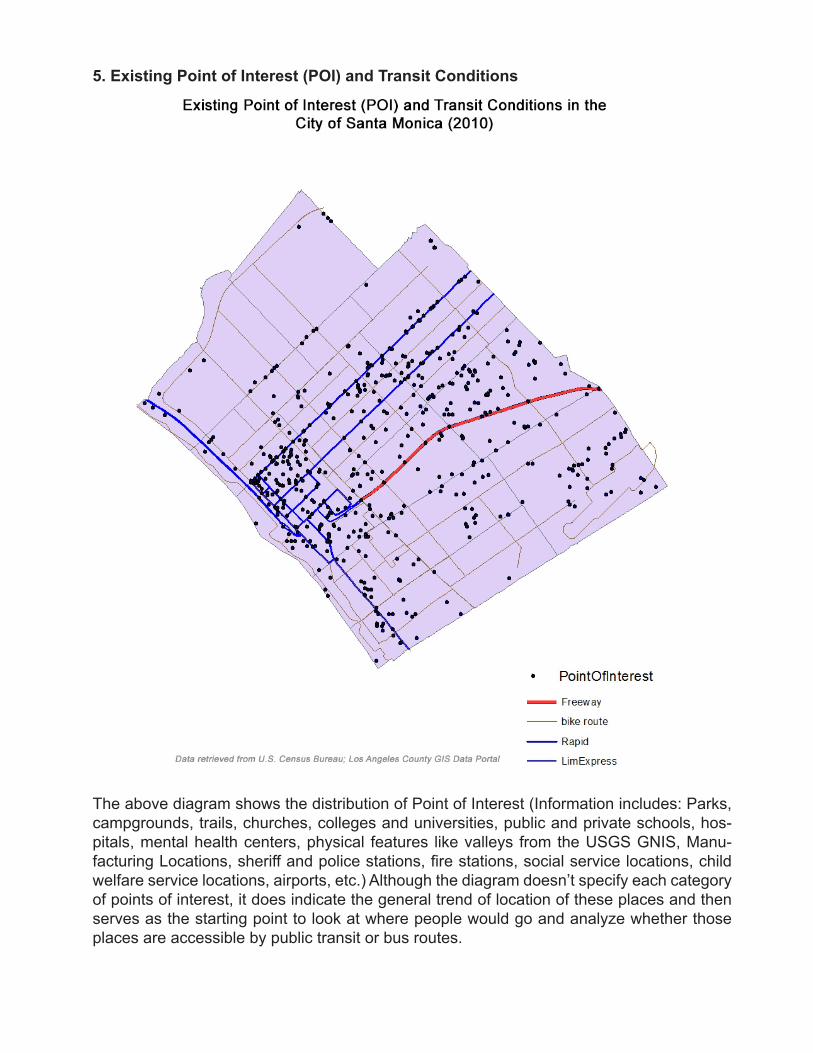
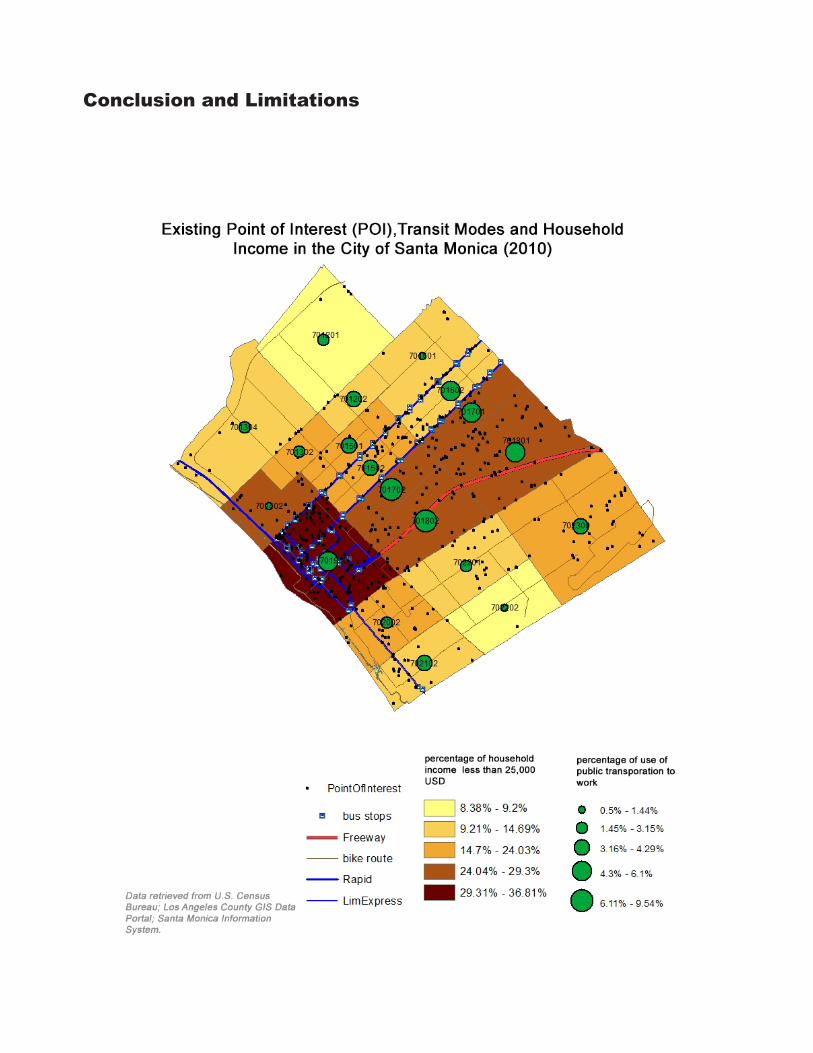
5. Existing Point of Interest (POI) and Transit Conditions
The above diagram shows the distribution of Point of Interest (Information includes: Parks, campgrounds, trails, churches, colleges and universities, public and private schools, hos-pitals, mental health centers, physical features like valleys from the USGS GNIS, Manu-facturing Locations, sheriff and police stations, fire stations, social service locations, child welfare service locations, airports, etc.) Although the diagram doesn’t specify each category of points of interest, it does indicate the general trend of location of these places and then serves as the starting point to look at where people would go and analyze whether those places are accessible by public transit or bus routes.
Conclusion and Limitations

From the analysis and discussions above, we came to find that the census tract 701902 mostly meets the criteria of TOD: It has the largest percentage of low income residents; peo-ple living there are among the groups that mostly use public transit to commute to work; it has the most dense bus lines, bus stops; there are significant numbers of Point of Interest in this area; multi categories of land use are zoned in this area.
This finding is largely expected before the study as the city’s downtown area is mostly locat-ed in this census tract. As a result, it is no surprise that the area has most abundant public transit resources and is concentrated heavily with places to visit. Although the result can be predicted from logic, the study still has its contributions in mapping out the correlations be-tween physical and social environment in developing TOD. The house income and tendency to use public transit corresponds to the existing physical infrastructures such as bus stops and POI.
Of course, due to the constraints of time, the study has some limitations. Firstly, the attribute data collected are based on census tracts. It would generate more precise outcomes if the data were based on parcels or blocks. Secondly, the study doesn’t specify the categories of Point of Interest. Although the general distribution pattern could answer the question of which places people are likely to visit, it would be better if the project can identify which are schools, child care, parks and so forth.
References:
Gorr, W.L. & Kurland K. S. (2011), GIS Tutorial 1: Basic Workbook, Fourth Edition, Esri Press, California
Ngo, V.D. (2012). Identifying Areas for Transit-Oriented Development in Vancouver Using GIS. Trail Six: Undergraduate Journal of Geography, 6, 91-102.Retrieved from: http://blogs.ubc.ca/victorngogisvantod/
Data are retrieved from the sources:US Census Bureau American Fact Finder Metro Developer Santa Monica Information System Los Angeles County GIS Portal