Embed Size (px)
Citation preview
MARINE MAMMAL SCIENCE, 24(1): 147–158 ( January 2008)C© 2007 by the Society for Marine MammalogyDOI: 10.1111/j.1748-7692.2007.00171.x
Using form analysis techniques to improvephotogrammetric mass-estimation methods
KELLY M. PROFFITT
ROBERT A. GARROTT
JAY J. ROTELLA
Ecology Department,Montana State University,
310 Lewis Hall,Bozeman, Montana 59717, U.S.A.
E-mail: [email protected]
SUBHASH LELE
Department of Mathematical and Statistical Sciences,University of Alberta,
Edmonton, Alberta T6G 2G1, Canada
ABSTRACT
Numerical characterization of animal body forms using elliptical Fourier decom-position may be a useful analytic technique in a variety of marine mammal inves-tigations. Using data collected from the Weddell seal (Leptonychotes weddellii), wedescribe the method of body form characterization using elliptical Fourier analysisand demonstrated usefulness of the technique in photogrammetric mass-estimationmodeling. We compared photogrammetric mass-estimation models developed from(1) standard morphometric measurement covariates, (2) elliptical Fourier coefficientcovariates, and (3) a combination of morphometric and Fourier coefficient covariatesand found that mass-estimation models employing a combination of morphometricmeasurements and Fourier coefficients outperformed models containing only one co-variate type. Inclusion of Fourier coefficients in photogrammetric mass-estimationmodels employing standard morphometric measurements reduced the width ofthe prediction interval by 24.4%. Increased precision of photogrammetric mass-estimation models employing Fourier coefficients as model covariates may expandthe range of ecological questions that can be addressed with estimated mass mea-surements.
Key words: body mass, shape analysis, elliptical Fourier analysis, Weddell seal,Leptonychotes weddellii.
Body form analysis techniques are becoming increasingly important in many ma-rine mammal investigations. Numerous cetacean investigations rely on identifyingindividual animals based on dorsal fin form, coloring, or scar patterns (Katona andWhitehead 1981, Wursig and Jefferson 1990, Rugh et al. 1992, Agler et al. 1993,
147
148 MARINE MAMMAL SCIENCE, VOL. 24, NO. 1, 2008
Defran et al. 1999, Karczmarski et al. 1999, Forcada and Aguilar 2000), and nu-merous pinniped investigations estimate body mass based on morphometric forms(Haley et al. 1991, Castellini and Caulkins 1993, Bell et al. 1997, Ireland et al. 2006).Form analyses techniques may provide a repeatable, numeric method of characterizinganimal forms and may improve the precision of photogrammetric mass-estimationmodels (Proffitt et al. 2007a).
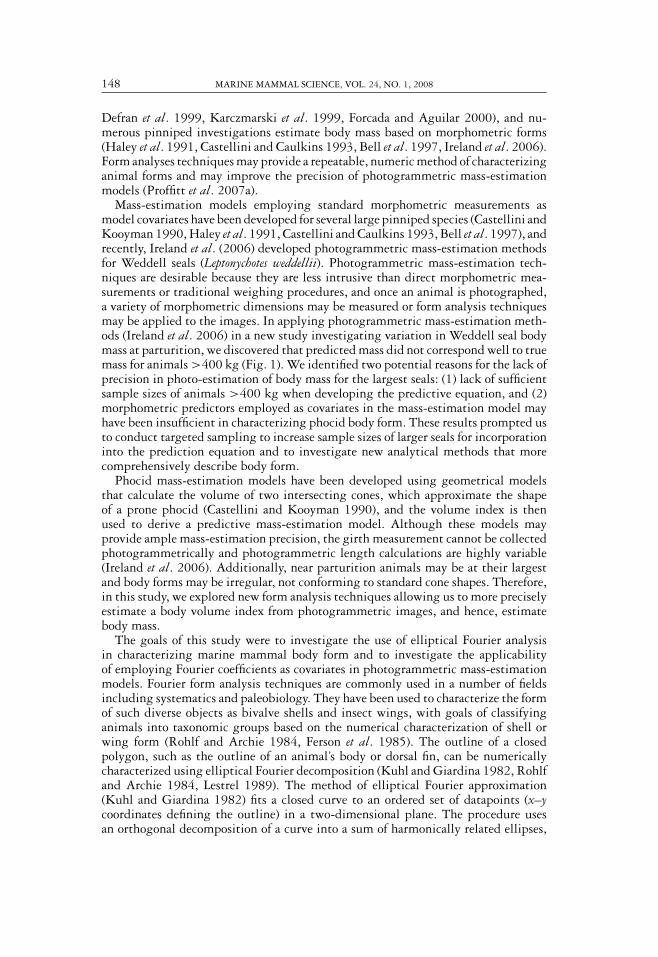
Mass-estimation models employing standard morphometric measurements asmodel covariates have been developed for several large pinniped species (Castellini andKooyman 1990, Haley et al. 1991, Castellini and Caulkins 1993, Bell et al. 1997), andrecently, Ireland et al. (2006) developed photogrammetric mass-estimation methodsfor Weddell seals (Leptonychotes weddellii). Photogrammetric mass-estimation tech-niques are desirable because they are less intrusive than direct morphometric mea-surements or traditional weighing procedures, and once an animal is photographed,a variety of morphometric dimensions may be measured or form analysis techniquesmay be applied to the images. In applying photogrammetric mass-estimation meth-ods (Ireland et al. 2006) in a new study investigating variation in Weddell seal bodymass at parturition, we discovered that predicted mass did not correspond well to truemass for animals >400 kg (Fig. 1). We identified two potential reasons for the lack ofprecision in photo-estimation of body mass for the largest seals: (1) lack of sufficientsample sizes of animals >400 kg when developing the predictive equation, and (2)morphometric predictors employed as covariates in the mass-estimation model mayhave been insufficient in characterizing phocid body form. These results prompted usto conduct targeted sampling to increase sample sizes of larger seals for incorporationinto the prediction equation and to investigate new analytical methods that morecomprehensively describe body form.
Phocid mass-estimation models have been developed using geometrical modelsthat calculate the volume of two intersecting cones, which approximate the shapeof a prone phocid (Castellini and Kooyman 1990), and the volume index is thenused to derive a predictive mass-estimation model. Although these models mayprovide ample mass-estimation precision, the girth measurement cannot be collectedphotogrammetrically and photogrammetric length calculations are highly variable(Ireland et al. 2006). Additionally, near parturition animals may be at their largestand body forms may be irregular, not conforming to standard cone shapes. Therefore,in this study, we explored new form analysis techniques allowing us to more preciselyestimate a body volume index from photogrammetric images, and hence, estimatebody mass.
The goals of this study were to investigate the use of elliptical Fourier analysisin characterizing marine mammal body form and to investigate the applicabilityof employing Fourier coefficients as covariates in photogrammetric mass-estimationmodels. Fourier form analysis techniques are commonly used in a number of fieldsincluding systematics and paleobiology. They have been used to characterize the formof such diverse objects as bivalve shells and insect wings, with goals of classifyinganimals into taxonomic groups based on the numerical characterization of shell orwing form (Rohlf and Archie 1984, Ferson et al. 1985). The outline of a closedpolygon, such as the outline of an animal’s body or dorsal fin, can be numericallycharacterized using elliptical Fourier decomposition (Kuhl and Giardina 1982, Rohlfand Archie 1984, Lestrel 1989). The method of elliptical Fourier approximation(Kuhl and Giardina 1982) fits a closed curve to an ordered set of datapoints (x–ycoordinates defining the outline) in a two-dimensional plane. The procedure usesan orthogonal decomposition of a curve into a sum of harmonically related ellipses,
PROFFITT ET AL.: BODY FORM CHARACTERIZATION 149
Figure 1. The original mass-estimation model developed using standard morphometricmeasurements overhead width (OW), side area (SA), and side height (SH) as model covariates(Ireland et al. 2006, Predicted mass = −134.1 + 3.6[OW] + 0.04[SA] − 2.5[SH]) did notprecisely predict animal mass at the higher end of the predictive range. The 95% confidenceinterval is represented by the dashed line and the 95% prediction interval is represented by theouter solid lines. After the model was developed, new observations (solid circles, this study)of heavy animals frequently fell outside of the predictive range, and we had low confidence inthe original models’ predictive ability for animals above 400 kg.
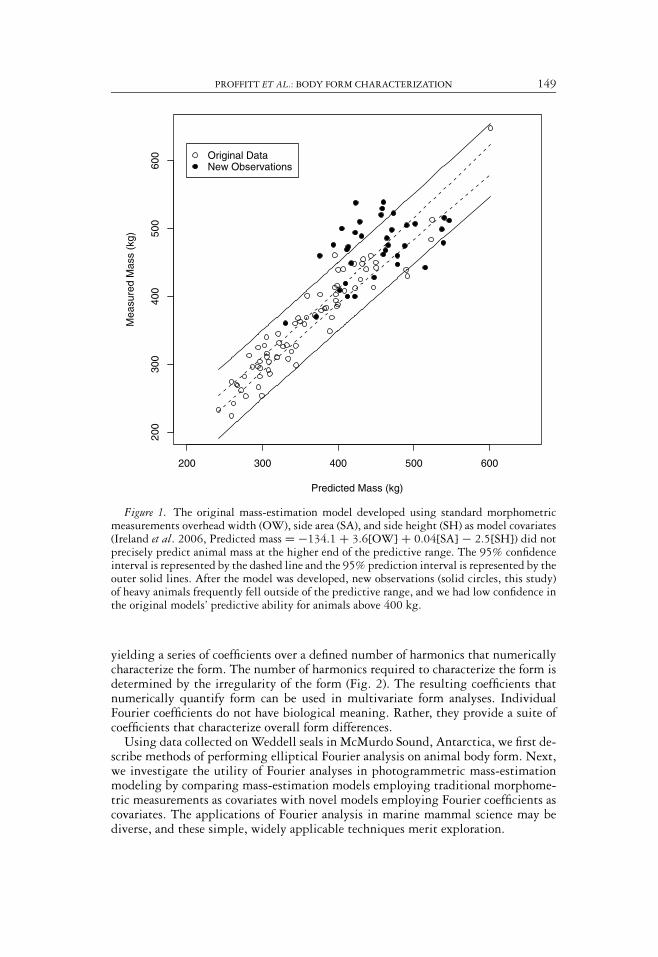
yielding a series of coefficients over a defined number of harmonics that numericallycharacterize the form. The number of harmonics required to characterize the form isdetermined by the irregularity of the form (Fig. 2). The resulting coefficients thatnumerically quantify form can be used in multivariate form analyses. IndividualFourier coefficients do not have biological meaning. Rather, they provide a suite ofcoefficients that characterize overall form differences.
Using data collected on Weddell seals in McMurdo Sound, Antarctica, we first de-scribe methods of performing elliptical Fourier analysis on animal body form. Next,we investigate the utility of Fourier analyses in photogrammetric mass-estimationmodeling by comparing mass-estimation models employing traditional morphome-tric measurements as covariates with novel models employing Fourier coefficients ascovariates. The applications of Fourier analysis in marine mammal science may bediverse, and these simple, widely applicable techniques merit exploration.
150 MARINE MAMMAL SCIENCE, VOL. 24, NO. 1, 2008
Figure 2. Overhead perspective seal image and reconstructions of the seal outline computedwith various numbers of harmonics as indicated by the number within each outline. Asthe number of harmonics used to characterize the shape increased, the complexity of thereconstruction increased.
METHODS
Study System, Mass Measurements, and Photograph Acquisition
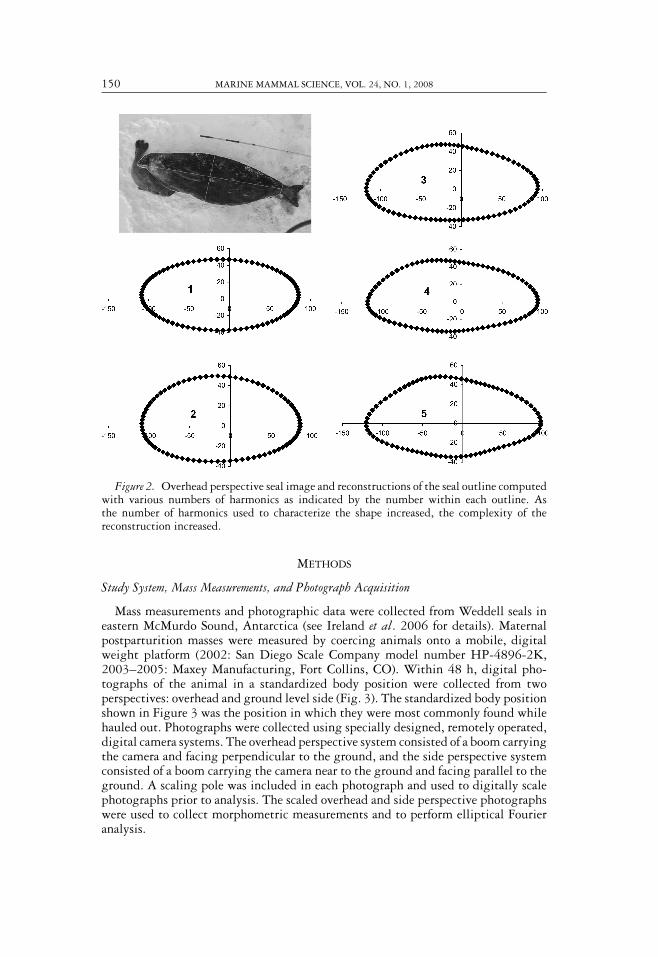
Mass measurements and photographic data were collected from Weddell seals ineastern McMurdo Sound, Antarctica (see Ireland et al. 2006 for details). Maternalpostparturition masses were measured by coercing animals onto a mobile, digitalweight platform (2002: San Diego Scale Company model number HP-4896-2K,2003–2005: Maxey Manufacturing, Fort Collins, CO). Within 48 h, digital pho-tographs of the animal in a standardized body position were collected from twoperspectives: overhead and ground level side (Fig. 3). The standardized body positionshown in Figure 3 was the position in which they were most commonly found whilehauled out. Photographs were collected using specially designed, remotely operated,digital camera systems. The overhead perspective system consisted of a boom carryingthe camera and facing perpendicular to the ground, and the side perspective systemconsisted of a boom carrying the camera near to the ground and facing parallel to theground. A scaling pole was included in each photograph and used to digitally scalephotographs prior to analysis. The scaled overhead and side perspective photographswere used to collect morphometric measurements and to perform elliptical Fourieranalysis.
PROFFITT ET AL.: BODY FORM CHARACTERIZATION 151
Figure 3. Image of a Weddell seal in standard body position from overhead (A) and side(B) perspectives. Morphometric measurements employed to estimate body mass includedoverhead area (OA), overhead width (OW), side area (SA), and side height (SH). The scalingpole used to calibrate the digital image is seen in the background.
Morphometric Covariates
Morphometric measurements were collected from the highest quality overheadand side perspective photographs following Ireland et al. (2006, Fig. 3). From over-head perspective photographs, a two-dimensional surface area (overhead area, OA)and width (overhead width, OW) were collected. From ground side perspective pho-tographs, a two-dimensional surface area (side area, SA) and a maximum height (sideheight, SH) were collected. Caudal flippers and fore flippers were excluded from mea-surements because their position in each photograph was variable, and body lengthmeasurements were also excluded because of their high variability (Ireland et al.2006). These four morphometric measurements (OA, OW, SA, and SH) were usedas covariates in mass-estimation modeling exercises.
Elliptical Fourier Analysis and Fourier Coefficient Covariates
From each of the overhead and ground side images, the two-dimensional outlineof the animal’s body was digitized (MATLAB v 6.5, The Mathworks, Inc., Natick,MA, USA). Between 50 and 100 points were placed along the outline, and the x–ycoordinates associated with these points were extracted. The number of points variedaccording to the shape of an animal, with a greater number of points being necessaryto characterize the shape of the overhead perspective photographs. Elliptical Fourieranalysis was performed on the set of x–y coordinates that defined the animal’s body
152 MARINE MAMMAL SCIENCE, VOL. 24, NO. 1, 2008
form. The coefficients for the first five harmonics were computed for each animal(on both the overhead and side perspective photographs). We chose to consider thefirst five harmonics from both the overhead and side perspective photographs (40coefficients in total) because we did not want to over parameterize the model. Addi-tionally, the two-dimensional body form of a phocid seal from both the overhead andside perspectives is roughly ellipsoid (Fig. 2), and we considered the first five har-monics acceptable in characterizing this body form. The resulting Fourier coefficientswere evaluated as potential covariates in mass-estimation modeling exercises.
The algorithm for computing the elliptical Fourier coefficients is described indetail in Kuhl and Giardina (1982). This algorithm does not require data points tobe spaced equally, allowing for images to be digitized by hand, and treats the x- andy-directional changes independently. The Fourier coefficients for the nth harmonic ofthe outline’s x-axis projection are:
An = T
2n2�2
k∑p=1
�x p
�tp
[(cos
2�ntp
T
)−
(cos
2�ntp−1
T
)]and
Bn = T
2n2�2
k∑p=1
�x p
�tp
[(sin
2�ntp
T
)−
(sin
2�ntp−1
T
)],
where p index’s steps in the outline, k is the number of steps in the outline, �xpis the displacement along the x-axis of the contour between steps p − 1 and p,�tp is the length of the segment between steps p − 1 and p, tp is the accumulatedlength of such segments at step p, and T = tk is the total length of the contour asapproximated by the trace polygon (Kuhl and Giardina 1982). The coefficients forthe y-coordinates of the nth harmonic, Cn and Dn, are found in the same manner usingincremental changes in the y-direction. For each of n harmonics, four coefficients arecomputed (An, Bn, Cn, and Dn). Coefficients can be normalized to be invariant to size,orientation, and location in the digitization space. We normalized coefficients withrespect to orientation and location in digitization space, thus eliminating informationunrelated to mass estimation, but retaining information on size and shape that arecrucial for mass-estimation modeling. Free software to perform the elliptical Fourieranalysis is available (see Ferson et al. 1985 for description of methods).
Mass-Estimation Model Development and Comparisons
We developed three suites of competing mass-estimation models: one employ-ing morphometric measurements derived from photographs as model covariates, oneemploying Fourier coefficients as model covariates, and one employing both mor-phometric measurements and Fourier coefficients as model covariates. The goal wasto explore the applicability of Fourier coefficients in mass-estimation modeling. TheFourier coefficients from the first five harmonics of both the overhead and side per-spective photographs and four morphometric measurements (OA, OW, SA, and SH)were employed as model covariates.
Within each suite of models, we performed all-subsets regression and used theprediction sum of squares (PRESSp) to rank models in terms of their predictive ability(Neter et al. 1996). All-subsets regression was an acceptable methodology in this casebecause our goal in model building was prediction, not explanation or hypothesis
PROFFITT ET AL.: BODY FORM CHARACTERIZATION 153
testing. The PRESSp criterion measures a model’s ability to predict observed responsevalues of data points that were not used in the estimation of the model parameters.Models with the smallest PRESSp values have the smallest prediction error and wereconsidered the top mass-estimation models. We performed a pseudo cross-validationanalysis to assess the fit of the top-ranked models. The mass-estimation model wascreated with one observation left out, and this model was then used to predict themass of the censured observation. We calculated what proportion of 95% predictionintervals for estimated female mass included or covered the known (or true) mass. Wesought a model that generated prediction intervals with coverage levels matching thestated level (95%) and that achieved consistent coverage levels across the full rangeof female mass levels.
RESULTS
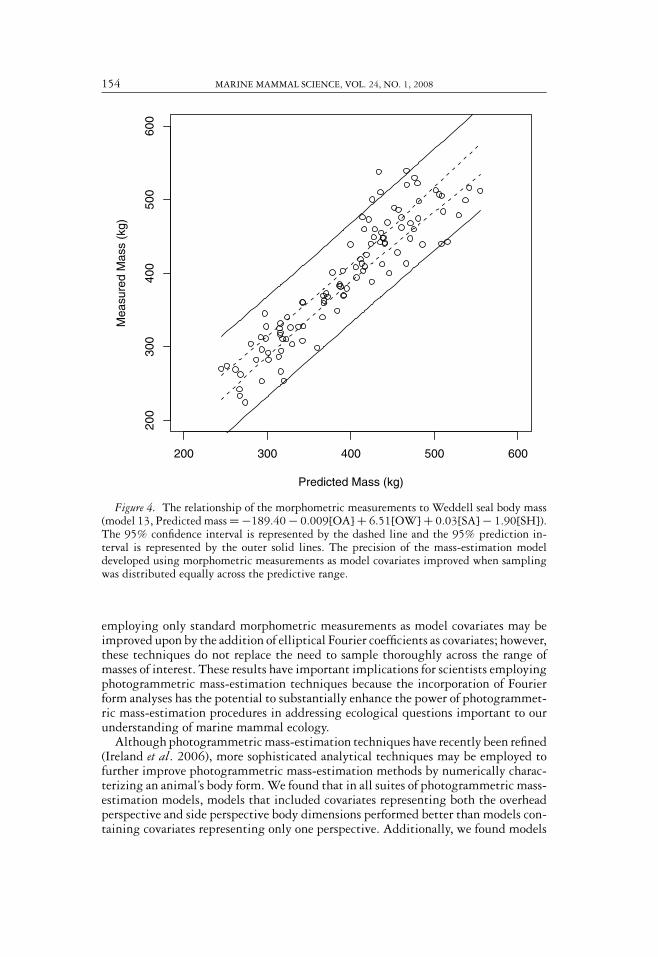
From 2002 to 2005, a total of 107 female Weddell seals were sampled and 106 wereincluded in analyses. One outlier was censured from analyses because the measuredbody mass was more than 120 kg outside the range of masses observed in thisor similar Weddell seal studies (Hill 1987, Wheatley et al. 2006, Proffitt et al.2007b), and we suspected the measurement was inaccurate. Sampled animals wereuniformly distributed over a wide range of masses representative of masses thatwould be expected for adult female seals from parturition to weaning (224.0–539.0kg, X = 395.8, SD = 85.9). By increasing the sample size of animals in the upperend of the predictive range and distributing sampling equally across the entire rangeof masses of interest, we corrected the problem that we had encountered with theprevious mass-estimation model (compare Figs 1 and 4). The cross-validation analysison the best model from the morphometric-measurements-only suite, model 13 (Table1), produced 95% prediction intervals that included the actual mass 95.3%, that is,coverage levels were close to the stated level of 95%. Further, the coverage andprecision were similar across the entire range of masses evaluated (Fig. 4).
We found that Fourier analysis techniques were an efficient method of reducingprediction error in photogrammetric mass estimation procedures, and the best over-all mass-estimation model employed both morphometric and Fourier coefficients asmodel covariates (Table 1). In our mass-estimation models, the addition of Fouriercoefficients as model covariates to models containing morphometric measurementsreduced the width of the prediction interval by 24.4%, thus decreasing the predic-tion error by 12.2% (Fig. 5). The cross-validation analysis on the top model from thecombined morphometric-measurements and Fourier coefficients suite, model 26 (Ta-ble 1), produced 95% prediction intervals that included the directly measured mass96.3%, that is, the coverage level was slightly above the stated 95% level. Modelscontaining only Fourier coefficients did not perform as well as models containingboth Fourier coefficients and morphometric measurements as model covariates.
DISCUSSION
Here, we have presented a numerical method of photogrametrically estimatingbody mass using elliptical Fourier decomposition and demonstrated that Fourieranalysis techniques may be useful in reducing prediction error in photogrammetricmass-estimation models. We found that photogrammetric mass-estimation models
154 MARINE MAMMAL SCIENCE, VOL. 24, NO. 1, 2008
Figure 4. The relationship of the morphometric measurements to Weddell seal body mass(model 13, Predicted mass = −189.40 − 0.009[OA] + 6.51[OW] + 0.03[SA] − 1.90[SH]).The 95% confidence interval is represented by the dashed line and the 95% prediction in-terval is represented by the outer solid lines. The precision of the mass-estimation modeldeveloped using morphometric measurements as model covariates improved when samplingwas distributed equally across the predictive range.
employing only standard morphometric measurements as model covariates may beimproved upon by the addition of elliptical Fourier coefficients as covariates; however,these techniques do not replace the need to sample thoroughly across the range ofmasses of interest. These results have important implications for scientists employingphotogrammetric mass-estimation techniques because the incorporation of Fourierform analyses has the potential to substantially enhance the power of photogrammet-ric mass-estimation procedures in addressing ecological questions important to ourunderstanding of marine mammal ecology.
Although photogrammetric mass-estimation techniques have recently been refined(Ireland et al. 2006), more sophisticated analytical techniques may be employed tofurther improve photogrammetric mass-estimation methods by numerically charac-terizing an animal’s body form. We found that in all suites of photogrammetric mass-estimation models, models that included covariates representing both the overheadperspective and side perspective body dimensions performed better than models con-taining covariates representing only one perspective. Additionally, we found models
PROFFITT ET AL.: BODY FORM CHARACTERIZATION 155
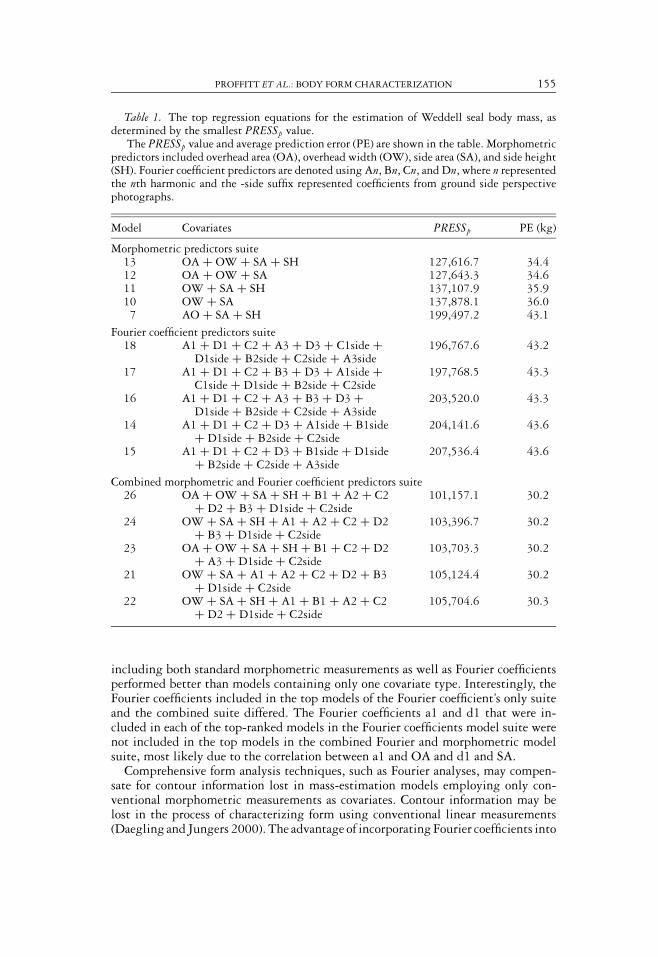
Table 1. The top regression equations for the estimation of Weddell seal body mass, asdetermined by the smallest PRESSp value.
The PRESSp value and average prediction error (PE) are shown in the table. Morphometricpredictors included overhead area (OA), overhead width (OW), side area (SA), and side height(SH). Fourier coefficient predictors are denoted using An, Bn, Cn, and Dn, where n representedthe nth harmonic and the -side suffix represented coefficients from ground side perspectivephotographs.
Model Covariates PRESSp PE (kg)
Morphometric predictors suite13 OA + OW + SA + SH 127,616.7 34.412 OA + OW + SA 127,643.3 34.611 OW + SA + SH 137,107.9 35.910 OW + SA 137,878.1 36.0
7 AO + SA + SH 199,497.2 43.1
Fourier coefficient predictors suite18 A1 + D1 + C2 + A3 + D3 + C1side +
D1side + B2side + C2side + A3side196,767.6 43.2
17 A1 + D1 + C2 + B3 + D3 + A1side +C1side + D1side + B2side + C2side
197,768.5 43.3
16 A1 + D1 + C2 + A3 + B3 + D3 +D1side + B2side + C2side + A3side
203,520.0 43.3
14 A1 + D1 + C2 + D3 + A1side + B1side+ D1side + B2side + C2side
204,141.6 43.6
15 A1 + D1 + C2 + D3 + B1side + D1side+ B2side + C2side + A3side
207,536.4 43.6
Combined morphometric and Fourier coefficient predictors suite26 OA + OW + SA + SH + B1 + A2 + C2
+ D2 + B3 + D1side + C2side101,157.1 30.2
24 OW + SA + SH + A1 + A2 + C2 + D2+ B3 + D1side + C2side
103,396.7 30.2
23 OA + OW + SA + SH + B1 + C2 + D2+ A3 + D1side + C2side
103,703.3 30.2
21 OW + SA + A1 + A2 + C2 + D2 + B3+ D1side + C2side
105,124.4 30.2
22 OW + SA + SH + A1 + B1 + A2 + C2+ D2 + D1side + C2side
105,704.6 30.3
including both standard morphometric measurements as well as Fourier coefficientsperformed better than models containing only one covariate type. Interestingly, theFourier coefficients included in the top models of the Fourier coefficient’s only suiteand the combined suite differed. The Fourier coefficients a1 and d1 that were in-cluded in each of the top-ranked models in the Fourier coefficients model suite werenot included in the top models in the combined Fourier and morphometric modelsuite, most likely due to the correlation between a1 and OA and d1 and SA.
Comprehensive form analysis techniques, such as Fourier analyses, may compen-sate for contour information lost in mass-estimation models employing only con-ventional morphometric measurements as covariates. Contour information may belost in the process of characterizing form using conventional linear measurements(Daegling and Jungers 2000). The advantage of incorporating Fourier coefficients into
156 MARINE MAMMAL SCIENCE, VOL. 24, NO. 1, 2008
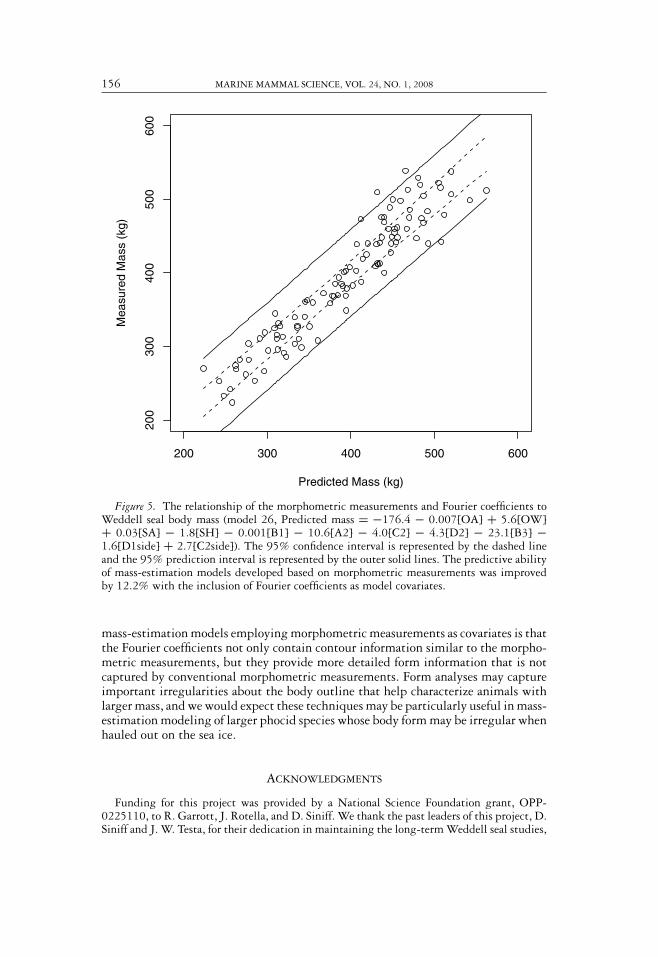
Figure 5. The relationship of the morphometric measurements and Fourier coefficients toWeddell seal body mass (model 26, Predicted mass = −176.4 − 0.007[OA] + 5.6[OW]+ 0.03[SA] − 1.8[SH] − 0.001[B1] − 10.6[A2] − 4.0[C2] − 4.3[D2] − 23.1[B3] −1.6[D1side] + 2.7[C2side]). The 95% confidence interval is represented by the dashed lineand the 95% prediction interval is represented by the outer solid lines. The predictive abilityof mass-estimation models developed based on morphometric measurements was improvedby 12.2% with the inclusion of Fourier coefficients as model covariates.
mass-estimation models employing morphometric measurements as covariates is thatthe Fourier coefficients not only contain contour information similar to the morpho-metric measurements, but they provide more detailed form information that is notcaptured by conventional morphometric measurements. Form analyses may captureimportant irregularities about the body outline that help characterize animals withlarger mass, and we would expect these techniques may be particularly useful in mass-estimation modeling of larger phocid species whose body form may be irregular whenhauled out on the sea ice.
ACKNOWLEDGMENTS
Funding for this project was provided by a National Science Foundation grant, OPP-0225110, to R. Garrott, J. Rotella, and D. Siniff. We thank the past leaders of this project, D.Siniff and J. W. Testa, for their dedication in maintaining the long-term Weddell seal studies,
PROFFITT ET AL.: BODY FORM CHARACTERIZATION 157
and all the personnel who have participated in the study. Special thanks to D. Ireland, B.Stewart, M. Johnston, S. Ellison, G. Hadley, T. Sheer, V. Green, S. Conner, M. McKibben, andS. Mogensen for assistance in collecting these data. This manuscript was greatly improved byinsightful comments from A. Pabst, M. Castellini, and two anonymous reviewers.
LITERATURE CITED
AGLER, B. A., R. L. SCHOOLEY, S. E. FROHOCK, S. K. KATONA AND I. E. SEIPT. 1993.Reproduction of photographically identified fin whales, Balaenoptera physalus, from theGulf of Maine. Journal of Mammalogy 74:557–587.
BELL, C. M., M. A. HINDELL AND H. R. BURTON. 1997. Estimation of body mass in thesouthern elephant seal, Mirounga leonina, by photogrammetry and morphometrics. Ma-rine Mammal Science 13:669–682.
CASTELLINI, M. A., AND D. G. CAULKINS. 1993. Mass estimates using body morphology inStellar’s sea lions. Marine Mammal Science 9:48–54.
CASTELLINI, M. A., AND G. L. KOOYMAN. 1990. Length, girth, and mass relationships inWeddell seals (Leptonychotes weddellii). Marine Mammal Science 6:75–77.
DAEGLING, D. J., AND W. L. JUNGERS. 2000. Elliptical Fourier analysis of symphyseal shapein great ape mandibles. Journal of Human Evolution 39:107–122.
DEFRAN, R. H., D. W. WELLER, D. L. KELLY AND M. A. ESPINOSA. 1999. Range characteristicsof Pacific Coast bottlenose dolphins (Tursiops truncatus) in the Southern California Bight.Marine Mammal Science 15:381–393.
FERSON, S. F., F. J. ROHLF AND R. K. KOEHN. 1985. Measuring shape variation of two-dimensional outlines. Systematic Zoology 34:59–68.
FORCADA, J., AND A. AGUILAR. 2000. Use of photographic identification in capture-recapturestudies of Mediterranean monk seals. Marine Mammal Science 16:767–793.
HALEY, M. P., C. J. DEUTSCH AND B. J. LE BOEUF. 1991. A method for estimating mass oflarge pinnipeds. Marine Mammal Science 7:157–164.
HILL, S. E. 1987. Reproductive ecology of Weddell seals (Leptonychotes weddellii) in McMurdoSound, Antarctica. Ph.D. thesis, University of Minnesota, St. Paul, MN. 106 pp.
IRELAND, D., R. A. GARROTT, J. ROTELLA AND J. BANFIELD. 2006. Development and appli-cation of a mass estimation method for Weddell seals. Marine Mammal Science 22:361–378.
KARCZMARSKI, L., P. WINTER, V. G. COCKCROFT AND A. MCLACHLAN. 1999. Populationanalyses of Indo-Pacific humpback dolphins Sousa chinensis in Algoa Bay, Eastern Cape,South Africa. Marine Mammal Science 15:1115–1123.
KATONA, S. K., AND H. P. WHITEHEAD. 1981. Identifying humpback whales using theirnatural markings. Polar Record 20:439–444.
KUHL, F., AND C. GIARDINA. 1982. Elliptical Fourier features of a closed contour. ComputerVision, Graphics, and Image Processing 18:236–258.
LESTREL, P. 1989. Method for analyzing complex two-dimensional forms: Elliptical Fourierfunctions. American Journal of Human Biology 1:149–164.
NETER, J., M. H. KUTNER, C. J. NACHTSHEIM AND W. WASSERMAN. 1996. Applied linearstatistical models, 4th edition. WCB McGraw-Hill, Boston, MA.
PROFFITT, K. M., R. A. GARROTT, J. J. ROTELLA AND J. BANFIELD. 2007a. The importanceof considering prediction variance in analyses using photogrammetric mass estimates.Marine Mammal Science 23:65–76.
PROFFITT, K. M., R. A. GARROTT, J. ROTELLA AND K. E. WHEATLEY. 2007b. Environmentaland senescent related variations in Weddell seal body mass: Implications for age-specificreproductive performance. Oikos 116:1683–1690.
ROHLF, F., AND J. ARCHIE. 1984. A comparison of Fourier methods for the description ofwing shape in mosquitos (Diptera: Culicidae). Systematic Zoology 33:302–317.
RUGH, D. J., H. W. BRAHAM AND G. W. MILLER. 1992. Methods for photographic identifi-cation of bowhead whales, Balaena mysticetus. Canadian Journal of Zoology 70:617–624.

158 MARINE MAMMAL SCIENCE, VOL. 24, NO. 1, 2008
WHEATLEY, K. E., C. J. BRADSHAW, C. DAVIS, R. G. HARCOURT AND M. A. HINDELL. 2006.Influence of maternal mass and condition on energy transfer in Weddell seals. Journal ofAnimal Ecology 75:724–733.
WURSIG, B., AND T. A. JEFFERSON. 1990. Methods of photo-identification for small cetaceans.Report of the International Whaling Commission (Special Issue 12):43–52.
Received: 9 March 2007Accepted: 15 September 2007