Embed Size (px)
DESCRIPTION
Regarding GNS3 and Cisco learning
Citation preview
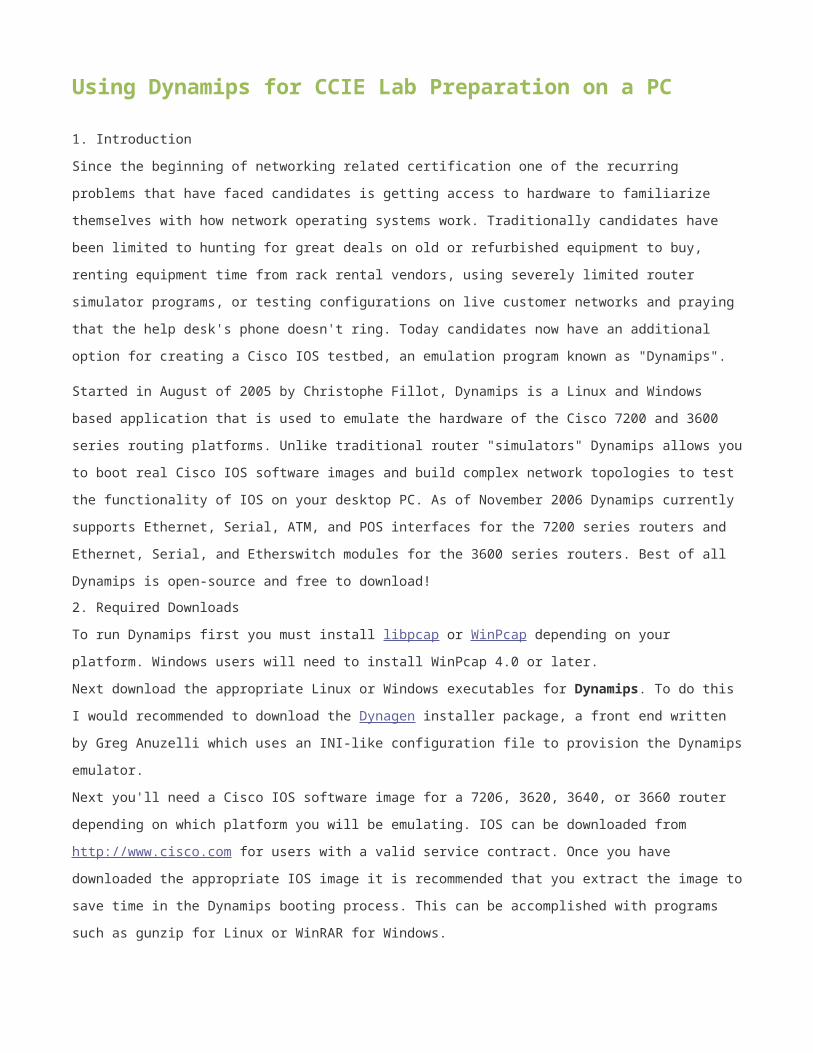
Using Dynamips for CCIE Lab Preparation on a PC
1. Introduction
Since the beginning of networking related certification one of the recurring problems that have faced candidates is
getting access to hardware to familiarize themselves with how network operating systems work. Traditionally
candidates have been limited to hunting for great deals on old or refurbished equipment to buy, renting equipment
time from rack rental vendors, using severely limited router simulator programs, or testing configurations on live
customer networks and praying that the help desk's phone doesn't ring. Today candidates now have an additional
option for creating a Cisco IOS testbed, an emulation program known as "Dynamips".
Started in August of 2005 by Christophe Fillot, Dynamips is a Linux and Windows based application that is used
to emulate the hardware of the Cisco 7200 and 3600 series routing platforms. Unlike traditional router "simulators"
Dynamips allows you to boot real Cisco IOS software images and build complex network topologies to test the
functionality of IOS on your desktop PC. As of November 2006 Dynamips currently supports Ethernet, Serial,
ATM, and POS interfaces for the 7200 series routers and Ethernet, Serial, and Etherswitch modules for the 3600
series routers. Best of all Dynamips is open-source and free to download!
2. Required Downloads
To run Dynamips first you must install libpcap or WinPcap depending on your platform. Windows users will need
to install WinPcap 4.0 or later.
Next download the appropriate Linux or Windows executables for Dynamips. To do this I would recommended to
download the Dynagen installer package, a front end written by Greg Anuzelli which uses an INI-like configuration
file to provision the Dynamips emulator.
Next you'll need a Cisco IOS software image for a 7206, 3620, 3640, or 3660 router depending on which platform
you will be emulating. IOS can be downloaded from http://www.cisco.com for users with a valid service contract.
Once you have downloaded the appropriate IOS image it is recommended that you extract the image to save time
in the Dynamips booting process. This can be accomplished with programs such as gunzip for Linux or WinRAR
for Windows.
Next you need to build a Dynagen .net file to provision the Dynamips emulator, or you can download prebuilt ones
to emulate the INE Routing & Switching and Service Provider topologies from here:
INE Topologies for Dynagen
Note that these files may need minor modification to specify your working directories and the names and locations
of your Cisco IOS images. Also included in the INE Topologies for Dynagen is a router instance that is designated
as a Terminal Server (Access Server). This instance can be used like a Cisco 2511 series router to reverse telnet
to the console ports of the virtual Dynamips router instances, similar to how the Terminal Server is used in the
CCIE Lab Exam.
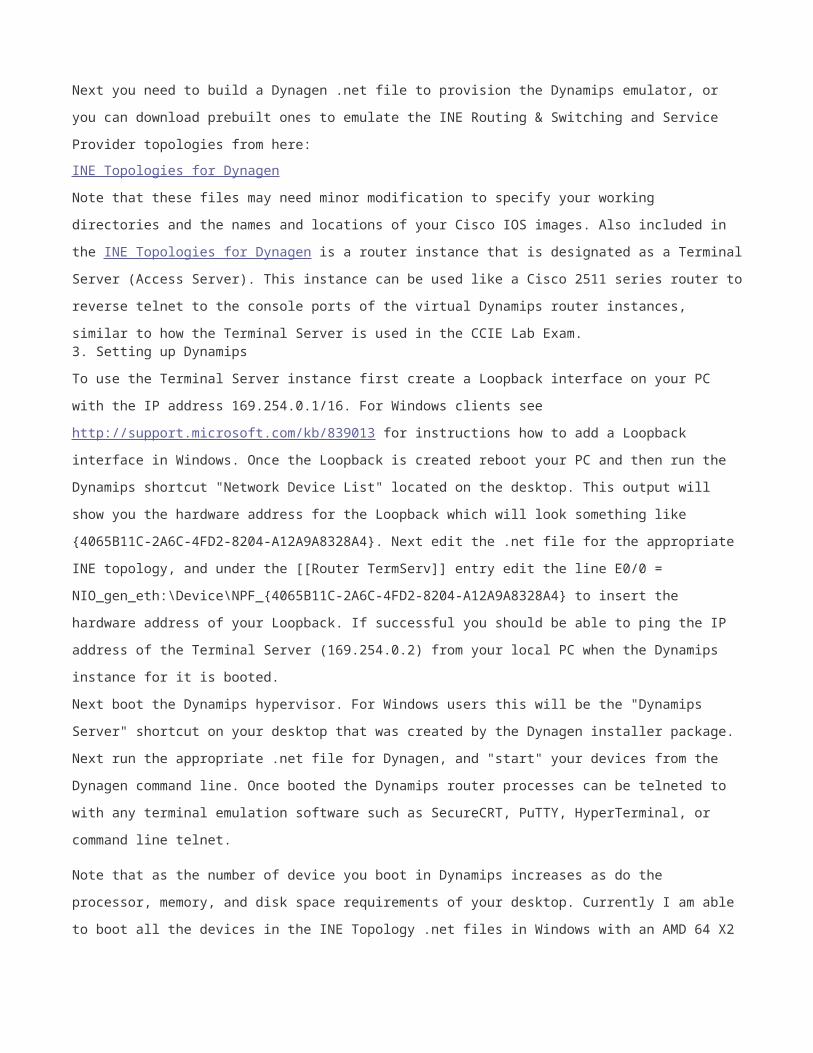
3. Setting up Dynamips
To use the Terminal Server instance first create a Loopback interface on your PC with the IP address
169.254.0.1/16. For Windows clients see http://support.microsoft.com/kb/839013 for instructions how to add a
Loopback interface in Windows. Once the Loopback is created reboot your PC and then run the Dynamips
shortcut "Network Device List" located on the desktop. This output will show you the hardware address for the
Loopback which will look something like {4065B11C-2A6C-4FD2-8204-A12A9A8328A4}. Next edit the .net file for
the appropriate INE topology, and under the [[Router TermServ]] entry edit the line E0/0 = NIO_gen_eth:\Device\
NPF_{4065B11C-2A6C-4FD2-8204-A12A9A8328A4} to insert the hardware address of your Loopback. If
successful you should be able to ping the IP address of the Terminal Server (169.254.0.2) from your local PC
when the Dynamips instance for it is booted.
Next boot the Dynamips hypervisor. For Windows users this will be the "Dynamips Server" shortcut on your
desktop that was created by the Dynagen installer package. Next run the appropriate .net file for Dynagen, and
"start" your devices from the Dynagen command line. Once booted the Dynamips router processes can be
telneted to with any terminal emulation software such as SecureCRT, PuTTY, HyperTerminal, or command line
telnet.
Note that as the number of device you boot in Dynamips increases as do the processor, memory, and disk space
requirements of your desktop. Currently I am able to boot all the devices in the INE Topology .net files in Windows
with an AMD 64 X2 Dual Core 4400+ processor with 2Gb of RAM and about 2Gb of disk space in the devices'
working directory.
As the project matures more functionality is sure to be added. For more information on the project visit the
following sites:
Dynamips: http://www.ipflow.utc.fr/index.php/Cisco_7200_Simulator Dynagen: http://dyna-gen.sourceforge.net/
Hacki's Forum: http://7200emu.hacki.at/
Using MRTG with GNS3February 28th, 2010 by kaage Leave a reply »
In this tutorial we’ll use MRTG program to get traffic statistics from emulated routers in GNS3.
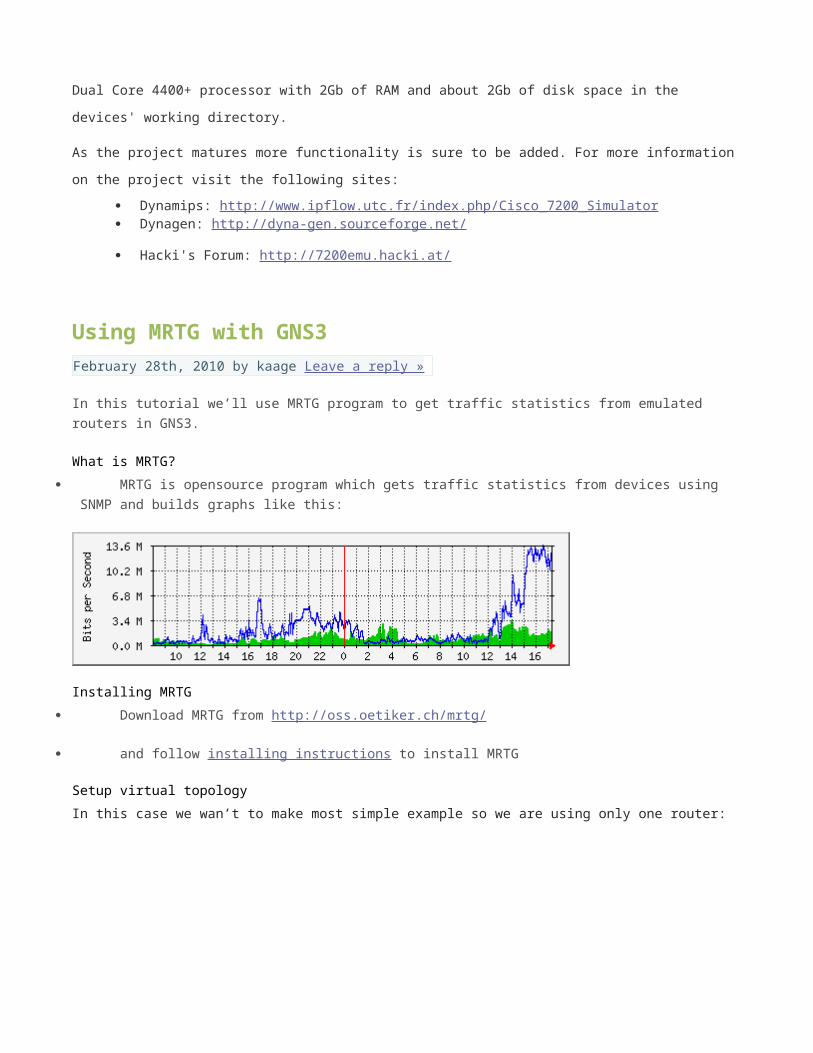
What is MRTG?
MRTG is opensource program which gets traffic statistics from devices using SNMP and builds graphs
like this:
Installing MRTG
Download MRTG from http://oss.oetiker.ch/mrtg/
and follow installing instructions to install MRTG
Setup virtual topology
In this case we wan’t to make most simple example so we are using only one router:
Install Ms loopback adapter to your Windows machine and configured IP-address 10.10.10.1/24 for it.
Configure router:
hostname R0
!
interface FastEthernet1/0
ip address 10.10.10.2 255.255.255.0
duplex auto
speed auto
!
!
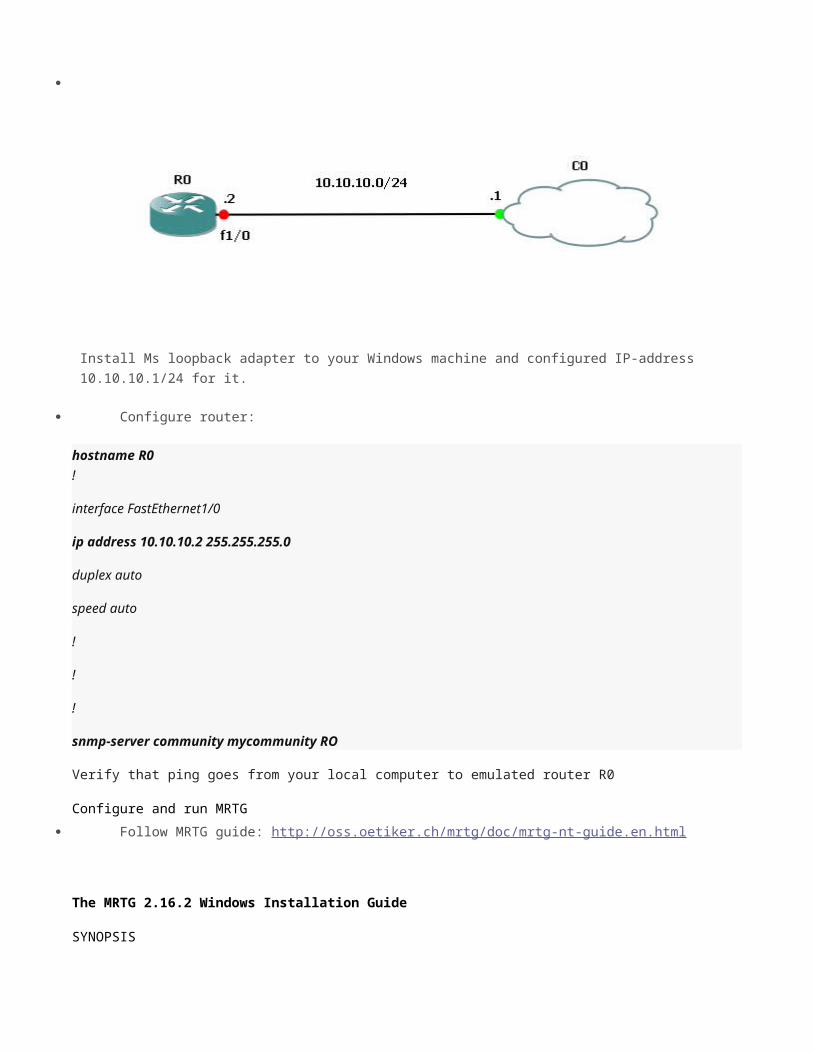
!
snmp-server community mycommunity RO
Verify that ping goes from your local computer to emulated router R0
Configure and run MRTG
Follow MRTG guide: http://oss.oetiker.ch/mrtg/doc/mrtg-nt-guide.en.html
The MRTG 2.16.2 Windows Installation Guide
SYNOPSIS
Installing MRTG on a Windows box is not quite as "click and point" as some might want it to be. But then again, it is not all that difficult if you follow the instructions below.
PREREQUISITES
To get MRTG to work on Windows you need the following:
A current copy of Perl. For Example ActivePerl 5.8.8 from ActiveState http://www.activestate.com/store/activeperl/download/
The latest version of MRTG from http://oss.oetiker.ch/mrtg/pub. Look for mrtg-2.16.2.zip or better. The archive also contains a precompiled copy of rateup.exe for Win32.
INSTALLING
I suggest you do the following from the machine that will be running MRTG, which, in this case, is also a web server. All examples are for doing things to a LOCAL machine.
First
Unzip MRTG to C:\mrtg-2.16.2 on the Windows machine of your choice.
Next
Install Perl on the same Windows machine. You might want to make sure that the Perl binary directory is listed in your system path.
C:\Perl\bin;%SystemRoot%\system32;%SystemRoot%;...
You can manually check this by going to [Control Panel]->[System]->[Environment]
To see if everything is installed properly you can open a Command Shell and go into c:\mrtg-2.16.2\bin. Type:
perl mrtg
This should give you a friendly error message complaining about the missing MRTG configuration file. Now, you have successfully installed MRTG and Perl.
CONFIGURING MRTG
Now it is time to create a configuration for MRTG. But before we begin you need to know a few things. Take an opportunity to gather the following information:
The IP address or hostname and the SNMP port number, (if non standard), of the device you want to monitor.
If you want to monitor something other than bytes in and out, you must also know the SNMPOID of what you want to monitor.
Finally you need to know the read-only SNMP community string for your device. If you don't know it, try public, that is the default.
For the rest of this document we will be using device 10.10.10.1 ( a CISCO Catalyst 5000) with Community string public. We are interested in monitoring traffic, and the CPU load. Let's begin.
The first thing we do in setting up MRTG is making a default config file. Get to a cmd prompt and change to the c:\mrtg-2.16.2\bin directory. Type the following command:
perl cfgmaker [email protected] --global "WorkDir: c:\www\mrtg" --output mrtg.cfg
This creates an initial MRTG config file for you. Note that in this file all interfaces of your router will be stored by number. Unfortunately, these numbers are likely to change whenever you reconfigure your router. In order to work around this you can get cfgmaker to produce a configuration which is based on Ip numbers, or even Interface Descriptions. Check cfgmaker
If you get an error message complaining about no such name or no response, your community name is probably wrong.
Now, let's take a look at the mrtg.cfg file that was created.
In Perl, a # is a comment, synonymous with REM in DOS.
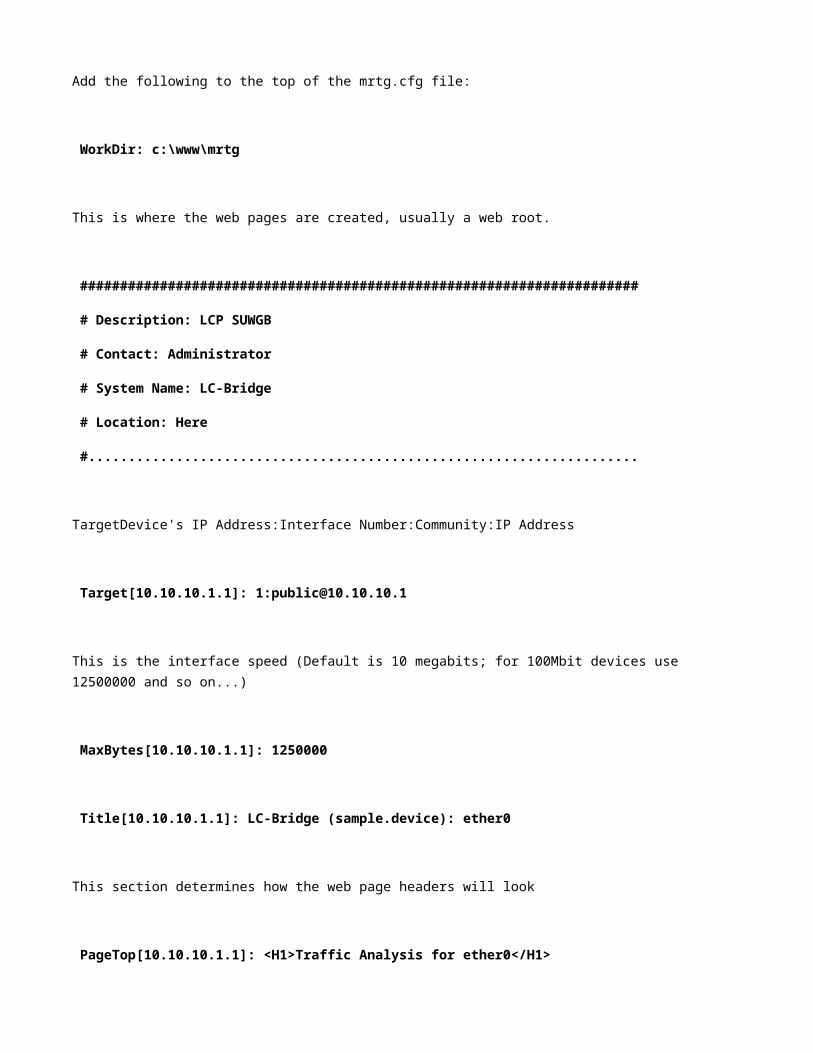
Add the following to the top of the mrtg.cfg file:
WorkDir: c:\www\mrtg
This is where the web pages are created, usually a web root.
######################################################################
# Description: LCP SUWGB
# Contact: Administrator
# System Name: LC-Bridge
# Location: Here
#.....................................................................
TargetDevice's IP Address:Interface Number:Community:IP Address
Target[10.10.10.1.1]: 1:[email protected]
This is the interface speed (Default is 10 megabits; for 100Mbit devices use 12500000 and so on...)
MaxBytes[10.10.10.1.1]: 1250000
Title[10.10.10.1.1]: LC-Bridge (sample.device): ether0
This section determines how the web page headers will look
PageTop[10.10.10.1.1]: <H1>Traffic Analysis for ether0</H1>
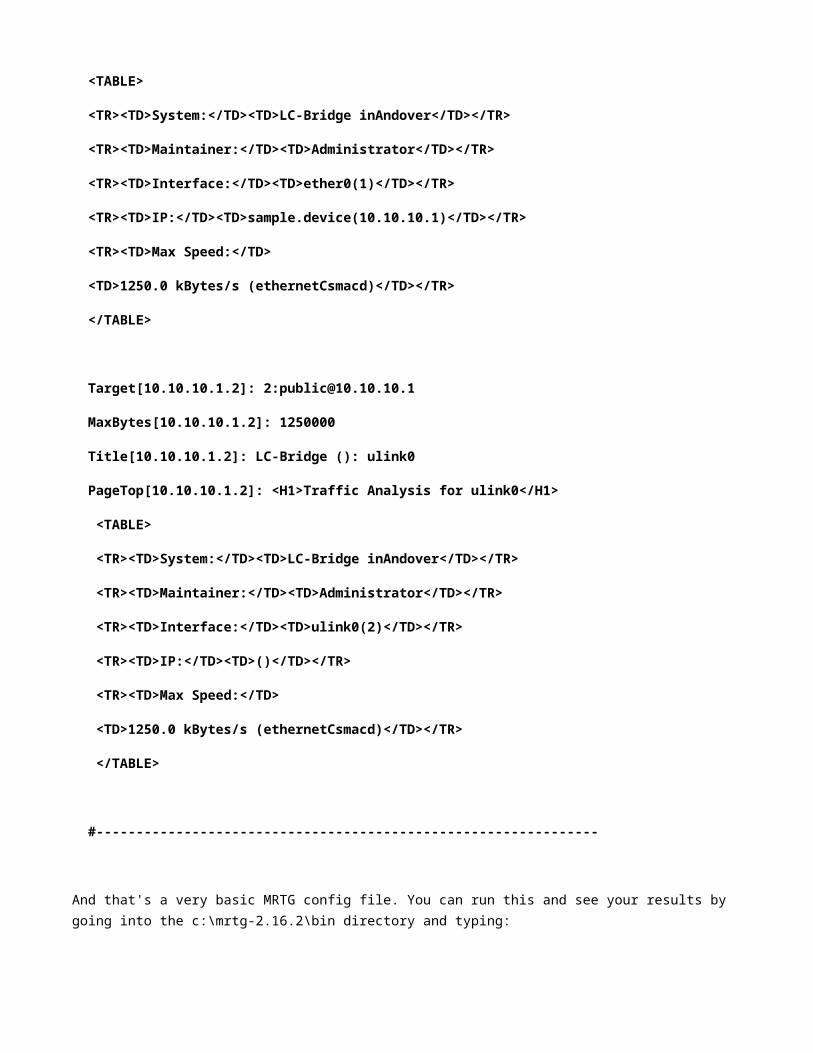
<TABLE>
<TR><TD>System:</TD><TD>LC-Bridge inAndover</TD></TR>
<TR><TD>Maintainer:</TD><TD>Administrator</TD></TR>
<TR><TD>Interface:</TD><TD>ether0(1)</TD></TR>
<TR><TD>IP:</TD><TD>sample.device(10.10.10.1)</TD></TR>
<TR><TD>Max Speed:</TD>
<TD>1250.0 kBytes/s (ethernetCsmacd)</TD></TR>
</TABLE>
Target[10.10.10.1.2]: 2:[email protected]
MaxBytes[10.10.10.1.2]: 1250000
Title[10.10.10.1.2]: LC-Bridge (): ulink0
PageTop[10.10.10.1.2]: <H1>Traffic Analysis for ulink0</H1>
<TABLE>
<TR><TD>System:</TD><TD>LC-Bridge inAndover</TD></TR>
<TR><TD>Maintainer:</TD><TD>Administrator</TD></TR>
<TR><TD>Interface:</TD><TD>ulink0(2)</TD></TR>
<TR><TD>IP:</TD><TD>()</TD></TR>
<TR><TD>Max Speed:</TD>
<TD>1250.0 kBytes/s (ethernetCsmacd)</TD></TR>
</TABLE>
#---------------------------------------------------------------
And that's a very basic MRTG config file. You can run this and see your results by going into the c:\mrtg-2.16.2\bin directory and typing:
perl mrtg mrtg.cfg
It is normal to get errors for the first two times you run this command. The errors will alert you about the fact that there have not been any log files in existence before.
If you take a look at those web pages they are not very exciting (yet). You need to have the MRTG files run every five minutes to produce the desired results. Just run it again after a few minutes. You should now be able to see the first lines in your graphs.
MAKE MRTG RUN ALL THE TIME
Starting MRTG by hand every time you want to run it is not going to make you happy I guess.
There is a special option you can set in the MRTG configuration file so so that MRTG will not terminate after it was started. Instead it will wait for 5 minutes and then run again.
Add the option
RunAsDaemon: yes
to your mrtg.cfg file and start it with:
start /Dc:\mrtg-2.16.2\bin wperl mrtg --logging=eventlog mrtg.cfg
If you use wperl instead of perl, no console window will show. MRTG is now running in the background. If it runs into problems it will tell you so over the EventLog. To stop MRTG, open the Task Manager and terminate the wperl.exe process. If mrtg has anything to tell you these messages can be found in the event log.
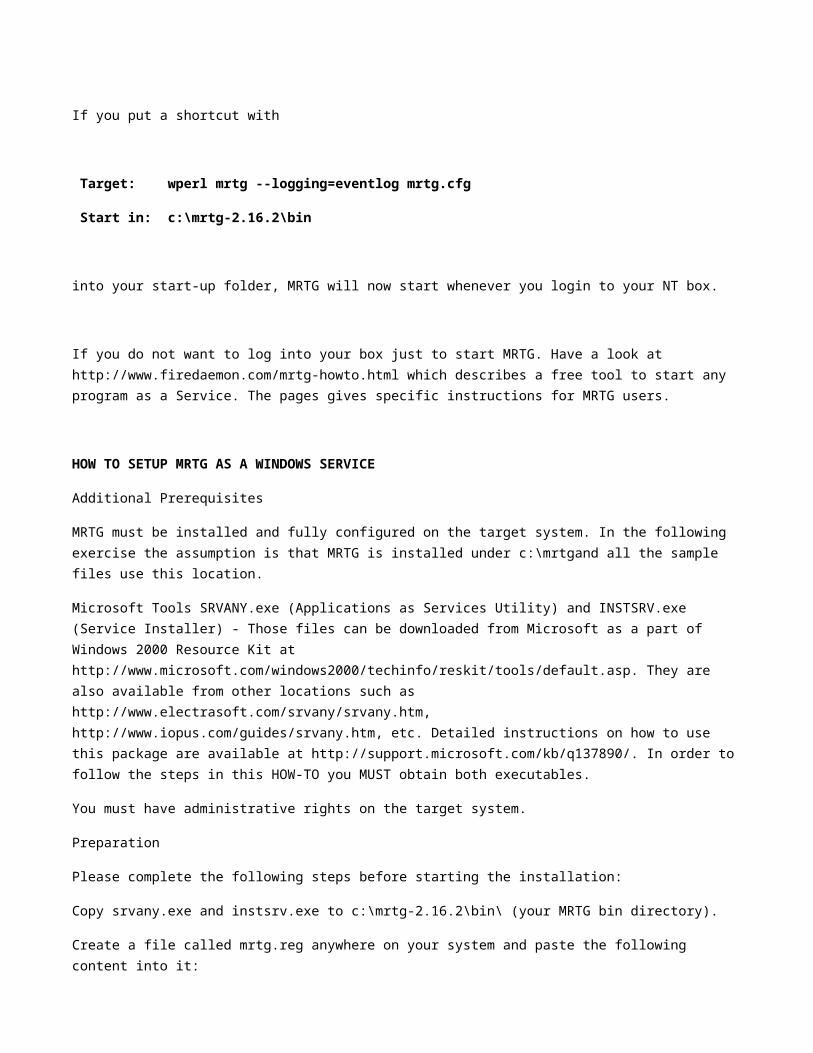
If you put a shortcut with
Target: wperl mrtg --logging=eventlog mrtg.cfg
Start in: c:\mrtg-2.16.2\bin
into your start-up folder, MRTG will now start whenever you login to your NT box.
If you do not want to log into your box just to start MRTG. Have a look at http://www.firedaemon.com/mrtg-howto.html which describes a free tool to start any program as a Service. The pages gives specific instructions for MRTG users.
HOW TO SETUP MRTG AS A WINDOWS SERVICE
Additional Prerequisites

MRTG must be installed and fully configured on the target system. In the following exercise the assumption is that MRTG is installed under c:\mrtgand all the sample files use this location.
Microsoft Tools SRVANY.exe (Applications as Services Utility) and INSTSRV.exe (Service Installer) - Those files can be downloaded from Microsoft as a part of Windows 2000 Resource Kit at http://www.microsoft.com/windows2000/techinfo/reskit/tools/default.asp. They are also available from other locations such as http://www.electrasoft.com/srvany/srvany.htm, http://www.iopus.com/guides/srvany.htm, etc. Detailed instructions on how to use this package are available at http://support.microsoft.com/kb/q137890/. In order to follow the steps in this HOW-TO you MUST obtain both executables.
You must have administrative rights on the target system.
Preparation
Please complete the following steps before starting the installation:
Copy srvany.exe and instsrv.exe to c:\mrtg-2.16.2\bin\ (your MRTG bin directory).
Create a file called mrtg.reg anywhere on your system and paste the following content into it:
Windows Registry Editor Version 5.00
[HKEY_LOCAL_MACHINE\SYSTEM\CurrentControlSet\Services\MRTG\Parameters]
"Application"="c:\\perl\\bin\\wperl.exe"
"AppParameters"="c:\\mrtg-2.16.2\\bin\\mrtg --logging=eventlog c:\\mrtg-2.16.2\\bin\\mrtg.cfg"
"AppDirectory"="c:\\mrtg-2.16.2\\bin\\"
Service Installation
Once again, assuming that MRTG is already fully installed and configured on the target system under c:\mrtg\ the following steps are necessary to setup MRTG as a service.
Using the command prompt go into the temporary directory where you unzipped the package. When there type the following command to create a service named "MRTG" in the Windows Services management console:
instsrv MRTG c:\mrtg\bin\srvany.exe
Now you need to create the App* entries required for the new service. You can do this by either right-clicking on the mrtg.reg file and selecting 'merge' or by running the following command:
regedit /s mrtg.reg
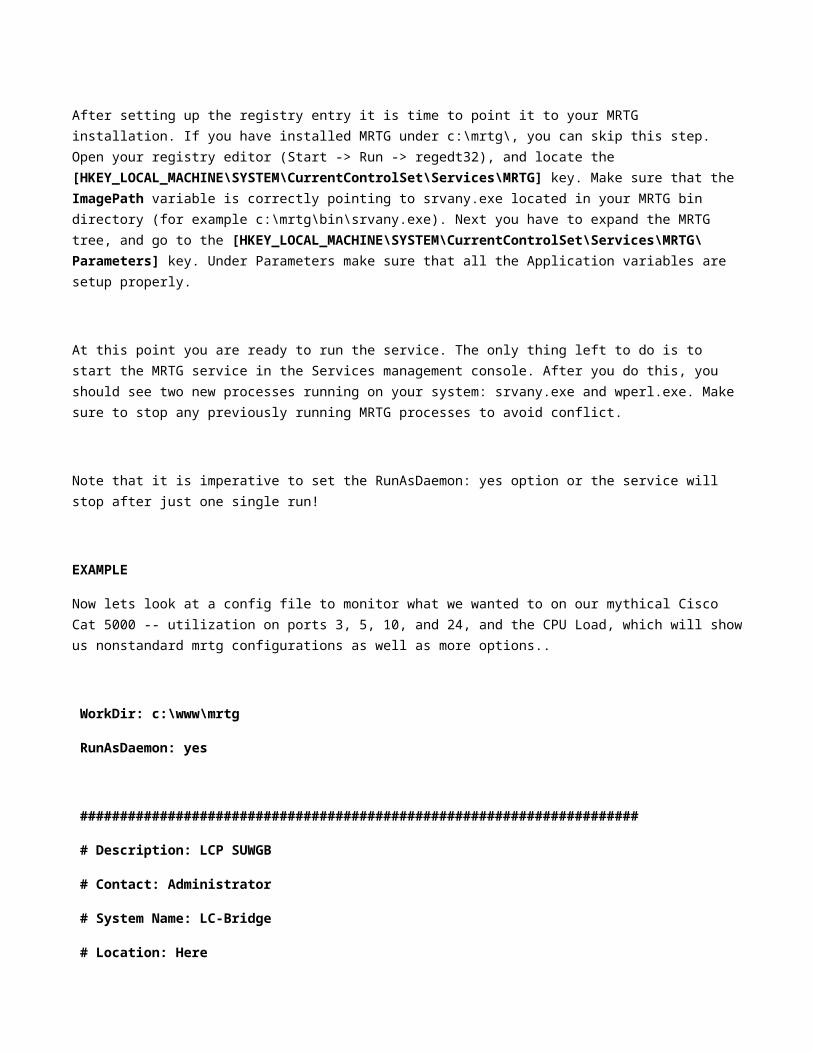
After setting up the registry entry it is time to point it to your MRTG installation. If you have installed MRTG under c:\mrtg\, you can skip this step. Open your registry editor (Start -> Run -> regedt32), and locate the [HKEY_LOCAL_MACHINE\SYSTEM\CurrentControlSet\Services\MRTG] key. Make sure that the ImagePath variable is correctly pointing to srvany.exe located in your MRTG bin directory (for example c:\mrtg\bin\srvany.exe). Next you have to expand the MRTG tree, and go to the [HKEY_LOCAL_MACHINE\SYSTEM\CurrentControlSet\Services\MRTG\Parameters] key. Under Parameters make sure that all the Application variables are setup properly.
At this point you are ready to run the service. The only thing left to do is to start the MRTG service in the Services management console. After you do this, you should see two new processes running on your system: srvany.exe and wperl.exe. Make sure to stop any previously running MRTG processes to avoid conflict.
Note that it is imperative to set the RunAsDaemon: yes option or the service will stop after just one single run!
EXAMPLE
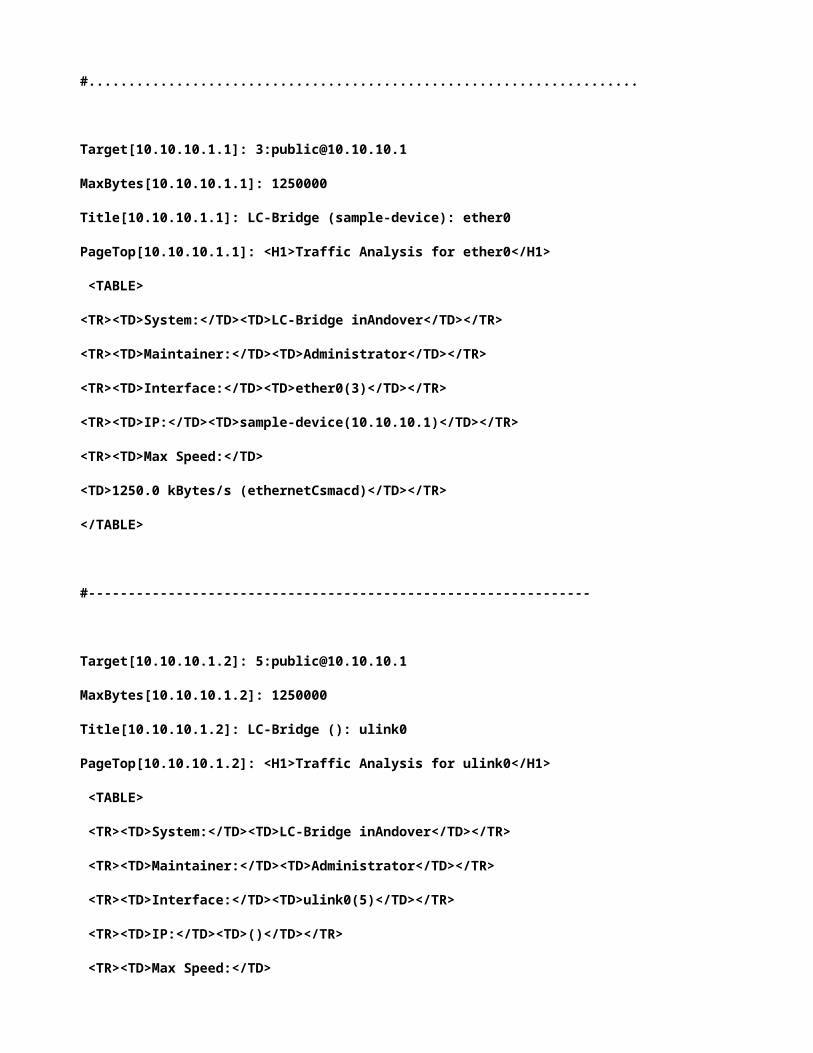
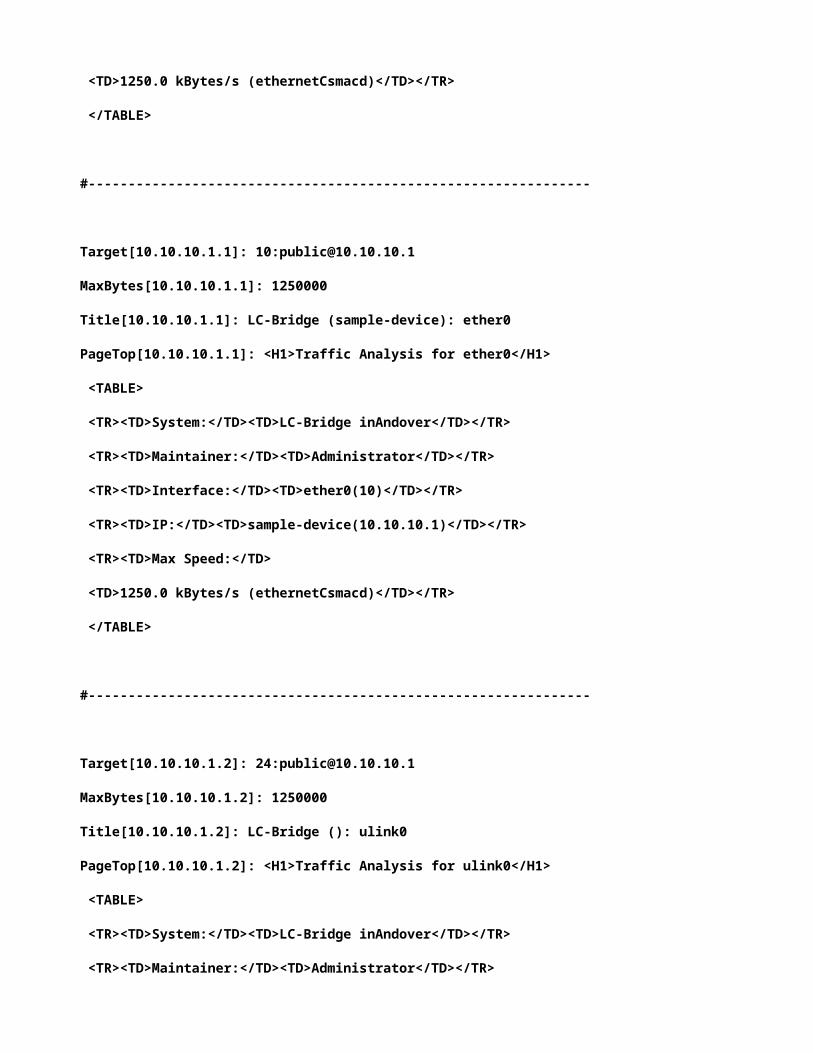
Now lets look at a config file to monitor what we wanted to on our mythical Cisco Cat 5000 -- utilization on ports 3, 5, 10, and 24, and the CPU Load, which will show us nonstandard mrtg configurations as well as more options..
WorkDir: c:\www\mrtg
RunAsDaemon: yes
######################################################################
# Description: LCP SUWGB
# Contact: Administrator
# System Name: LC-Bridge
# Location: Here
#.....................................................................

Target[10.10.10.1.1]: 3:[email protected]
MaxBytes[10.10.10.1.1]: 1250000
Title[10.10.10.1.1]: LC-Bridge (sample-device): ether0
PageTop[10.10.10.1.1]: <H1>Traffic Analysis for ether0</H1>
<TABLE>
<TR><TD>System:</TD><TD>LC-Bridge inAndover</TD></TR>
<TR><TD>Maintainer:</TD><TD>Administrator</TD></TR>
<TR><TD>Interface:</TD><TD>ether0(3)</TD></TR>
<TR><TD>IP:</TD><TD>sample-device(10.10.10.1)</TD></TR>
<TR><TD>Max Speed:</TD>
<TD>1250.0 kBytes/s (ethernetCsmacd)</TD></TR>
</TABLE>
#---------------------------------------------------------------
Target[10.10.10.1.2]: 5:[email protected]
MaxBytes[10.10.10.1.2]: 1250000
Title[10.10.10.1.2]: LC-Bridge (): ulink0
PageTop[10.10.10.1.2]: <H1>Traffic Analysis for ulink0</H1>
<TABLE>
<TR><TD>System:</TD><TD>LC-Bridge inAndover</TD></TR>
<TR><TD>Maintainer:</TD><TD>Administrator</TD></TR>
<TR><TD>Interface:</TD><TD>ulink0(5)</TD></TR>
<TR><TD>IP:</TD><TD>()</TD></TR>
<TR><TD>Max Speed:</TD>
<TD>1250.0 kBytes/s (ethernetCsmacd)</TD></TR>
</TABLE>
#---------------------------------------------------------------
Target[10.10.10.1.1]: 10:[email protected]
MaxBytes[10.10.10.1.1]: 1250000
Title[10.10.10.1.1]: LC-Bridge (sample-device): ether0
PageTop[10.10.10.1.1]: <H1>Traffic Analysis for ether0</H1>
<TABLE>
<TR><TD>System:</TD><TD>LC-Bridge inAndover</TD></TR>
<TR><TD>Maintainer:</TD><TD>Administrator</TD></TR>
<TR><TD>Interface:</TD><TD>ether0(10)</TD></TR>
<TR><TD>IP:</TD><TD>sample-device(10.10.10.1)</TD></TR>
<TR><TD>Max Speed:</TD>
<TD>1250.0 kBytes/s (ethernetCsmacd)</TD></TR>
</TABLE>
#---------------------------------------------------------------
Target[10.10.10.1.2]: 24:[email protected]
MaxBytes[10.10.10.1.2]: 1250000
Title[10.10.10.1.2]: LC-Bridge (): ulink0
PageTop[10.10.10.1.2]: <H1>Traffic Analysis for ulink0</H1>
<TABLE>
<TR><TD>System:</TD><TD>LC-Bridge inAndover</TD></TR>
<TR><TD>Maintainer:</TD><TD>Administrator</TD></TR>
<TR><TD>Interface:</TD><TD>ulink0(24)</TD></TR>
<TR><TD>IP:</TD><TD>()</TD></TR>
<TR><TD>Max Speed:</TD>
<TD>1250.0 kBytes/s (ethernetCsmacd)</TD></TR>
</TABLE>
#---------------------------------------------------------------
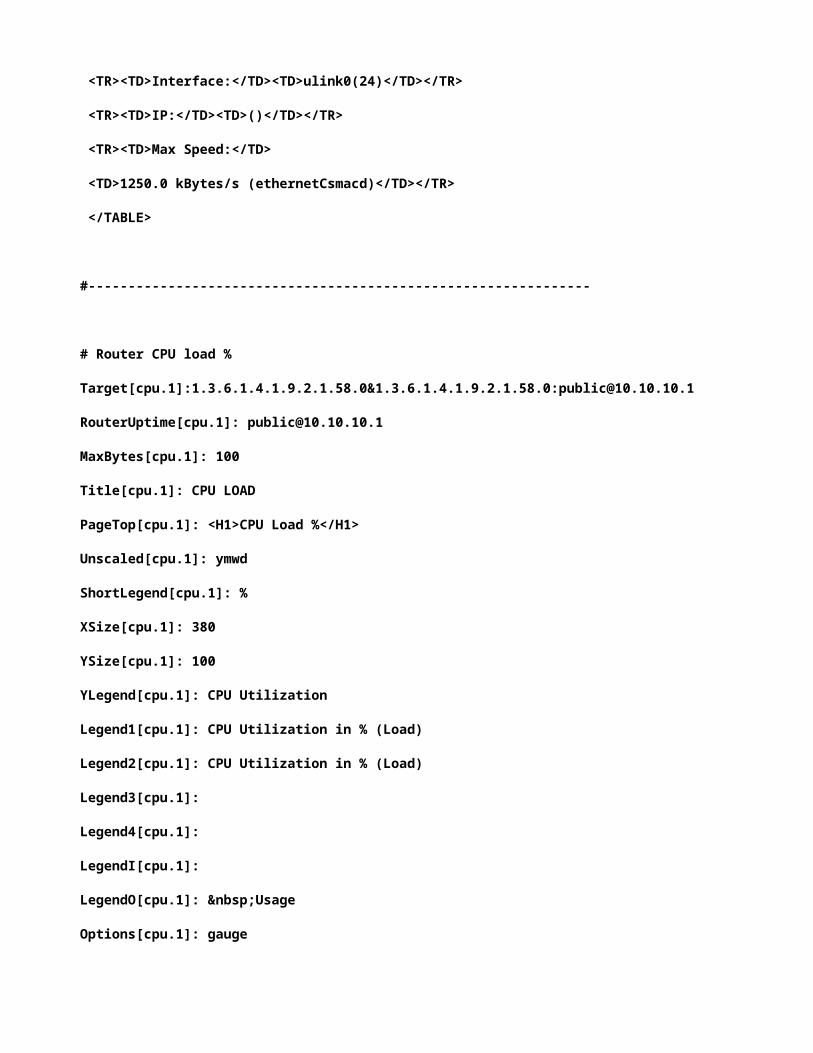
# Router CPU load %
Target[cpu.1]:1.3.6.1.4.1.9.2.1.58.0&1.3.6.1.4.1.9.2.1.58.0:[email protected]
RouterUptime[cpu.1]: [email protected]
MaxBytes[cpu.1]: 100
Title[cpu.1]: CPU LOAD
PageTop[cpu.1]: <H1>CPU Load %</H1>
Unscaled[cpu.1]: ymwd
ShortLegend[cpu.1]: %
XSize[cpu.1]: 380
YSize[cpu.1]: 100
YLegend[cpu.1]: CPU Utilization
Legend1[cpu.1]: CPU Utilization in % (Load)
Legend2[cpu.1]: CPU Utilization in % (Load)
Legend3[cpu.1]:
Legend4[cpu.1]:
LegendI[cpu.1]:
LegendO[cpu.1]: Usage
Options[cpu.1]: gauge
This is a nice example of how to monitor any SNMP device if you know what OID you want to use. Once again, for an explanation of the more advance features of mrtg, please see the rest of the documentation.
AUTHORS
Tobi Oetiker <[email protected]>, David S. Divins <[email protected]>, Steve Pierce <[email protected]>, Artyom Adjemov <[email protected]>, Ilja Ivanov <[email protected]> Karel Fajkus <http://fajkus.cz/>
After you have configured MRTG with command:
perl cfgmaker [email protected] –global “WorkDir: c:\www\mrtg” –output mrtg.cfg
Run MRTG with command:
perl mrtg mrtg.cfg
Every time when you run MRTG it will get data from the router and save it. You can run MRTG manually every 5
minutes or configure this to happen automatically. To do this follow MRTG instructions. When you have done this
MRTG starts to build graph for you….
Using qemu to run Cisco IPS
Preface
This guide is based on my previous HOWTO, running Cisco IPS inside a VMWare instance. The major problem
with this approach was that it worked only with IP release 5.x. All newer IPS software versions didnt work,
because the e1000 emulation in VMWare could not deal with the special NIC drivers Cisco ships since IPS
release 6.
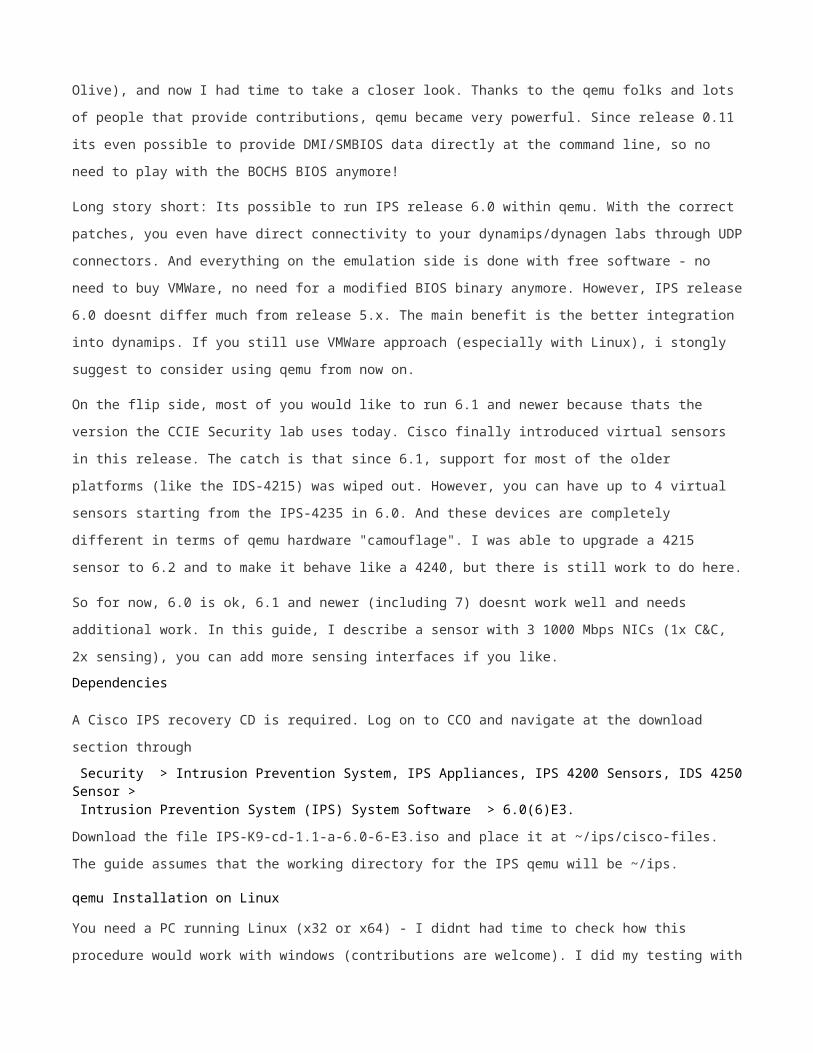
People still want the newer IPS software versions to be emulated, mainly for practice and study reasons. I used
qemu in the past for other things (like for Olive), and now I had time to take a closer look. Thanks to the qemu
folks and lots of people that provide contributions, qemu became very powerful. Since release 0.11 its even
possible to provide DMI/SMBIOS data directly at the command line, so no need to play with the BOCHS BIOS
anymore!
Long story short: Its possible to run IPS release 6.0 within qemu. With the correct patches, you even have direct
connectivity to your dynamips/dynagen labs through UDP connectors. And everything on the emulation side is
done with free software - no need to buy VMWare, no need for a modified BIOS binary anymore. However, IPS
release 6.0 doesnt differ much from release 5.x. The main benefit is the better integration into dynamips. If you
still use VMWare approach (especially with Linux), i stongly suggest to consider using qemu from now on.
On the flip side, most of you would like to run 6.1 and newer because thats the version the CCIE Security lab uses
today. Cisco finally introduced virtual sensors in this release. The catch is that since 6.1, support for most of the
older platforms (like the IDS-4215) was wiped out. However, you can have up to 4 virtual sensors starting from the
IPS-4235 in 6.0. And these devices are completely different in terms of qemu hardware "camouflage". I was able
to upgrade a 4215 sensor to 6.2 and to make it behave like a 4240, but there is still work to do here.
So for now, 6.0 is ok, 6.1 and newer (including 7) doesnt work well and needs additional work. In this guide, I
describe a sensor with 3 1000 Mbps NICs (1x C&C, 2x sensing), you can add more sensing interfaces if you like.
Dependencies
A Cisco IPS recovery CD is required. Log on to CCO and navigate at the download section through
Security > Intrusion Prevention System, IPS Appliances, IPS 4200 Sensors, IDS 4250 Sensor > Intrusion Prevention System (IPS) System Software > 6.0(6)E3.
Download the file IPS-K9-cd-1.1-a-6.0-6-E3.iso and place it at ~/ips/cisco-files. The guide assumes that the
working directory for the IPS qemu will be ~/ips.
qemu Installation on Linux
You need a PC running Linux (x32 or x64) - I didnt had time to check how this procedure would work with
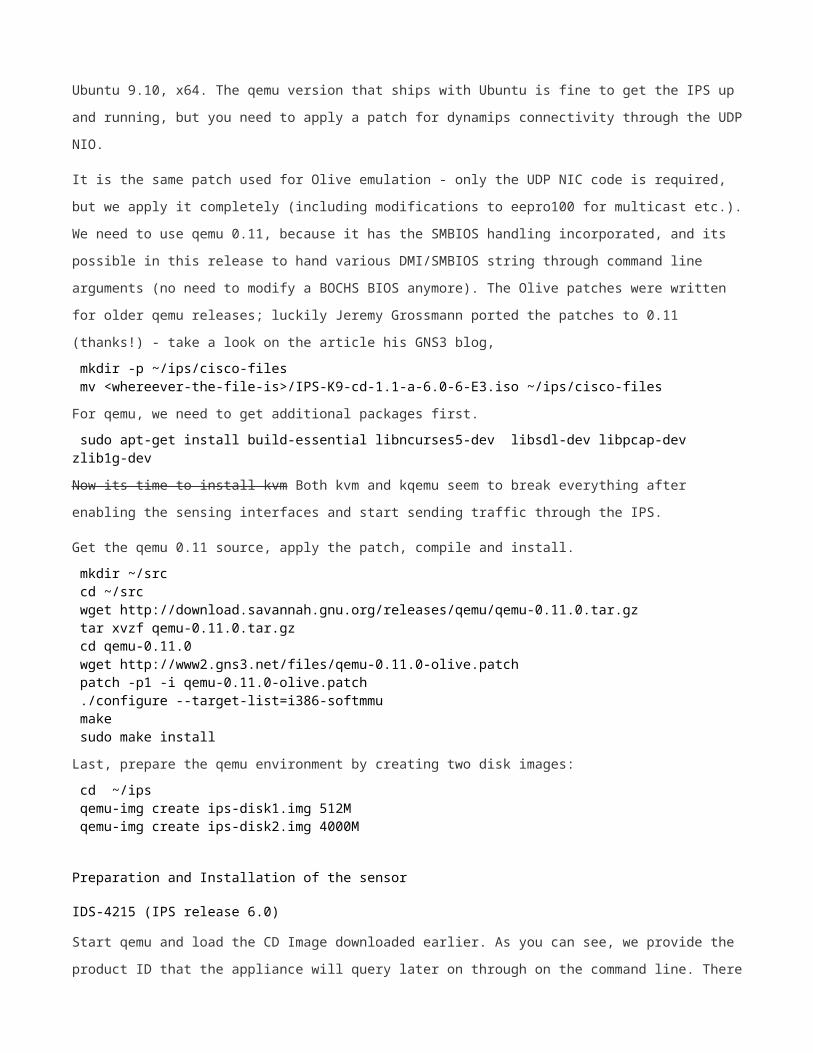
windows (contributions are welcome). I did my testing with Ubuntu 9.10, x64. The qemu version that ships with
Ubuntu is fine to get the IPS up and running, but you need to apply a patch for dynamips connectivity through the
UDP NIO.
It is the same patch used for Olive emulation - only the UDP NIC code is required, but we apply it completely
(including modifications to eepro100 for multicast etc.). We need to use qemu 0.11, because it has the SMBIOS
handling incorporated, and its possible in this release to hand various DMI/SMBIOS string through command line
arguments (no need to modify a BOCHS BIOS anymore). The Olive patches were written for older qemu
releases; luckily Jeremy Grossmann ported the patches to 0.11 (thanks!) - take a look on the article his GNS3
blog,
mkdir -p ~/ips/cisco-files mv <whereever-the-file-is>/IPS-K9-cd-1.1-a-6.0-6-E3.iso ~/ips/cisco-files
For qemu, we need to get additional packages first.
sudo apt-get install build-essential libncurses5-dev libsdl-dev libpcap-dev zlib1g-dev
Now its time to install kvm Both kvm and kqemu seem to break everything after enabling the sensing interfaces
and start sending traffic through the IPS.
Get the qemu 0.11 source, apply the patch, compile and install.
mkdir ~/src cd ~/src wget http://download.savannah.gnu.org/releases/qemu/qemu-0.11.0.tar.gz tar xvzf qemu-0.11.0.tar.gz cd qemu-0.11.0 wget http://www2.gns3.net/files/qemu-0.11.0-olive.patch patch -p1 -i qemu-0.11.0-olive.patch ./configure --target-list=i386-softmmu make sudo make install
Last, prepare the qemu environment by creating two disk images:
cd ~/ips qemu-img create ips-disk1.img 512M qemu-img create ips-disk2.img 4000M
Preparation and Installation of the sensor
IDS-4215 (IPS release 6.0)
Start qemu and load the CD Image downloaded earlier. As you can see, we provide the product ID that the
appliance will query later on through on the command line. There are other values that you can set, but this is the
bare minimum required to fool the IPS code; providing other IDs will not have any effect.
qemu -hda ips-disk1.img -hdb ips-disk2.img -m 512 -smbios type=1,product="IDS-4215" \ -cdrom cisco-files/IPS-K9-cd-1.1-a-6.0-6-E3.iso -boot d
Now qemu boots, press "k" to start the reimaging process. Dont worry about error messages regarding failed
platform detection, thats normal at this stage. When the process is done, the software reloads, and qemu pauses
in the BIOS screen complaining about boot issues. Exit the qemu process.
Next step is to boot from the disk. When the system starts, you need to modify the grub boot entry to make sure
the system starts at runlevel 1. Note: there is a 10 second timer, sou at the grub menu, you must press the "e" key
to interrupt the normal boot sequence. Ok, start qemu again, now with the final command line arguments.
qemu -hda ips-disk1.img -hdb ips-disk2.img -m 512 -smbios type=1,product="IDS-4215" \ -net nic,model=e1000 -net nic,model=e1000 -net nic,model=e1000
At the grub menu, press "e" to edit the first boot entry. In the following menu, select the 2nd line (that starts with
"kernel=") and press "e" again. Change the option init=/loadrc to init=1, then Enter followed by "b" to boot.
The IPS software now boots into runlevel 1. When prompted, press Enter and do the follwing
/loadrc cd /etc/init.d ./rc.init cp ids_functions ids_functions.orig vi ids_functions
The file controls the selection of the platform based on various criteria (asset data read through i2c, CPU speed
etc.). Also, the default command and control interface gets selected. We trick the selection process by making
sure that a IDS-4215 gets detected (the other detection steps fail here, obviously). In that file, search for the string
"845" (with vi: /845), it will jump to the following section:
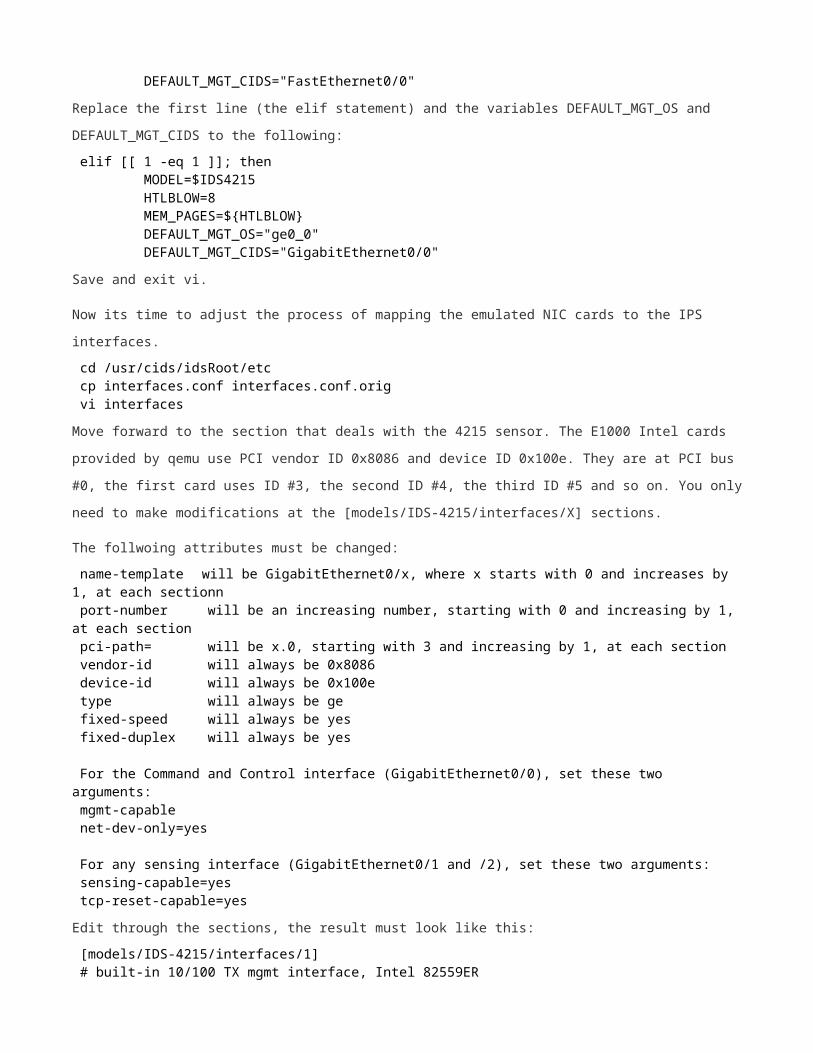
elif [[ `isCPU 845` -eq $TRUE && $NUM_OF_PROCS -eq 1 ]]; then MODEL=$IDS4215 HTLBLOW=8 MEM_PAGES=${HTLBLOW} DEFAULT_MGT_OS="fe0_0" DEFAULT_MGT_CIDS="FastEthernet0/0"
Replace the first line (the elif statement) and the variables DEFAULT_MGT_OS and DEFAULT_MGT_CIDS to
the following:
elif [[ 1 -eq 1 ]]; then MODEL=$IDS4215 HTLBLOW=8 MEM_PAGES=${HTLBLOW} DEFAULT_MGT_OS="ge0_0" DEFAULT_MGT_CIDS="GigabitEthernet0/0"
Save and exit vi.
Now its time to adjust the process of mapping the emulated NIC cards to the IPS interfaces.
cd /usr/cids/idsRoot/etc cp interfaces.conf interfaces.conf.orig vi interfaces
Move forward to the section that deals with the 4215 sensor. The E1000 Intel cards provided by qemu use PCI
vendor ID 0x8086 and device ID 0x100e. They are at PCI bus #0, the first card uses ID #3, the second ID #4, the
third ID #5 and so on. You only need to make modifications at the [models/IDS-4215/interfaces/X] sections.
The follwoing attributes must be changed:
name-template will be GigabitEthernet0/x, where x starts with 0 and increases by 1, at each sectionn port-number will be an increasing number, starting with 0 and increasing by 1, at each section pci-path= will be x.0, starting with 3 and increasing by 1, at each section vendor-id will always be 0x8086 device-id will always be 0x100e type will always be ge fixed-speed will always be yes fixed-duplex will always be yes
For the Command and Control interface (GigabitEthernet0/0), set these two arguments: mgmt-capable net-dev-only=yes
For any sensing interface (GigabitEthernet0/1 and /2), set these two arguments: sensing-capable=yes tcp-reset-capable=yes
Edit through the sections, the result must look like this:
[models/IDS-4215/interfaces/1] # built-in 10/100 TX mgmt interface, Intel 82559ER # was eth1 (int1) in 4.x # rightmost connector on front panel # labeled "Ethernet 1" on panel name-template=GigabitEthernet0/0 port-number=0 pci-path=3.0 vendor-id=0x8086 device-id=0x100e type=ge mgmt-capable=yes net-dev-only=yes fixed-speed=yes fixed-duplex=yes [models/IDS-4215/interfaces/2] # built-in 10/100 TX sensing interface, Intel 82559ER # was eth0 (int0) in 4.x
# leftmost connector labeled "Ethernet 0" name-template=GigabitEthertnet0/1 port-number=1 pci-path=4.0 vendor-id=0x8086 device-id=0x100e type=ge sensing-capable=yes tcp-reset-capable=yes fixed-speed=yes fixed-duplex=yes [models/IDS-4215/interfaces/3] # rightmost interface on optional 1 x 4-FE card: # was eth5 (int5) in 4.x name-template=GigabitEthernet0/2 port-number=2 pci-path=5.0 vendor-id=0x8086 device-id=0x100e type=ge sensing-capable=yes tcp-reset-capable=yes fixed-speed=yes fixed-duplex=yes
Save the changes and exit vi. The system changes are done, now reload the device
reboot
After the reboot, the system will detect changed hardware and reload by itself. When it comes up again, its fully
functional. At the command promt, log in with the user cisco and the password cisco. The appliance prompts you
to change the password for the user cisco. After this is done, you are at the CLI prompt.
Please verify that after the final reload, the model identification process must detect no change and give out the
correct platform:
Checking model identification [ OK ] Model: IDS-4215 Model=IDS-4215
Also, when logging in, there must be no warning regarding "unsupported platform", only the copyright and maybe
a notice regarding a missing license key should appear.
In addition, you should configure a service user account soon. This account enables you to directly log into the
UNIX environment, bypassing the CLI:
conf t username service privilege service password <somepassword>
Now your qemu-powered IPS appliance is ready for normal usage. Of course, with the network settings provided
above, it is isolated from the host operating system and any other device. Possible options to make it attach to
other equipment are:

attaching to the host using qemu user nic type (not very useful for the IPS) bridging to a real NIC with the qemu tun nic type
attaching to dynamips instances with the qemu udp nic type
Of course, these methods can be combined - for example bridging the C&C interface to a real NIC to access the
IPS IDM console from a windows PC and attaching the sensing interfaces to dynamips instances (router ports, or
even ESW-16 switchports) for traffic inspection. Please see the last section for details.
What works
tested IDS-4215 with IPS 6.0.(6)E3 software release
access the sensor from a different box (windows) via IDM (bridged interface) configuration and monitoring with IDM (although its slow)
communication with dynamips with the help of NIO UDP
communication between two dynamips routers through inline sensor config (running basic IP and forming a full OSPF adjacency)
inline traffic inspection and traffic blocking
qemu multicast support (OSPF broadcast type network works through inline sensor)
Notes
After initial bootup and configuration, the system behaves very slow. This is because the signature engine
initializes - this may take time (here it took around 10 minutes). For future starts, this procedure happens again,
but it will run much faster because of cached data (guess). Using kvm greatly speeds up this process messes
everything up once you enabled sensing interfaces and start to use them.
Some Tips
Bridging the C&C interface to a real network
You must have support for tun/tap devices (ships with most distribution), and the bridge-utils package. Your
normal networking will change as you need to bridge the real NIC to a bridge interface, usually when the system
starts. Any IP configuration that was done on the real NIC now must be done on the bridge interface. Later, when
staring qemu, a tap interface is created that will be bridged to this bridge interface too.
The whole process of configuring bridging depends on the distribution. For Debian/Ubuntu, you can try the
following:
$ cat /etc/network/interfaces auto lo iface lo inet loopback auto br0 iface br0 inet static
address 192.168.10.2netmask 255.255.255.0gateway 192.168.10.254
nameserver 192.168.10.1bridge_ports eth0bridge_stp offbridge_maxwait 5
When invoking qemu, you need to add a vlan designation that ties the e1000 nic and the tap interface together:
qemu -hda ips-disk1.img -hdb ips-disk2.img -m 512 -smbios type=1,product="IDS-4215" \ -net nic,vlan=1,model=e1000 -net tap,vlan=1,name=tap1 -net nic,model=e1000 \ -net nic,model=e1000
For debian/ubuntu, this command will start the script /etc/qemu-ifup that controls the addition of the tap1 interface
to the bridge.
[edit] Integration into dynamips
The patch you applied earlier enables qemu to talk to dynamips through UDP; now qemu has a special nic type
for that. You must configure both qemu and dynamips/dynagen to connect the various devices together. Please
note that the UDP ports come in pairs for each network interface (send and receive), and you must swap them
between the devices.
For the qemu side of things, there is this vlan designation again:
qemu -hda ips-disk1.img -hdb ips-disk2.img -m 512 -smbios type=1,product="IDS-4215" \ -net nic,vlan=1,model=e1000 \ -net nic,vlan=2,model=e1000 -net udp,vlan=2,sport=11000,dport=11001,daddr=127.0.0.1 \ -net nic,vlan=3,model=e1000 -net udp,vlan=3,sport=11002,dport=11003,daddr=127.0.0.1
I'm sure most people run dynagen and not native dynamips anymore, so I will provide a sample for a
dynagen .net file:
# # Attaches R1 to NIC #2 (Gi0/1) of the sensor # note that the UDP ports are swapped # [[Router R1]] model = 3640 autostart = false slot0 = NM-4E E0/0 = NIO_udp:11001:127.0.0.1:11000
# # Attaches R2 to NIC #3 (Gi0/2) of the sensor # note that the UDP ports are swapped # [[Router R2]] model = 3640 autostart = false slot0 = NM-4E E0/0 = NIO_udp:11003:127.0.0.1:11002