Embed Size (px)
Citation preview
Using Duration Curves inTMDL Development &
Implementation Planning
Discussion Panelists:
Tom Stiles (Kansas Dept. of Health & Environment)Bruce Cleland (America’s Clean Water Foundation)
ASIWPCA ”States Helping States” Conference CallJuly 1, 2003
Duration CurvesConference Call OverviewConference Call Overview
Update on Kansas Applications (Tom)
Linking to Implementation (Bruce)
Extended Uses (Bruce)
Background & Basics (Tom)
Duration CurvesCall ObjectivesCall Objectives
Initiate an exchange of ideas among States
Create an awareness of efforts in this area
Approaches to work through challenges
Expand network of contacts
Highlight issues encountered
Use several examples to frame the problem
Duration CurvesBackgroundBackground
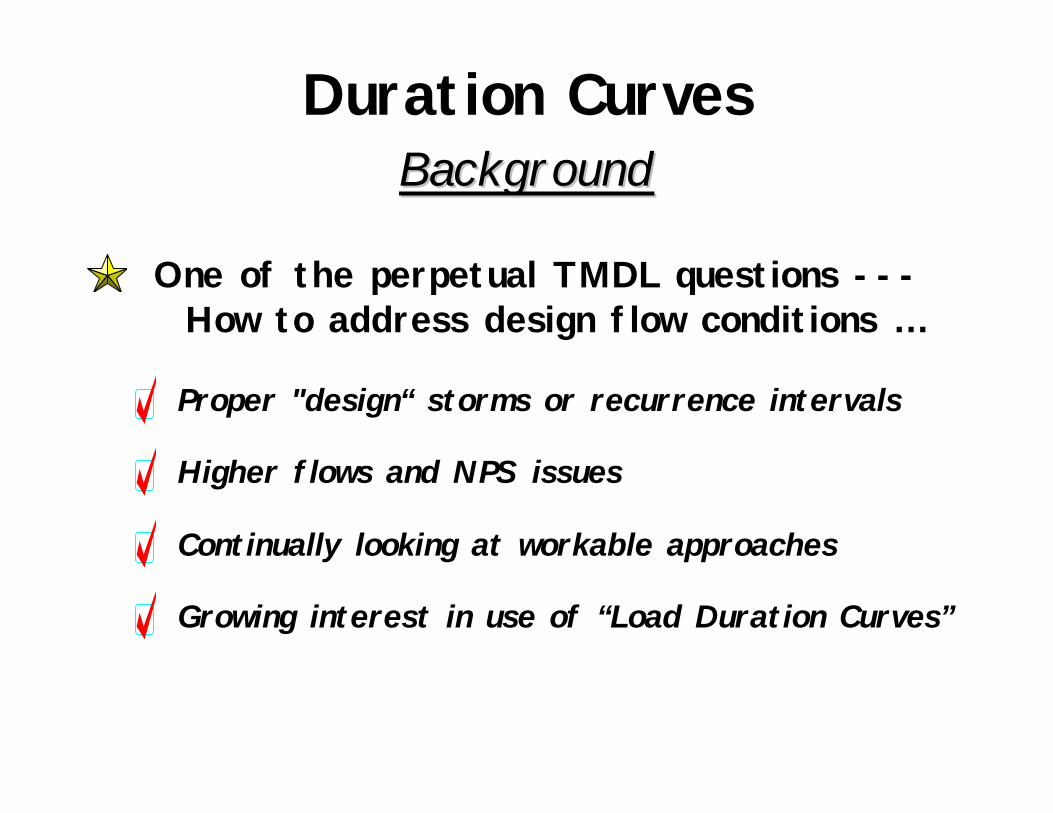
Higher flows and NPS issues
Proper "design“ storms or recurrence intervals
One of the perpetual TMDL questions ---How to address design flow conditions …
Continually looking at workable approaches
Growing interest in use of “Load Duration Curves”
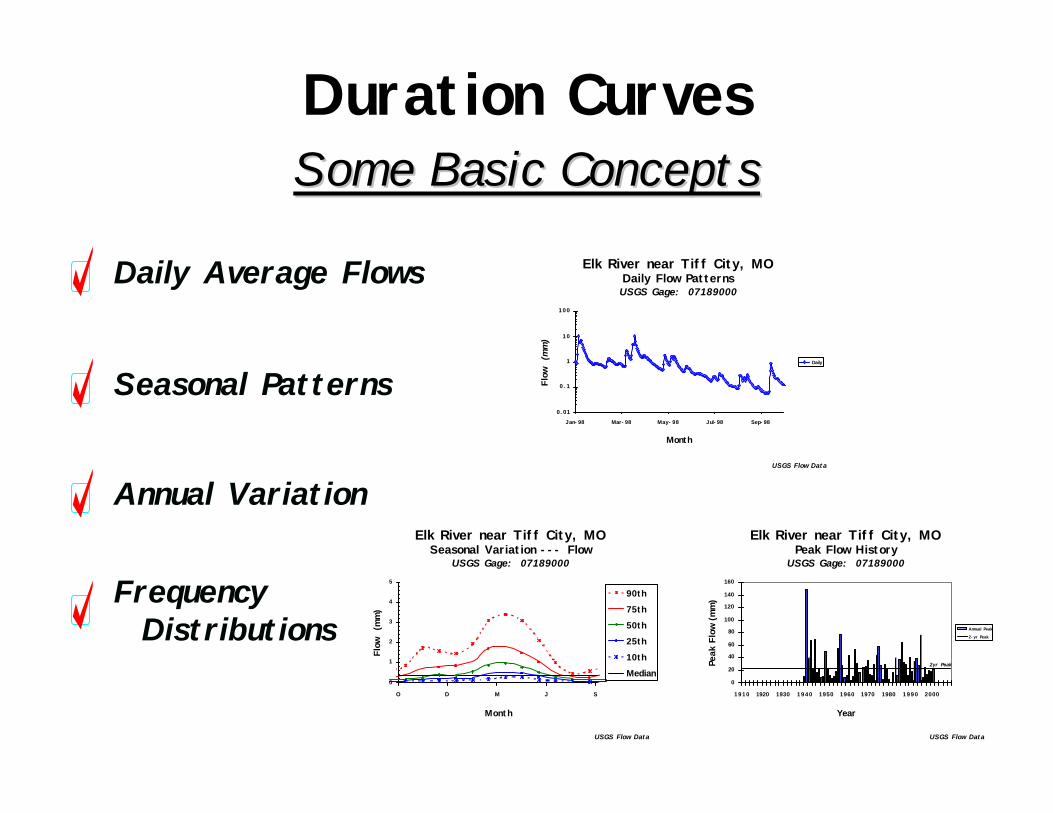
Duration CurvesSome Basic ConceptsSome Basic Concepts
Seasonal Patterns
FrequencyDistributions
Annual Variation
Daily Average Flows
0.01
0.1
1
10
100
Jan-98 Mar-98 May-98 Jul-98 Sep-98
Month
Flow
(m
m)
Daily
Elk River near Tiff City, MODaily Flow PatternsUSGS Gage: 07189000
USGS Flow Data
0
1
2
3
4
5
O D M J S
Month
Flow
(m
m)
90th
75th
50th
25th
10th
Median
Elk River near Tiff City, MOSeasonal Variation --- Flow
USGS Gage: 07189000
USGS Flow Data
0
20
40
60
80
100
120
140
160
1910 1920 1930 1940 1950 1960 1970 1980 1990 2000
YearPe
ak F
low
(mm)
Annual Peak
2-yr Peak
Elk River near Tiff City, MOPeak Flow History
USGS Gage: 07189000
USGS Flow Data
2yr Peak
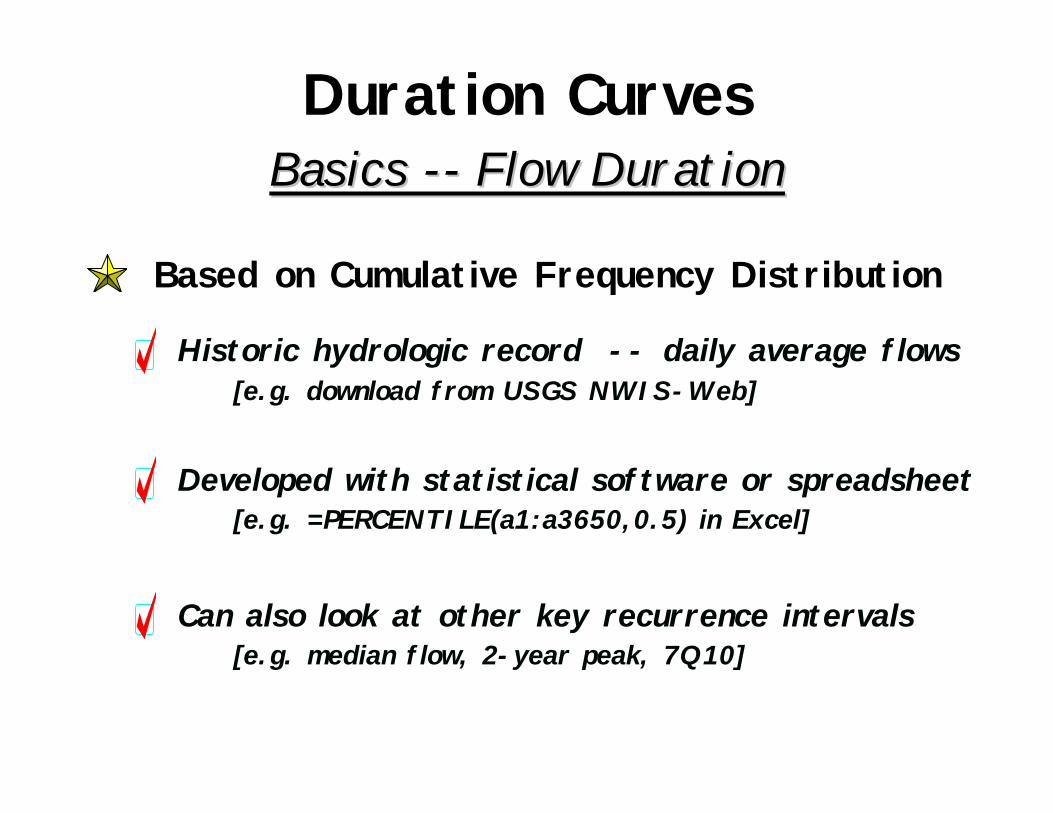
Duration CurvesBasics Basics ---- Flow DurationFlow Duration
Historic hydrologic record -- daily average flows[e.g. download from USGS NWIS-Web]
Based on Cumulative Frequency Distribution
Can also look at other key recurrence intervals[e.g. median flow, 2-year peak, 7Q10]
Developed with statistical software or spreadsheet[e.g. =PERCENTILE(a1:a3650,0.5) in Excel]
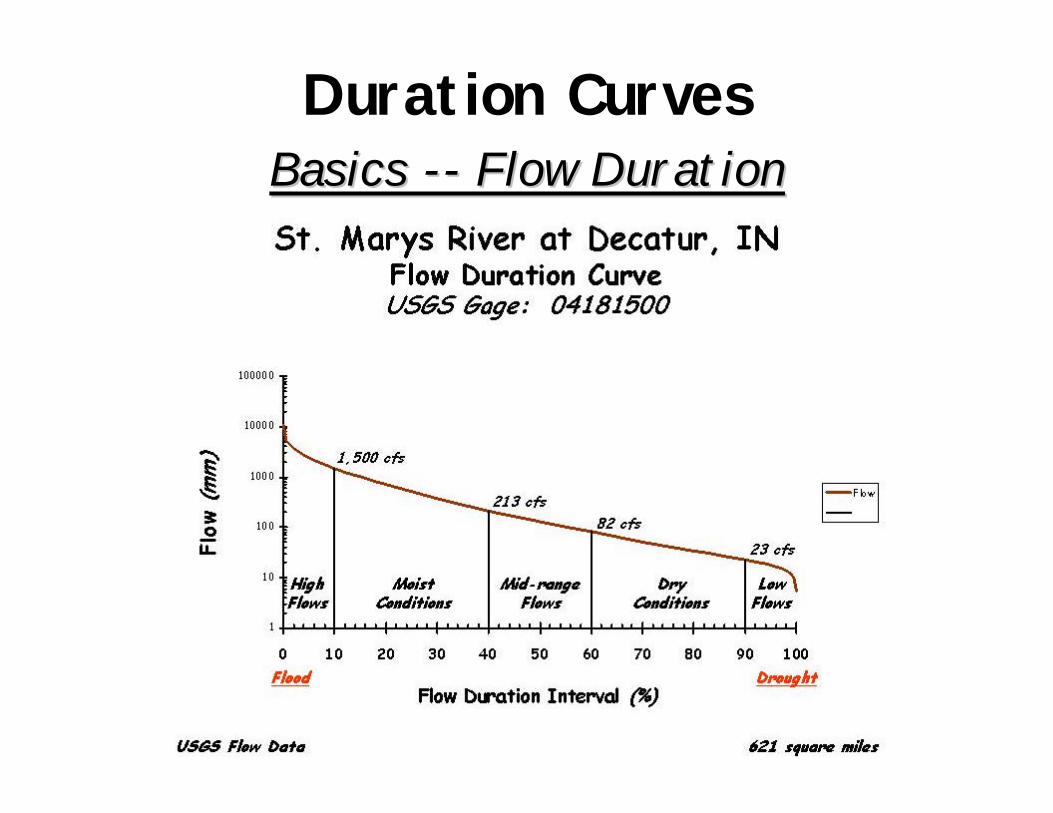
Duration CurvesBasics Basics ---- Flow DurationFlow Duration
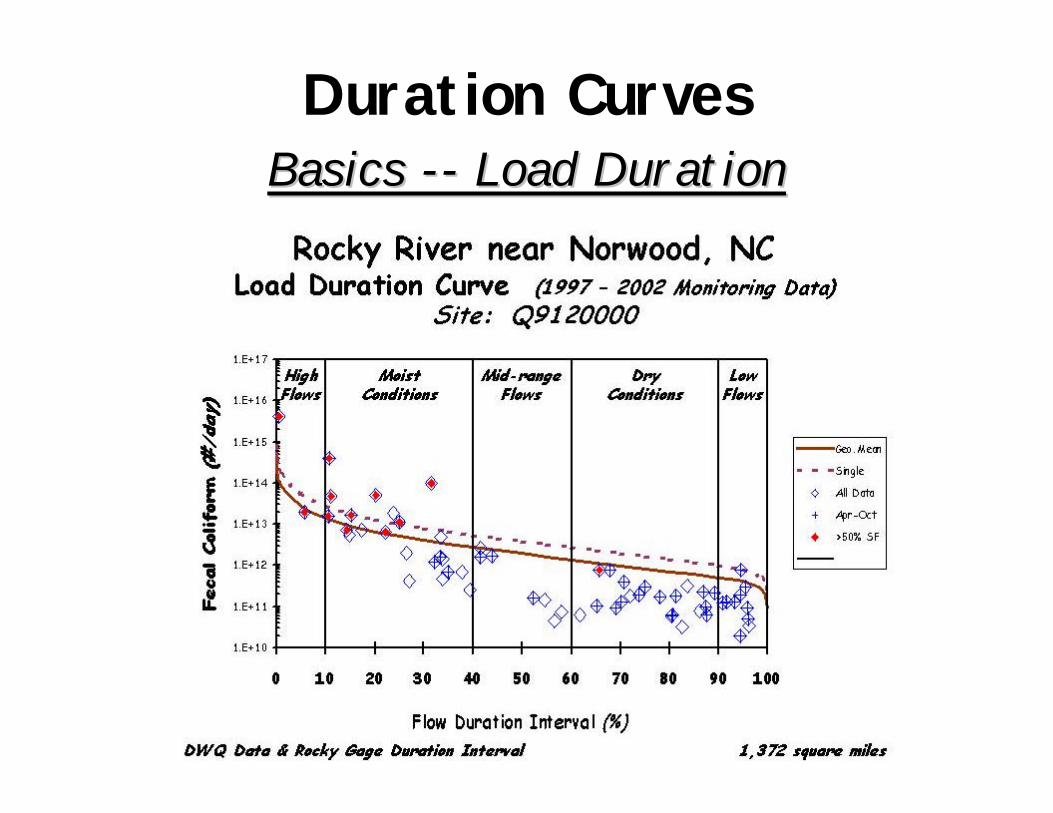
Duration CurvesBasics Basics ---- Load DurationLoad Duration
Y-axis becomes water quality parameter value[e.g. load or concentration]
Again, use Cumulative Frequency Distribution
Curve determined by target concentration andflow associated with recurrence interval
X-axis position matches flow recurrence interval
Duration CurvesBasics Basics ---- Load DurationLoad Duration
Duration CurvesBasicsBasics
Targeting focus – framework to evaluate options
Moves away from single point estimate
Easier to explain – fairly simple graphic display
Method offers a number of advantages
Being evaluated as a tool in more & more States
Context for looking at monitoring / modeling data
Duration CurvesAdvantagesAdvantages
- Targeted Programs
Help guide implementation
- Targeted Areas
- Targeted Activities
- Targeted Participants
Context to interpret monitoring & modeling data
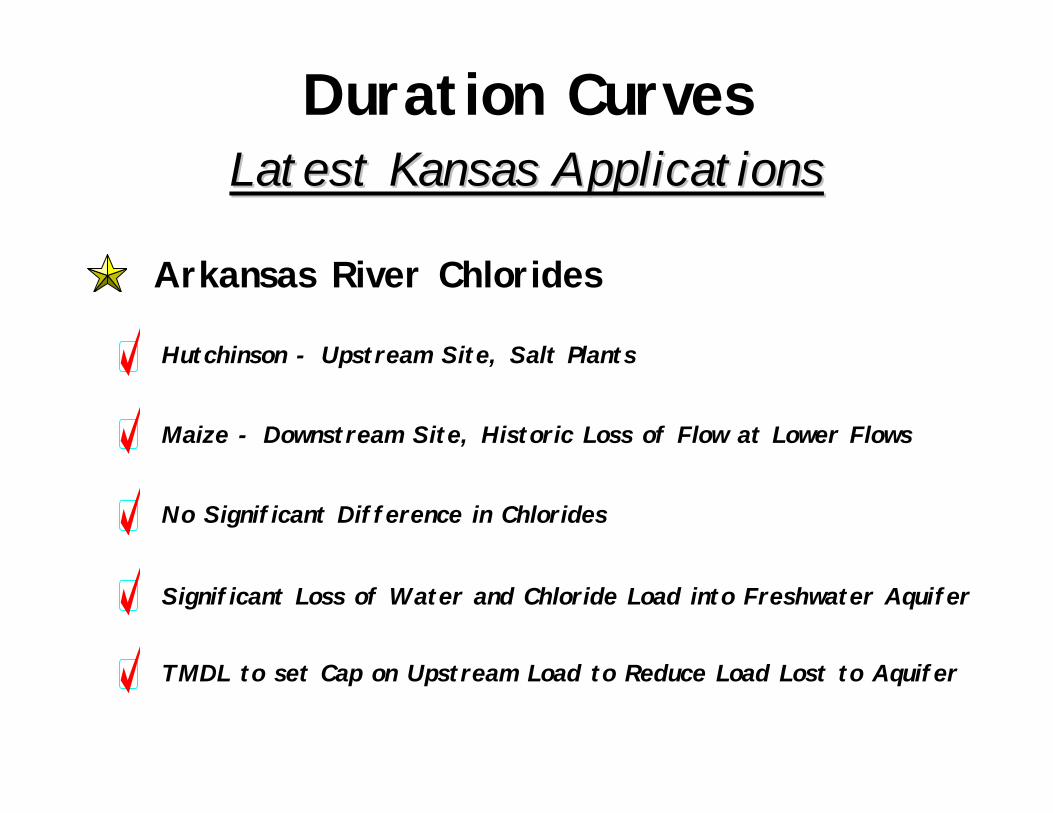
Duration CurvesLatest Kansas ApplicationsLatest Kansas Applications
Significant Loss of Water and Chloride Load into Freshwater Aquifer
Hutchinson - Upstream Site, Salt Plants
Maize - Downstream Site, Historic Loss of Flow at Lower Flows
Arkansas River Chlorides
TMDL to set Cap on Upstream Load to Reduce Load Lost to Aquifer
No Significant Difference in Chlorides
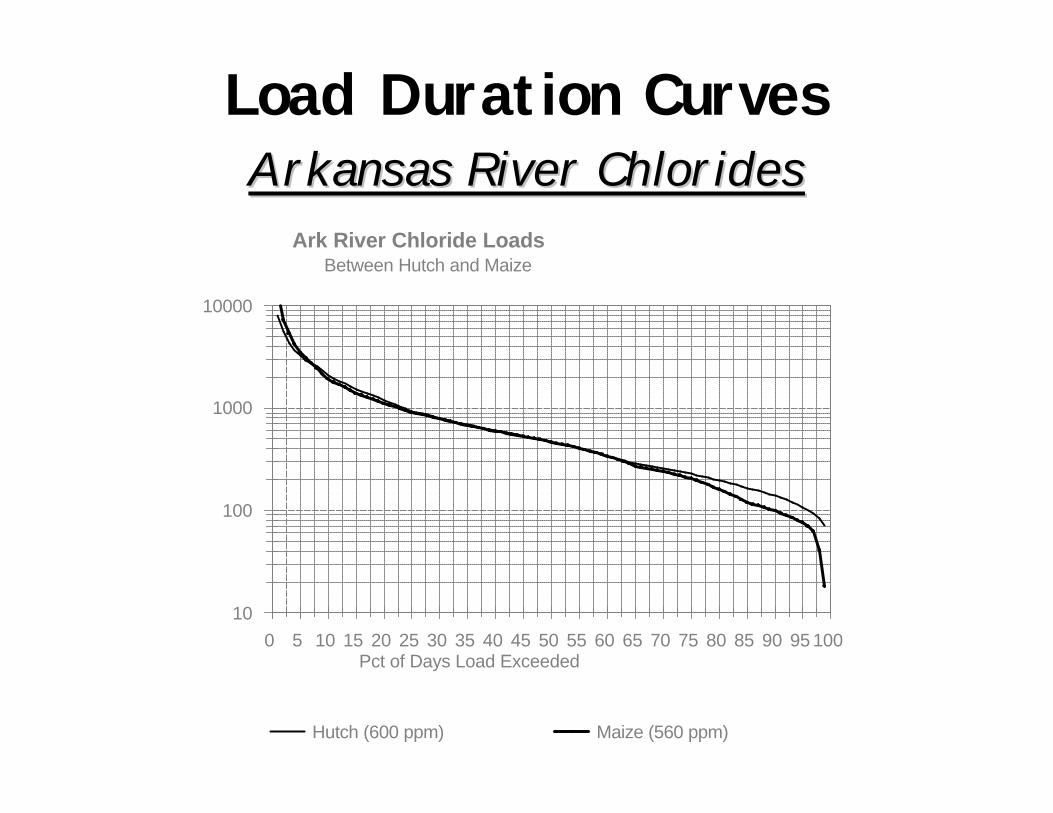
Load Duration CurvesArkansas River ChloridesArkansas River Chlorides
10
100
1000
10000
0 5 10 15 20 25 30 35 40 45 50 55 60 65 70 75 80 85 90 95 100 Pct of Days Load Exceeded
Hutch (600 ppm) Maize (560 ppm)
Ark River Chloride LoadsBetween Hutch and Maize
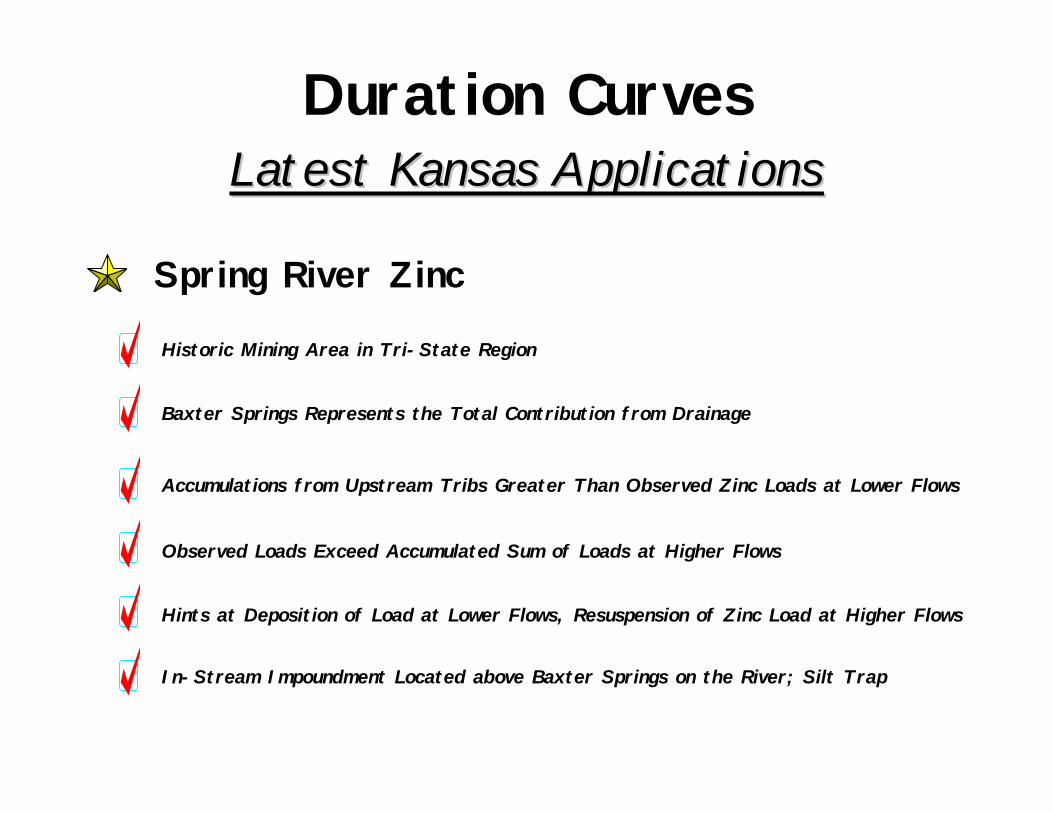
Duration CurvesLatest Kansas ApplicationsLatest Kansas Applications
Spring River Zinc
Observed Loads Exceed Accumulated Sum of Loads at Higher Flows
Historic Mining Area in Tri-State Region
Baxter Springs Represents the Total Contribution from Drainage
Hints at Deposition of Load at Lower Flows, Resuspension of Zinc Load at Higher Flows
In-Stream Impoundment Located above Baxter Springs on the River; Silt Trap
Accumulations from Upstream Tribs Greater Than Observed Zinc Loads at Lower Flows
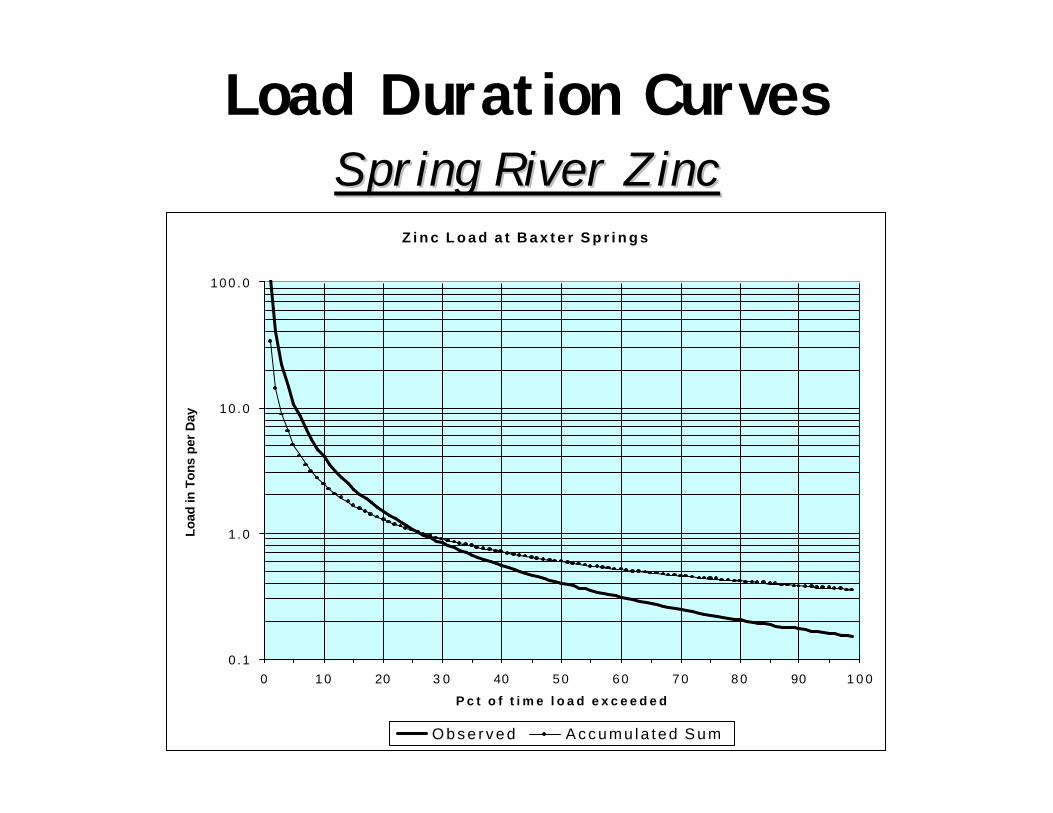
Load Duration CurvesSpring River ZincSpring River Zinc
Z i n c L o a d a t B a x t e r S p r i n g s
0 .1
1 .0
10 .0
100 .0
0 1 0 20 3 0 40 5 0 6 0 7 0 8 0 90 1 0 0
P c t o f t i m e l o a d e x c e e d e d
Load
in T
ons
per
Day
O b s e r v e d A c c u m u l a t e d S u m
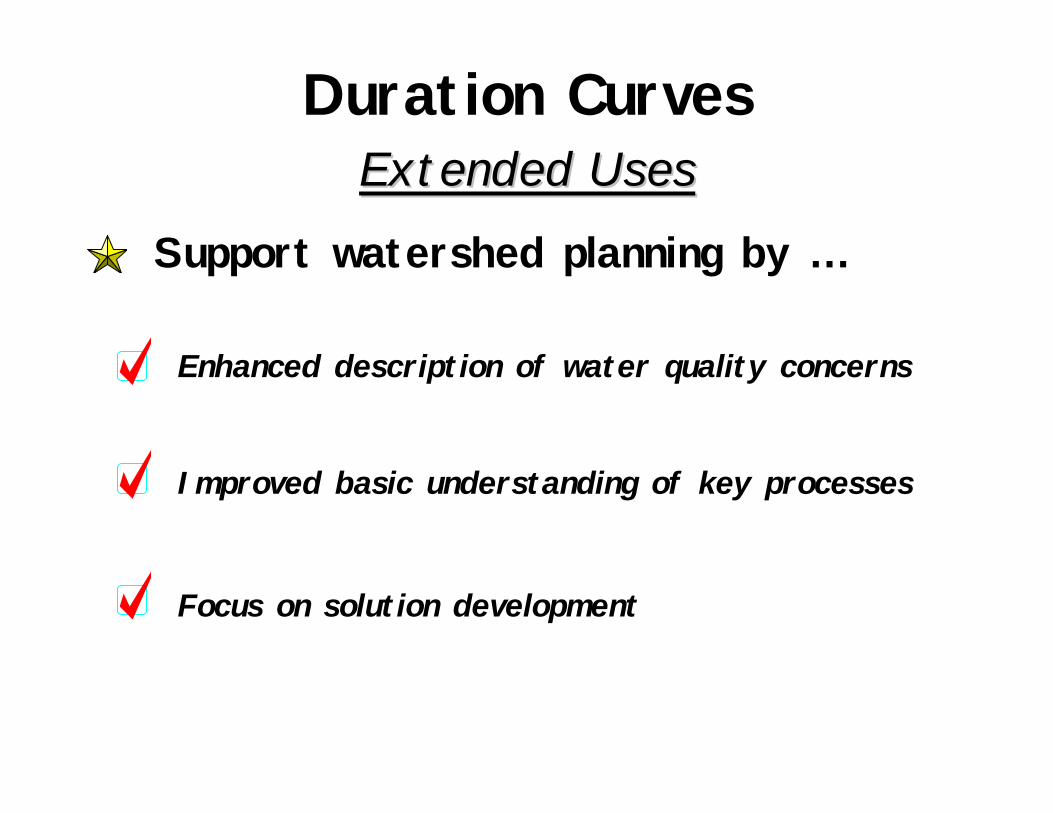
Duration CurvesExtended UsesExtended Uses
Support watershed planning by …
Enhanced description of water quality concerns
Improved basic understanding of key processes
Focus on solution development
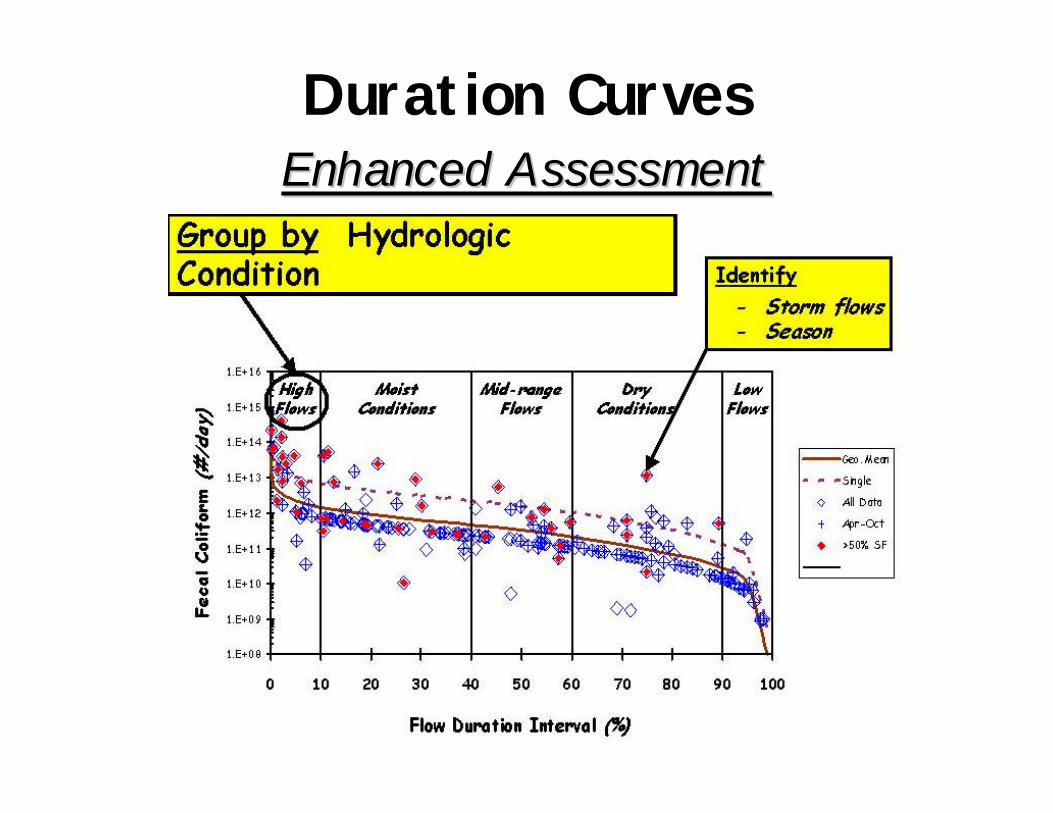
Duration CurvesEnhanced AssessmentEnhanced Assessment
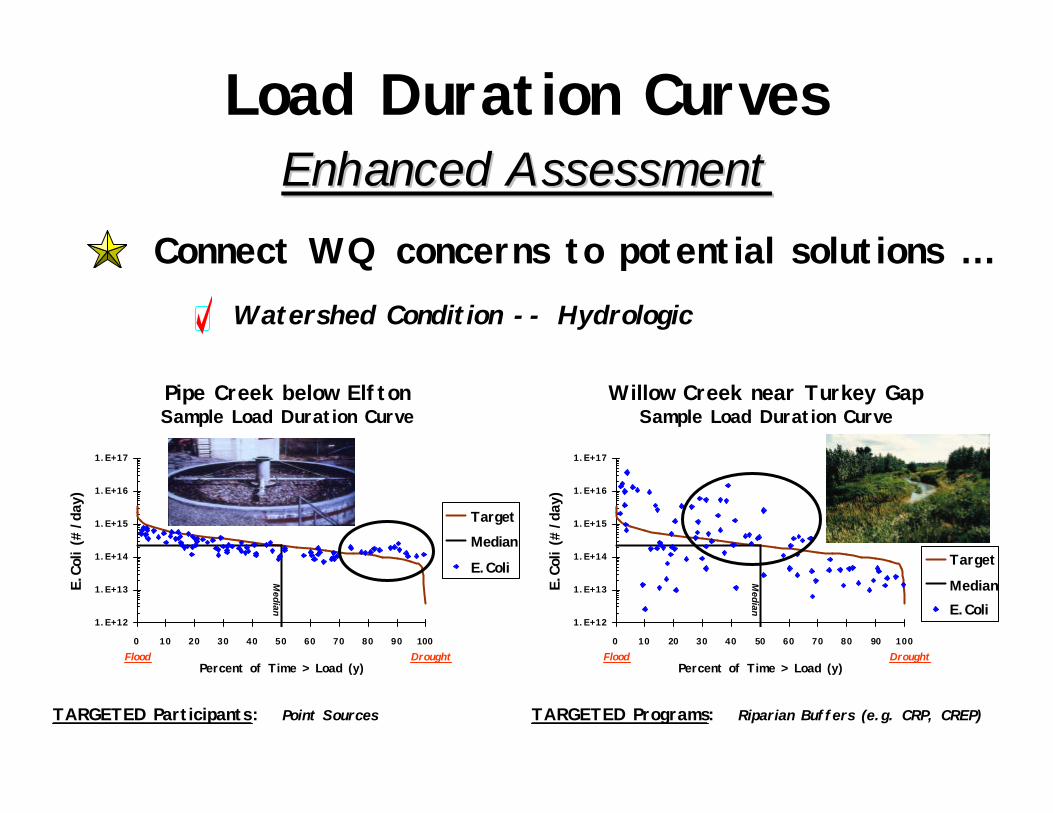
Load Duration CurvesEnhanced AssessmentEnhanced Assessment
Connect WQ concerns to potential solutions …
1.E+12
1.E+13
1.E+14
1.E+15
1.E+16
1.E+17
0 10 20 30 40 50 60 70 80 90 100
Percent of Time > Load (y)
E.Co
li (#
/day
)
TargetMedian
E.Coli
Pipe Creek below ElftonSample Load Duration Curve
Median
DroughtFlood
TARGETED Participants: Point Sources
Watershed Condition -- Hydrologic
1.E+12
1.E+13
1.E+14
1.E+15
1.E+16
1.E+17
0 10 20 30 40 50 60 70 80 90 100
Percent of Time > Load (y)
E.Co
li (#
/day
)Target
MedianE.Coli
Willow Creek near Turkey GapSample Load Duration Curve
Median
DroughtFlood
TARGETED Programs: Riparian Buffers (e.g. CRP, CREP)
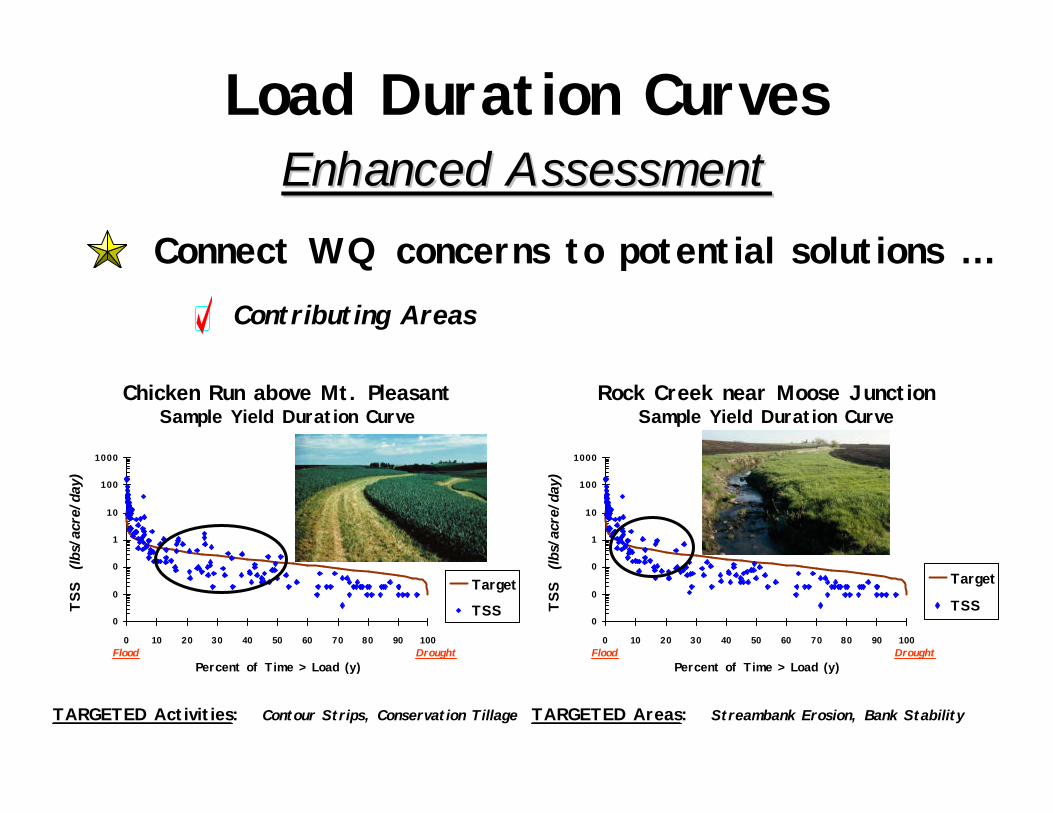
Load Duration CurvesEnhanced AssessmentEnhanced Assessment
Connect WQ concerns to potential solutions …Contributing Areas
0
0
0
1
10
100
1000
0 10 20 30 40 50 60 70 80 90 100
Percent of Time > Load (y)
TSS (lb
s/ac
re/d
ay)
Target
TSS
Chicken Run above Mt. PleasantSample Yield Duration Curve
DroughtFlood
TARGETED Activities: Contour Strips, Conservation Tillage
0
0
0
1
10
100
1000
0 10 20 30 40 50 60 70 80 90 100
Percent of Time > Load (y)
TSS (lb
s/ac
re/d
ay)
Target
TSS
Rock Creek near Moose JunctionSample Yield Duration Curve
DroughtFlood
TARGETED Areas: Streambank Erosion, Bank Stability
Duration CurvesEnhanced AssessmentEnhanced Assessment
Other potential opportunities …
Linkage to other analytical methods(e.g. models, Bacteria Source Tracking)
Provides view beyond “Status & Trends”
Expanded watershed characterization
Use with volunteer monitoring efforts
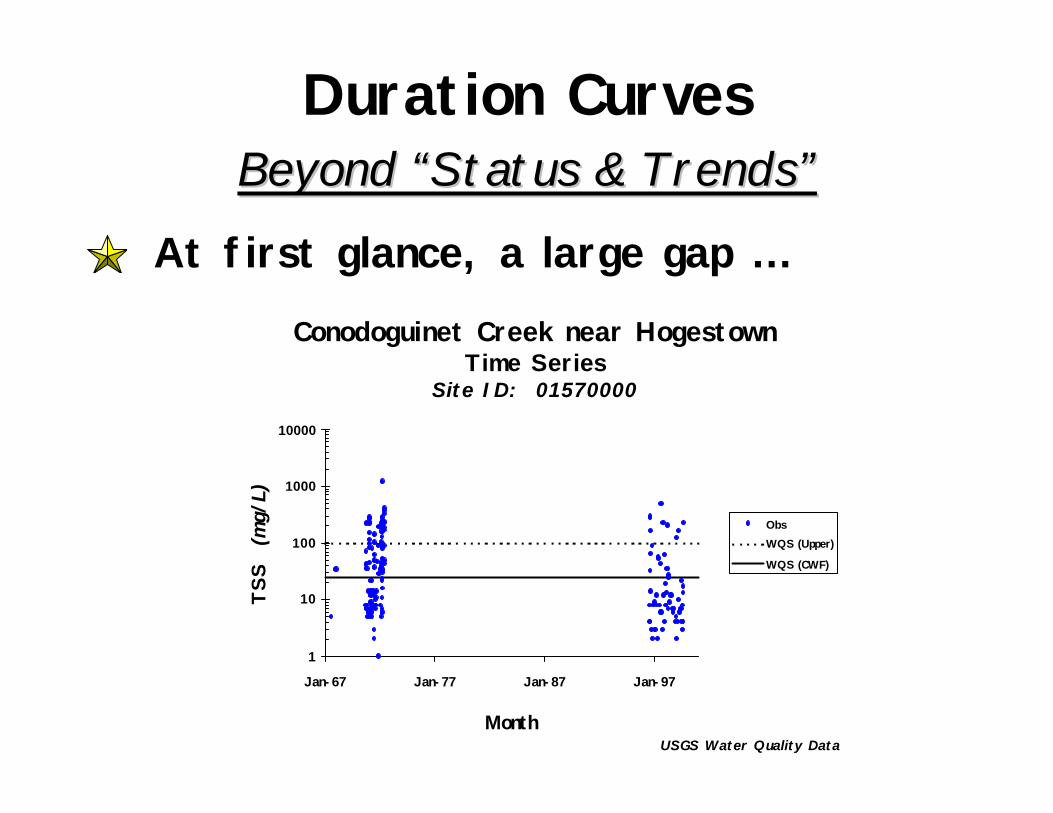
Duration CurvesBeyond “Status & Trends”Beyond “Status & Trends”
At first glance, a large gap …
1
10
100
1000
10000
Jan-67 Jan-77 Jan-87 Jan-97
Month
TSS
(mg/
L)
ObsWQS (Upper)
WQS (CWF)
Conodoguinet Creek near HogestownTime Series
Site ID: 01570000
USGS Water Quality Data
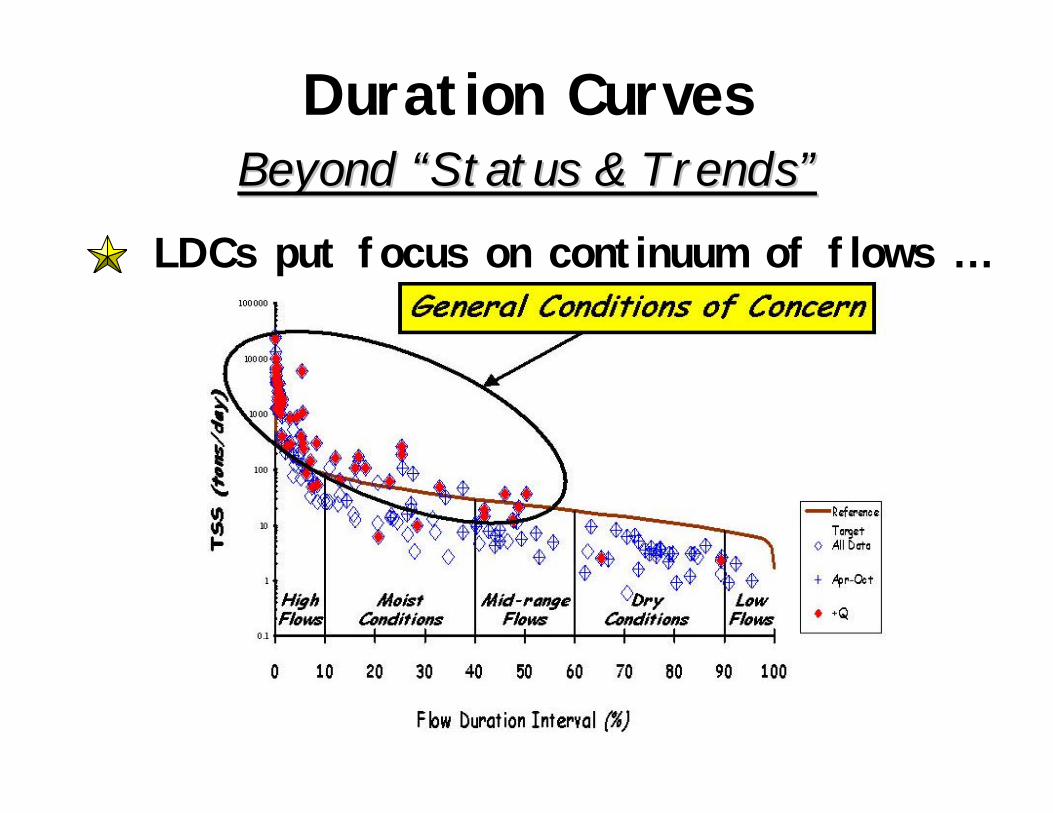
Duration CurvesBeyond “Status & Trends”Beyond “Status & Trends”
LDCs put focus on continuum of flows …
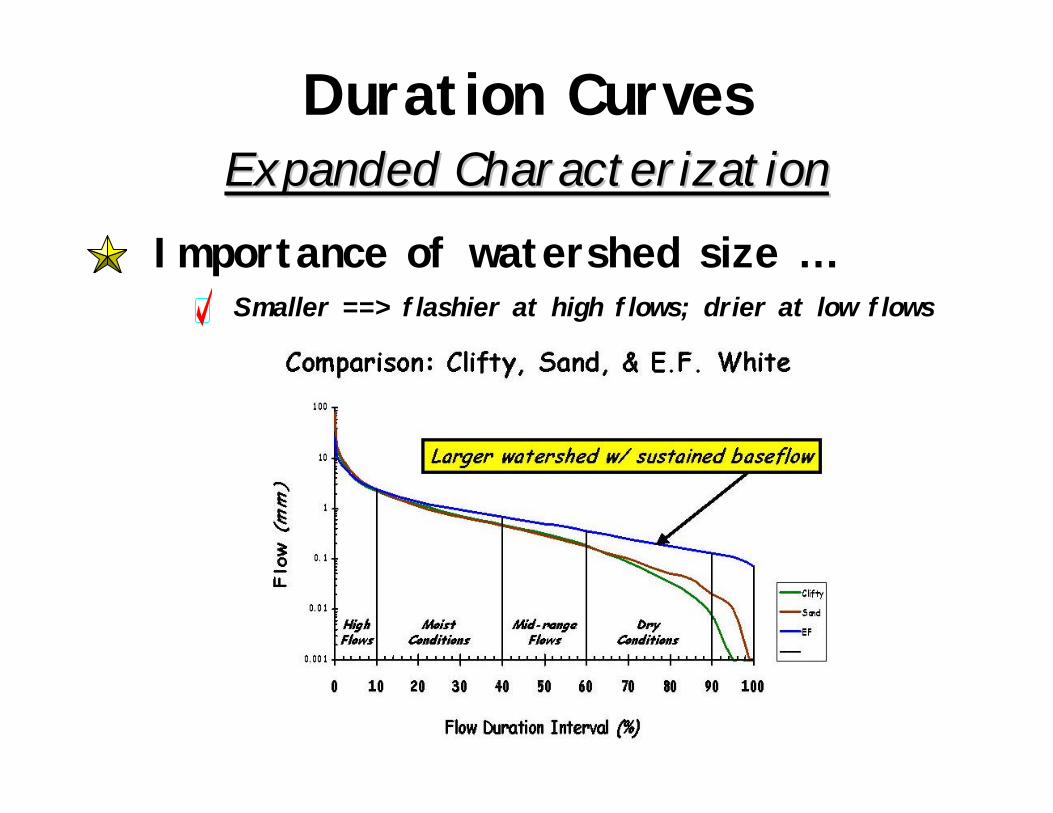
Duration CurvesExpanded CharacterizationExpanded Characterization
Importance of watershed size …Smaller ==> flashier at high flows; drier at low flows
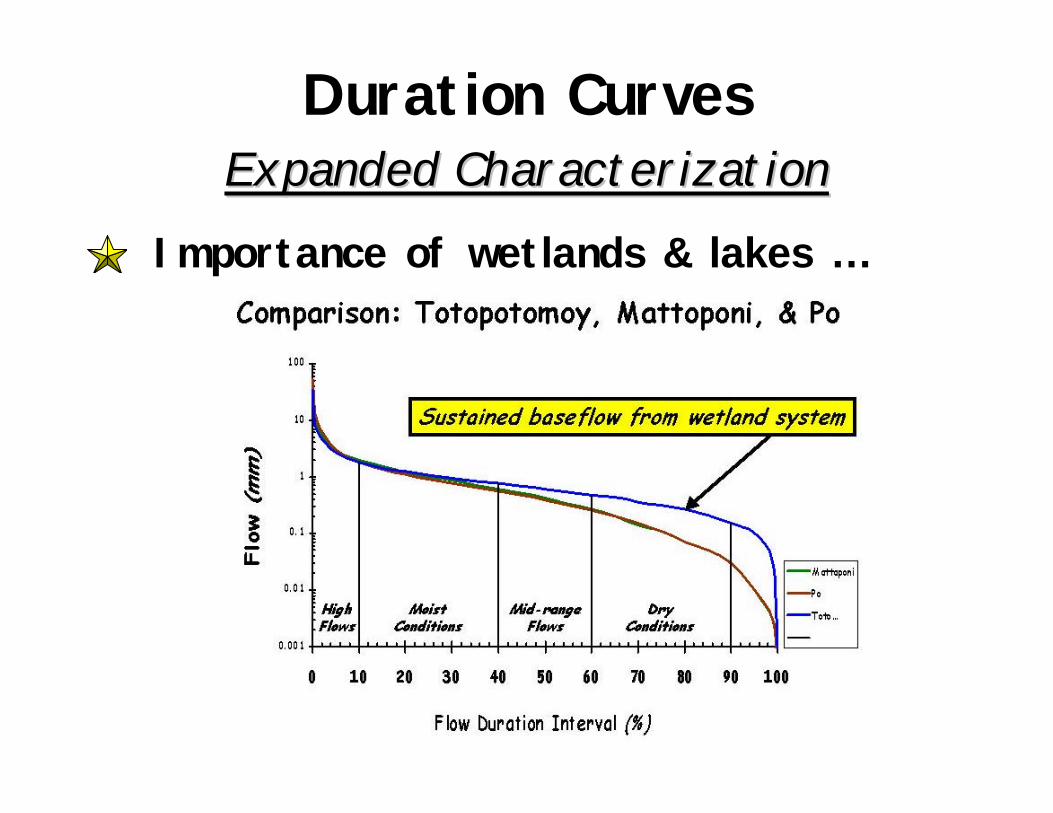
Duration CurvesExpanded CharacterizationExpanded Characterization
Importance of wetlands & lakes …
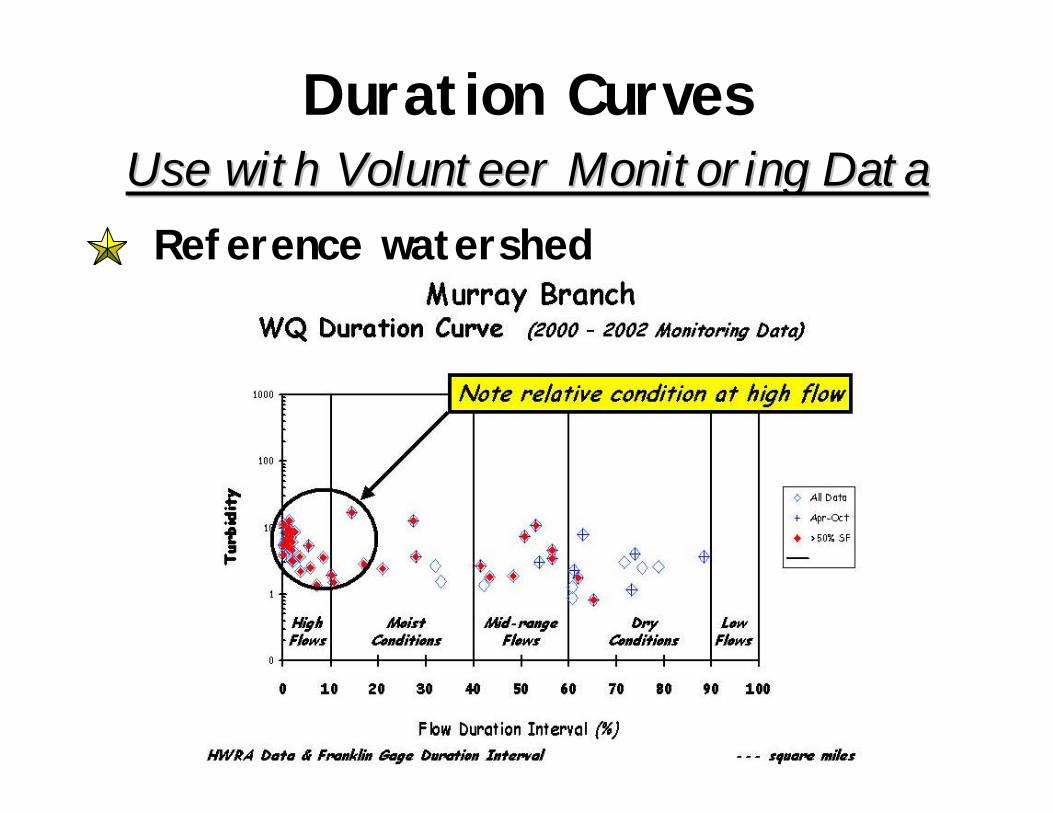
Duration CurvesUse with Volunteer Monitoring DataUse with Volunteer Monitoring DataReference watershed
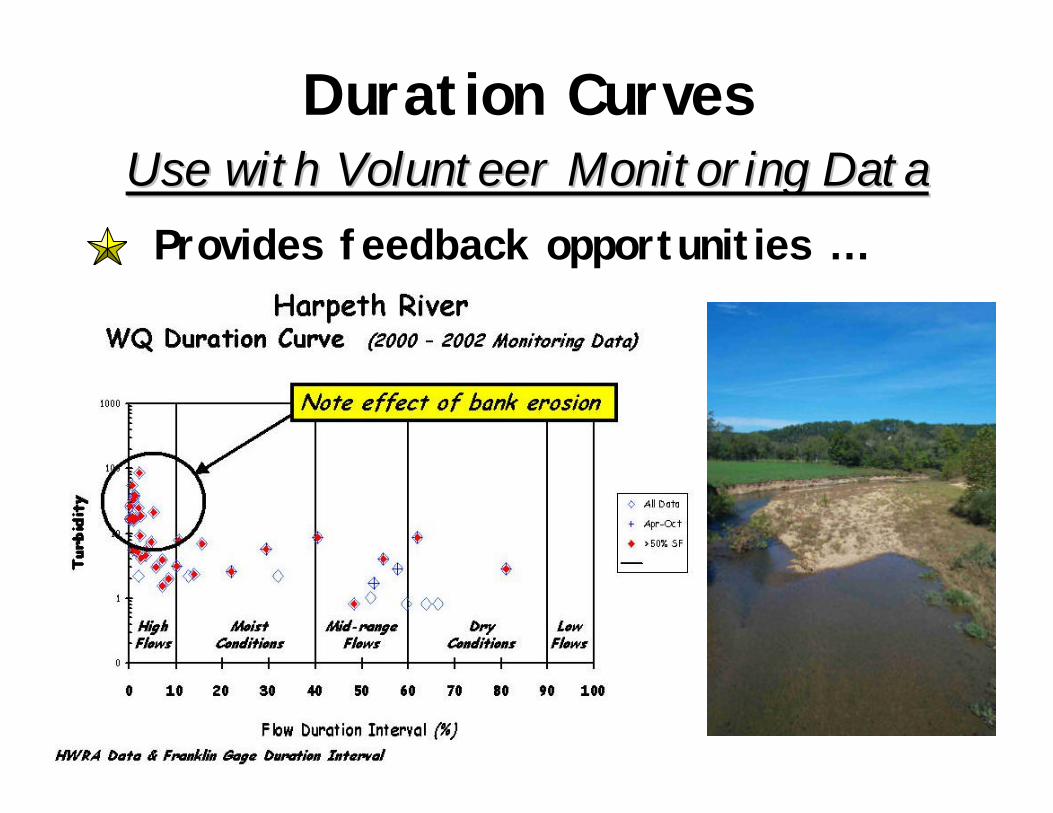
Duration CurvesUse with Volunteer Monitoring DataUse with Volunteer Monitoring DataProvides feedback opportunities …
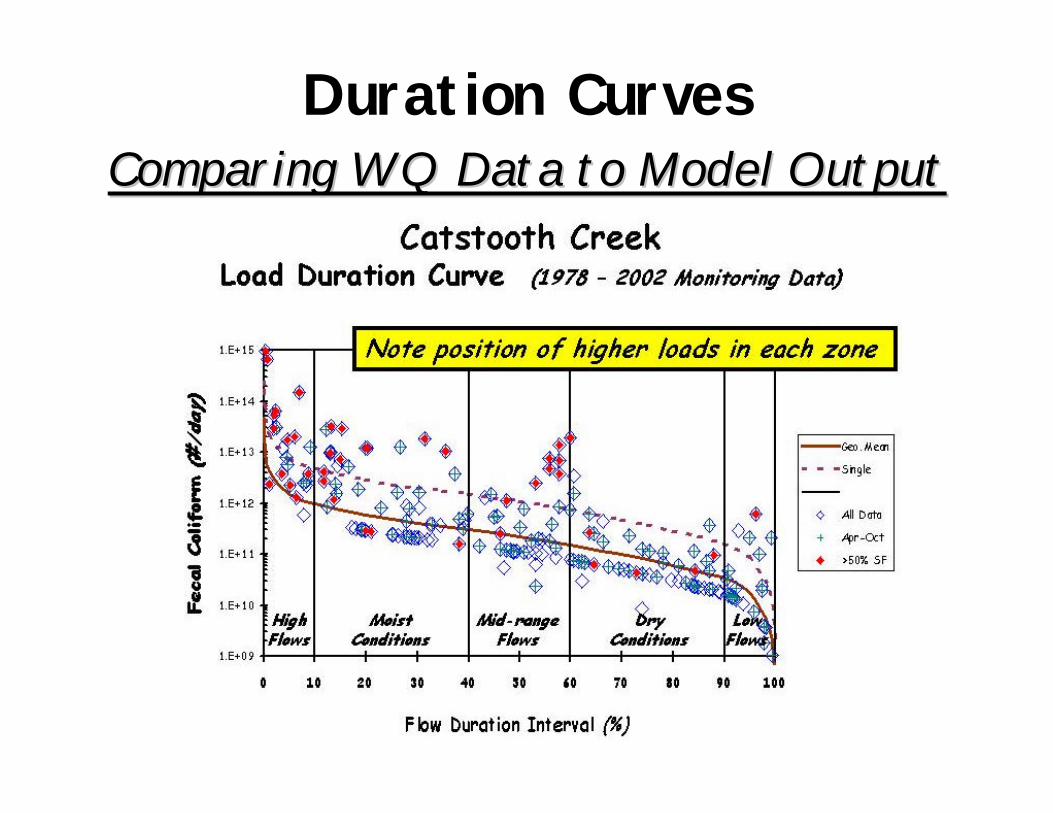
Duration CurvesComparing WQ Data to Model OutputComparing WQ Data to Model Output
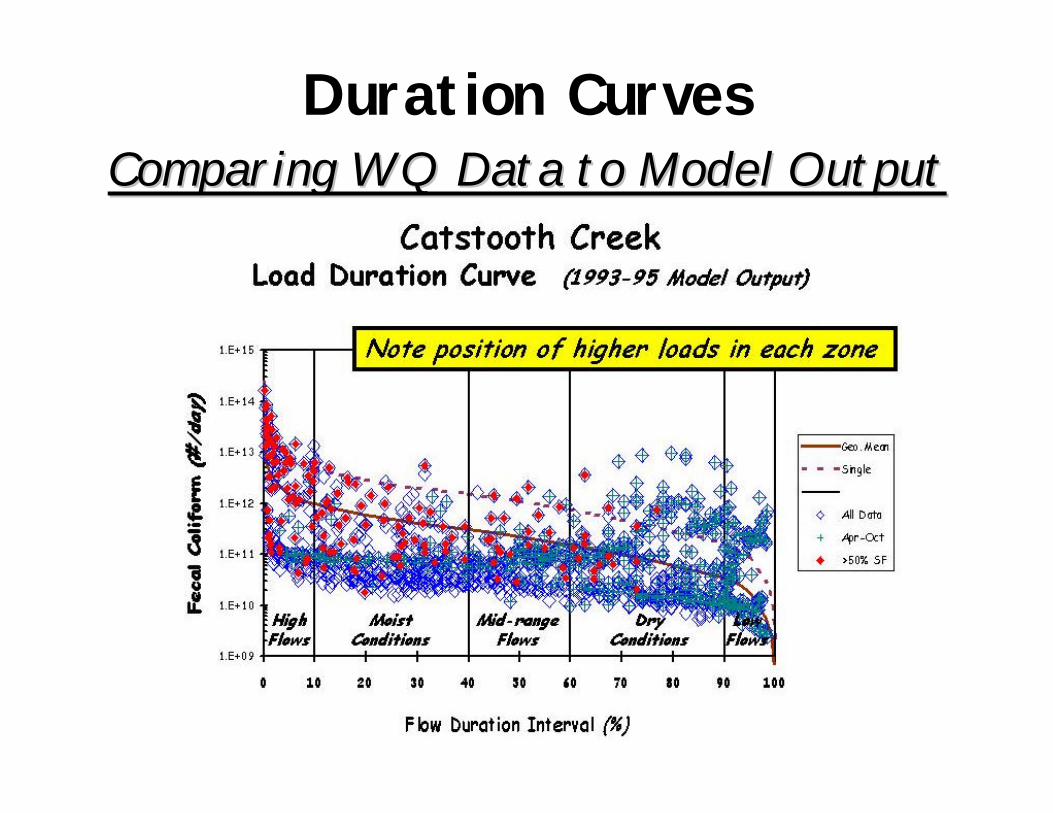
Duration CurvesComparing WQ Data to Model OutputComparing WQ Data to Model Output
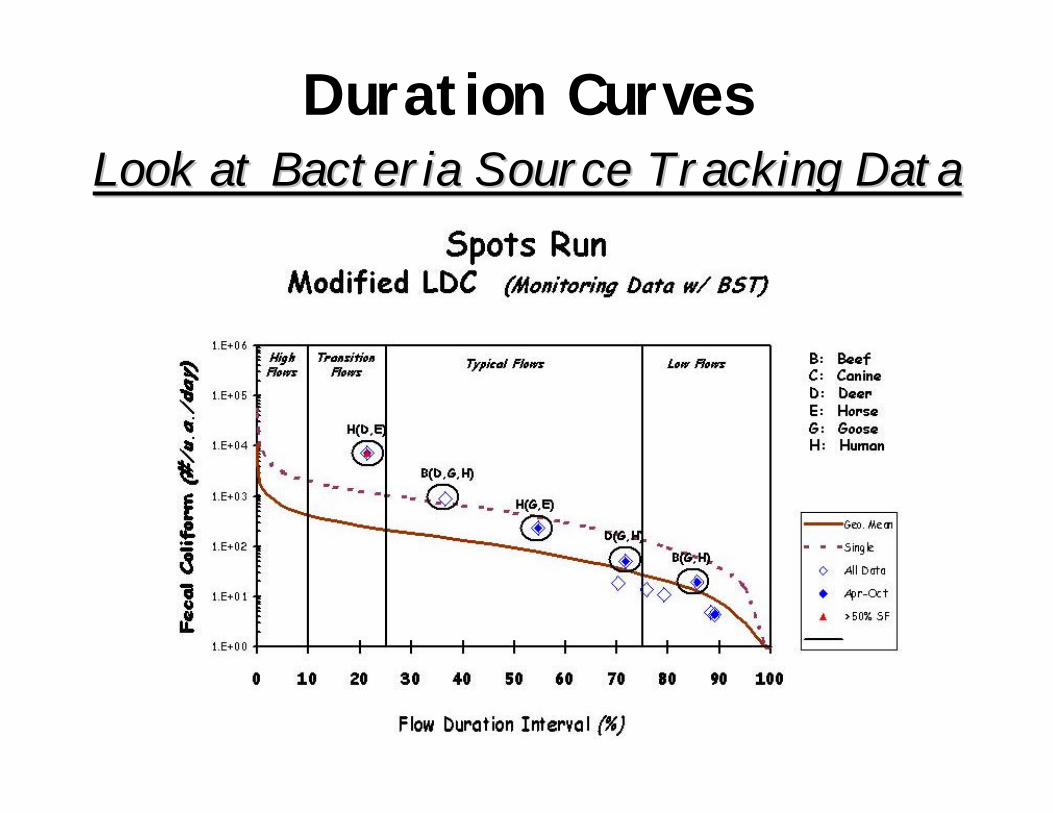
Duration CurvesLook at Bacteria Source Tracking DataLook at Bacteria Source Tracking Data
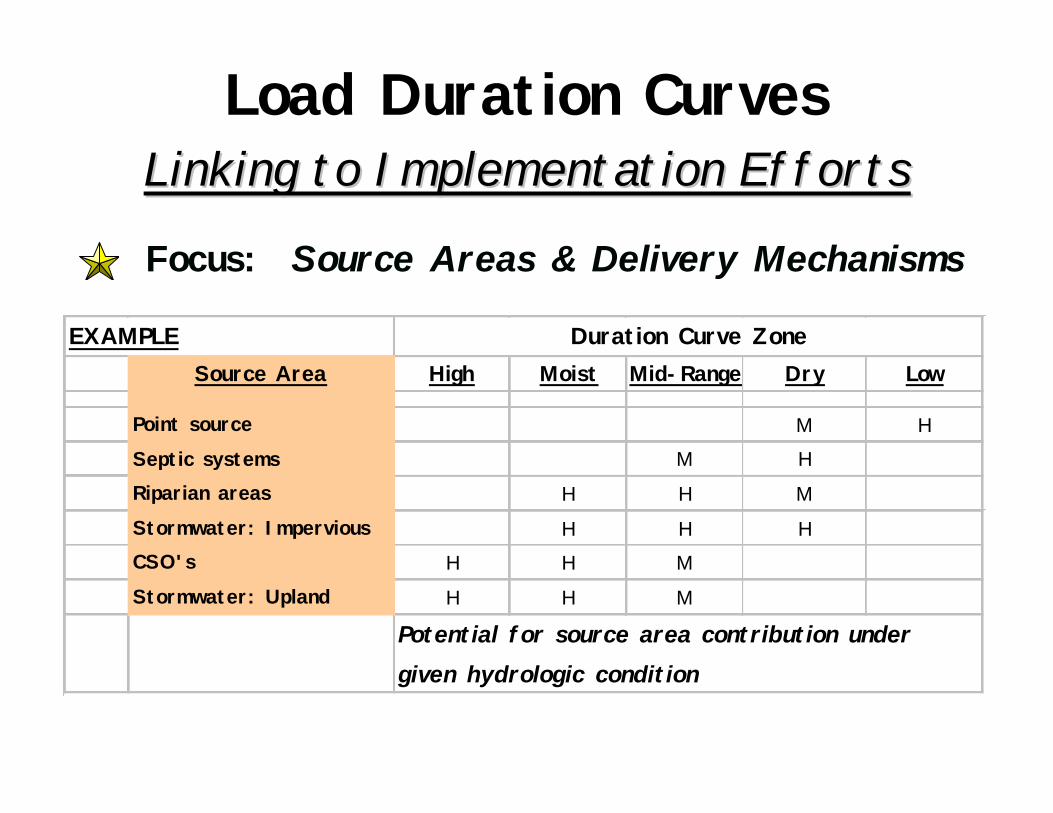
Load Duration CurvesLinking to Implementation EffortsLinking to Implementation Efforts
Focus: Source Areas & Delivery Mechanisms
Source Area High Moist Mid-Range Dry Low
Point source M HSeptic systems M HRiparian areas H H MStormwater: Impervious H H HCSO's H H MStormwater: Upland H H M
EXAMPLE Duration Curve Zone
Potential for source area contribution under given hydrologic condition
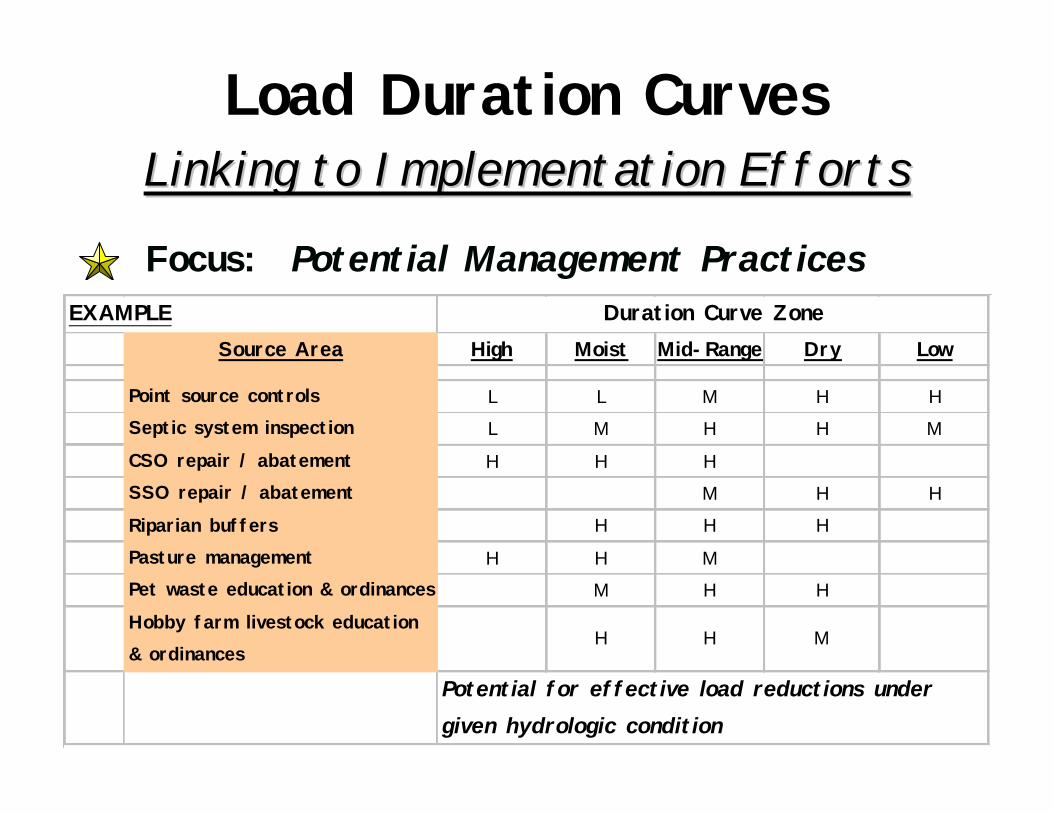
Load Duration CurvesLinking to Implementation EffortsLinking to Implementation Efforts
Focus: Potential Management Practices
Source Area High Moist Mid-Range Dry Low
Point source controls L L M H HSeptic system inspection L M H H MCSO repair / abatement H H HSSO repair / abatement M H HRiparian buffers H H HPasture management H H MPet waste education & ordinances M H HHobby farm livestock education & ordinances
H H M
EXAMPLE Duration Curve Zone
Potential for effective load reductions under given hydrologic condition
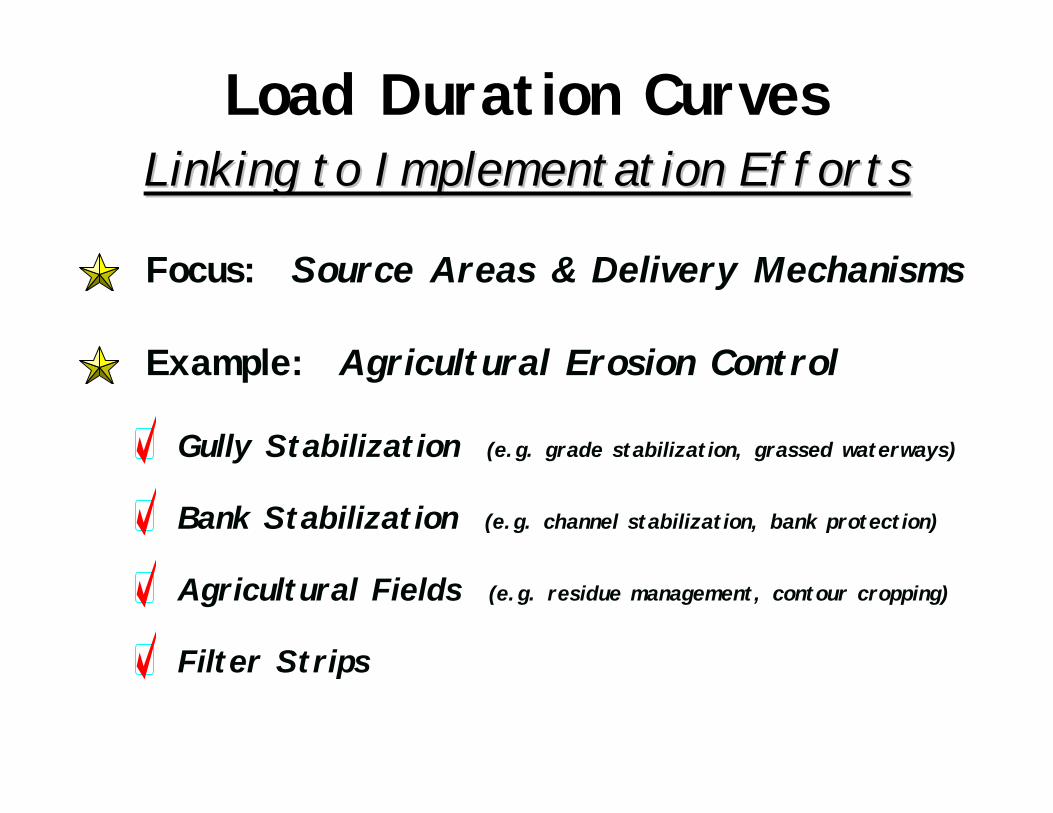
Load Duration CurvesLinking to Implementation EffortsLinking to Implementation Efforts
Example: Agricultural Erosion Control
Focus: Source Areas & Delivery Mechanisms
Agricultural Fields (e.g. residue management, contour cropping)
Filter Strips
Bank Stabilization (e.g. channel stabilization, bank protection)
Gully Stabilization (e.g. grade stabilization, grassed waterways)
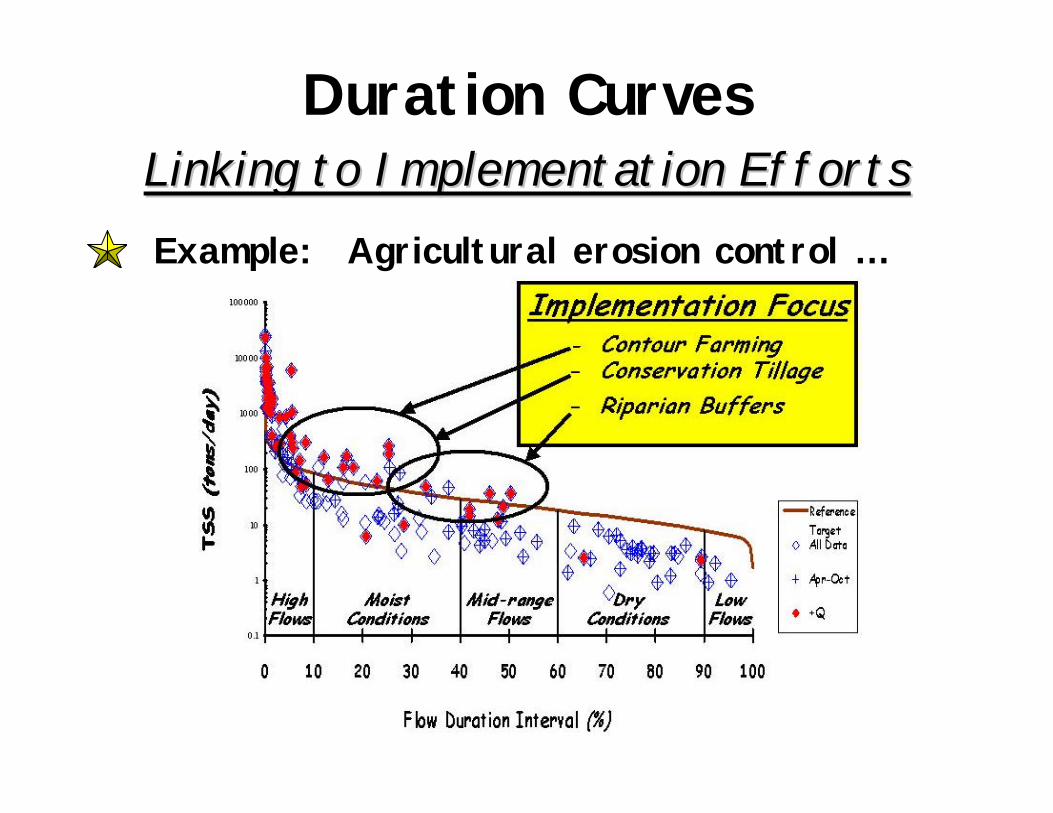
Duration CurvesLinking to Implementation EffortsLinking to Implementation EffortsExample: Agricultural erosion control …
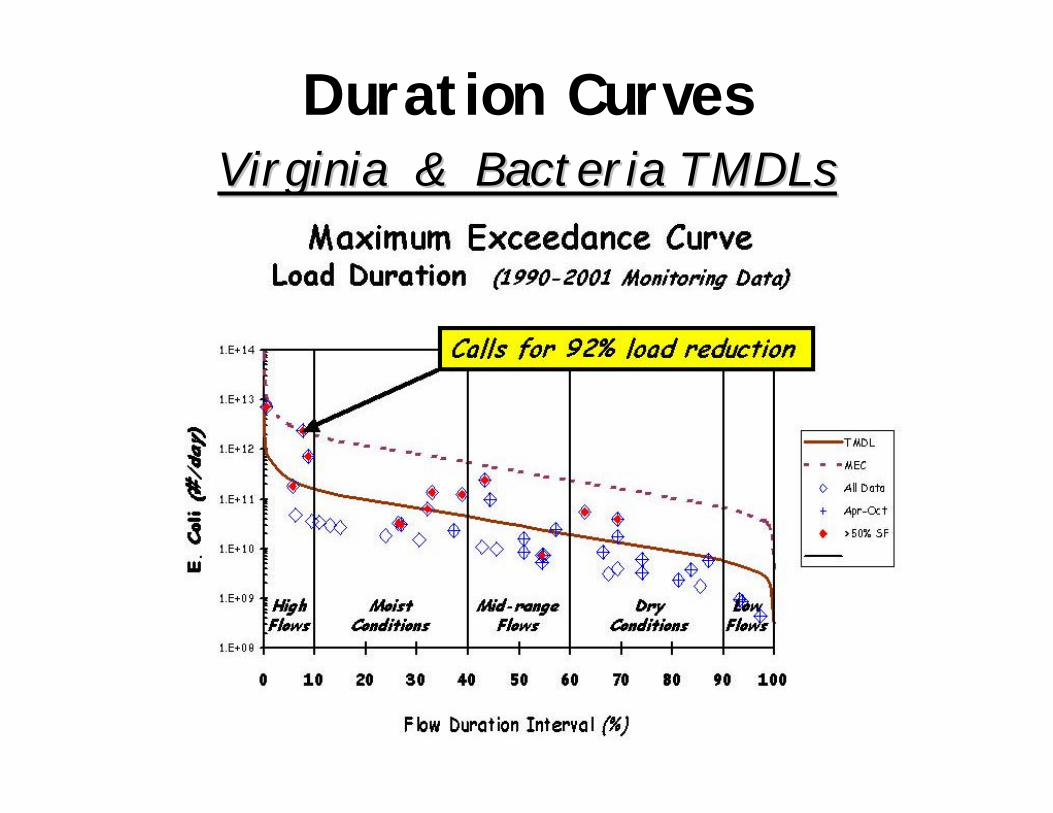
Duration CurvesVirginia & Bacteria TMDLsVirginia & Bacteria TMDLs
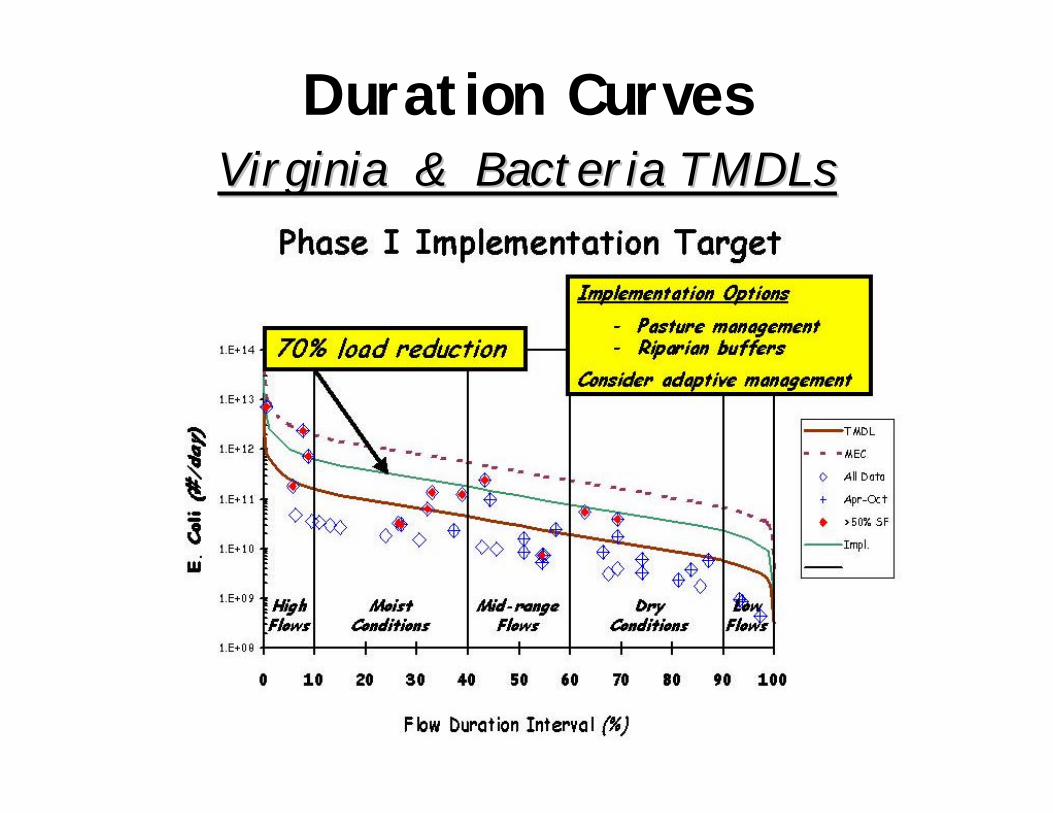
Duration CurvesVirginia & Bacteria TMDLsVirginia & Bacteria TMDLs
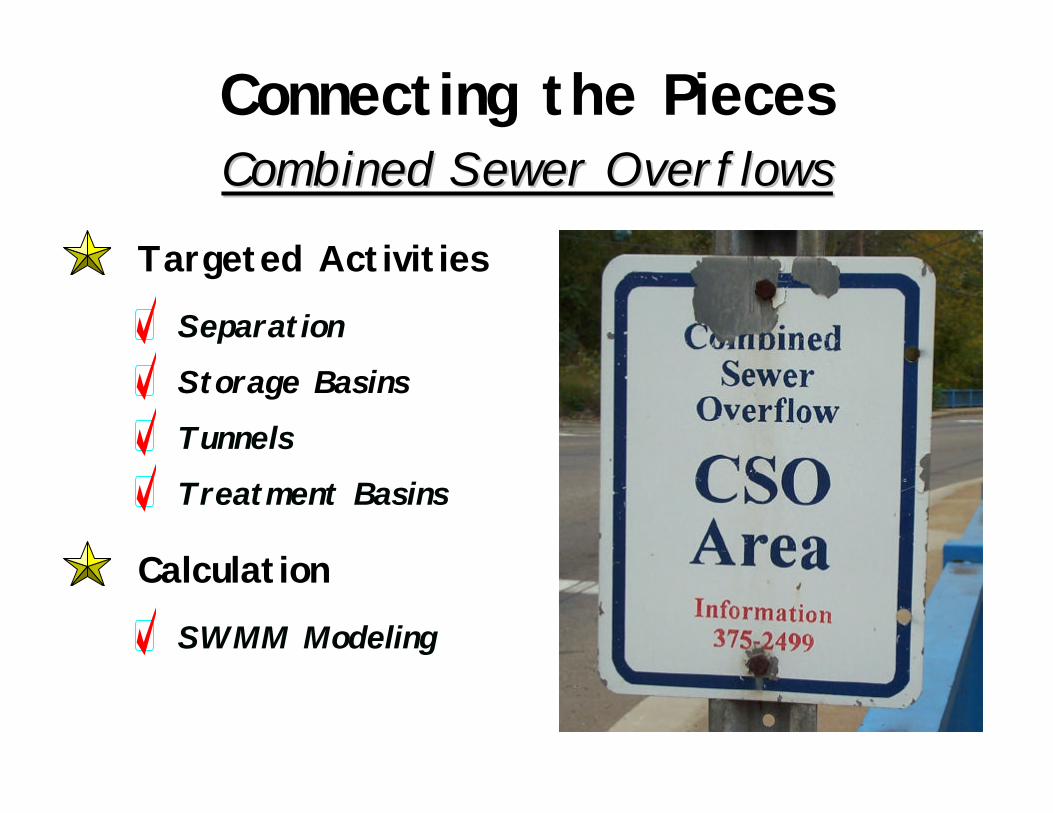
Connecting the PiecesCombined Sewer OverflowsCombined Sewer Overflows
Targeted Activities
Calculation
SWMM Modeling
Treatment Basins
Tunnels
Storage Basins
Separation
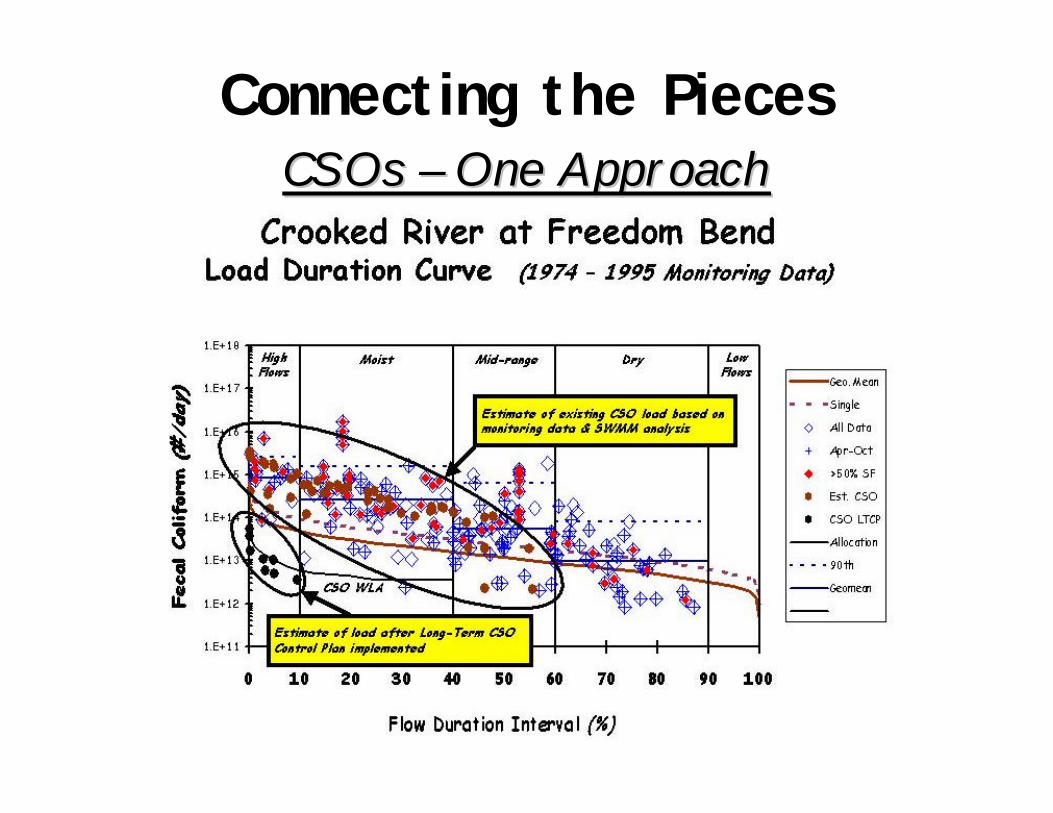
Connecting the PiecesCSOs CSOs –– One ApproachOne Approach
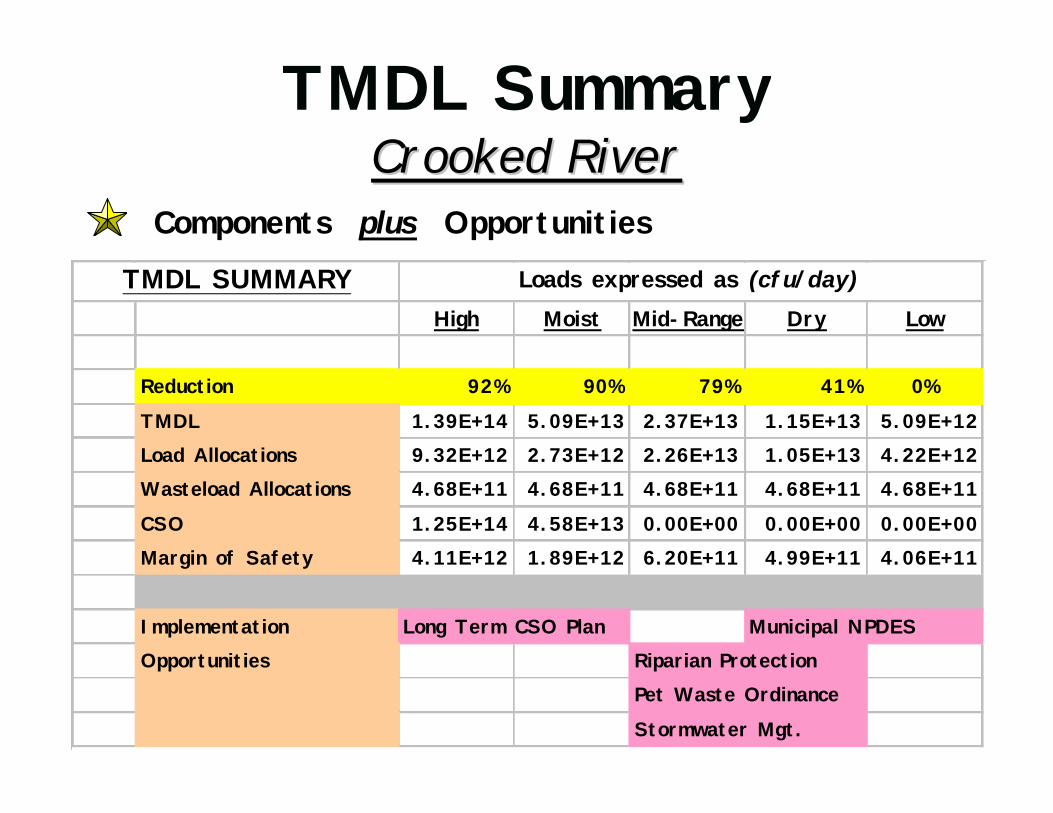
TMDL SummaryCrooked RiverCrooked River
Components plus Opportunities
High Moist Mid-Range Dry Low
Reduction 92% 90% 79% 41% 0%
TMDL 1.39E+14 5.09E+13 2.37E+13 1.15E+13 5.09E+12Load Allocations 9.32E+12 2.73E+12 2.26E+13 1.05E+13 4.22E+12Wasteload Allocations 4.68E+11 4.68E+11 4.68E+11 4.68E+11 4.68E+11
CSO 1.25E+14 4.58E+13 0.00E+00 0.00E+00 0.00E+00Margin of Safety 4.11E+12 1.89E+12 6.20E+11 4.99E+11 4.06E+11
ImplementationOpportunities
TMDL SUMMARY Loads expressed as (cfu/day)
Stormwater Mgt.
Long Term CSO Plan Municipal NPDESRiparian ProtectionPet Waste Ordinance
Load Duration CurvesContactsContacts
Bruce Cleland America’s Clean Water Foundation(206) 463-2596 [email protected]
Tom Stiles Kansas Dept. of Health & Environment(785) 296-6170 [email protected]


![Wolf messi curves[1]](https://img.pdfslide.us/doc/110x75/55b11043bb61eb3a2e8b460c/wolf-messi-curves1.jpg)