Embed Size (px)
Citation preview

Using Discipline Data to Assess and Address Disproportionality
Kent McIntosh
University of Oregon
Handouts:http://www.pbis.org

Provide additional information on cultural responsiveness and PBIS
Guide you though a process for using data to:1. Assess levels of disproportionality
2. Identify causes and solutions
3. Plan to monitor progress Provide time to eat and digest
Overview of Today’s Session
Handouts: http://www.pbis.org
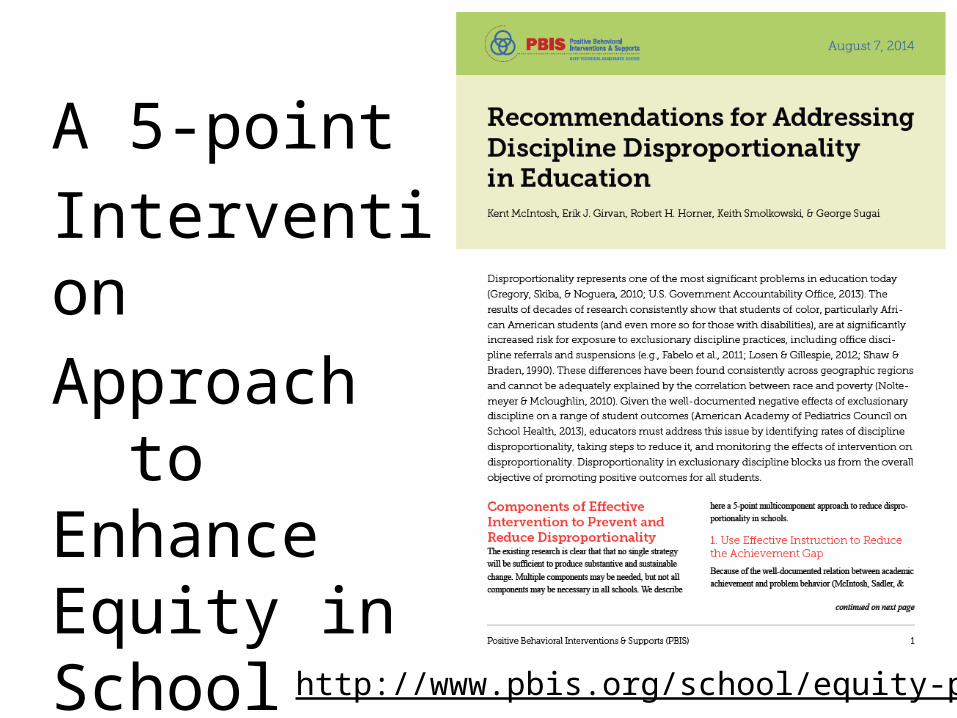
A 5-point
Intervention
Approach to Enhance Equity in School Discipline
http://www.pbis.org/school/equity-pbis

1. Use engaging academic instruction to reduce the achievement gap
2. Implement a behavior framework that is preventive, multi-tiered, and culturally responsive
3. Collect, use, and report disaggregated student discipline data
4. Develop policies with accountability for disciplinary equity
5. Teach neutralizing routines for vulnerable decision points
5-point Intervention Approach
http://www.pbis.org/school/equity-pbis

1. Proactive, instructional approach may prevent problem behavior and exposure to biased responses to problem behavior
2. Increasing positive student-teacher interactions may enhance relationships to prevent challenges
3. More objective referral and discipline procedures may reduce subjectivity and influence of cultural bias
4. Professional development may provide teachers with more instructional responses
2. Why start with a foundation of SWPBIS?
(Greflund et al., 2014)

Examined change in Black-White Relative Risk Index for suspensions in 46 schools
Two key predictors of decreased disproportionality:Regular use of data for decision making Implementation of classroom SWPBIS
systems
Which SWPBIS Features are Most Related to Equity? (Tobin & Vincent, 2011)

Expected behaviors defined clearly Problem behaviors defined clearly Expected behaviors taught Expected behaviors acknowledged regularly Consistent consequences CW procedures consistent with SW systems Options exist for instruction Instruction/materials match student ability High rates of academic success Access to assistance and coaching Transitions are efficient and orderly
Which features predicted decreased disproportionality?

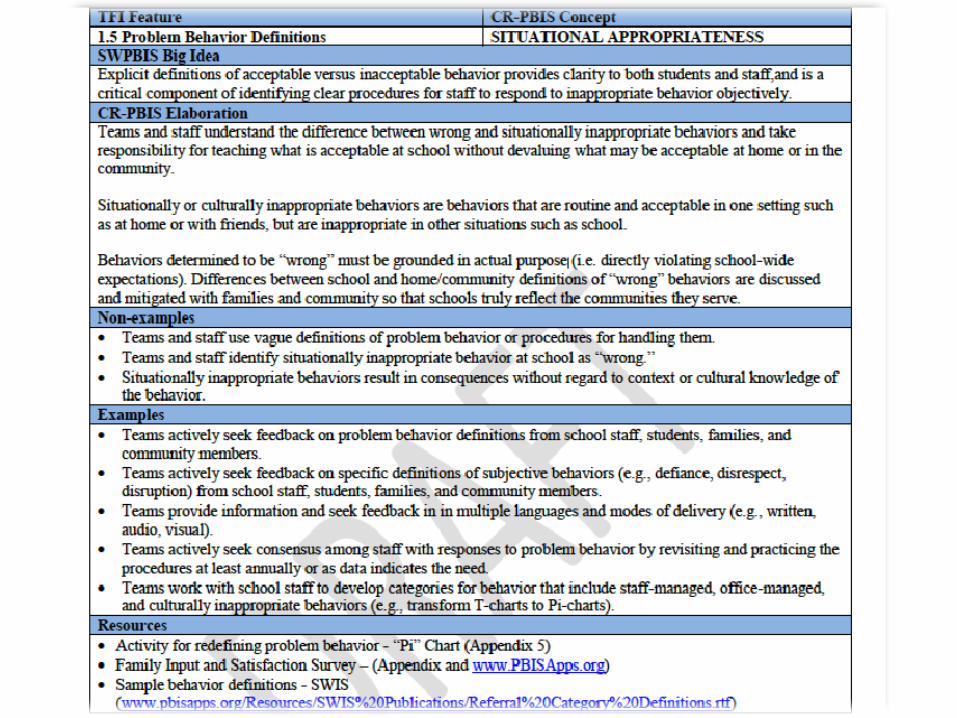
Aligned directly with SWPBIS Tiered Fidelity Inventory (TFI) Tier I Scale Identifies SWPBIS critical feature Identifies cultural responsiveness conceptProvides non-examples, examples, activities,
and resources
PBIS Cultural Responsiveness Companion

Disproportionality Data Guide
3. Using disaggregated data to assess and address equity
http://www.pbis.org/school/equity-pbis
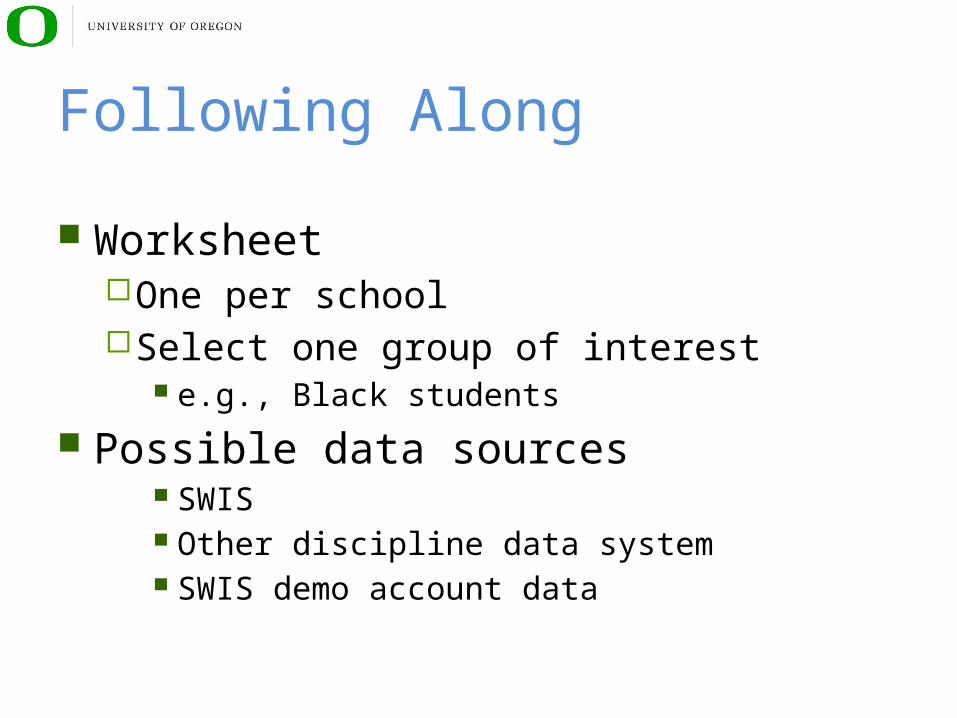
WorksheetOne per schoolSelect one group of interest
e.g., Black students
Possible data sources SWIS Other discipline data system SWIS demo account data
Following Along
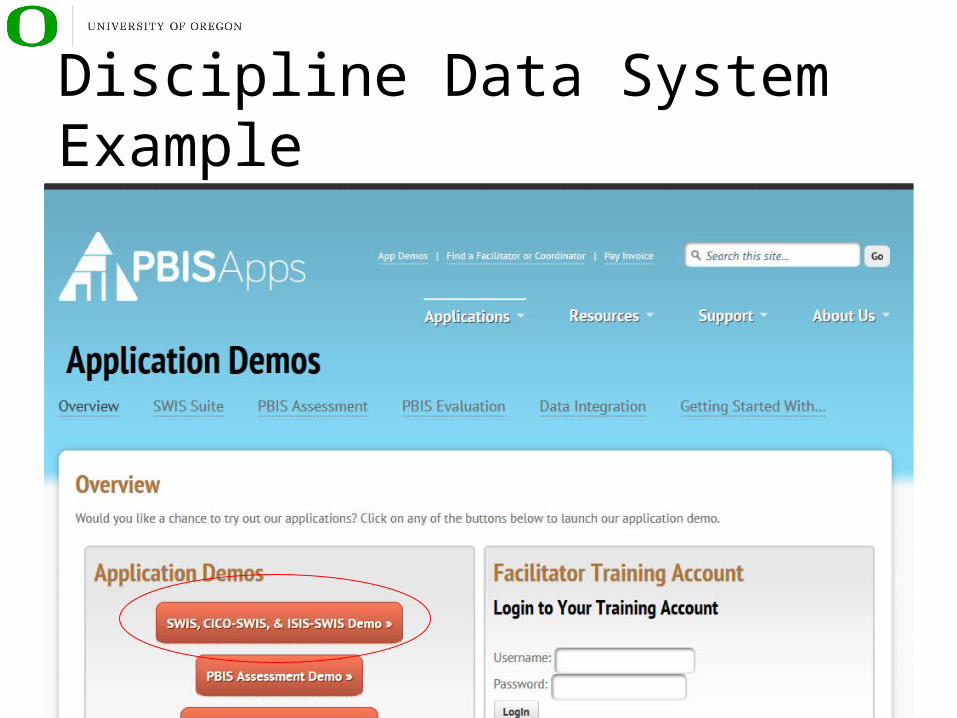
Discipline Data System Example

General Problem Solving Model
2. Problem Analysis
3. Plan Implementation
4. Plan Evaluation
1. Problem Identification
Is there a problem?
Why is it happening?
What should be done?
Is the plan working?

2. Problem Analysis
3. Plan Implementation
4. Plan Evaluation
1. Problem Identification
Step 1: Problem Identification
Is there a problem?

Step 1: Problem IdentificationCommon Metrics Risk Index
Percent of a group that receives an ODR or suspension (i.e., risk for that outcome)
# of Enrolled Students
# of Students With Referrals
% of Students Within Ethnicity With Referrals
Risk Index
Native 5 2 40.00% 0.4
Asian 21 10 47.62% 0.48
Black 70 42 60.00% 0.6
Latino 123 101 82.11% 0.82
Pacific 5 3 60.00% 0.6
White 255 165 64.71% 0.65
Unknown 0 0 0.00% 0
Not Listed 0 0 0.00% 0
Multi-racial
21 14 66.67% 0.67
Totals: 500 337
# of students with 1+ ODRs
# of students in the group
# of Latino/a students with 1+ ODRs
# of Latino/a students enrolled
# of White students with 1+ ODRs
# of White students enrolled

1. Log in at www.pbisapps.org
2. Click View Reports
3. Click Ethnicity
4. Scroll to the third graph
5. Click Data Table
Step 1: Problem IdentificationUsing SWIS

Step 1: Problem IdentificationCommon Metrics Risk Ratio
Risk index for one group divided by risk index for comparison group (usually White students)
1.0 is equal risk
> 1.0 is overrepresentation
< 1.0 is underrepresentation
Risk Index of Target Group
Risk Index of Comparison Group
Risk Index of Latino/a Students
Risk Index of White Students
.82
.65= 1.27
Available for free at http://goo.gl/mNcgVS

Step 1: Problem IdentificationProcedure
1. Select metrics to use2. Calculate metrics and compare to goals
• Previous years from same school• Local or national norms
• 2011-2012 U.S. public schools using SWIS with at least 10 Black and 10 White students
• Median Black-White ODR risk ratio = 1.84 (25th percentile = 1.38)
• Logical criteria• U.S. Equal Employment Opportunity Commission (EEOC)
• Disparate impact criterion (goal risk ratio range between .80 and 1.25)

School Example: Rainie Middle School
White Black Latino/a Asian0%
10%20%30%40%50%60%
48%
31%20%
10%
School Enrollment
School-wide Information System (SWIS)
• Metric: risk ratio• Goal: All groups with a
risk ratio < 1.25
STEPS
• Calculate risk indices
• Calculate risk ratios
• African American = 3.2 (significant)
• Latino/a = 1.1

1. Complete STEP 1 (pp. 1-2)1. Select metrics to use
2. Calculate metrics
3. Compare to goals
2. Reflect on your data: to what extent is there a problem?
Step 1: Worksheet Activity

2. Problem Analysis
3. Plan Implementation
4. Plan Evaluation
1. Problem Identification
Step 2: Problem Analysis
Is there a problem?
Why is it happening?

A specific decision that is more vulnerable to effects of implicit bias
Two parts:Elements of the situationThe person’s decision state (internal state)
What is a Vulnerable Decision Point (VDP)?
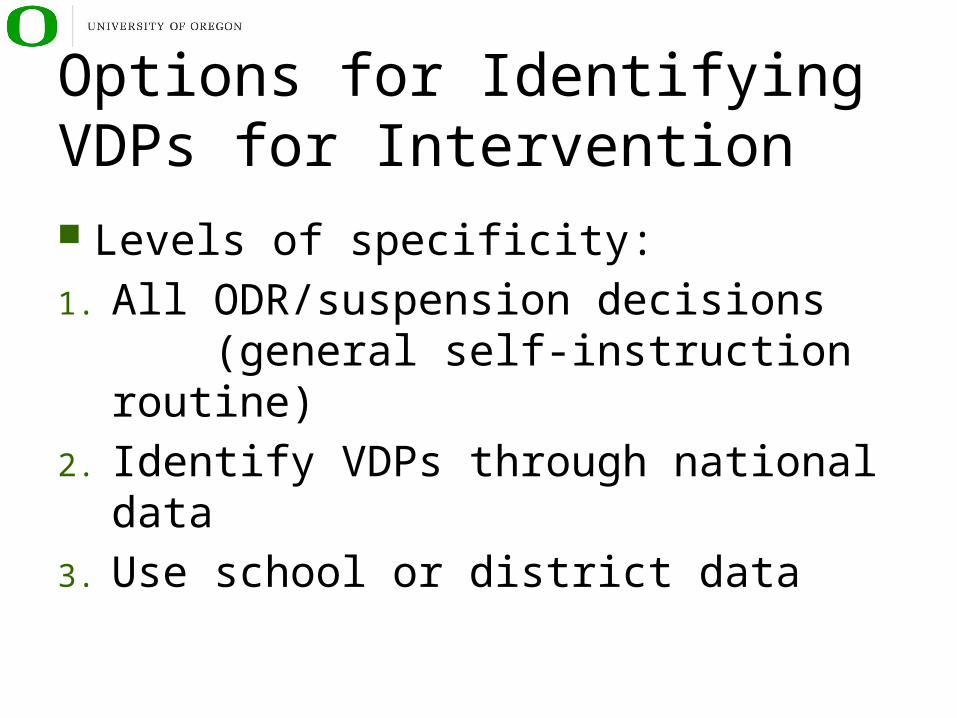
Levels of specificity:
1. All ODR/suspension decisions (general self-instruction routine)
2. Identify VDPs through national data
3. Use school or district data
Options for Identifying VDPs for Intervention

Subjective problem behaviorDefiance, Disrespect, DisruptionMajor vs. minor
Non-classroom areasHallways
Classrooms Afternoons
VDPs from national ODR data
ambiguit
y
LACK OF
contact
fatigueDEMANDS?
Relevance?

SWIS Drill Down (www.swis.org)
Add demographic group of interest as a filter (click to
“Include in Dataset”).
Click each graph and compare to overall patterns.

1. Complete STEP 2 (pp. 3-4)1. Assess PBIS fidelity
2. Identify vulnerable decision points
3. Assess achievement gap
Step 2: Worksheet Activity

1. Fill the middle left set with your school or district’s ODR/susp. data for White students
Behavior: Location: Time: Day: Grade lvl:
Step 2: Worksheet Activity

2. Fill the middle right set with ODR/susp. data for your demographic group
Behavior: Location: Time: Day: Grade lvl:
Step 2: Worksheet Activity
1. Use SWIS drill down
2. Look at graphs on back page of worksheet
Options

Stage 1 Behavior: White Students

Stage 1 Behavior: Black Students
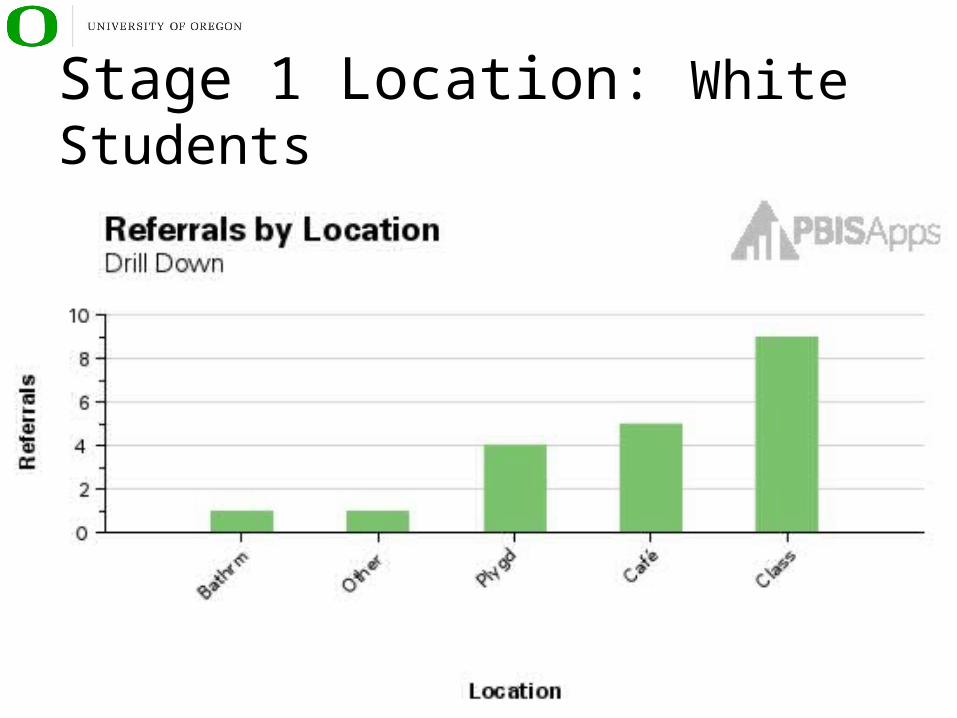
Stage 1 Location: White Students
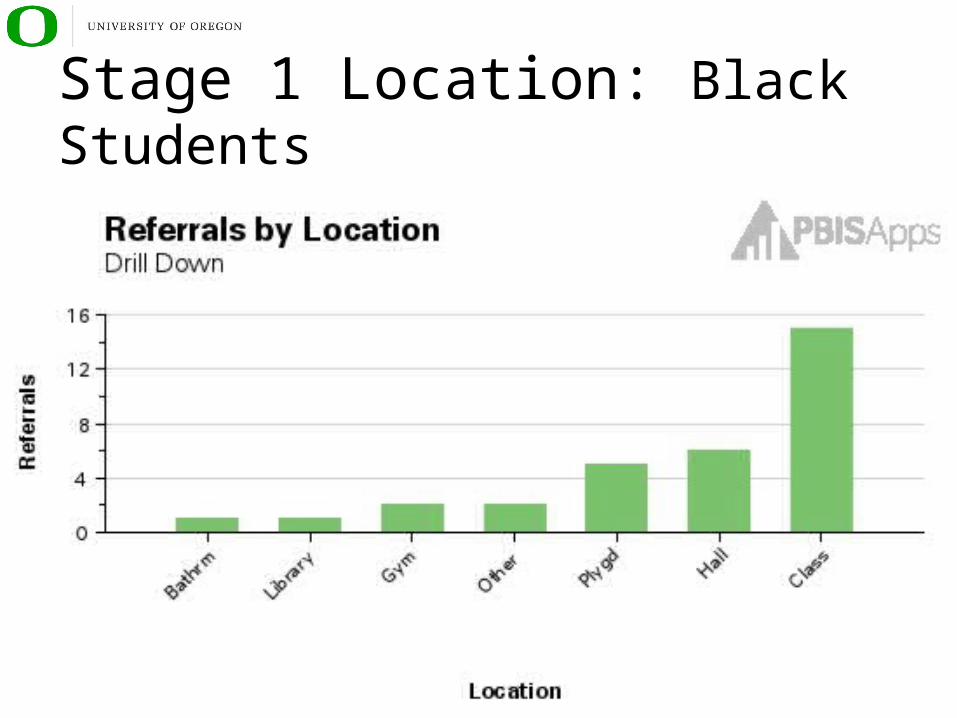
Stage 1 Location: Black Students
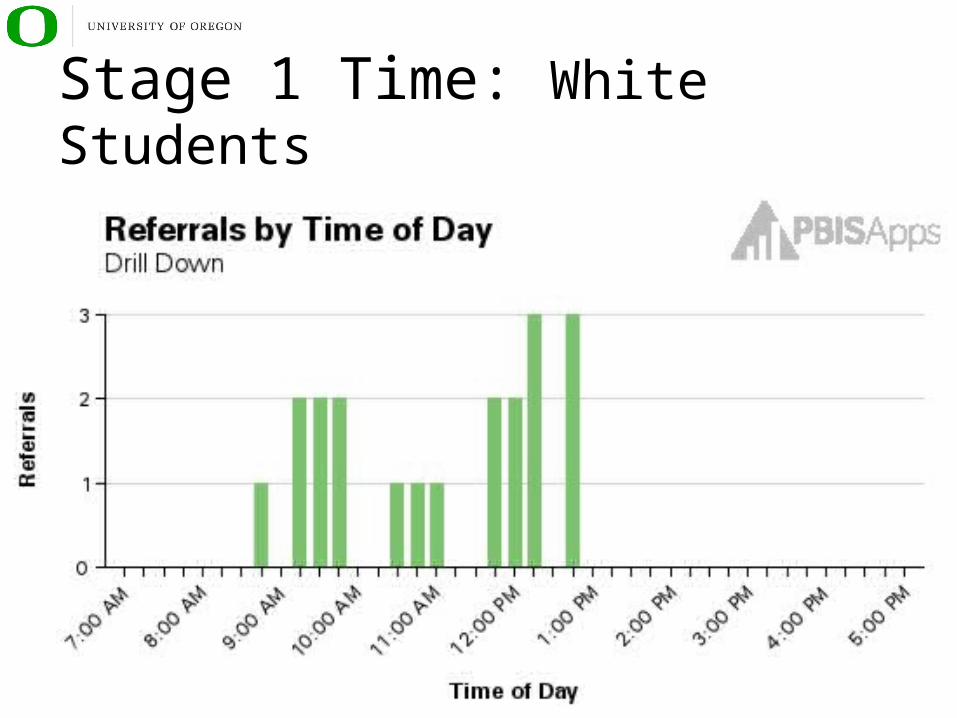
Stage 1 Time: White Students

Stage 1 Time: Black Students

Stage 1 Grade: White Students

Stage 1 Grade: Black Students

2. Problem Analysis
3. Plan Implementation
4. Plan Evaluation
1. Problem Identification
Step 3: Plan Implementation
Is there a problem?
Why is it happening?
What should be done?

Step 3: Plan ImplementationOptions All issues
Calculate and share disproportionality data regularly
Inadequate PBIS implementation Implement core features of PBIS to establish a foundation of support
Clarify ODR definitions and procedures
Misunderstandings regarding school-wide expectations Enhance cultural responsiveness of PBIS with input from families,
students, and community
Significant academic achievement gap Use effective academic instruction
Disproportionality across all settings (indicating explicit bias) Enact strong equity policies that include accountability
Disproportionality in specific settings (indicating implicit bias) Teach neutralizing routines for vulnerable decisions

School Example: Rainie Middle School

1. Complete STEP 3 (pp. 5-6)1. Identify strategies to implement
2. Create a detailed action plan
Step 3: Worksheet Activity

2. Problem Analysis
3. Plan Implementation
4. Plan Evaluation
1. Problem Identification
Step 4: Plan Evaluation
Is there a problem?
Why is it happening?
What should be done?
Is the plan working?

Step 4: Plan EvaluationProcedure
1. Identify the time periods for evaluating disproportionality data
2. Assess fidelity of plan implementation
3. Calculate metrics selected in Step 1
4. Compare to the goal determined in Step 1
5. Share results with relevant stakeholders

October January March June0
0.51
1.52
2.53
3.54
Black-White ODR Risk Ratio
Risk Ratio
• 6th grade team may need a refresher on office vs. staff-managed behaviors
• Revise action plan for next year
• Continue evaluation cycle
School Example: Rainie Middle School

Disproportionality in school discipline is one of the biggest challenges in education today
We can use data to assess and monitor how we are doing If you don’t have the data you need at hand,
advocate for it The same steps we have for solving
discipline problems work for disproportionality
Big Ideas

Contact Information
Kent McIntoshSpecial Education Program
University of Oregon
@_kentmc
Handouts: http://kentmcintosh.wordpress.com
Cannon Beach, Oregon © GoPictures, 2010
Greflund, S., McIntosh, K., Mercer, S. H., & May, S. L. (2014). Examining disproportionality in school discipline for Aboriginal students in schools implementing PBIS. Canadian Journal of School Psychology, 29, 213-235.
McIntosh, K., Barnes, A., Morris, K., & Eliason, B. M. (2014). Using discipline data within SWPBIS to identify and address disproportionality: A guide for school teams. Eugene, OR: Center on Positive Behavioral Interventions and Supports. University of Oregon.
McIntosh, K., Girvan, E. J., Horner, R. H., Smolkowski, K., & Sugai, G. (2014). Recommendations for addressing discipline disproportionality in education. OSEP Technical Assistance Center on Positive Behavioral Interventions and Supports.
Vincent, C. G., Swain-Bradway, J., Tobin, T. J., & May, S. (2011). Disciplinary referrals for culturally and linguistically diverse students with and without disabilities: Patterns resulting from school-wide positive behavior support. Exceptionality, 19, 175-190.
References