Embed Size (px)
Citation preview

Using DecisionTools to Mitigate Project Risk for Large Scale Wood Pellet Export Projects
Presented by Dr. William Strauss
President, FutureMetrics November 8, 2012

2
Who is FutureMetrics?
We are Globally Respected Consultants in BioEnergy
8 Airport Road Bethel, ME 04217, USA
3
FutureMetrics Services:
Research, analysis, and strategic guidance for the bioenergy sector.
We combine data driven analysis with a depth of knowledge across the bioenergy sector to provide full spectrum reporting that enables our clients
to make optimal decisions. ______________________________________________________
Selection of Clients

4
Prefeasibility and feasibility studies Due diligence
Financial modeling Risk analysis
Economic impact analysis Expert advice
FutureMetrics LLC

5
Recipient of the 2012 International Excellence in Bioenergy Award

Overview of the Pellet Export Sector
Source: “Global Wood Pellet Industry: Market and Trade Study,” IEA Bioenergy Task 40, December, 2011.


European demand is driven by carbon mitigation policies. The policy risk (that is the risk that policy will change and the benefits of low carbon fuels for power generation will be withdrawn) is minimal. For example, Renewable Obligation Credits (ROCs) place an obligation on licensed electricity suppliers in the United Kingdom to source an increasing proportion of electricity from renewable sources. They are designed to encourage generation of electricity from eligible renewable sources. The program is in place for 25 years from 2012 and provides strong certainty for investment. In 2010/11 it required that 11.1% of power be generated from renewables. It will rise to 15.4% by 2015/16 and then it runs until 2037.


Let’s look at the US and Sweden’s aggregate numbers


Sweden currently has a carbon emissions tax of 930 Swedish Kronor (SEK) ($139.54) per tonne of CO2 emissions. (source: Government Offices of Sweden: Energy Policy)


R² = 0.7059
$0
$20,000
$40,000
$60,000
$80,000
$100,000
$120,000
2.5 3 3.5 4 4.5 5 5.5 6
GDP/
Capi
ta
Competitiveness Index
GDP/Capita vs. Competitiveness
source: World Economic Forum, analysis by FutureMetrics
Sweden
United States

GDP/CapitaLuxembourg 113,533$ Qatar 98,329$ Norway 97,255$ Switzerland 81,161$ United Arab Emirates 67,008$ Australia 65,477$ Denmark 59,928$ Sweden 56,956$ Canada 50,436$ Netherlands 50,355$ Austria 49,809$ Finland 49,350$ Singapore 49,271$ United States 48,387$

Georgia Biomass – 750,000 tons per year of pellets Owned by RWE
RWE is one of Europe’s five leading electricity and gas companies and is the No. 1 power producer in Germany, No. 2 in the Netherlands and No. 3 in the UK.
CAPEX of about $160,000,000


Lets look at a 250,000 ton per year export project (based on an actual project for which
FutureMetrics is the lead consultant).
There are many areas of uncertainty. We will look at: • Wood price (which also includes diesel fuel price) • Pellet selling price (which also includes price
appreciation above inflation) • Capital Cost • Inflation • An a few other items…

In this presentation we will not look at (except the “Tilbury effect and at bit on optimal insurance):
• policy risk (this is systemic and also of low probability) • currency risk (this is real and can be negotiated in the “offtake
agreement) • shipping cost risk (typically the buyer contracts are FOB) • market disruption risk (the “Tilbury effect”)
Torrefied pellet production;
• mass and energy balance sensitivities and cost of goods risk • reliability and maintenance cost risk • market demand risk (all of the above for export plus competition
from white pellets) Working capital issues;
• supply chain risk (catastrophic failure!) • product lost risk (optimal insurance coverage)
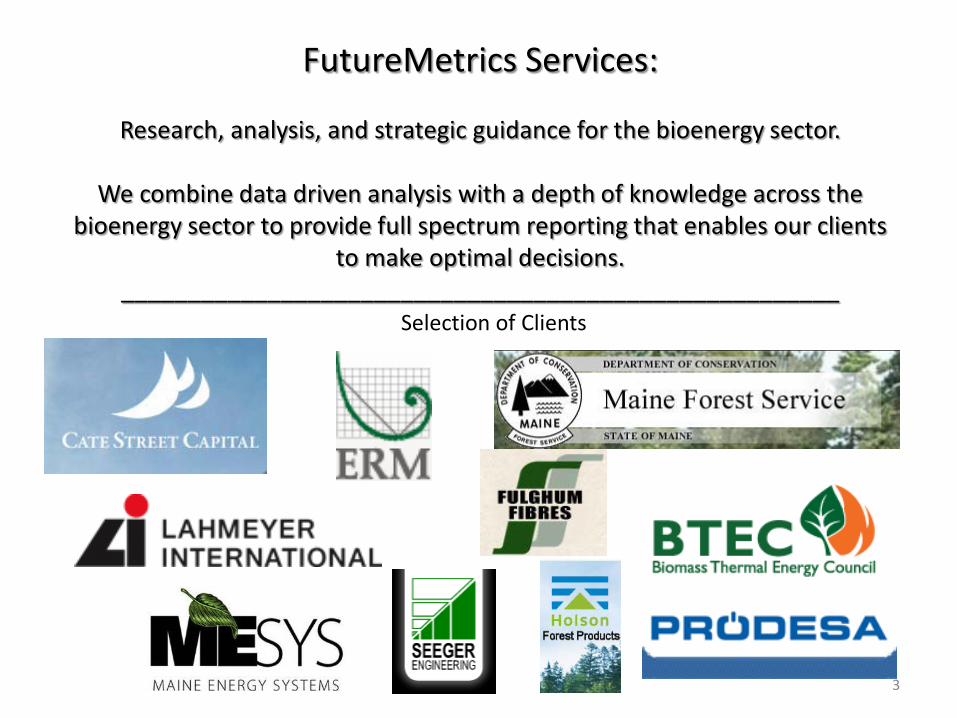
Equipment Requirements Approximate CostTruck Scales $160,000Truck Dumper $175,000Raw Material Infeed Station and Silo $630,952Raw Material Transfer Conveyor $239,762Suspended Magnet $116,095Dryer Infeed and Discharge Conveyors $189,286 Dryers $4,900,000Dryer Fuel Storage Silo, Unloader, and Discharge Conveyor $150,000Dryer Burner Fuel Conveying System (pneumatic) $100,000Dryer Burner (wood fueled with controls and feed system) $550,000Chip Screeners $504,762Screener Output (Acceptable and Oversized) Conveyors $100,952Hammer Mills (course input and processed chips mills) $1,323,000Pneumatic System (Hammer Mill Take-Aways pre-dryer and post dryer) $364,500Dry Material Silos, Unloaders, and Conveyors (dust and dryed chips) $972,000Pellet Mill Surge Hoppers $214,524Pellet Mills, Conditioners and Motors $4,063,500Start-up Dies for Pellet Mills $202,500Spare Rollers and Shells for Pellet Mill $110,000Pellet Mill Discharge Conveying System $126,190Pellet Cooler $189,286Cooler Air System and Filters $252,381Screener for Removing Fines $88,333Fines Conveying System $63,095Finished Pellets Screener Discharge Conveyor and Bucket Elevator $116,095On Site Pellet Storage Silos $1,463,810Pellet Storage Discharge Conveyor and Fines Screener $214,524Bagging System (Hopper, Scale, Fill and Seal Bagger, Stacker, Wrapper) $275,000Structural Steel (not including buildings) $1,211,429Electrical Service, Controls, and Control Systems $1,312,381Engineering (includes permitting) $1,261,905Boiler & Hardware (Office and Maintenance Area Heat) $205,000Miscellaneous Spare Parts $883,333
Process Equipment Budget $22,729,595Other Costs
Front End Loaders $1,514,286Fork Lift $466,905Land $1,620,000Buildings (Process and Warehouse - Includes all site prep work and erection) $4,669,048Site & Driveway Work $2,397,619Fire Protection and Spark Detection Systems $744,524Start-up Bags, Slip-Covers & Pallets $201,905Other Start-up Costs (including payroll and vendor oversight) & Working Capital $2,132,424Freight $668,810Marketing & Administrative Costs $630,952
Total Other Costs $15,046,471Contracting and Construction Costs (mechanical and electrical other than buildings) $2,397,619
Debt Contingency for Construction Period and Startup $2,523,810Total Debt $26,310,382
Total "Equity" Investment (New Money Needed for the Upgrades and the Correction of the Arrears) $17,587,113Lumber Mill Upgrades $500,000
Correction of Arrears $700,000Total Capital Investment $43,897,495.08
262,800 tonne Per Year Wood Pelleting Plant Capital Costs to Startup Projections30 tonnes Per Hour Full Capacity Production

Wood Cost (avg delivered after year 5) $37.00 per tonneSawdust Cost (green and kiln dried avg delivered) $30.00 per tonneWeighted Average Wood Cost before year 5 $37.41 per tonneWeighted Average Wood Cost after year 5 $36.99 per tonneRatio of Chips to Sawdust 1,000.00 Conversion Rate from Chips to Pellets 1.80 Chips/PelletsConversion Rate from Sawdust to Pellets 1.80 Sawdust/Pelletstonnes per hour of Chips Produced 30.00 tonnes/hourElectricity Cost $0.080 per kwhOperator and Maintenance Labor + Benefits $18.00 per hourLoader and Fork Truck Driver Labor + Benefits $15.00 per hourOffice Staff + Benefits $15.00 per hourPlant Manager $100,000 per yearMaterial Supply Manager $0 per yearSales Manager $0 per yearDelivery Costs to Buyers $0.00 per tonne mile (truck)
Average Delivery Distance per tonne Delivered - miles
Kilowatts/HP 0.7457 KW/HPActual Electricity Use as a Percent of Maximum Load 60%Moisture Content of Raw Material 50%
BTU per tonne of Dry Chips and/or Sawdust 17,400,000 BTU/tonnetonnes per Hour of Chips and Sawdust to Run Dryer 9.06 tonnes/hour
Cost of Wood for Dryer Burner $15.00 per tonneSales Price of Pellets Delivered (expected price in 2014 after upgrades) $175.00 per tonne
Cost of Transport to Port and Port Storage and Loading Cost $13.00 per tonneOther Electricity Usage 2% of HP Demand
Die Capacity 2,000 tonnesDie Cost $4,000 per die
Roller Shell Capacity 3,000 tonnes
Roller Shell Cost (3 shells per set) $1,200 per shell
Roller Bearing Capacity 2,500 tonnesRTO Operating Cost 3,000,000 Roller Bearing Cost (three rollers) $900 per bearingOther Parts and Maintenance Cost $1,248,300 per yearBag Cost $0.28 per bagShrink Wrap Cost $0.75 per pallet
Pallet Cost $0.50 palletOn-Site Fuel Usage (loaders and fork trucks) 263 gallons/day
On-Site Fuel Cost $3.60 gallonTax Rate 36%Cost of Borrowing 8%Working Capital 3% of annual revenueUseful Life of Equipment 10.00 yearsTerm of Debt 10.00 yearsAverage Annual Inflation Rate (cost of goods and parts, and wages) 2.59% per yearFuel (pellet) Price annual escalator above baseline 1.83% per yearAnnual Plant Production (except first year) 93.00% of capacity
262,800 tonnes per year
Max Horsepower Needed ==> Annual Pellet Output 262,800 Bark handling 558.1Bark Hog 697.7Bark Burner 338.4Chip Hog 1744.2Wet chip handling 1119.8Dryer motors and ID fan 1154.7Dry chip handling 80.2Dry hammermill 1220.9Milled wood handing 261.6Pelletizers 2790.7Pellet handling and cooler 505.8Pellet conveying 191.9Bagging and wrapping system 348.8Plant air compressor 87.2
Total Horsepower 11,100 Total Connected Max HP Electricity Demand (kW) 8,277
Actual use at 60.0% of Max 4,966
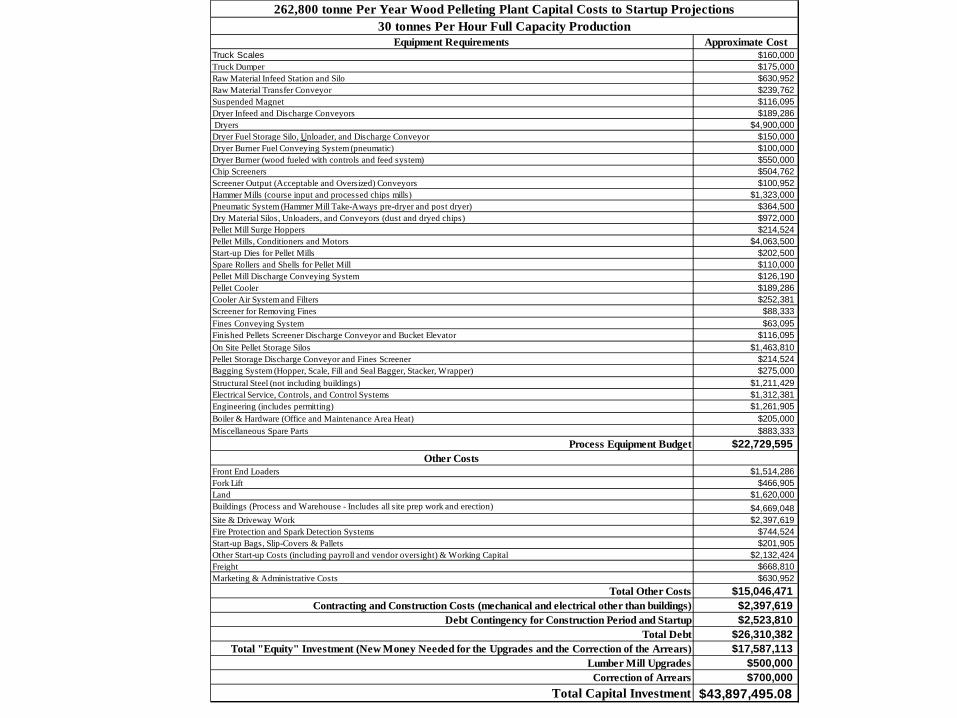
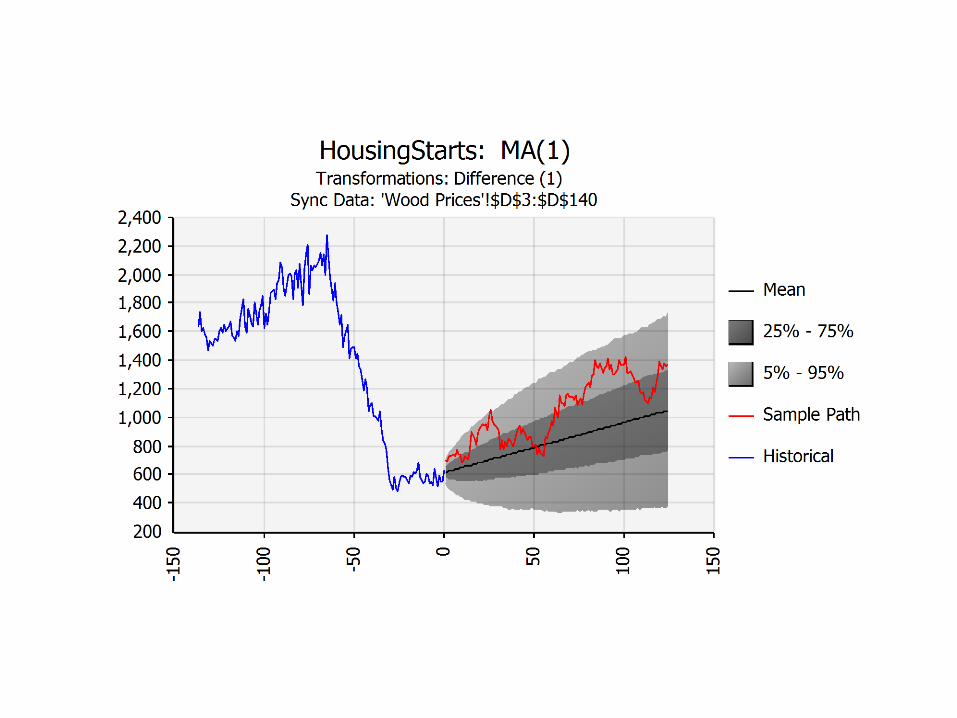
StatTools ReportAnalysis: Regression
Performed By: William StraussDate: Tuesday, October 30, 2012
Updating: StaticVariable: BiomassPrice
Multiple Regression for BiomassPrice Multiple Adjusted StErr of
Summary R R-Square Estimate
0.9165 0.8400 0.8364 2.322293456
Degrees of Sum of Mean of
ANOVA Table Freedom Squares Squares
Explained 3 3794.484586 1264.828195 234.5294 < 0.0001Unexplained 134 722.6682838 5.393046894
Standard
Regression Table Error Lower Upper
Constant 25.09939795 1.203923611 20.8480 < 0.0001 22.71824682 27.48054908NEDiesel 4.296147756 0.290656384 14.7808 < 0.0001 3.721280073 4.87101544HousingStarts -0.003418368 0.00045177 -7.5666 < 0.0001 -0.004311889 -0.002524846Precip 0.304396096 0.108743658 2.7992 0.0059 0.089320087 0.519472104
R-Square
F-Ratio p-Value
Coefficient t-Value p-ValueConfidence Interval 95%
0.0
5.0
10.0
15.0
20.0
25.0
30.0
35.0
40.0
45.0
50.0
0.0 5.0 10.0 15.0 20.0 25.0 30.0 35.0 40.0 45.0 50.0
Fit
BiomassPrice
Scatterplot of Fit vs BiomassPrice
Wood Prices


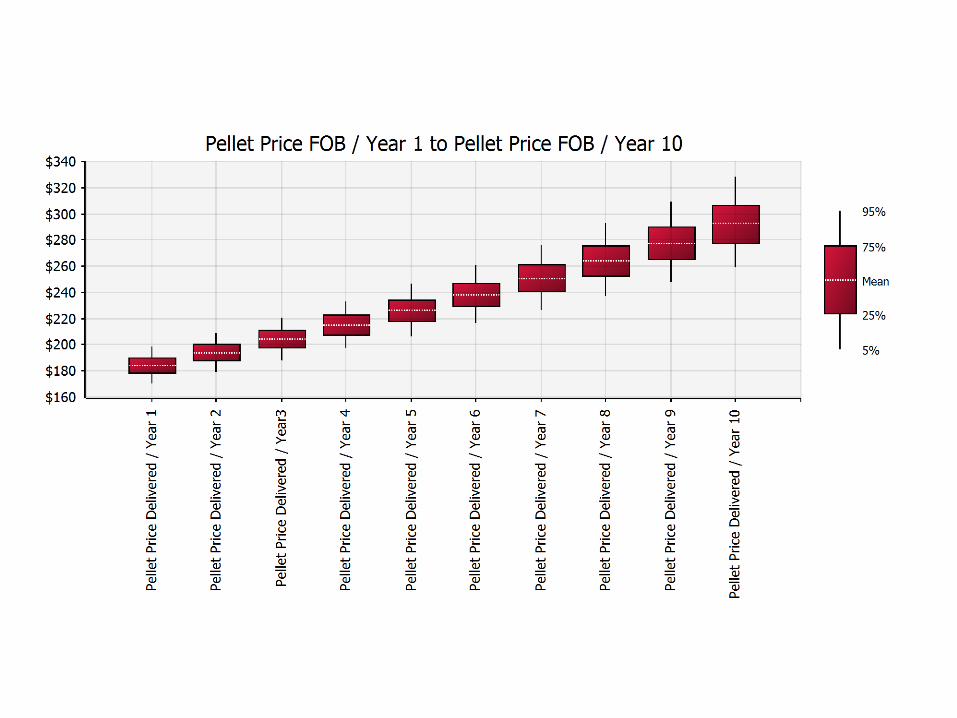

US domestic price (industrial wood pellets) $/t Location Delivery
period
Bid
Ask
Change
Portland, Maine spot 150.00 157.00 -1.50
Camden, New Jersey spot 142.00 147.00 -0.50
Wilmington, North Carolina spot 133.00 138.00 -1.00
Port Everglades, Florida spot 132.00 138.00 -0.50
Mobile, Alabama spot 125.00 132.00 -1.00
Chicago, Illinois spot 114.00 124.00 0.0
Seattle-Tacoma, Washington spot 125.00 132.00 -0.50
Actual FOB Prices October15, 2012 (from Argus Biomass Markets)


The first metric we will look at is Return on Investment (ROI)
This is the full capital cost including contingencies, working capital needs, etc, compared to the future net operating cash flows. The ROI
is the internal rate of return (IRR) from these cash flows. The mean of the simulated returns is 20.66%
The project has a 2.7% probability of returning an ROI of less than 8%. But notice the long tail to the left!

$165.00
8.0%
$140 $150 $160 $170 $180 $190 $200 $210
Sale Price of Pellets per Ton FOB
-20%
-10%
0%
10%
20%
30%
40%
50%
ROI
85.6%7.5%
3.0% 3.8%
ROI vs Sale Price of Pellets per Ton FOBOutput vs Key Input Scenarios
ROI vs Sale Price of Pellets per Ton FOB
X Mean $17
X Std Dev $8.
Y Mean 18.
Y Std Dev 6.7
Corr. (Pearson) 0.5
Corr. (Rank) 0.5

The net equity cash out is the value of the accumulated excess cash flows in year ten net of the equity investment (40% of CAPEX).
In year ten the mean value is $127 million. There is a nearly a 0%
chance it will be zero dollars or less.


0.00%
97.91
-4% -2% 0% 2% 4% 6% 8% 10%
Average Annual Inflation Rate
0
20
40
60
80
100
120
140
160
180
200
ultiple Year 5es in Millions ($)
48.4%0.0%
1.3% 50.3%
4x EBITDA Multiple Year 5 vs Average Annual Inflation RateOutput vs Key Input Scenarios
4x EBITDA Multiple Year 5 vs Average Annu
X Mean 2.8
X Std Dev 1.1
Y Mean $97
Y Std Dev $2
Corr. (Pearson) 0.6
Corr. (Rank) 0.6


5.0% 90.0% 5.0%
5.0% 95.0% 0.0%
40.0% 100.0%
30% 40% 50% 60% 70% 80% 90% 100% 110%
0.0
0.1
0.2
0.3
0.4
0.5
0.6
0.7
0.8
0.9
1.0
Market DisruptionComparison with Discrete({},{})
Market Disruption
Minimum 40.
Maximum 100
Mean 97.
Std Dev 13.
Values 500
Discrete({},{})
Minimum 40.
Maximum 100
Mean 97.
Std Dev 13.
Let’s simulate the Tilbury Effect with a discrete probability distribution.
In this case, there is a 5% chance any given year that production will be 40% of the normal output. In those years, prices will be 80% of normal.

Mean ROI goes from 20.6% to 15.09%
with a very long tail


Name Worksheet Cell Graph Min Mean Max 1% Conditional Loss @ 1% Max Loss @ 0.5%
cash at the end of Year 1 Cash Flow D25 ($5,924,961) $2,642,498 $7,226,119 ($3,920,976) ($39,210) ($29,625)
cash at the end of Year 2 Cash Flow E25 ($14,006,830) $8,922,152 $20,797,580 ($8,405,688) ($84,057) ($70,034)
cash at the end of Year 3 Cash Flow F25 ($18,721,480) $16,396,030 $37,874,960 ($3,852,410) ($38,524) ($93,607)
cash at the end of Year 4 Cash Flow G25 ($12,916,380) $25,243,980 $61,043,260 ($377,033) ($3,770) ($64,582)
cash at the end of Year 5 Cash Flow H25 ($21,127,450) $35,625,440 $87,624,130 $4,068,648 ($105,637)
cash at the end of Year 6 Cash Flow I25 ($15,457,390) $47,716,260 $121,905,700 $9,654,977 ($77,287)
cash at the end of Year 7 Cash Flow J25 ($12,348,310) $61,747,860 $163,240,300 $15,120,160 ($61,742)
cash at the end of Year 8 Cash Flow K25 ($7,381,996) $77,956,740 $212,847,200 $20,419,530 ($36,910)
cash at the end of Year 9 Cash Flow L25 ($4,213,791) $96,491,340 $271,488,300 $25,204,510 ($21,069)
cash at the end of Year 10 Cash Flow M25 ($3,071,331) $118,658,000 $341,731,700 $32,773,520 ($15,357)
($165,561) ($575,850)
What would the minimum to insure against the loss?

45,000 metric ton pellet storage dome and ship loading at the Enviva Chesapeake loading site.

Thanks
Questions?
William Strauss, PhD
FutureMetrics
www.FutureMetrics.com