Embed Size (px)
Citation preview
For Internal Use Only. (c) COSMOlogic GmbH & Co. KG 03/2014 - Page 1
Using COSMO-RS for the Prediction of Vapor-
Liquid Equilibria, Gas Solubilities and Partition
Coefficients in Polymers
Christoph Loschen*,1
, Andreas Klamt1,2
1COSMOlogic GmbH & Co. KG, Leverkusen, Germany
2Institute of Physical and Theoretical Chemistry, University of Regensburg, Germany
COSMO-RS is a thermodynamic theory for liquid phases. However, under the assumption that
polymers can be treated as solutions consisting of monomers or of oligomers with a small
number of repeat units, COSMO-RS becomes a useful tool for the prediction of thermodynamic
properties in polymers. This article summarizes some results concerning the computation of
vapor-liquid and gas-liquid equilibria (i.e. gas solubilities) in different polymers and partition
coefficients between polymer and solvent phase. Predictions for vapor-liquid equilibria and for
partition coefficients can be improved by incorporation of free volume effects. It is demonstrated
that a high predictive accuracy is obtained if the polymer is sufficiently characterized e.g. by its
density and its crystallinity. The approach is currently limited to small and medium sized solutes
and to linear, i.e. non-cross-linked polymers without any significant swelling.
1. Introduction
COSMO-RS has already been applied for polymer solvents occasionally within the recent years.
The following paragraph shortly lists some of this previous work.

For Internal Use Only. (c) COSMOlogic GmbH & Co. KG 03/2014 - Page 2
Using an early implementation of COSMO-RS Klamt carried out the prediction of the
solubilities of a set of small gases in different polymers which was later published in reference
[1]. An excellent correlation was found, however one polymer specific constant had to be
adjusted, in order to reach an overall agreement with the experiment.
Furthermore, in a cooperation between the GKSS Forschungszentrum Geesthacht and
COSMOlogic the absorption in polymer membranes was studied by experiments and
accompanying COSMOtherm calculations. The membranes under scrutiny were complex co-
polymers and partially grafted. Discrepancies between the predicted and experimental polymer
solubilities and absorption isotherms were attributed to significant swelling of the polymer
material [2].
The effect of the UNIFAC free volume in combination with COSMO-RS activity coefficients on
several polymer – solvent systems has been published by Tukur and co-workers as a conference
contribution [3]. They used the combinatorial term of Staverman-Guggenheim plus the free
volume term of Oishi and Prausnitz on top of the (residual) COSMO-RS term for their
calculations. Except for the system polystyrene-acetone, they found a good agreement between
experimental and predicted results.
Kahlen et al. have studied the solubility of cellulose in different ionic liquids using COSMO-RS.
They tried different combinatorial contributions for this system like the one of Flory-Huggins,
Staverman-Guggenheim and corresponding free volume based contributions, but did not find any
improvement of their results [4].
K.-U. Goss computed the sorption of organic chemicals into polymeric sorbents, i.e. polymer-air
and polymer-water partition coefficients for a set of 25 different polymer systems [5]. COSMO-
RS predictions were regressed against experimental data and a mean squared correlation
coefficient of R2=0.84 was obtained on all data sets, while the average regression slope of 0.88
showed slight deviation from unity.

For Internal Use Only. (c) COSMOlogic GmbH & Co. KG 03/2014 - Page 3
Recently a study was published evaluating free volume effects for polymer solutions with the
COSMO-RS implementation of COSMO-SAC, showing an overall improvement when taking
into account free volume effects [6].
This article is organized as follows: First, computational details concerning the treatment of
polymers with COSMO-RS are introduced. Then, some benchmark results on several diverse
polymers from a popular vapor-liquid equilibrium data set are presented [7]. This is followed by
a study of gas solubilities in several polymers using another extensive data compilation [8].
Finally, computations of the partition coefficients between polymer and solvent phases are
evaluated.
2. Computational Details - Description of Polymers within COSMO-RS
There are several ways to represent a polymer within COSMOtherm [12]. Only for a low degree
of polymerization it is computationally feasible to use the complete molecule, which may be
necessary, if end-groups are of importance like for small polyethyleneglycols (PEGs). Usually,
only one or several repeat units are taken into account, capped by a suitable end group, which is
then deactivated using a so-called “weight string”. The weight string consists of binary digits
which allows for selectively switching on/off certain atoms within a .cosmo file (see example
Figure 1). This figure shows two alternative representations for the PEG polymer, which have
nearly identical -profiles, and thus shows that there is some arbitrariness in the definition of the
repeat units. However, care should be taken if polar bonds are capped (Figure 1 (a) ) , in such
cases it may be necessary to use more than just a simple methyl as end group.

For Internal Use Only. (c) COSMOlogic GmbH & Co. KG 03/2014 - Page 4
(a)
w={000011111111111111111111100000}
(b)
w={00001111111111111111111110000}
(c)
Figure 1: Two alternative COSMO-RS polymer representations of polyethyleneglycol (PEG)
and the respective weight strings (a),(b) and -profiles of those representations (c).
Weight string based polymer representations can be easily constructed using the
COSMOtherm(X) graphical user-interface. Internally, the molecular weight and the COSMO
volumes are modified according to the specified weights by COSMOtherm. Usually it is

For Internal Use Only. (c) COSMOlogic GmbH & Co. KG 03/2014 - Page 5
sufficient to use trimers, i.e. three repeat units capped with a suitable functional group. Currently,
the weight string approach does not allow for taking more than one conformer into account.
Co-polymers can be obtained either by explicit construction of one single COSMO file
containing both repeat units in their respective proportion, or by using a mixture of several
separate homopolymers. The latter approach is somewhat more flexible as it allows for varying
the composition of the co-polymer.
Please note, that another approach for representing polymers is used by COSMOquick [14].
COSMOquick is able to instantaneously generate -profile from a 2D molecular topology, e.g a
SMILES string, by using a large database containing quantum-chemically pre-computed
molecules. It allows for the construction of polymers by using SMILES strings which are end-
capped by marker atoms, e.g. a halide atom. An example for polyethyleneglycol would be the
SMILES string “ICOCI” or alternatively “ICCOI”. For the construction of the so-called meta-
cosmo file (.mcos file) from the fragment database (for details see the COSMOquick user guide)
a ring closure is assumed at the position of the marker atoms and the final polymer representation
corresponds to an infinite cyclic arrangement.
Within COSMO-RS, the combinatorial (non-ideal entropic) contribution to the chemical
potential has been developed for molecules of small and moderate size. Therefore it is usually
recommended to be switched off (COSMOtherm keyword combi) as it is not well suited for
macromolecules.
Free volume effects play an important role for polymer solutions because small molecules
usually have a high amount of free volume, which is significantly reduced upon mixing with the
polymer. The free volume may be defined as the difference between the molar volume vi and the
molar hard core volume vi*. The hard core volume may be computed either from van der Waals
volumes or from COSMO volumes. Elbro and co-workers proposed a simple modification of the
excess free energy, which closely resembles the Flory-Huggins combinatorial contribution [9]:

For Internal Use Only. (c) COSMOlogic GmbH & Co. KG 03/2014 - Page 6
(1)
i
fv
ii
fvcomb
xxRTG
ln,
ifv
is the free volume fraction of compound i with mole fraction xi. Here, the mole fraction and
hard core volume vi* refer to the repeat unit of the pseudo liquid polymer.
(2)
j jjj
iiifv
ivvx
vvx*
*
This finally leads to the following additional contribution for the activity coefficient:
(3) i
fv
i
i
fv
ifv
ixx
1lnln
With xi’ now being the mole fraction with respect to the polymer chain. Thus, care should be
taken to use the right definition of the mole fraction, which may be either referring to one mole
of the repeat unit or, if the average molecular weight of the polymer is available, to one mole of
polymer. As the molecular weight of the polymer is often either not known or not well defined,
one often works with weight fraction based quantities for polymer solutions. The weight fraction
based activity coefficient can be obtained from the mole fraction based activity coefficient at
small xi according to:
(4) i
polymer
i
i
ii
M
M
w
a with
polymer
iii
M
Mxw
Technically it is necessary to have the density for each solute and the polymer available, either
experimentally or from a QSPR estimation. In the following the slightly larger COSMO volumes
have been taken as hard core volumes and molar volumes have been obtained using densities
from experiment. Interestingly, it was found that the Elbro term with Bondi van der Waals
volumes scaled by a factor of 1.2 resulted in improved results as compared to the original
volumes [10]. Furthermore, in the same study the Elbro free volume correction has been reported

For Internal Use Only. (c) COSMOlogic GmbH & Co. KG 03/2014 - Page 7
to be superior to other free volume approaches, as the one of Oishi and Prausnitz for example.
Pappa and co-workers compared the Elbro free volume correction with the combinatorial term of
Zhong and Masuoka and concluded that the first is being superior [11]. All in all, there seems to
be a consensus that among the possible entropic correction the Elbro free volume term is the
most favorable one [6][10][11]. Consequently, in this study the approach of Elbro together with
COSMO volumes was applied.
The following results have been generated with a recent COSMOtherm release[12] and the
respective COSMO-RS parameterizations BP_TZVP_C30_1401.ctd (TZVP level of theory).
Modifications due to combinatorial terms and crystallinity have been computed subsequently on
top of the COSMOtherm results. Low energy conformations of the molecular structures have
been obtained using the COSMOconf workflow.[13]
3. Prediction of Vapor-Liquid Equilibria
The vapor-liquid equilibrium data used for the evaluation has been taken from the Polymer
Solution Data Collection [7]. Here, activities of the solutes have been obtained mostly by partial
vapor pressure measurements of the mixture as compared to the pure substance vapor pressure
with small corrections made due to the non-ideal character of the vapor.
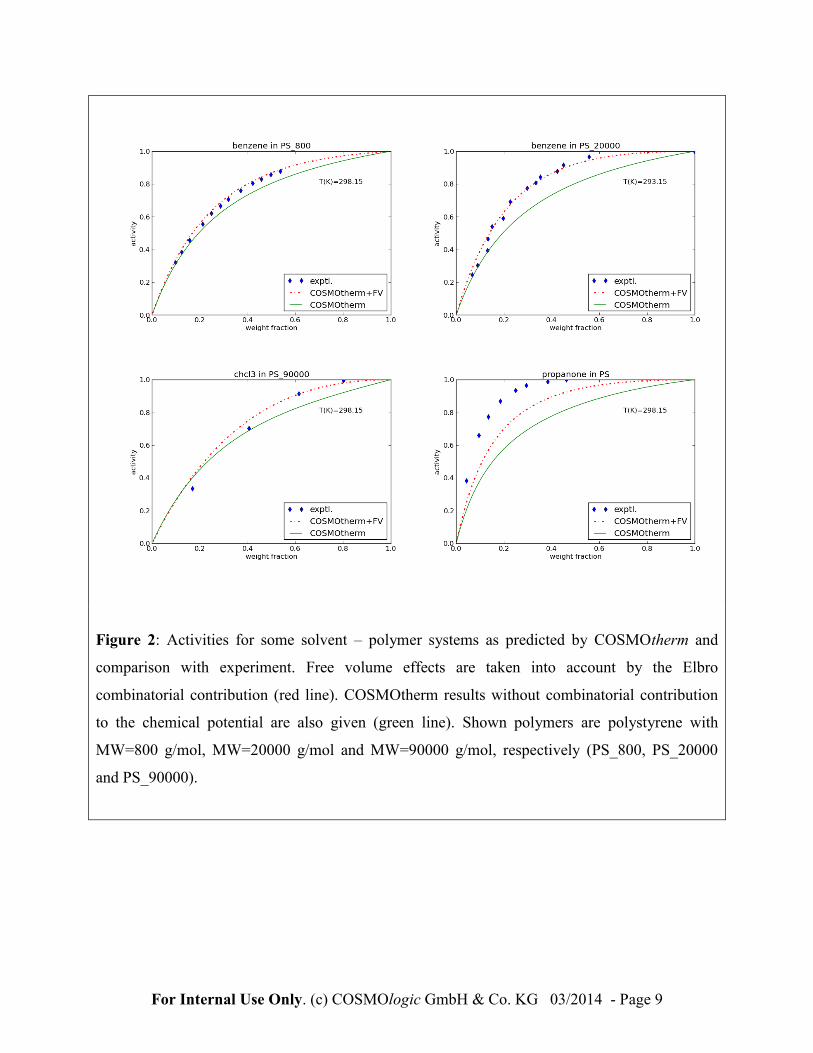
In 33 out of the 38 investigated systems an improvement of the predicted activities is obtained by
taking into account the simple free volume contribution from Elbro and co-workers (Figure 2 and
Table 1). However, there are also a few examples where the pure COSMOtherm and the free
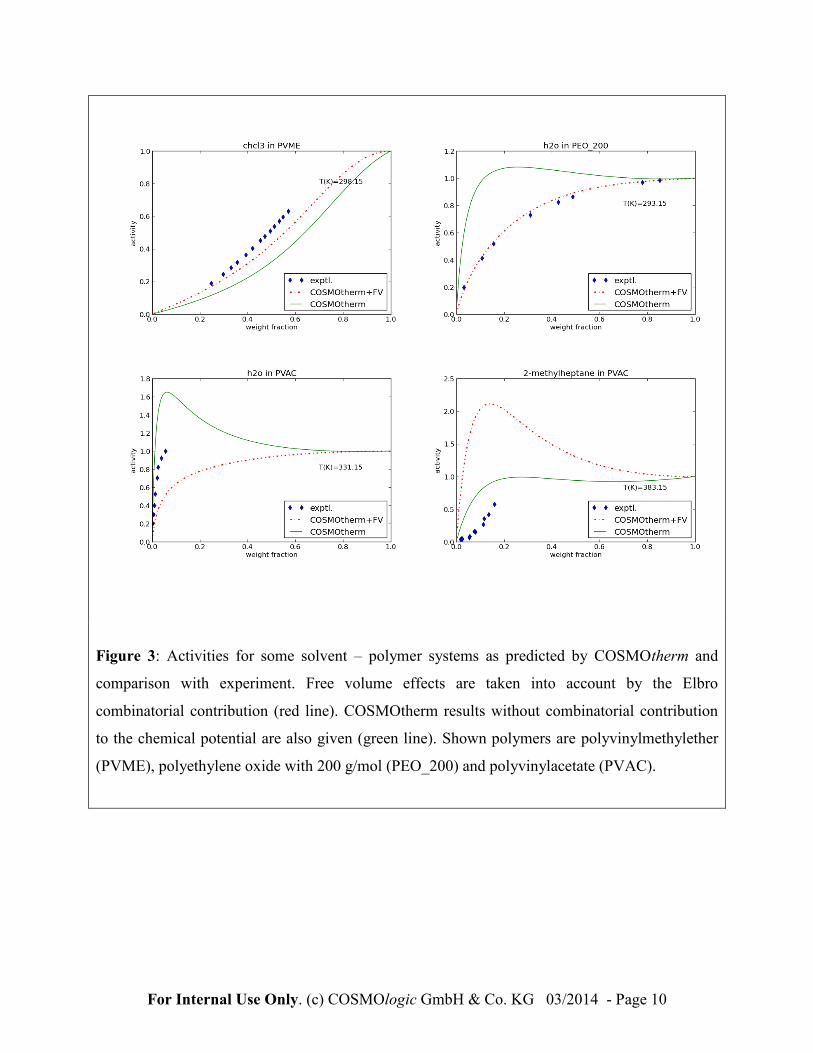
volume augmented computations deviate significantly from the experiment. The two most
extreme cases appear for polyvinylacetate (PVAC) with water and with 2-methylheptane (iso-
octane) respectively, see Figure 3. It seems that the solubility of water in PVAC is completed
overestimated for the COSMOtherm-FV calculations whereas the opposite is true for the
solubility of 2-methylheptane in PVAC. The pure COSMOtherm computations both
underestimate the solubilities. A possible explanation for a solubility overestimation for water in
PVAC could be the chosen experimental setup [15]. The polymer sample was leached in water
several weeks at elevated temperature and then dried prior to the solubility experiment. An

For Internal Use Only. (c) COSMOlogic GmbH & Co. KG 03/2014 - Page 8
incomplete drying process could have caused a limited uptake of additional water in PVAC and
thus would result in a decreased solubility. Currently we do not have a better explanation at hand
for this particular discrepancy. The case of 2-methylheptane remains particularly puzzling, as
other solutes are well described within PVAC, and also alkanes seem be behave well in other
polymers. Moreover, experimentally determined activities of alkanes in ethylacetate[16] as a
reference system for PVAC are all somewhat higher than those computed by the standard
COSMOtherm. This raises some doubts on the reliability of the experimental data of the 2-
methylheptane / PVAC system. A summary over all calculations is presented in Table 1.
For Internal Use Only. (c) COSMOlogic GmbH & Co. KG 03/2014 - Page 9
Figure 2: Activities for some solvent – polymer systems as predicted by COSMOtherm and
comparison with experiment. Free volume effects are taken into account by the Elbro
combinatorial contribution (red line). COSMOtherm results without combinatorial contribution
to the chemical potential are also given (green line). Shown polymers are polystyrene with
MW=800 g/mol, MW=20000 g/mol and MW=90000 g/mol, respectively (PS_800, PS_20000
and PS_90000).
For Internal Use Only. (c) COSMOlogic GmbH & Co. KG 03/2014 - Page 10
Figure 3: Activities for some solvent – polymer systems as predicted by COSMOtherm and
comparison with experiment. Free volume effects are taken into account by the Elbro
combinatorial contribution (red line). COSMOtherm results without combinatorial contribution
to the chemical potential are also given (green line). Shown polymers are polyvinylmethylether
(PVME), polyethylene oxide with 200 g/mol (PEO_200) and polyvinylacetate (PVAC).

For Internal Use Only. (c) COSMOlogic GmbH & Co. KG 03/2014 - Page 11
Table 1. Summary of COSMOtherm calculations on some data sets of the polymer solution data collection [7]. For the comparison between experiment
and prediction the root mean squared error (RMSE) from the solute activity is given, computed at n different weight fractions. The free volume of solvent
and solute are given in percentage relative to the molar volume. RMSE values of COSMOtherm calculations using the Elbro term (CT+FV), without
combinatorial term (CT, no comb.), with the default COSMOtherm combinatorial term (CT+comb.) and with the Flory-Huggins term are given (CT+ FH).
CT+FV CT,no comb. CT+ combinatorial CT+FH
polymer solute T(K) FV,solvent FV,solute RMSE RMSE RMSE RMSE
EVA cyclohexane 383 37.9% 29.6% 0.09 0.03 0.07 0.06
EVA 2-methylheptane 383 37.9% 29.9% 0.08 0.08 0.10 0.05
PE ch3br 273 16.3% 27.2% 0.08 0.45 0.46 0.29
PE benzene 273 16.3% 25.7% 0.16 0.47 0.47 0.29
PE hexane 273 16.3% 32.8% 0.32 0.56 0.56 0.44
PE isobutene 273 16.3% 38.5% 0.27 0.41 0.41 0.35
Nitrocellulose propanone 308 12.6% 30.1% 0.04 0.07 0.08 0.05
Nitrocellulose methylacetate 308 12.6% 26.6% 0.03 0.07 0.08 0.05
Nitrocellulose ethylacetate 293 12.6% 27.8% 0.16 0.23 0.24 0.21
PDMS butanone 303 27.7% 28.1% 0.09 0.19 0.21 0.09
PEO chcl3 298 7.4% 21.1% 0.18 0.20 0.20 0.17
PEO h2o 293 15.9% 14.5% 0.02 0.35 0.20 0.04
PIP p-xylene 298 18.2% 25.0% 0.04 0.28 0.30 0.13
PMMA toluene 322 13.8% 25.8% 0.05 0.20 0.23 0.11
PMMA butanone 322 13.8% 28.1% 0.02 0.20 0.24 0.15
PPO methanol 298 21.0% 28.0% 0.01 0.06 0.07 0.03
PPO benzene 333 21.0% 25.7% 0.05 0.14 0.16 0.01
PS propanone 298 16.9% 30.1% 0.16 0.26 0.33 0.30
PS (Mn=20000) benzene 293 16.9% 25.7% 0.03 0.11 0.15 0.09
PS (Mn=500000) benzene 293 16.9% 25.7% 0.03 0.13 0.17 0.12
PS (Mn=800) benzene 298 16.9% 25.7% 0.02 0.04 0.08 0.06
PS chcl3 298 16.9% 21.1% 0.04 0.06 0.08 0.03

For Internal Use Only. (c) COSMOlogic GmbH & Co. KG 03/2014 - Page 12
Table 1. (CONTINUED)
CT+FV CT, no comb. CT+ combinatorial CT+FH
polymer solute T(K) FV,solvent FV,solute RMSE RMSE RMSE RMSE
PVAC benzene 303 16.9% 25.7% 0.05 0.14 0.16 0.05
PVAC h2o 331 16.9% 14.5% 0.36 0.53 0.03 0.31
PVAC 2-methylheptane 383 16.9% 29.9% 1.48 0.43 0.41 0.95
PVAC propanone 303 16.9% 30.1% 0.24 0.09 0.05 0.09
PVAC propanol 303 16.9% 26.0% 0.10 0.21 0.25 0.22
PVAC benzene 335 16.9% 25.7% 0.00 0.02 0.02 0.00
PVAC vinylacetate 303 16.9% 26.4% 0.05 0.15 0.17 0.06
PVC thf 298 13.1% 26.3% 0.05 0.23 0.24 0.09
PVC toluene 316 13.1% 25.8% 0.37 0.22 0.23 0.11
PVME chcl3 298 19.2% 21.1% 0.08 0.17 0.18 0.09
PVME benzene 298 19.2% 25.7% 0.07 0.17 0.18 0.01
PVOH (Mn=14700) h2o 303 7.8% 14.5% 0.06 0.07 0.17 0.21
PVOH (Mn=67000) h2o 303 7.8% 14.5% 0.06 0.08 0.18 0.23
Polybutadiene chcl3 298 20.6% 21.1% 0.04 0.09 0.11 0.03
Polybutadiene nonane 353 20.6% 28.8% 0.14 0.38 0.38 0.22
celluloseacetate ch2cl2 298 9.1% 22.0% 0.10 0.20 0.21 0.15
average
17.1% 25.6% 0.14 0.20 0.21 0.16

For Internal Use Only. (c) COSMOlogic GmbH & Co. KG 03/2014 - Page 13
The results of Table 1 indicate that a clear improvement is obtained for polymer solutions by
consideration of a polymer specific entropy change upon mixing. As a drawback a sufficiently
accurate density of the polymer has to be specified, as well as the number average molecular
weight Mn. The free volume term is considerably sensitive to small changes in the density, which
in principle allows for example to differentiate between low density and high density
polyethylene. The Mn is less important, as typically molecular weights > 10,000 g/mol do not
influence results based on the Elbro free volume term anymore. Typical polymer molecular
weights mostly influence the ideal entropic mixture contribution RT ln(x), which becomes
almost zero except for very small solute-polymer weight fractions. Thus, using the free volume
term most often raises the chemical potential, as overall free volume is lost in the mixture as
compared to the pure solutes (see Table 1) and the RT ln(x) term becomes less negative.
4. Polymer Density Estimation
As experimental determined densities of polymers are often not available it may be advantageous
to use estimated values. Figure 4 plots the densities of polymers as obtained by the default
COSMOtherm QSPR against experimental data. Using a simple linear regression to adapt these
estimations for polymer solvents (and keeping the default QSPR for the solutes) and subsequent
computations of activities on the dataset from the previous section leads to an overall
RMSE=0.16, as compared to an RMSE=0.14 using experimental densities [17]. It was not yet
tried to improve this relation, which has been used just for the sake of simplicity, with some
additional descriptors and more data points. Concerning the outlier in Figure 4, PTFE, its density
seem to vary strongly, values from 2.2 g/cm3 (high density PTFE) to 1.55 g/cm
3 (low density) are
reported in the literature.[17] Alternatively, a few other density models are available like the
group contribution GCVOL method and the Tait equation [11]. However, as the free volume
contribution is very sensitive to small changes in the density, it is strongly recommended to use
experimental data if available.

For Internal Use Only. (c) COSMOlogic GmbH & Co. KG 03/2014 - Page 14
Figure 4: Polymer densities as predicted by the COSMOtherm QSPR model against
experimental data. An outlier is polytetrafluoroethylene (PTFE), which however according to
reference [17] has a broad range of experimental densities, between its low-density (LD-PTFE)
and high density variant (HD-PTFE).

For Internal Use Only. (c) COSMOlogic GmbH & Co. KG 03/2014 - Page 15
5. Prediction of Solubility Coefficients of Gases and Small Molecules (Gas-Liquid
Equilibria)
The solubility of gases in polymers is of interest for example for the development of polymeric
membranes, barrier polymers or for polymer gas sensors. For this study experimental gas
solubilities have been taken from the compilation of Pauly [8]. As extension to an earlier work
from one of us [1], the aim of this study was to re-examine the data set with an actual
implementation of COSMO-RS and also to include free volume effects, in order to get rid of the
polymer-specific constant that had been neccessary before. The gas solubility S is often given in
the following or related units:
(5) Units of
Pacm
STPcmS
3
3
:
i.e. the dissolved volume of gas at standard temperature and pressure (STP: 273.15K and 1.013
105 Pa) in cm
3 in volume of polymer in cm
3. Please note, that unfortunately there is a typo in the
introductory part of the Pauly data collection concerning the units of permeability which directly
translates into wrong units for the solubility (cm2 instead of cm
3 in the enumerator of S). The
solubility S as defined according to equation (5) equals the inverse of the Henry’s law constant.
Within COSMOtherm the Henry’s law constant is computed in the “COSMO-RS framework”,
i.e. a reference state corresponding to mole fractions gas per mole fractions solvent. Therefore, it
has to be converted to the right reference state (called the “molar framework” within
COSMOtherm) first, before it can be used to obtain S by simple inversion:
(6)
1000*//
/13
3
3
mollVmolgMW
cmg
x
barxH
barcm
cmS ig
solvent
solvent

For Internal Use Only. (c) COSMOlogic GmbH & Co. KG 03/2014 - Page 16
Here, solvent is the density of the polymer, MWsolvent is the molecular weight of the polymer
solvent, and H is the Henry constant in the COSMO-RS reference framework. Most of the
experimental gas solubilities of the Pauly data set have been measure indirectly, i.e. by
measuring the permeability P and the diffusivity D, according to S= P/D, which is possibly less
reliable than a direct measurement of S [18]. The Henry law constant H for compound i in
solvent S is given by (see also the COSMOtherm manual):
(7) IGi
vap
i
S
i
IG
i
Si
S pRT
H ,lnexp
Whereas is and
iIG are the chemical potential of compound i in solvent S and in the gas phase,
assuming ideal gas behavior, respectively. Furthermore, is and p
i,IGvap are the activity coefficient
of solute i in solvent S and the pure compound vapor pressure of i assuming ideal gas behavior.
In the following the experimental vapor pressures have been used, in combination with the
COSMOtherm computed activity coefficients. To estimate vapor pressures for small gases with
critical temperatures below 298K, either extrapolation via Wagner coefficients has been done, or
if those coefficients were not available, an extrapolation with COSMOtherm has been carried
out.
The results of the gas solubility predictions are summarized for 15 different polymers in Table 2
and Figure 4. Table 2 shows three different COSMOtherm runs, using no combinatorial
contribution at all, the Elbro free volume and the Flory-Huggins term. The combinatorial
contribution does not have a significant influence on the outcome, an overall squared correlation
coefficient R2 of about 0.8 and a RMSE of log10(S) of about 0.6 is obtained for any of the
approaches chosen. For the polymers HDPE, LDPE and PTFE there was initially a systematic
shift in the predicted solubilities. This shift can be explained by the fact that these polymers are
semicrystalline, i.e. containing a significant crystalline fraction, and assuming that sorption takes
place only in the amorphous and not in the crystalline region. The crystalline fraction of a
polymer can be estimated by its actual density, if the density of the crystalline and the
amorphous region are known, according to:

For Internal Use Only. (c) COSMOlogic GmbH & Co. KG 03/2014 - Page 17
(8)
..
..
amoprhcryst
amoprhcryst
Table 2. Computed gas solubilities using no combinatorial contribution (CT,no comb.), using a free
volume term (CT+FV) and the Flory-Huggins term (CT+FH) and their comparison with experiment [8].
Results for HDPE,LDPE and PTFE have been corrected assuming a crystalline fraction (see Table 3).
The number of gas solutes is given by n. RMSE and R2 are given with respect to the logarithmic
solubility log10(S), with S given in [cm3/cm
3bar].
CT,no comb. CT+FV
CT+FH
polymer n RMSE R2 RMSE R
2 RMSE R
2
Ethylcellulose 11 0.69 0.86 0.63 0.90 0.64 0.90
HDPE 10 0.67 0.59 0.68 0.59 0.68 0.60
Nitrocellulose 8 0.62 0.80 0.51 0.93 0.50 0.94
PEMA 6 0.39 0.93 0.79 0.93 0.79 0.92
Polyisopren 10 0.51 0.79 0.53 0.78 0.57 0.77
PTFE 10 1.02 0.53 1.03 0.53 1.02 0.51
PVC 7 0.69 0.76 0.90 0.78 0.89 0.78
LDPE 11 0.65 0.68 0.66 0.68 0.68 0.67
Polychloropren 6 0.56 0.79 0.43 0.92 0.40 0.93
PDMS 4 0.90 0.51 0.90 0.51 0.90 0.51
PODP 2 1.07 1.00 0.87 1.00 0.78 1.00
Polybutadiene 4 0.52 0.91 0.51 0.91 0.49 0.91
Polydimethylbutadiene 4 0.51 0.93 0.50 0.93 0.45 0.93
Polyvinylbenzoate 4 0.40 0.92 0.39 0.93 0.34 0.95
PET(40% cryst.) 4 0.39 0.82 0.37 0.84 0.29 0.91
PET(amorphous) 4 0.31 0.86 0.29 0.87 0.20 0.94
average
0.62 0.79 0.62 0.81 0.60 0.82
Table 3 shows the experimental crystalline fraction and as obtained by the systematic shifts
obtained from the COSMOtherm results. Predicted and experimental crystalline fractions agree
reasonably with the predicted fractions being somewhat overestimated. Apart from this no
corrections have been applied to the results of Table 2 and Figure 4.

For Internal Use Only. (c) COSMOlogic GmbH & Co. KG 03/2014 - Page 18
Table 3. Crystalline fractions as computed from the gas solubility S for the
semicrystalline polymers LDPE. HDPE and PTFE. Experimental values for have
been obtained using the known density, and the densities of the amorphous and the
crystalline state according to equation (8).
polymer g/cm^3] cryst. amorph. exp ,predicted
LDPE 0.91 1.00 0.85 0.47 0.63
HDPE 0.96 1.00 0.85 0.79 0.91
PTFE 2.20 2.35 2.00 0.61 0.73
Figure 5: Predicted versus experimental gas solubilities in different polymers. Results for
HDPE, LDPE and PTFE have been corrected assuming a crystalline fraction (see Table 3).
COSMOtherm results have been modified by using the free volume combinatorial contribution.
For Internal Use Only. (c) COSMOlogic GmbH & Co. KG 03/2014 - Page 19
Concerning PET, separate experimental data for the amorphous and the semicrystalline polymer
was given. Figure 5 shows that there are some outliers at either end of the solubility spectrum
due to H2 and to H2O. The strong outliers for H2 in PTFE and LDPE, which have been corrected
for semicrystallinity, could be due to the fact that hydrogen as opposite to the other larger solutes
is partially soluble also in the crystalline regions of those polymers. A possible explanation for
the overestimation of the solubility of water is the fact that the constraints resulting from the
polymer structure are suppressing the local structure formation required for the efficient
solvation of a water with its four strong interaction sites. Indeed, all polymers for which the
solubility of water is overestimated strongly have glass transition temperature above room
temperature (PEMA, PVC, PODP, Ethylcellulose). Nitrocellulose, where the overestimation is
smallest, has a glass transition below room temperature.[17]
Taking the free volume effect into account does not influence the gas solubility results
significantly. Most of the gases have a comparatively high liquid solubility within the polymers
of this study, resulting in a free volume fraction fv
i close to one. Furthermore, the computed
log(S) values have a significant contribution originating from the compound vapor pressure, i.e.
mitigating any corrections made to the liquid phase.
Please note, that using COSMOtherm derived vapor pressure instead of experimental ones gave
correlations of similar quality. However this lead to a somewhat worse RMSE, as for small gas
molecules the predicted vapor pressure data seems to be systematically high.
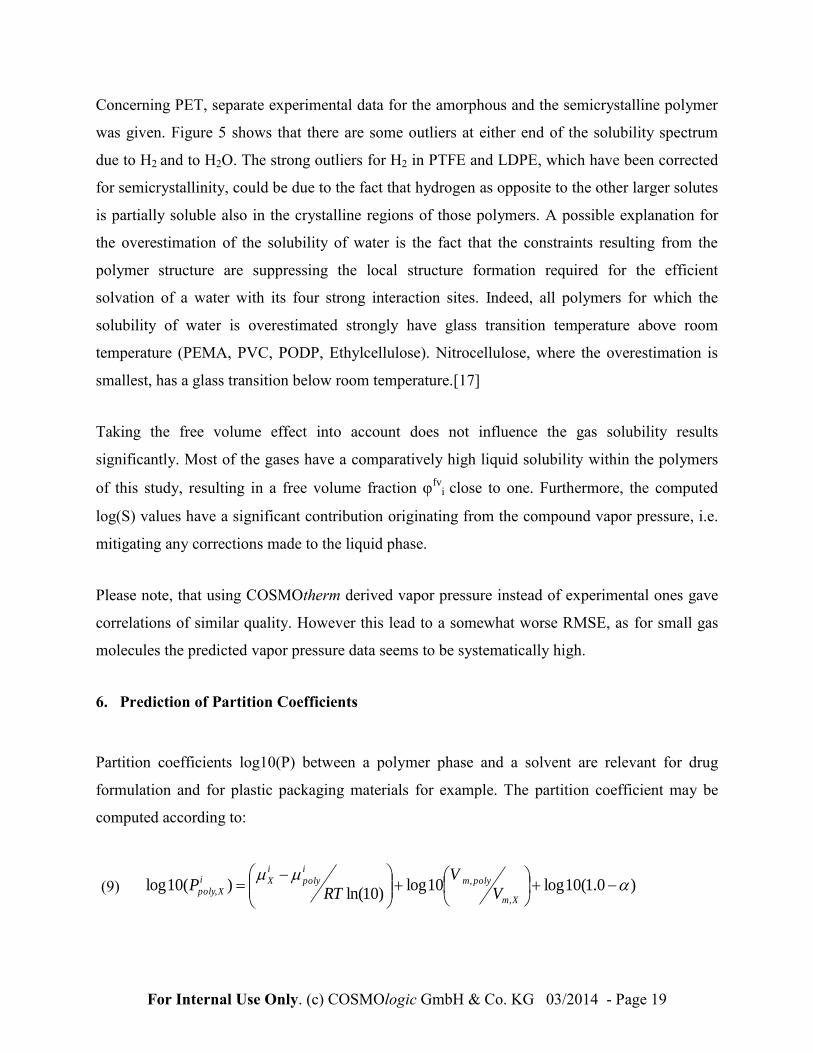
6. Prediction of Partition Coefficients
Partition coefficients log10(P) between a polymer phase and a solvent are relevant for drug
formulation and for plastic packaging materials for example. The partition coefficient may be
computed according to:
(9) )0.1(10log10log)10ln(
)(10log,
,,
Xm
polym
i
poly
i
Xi
Xpoly V
V
RTP

For Internal Use Only. (c) COSMOlogic GmbH & Co. KG 03/2014 - Page 20
Where ix and
ipoly are the pseudo chemical potentials of solute i in solvent X and in the
polymer, Vm is the molar volume and is the crystalline fraction in case the polymer is
semicrystalline.
Figure 6: Experimental versus predicted partition coefficients for some fragrances between PE
and ethanol as computed by COSMOtherm. Experimental data and UNIFAC-FV data has been
taken from Reference [19].
For Internal Use Only. (c) COSMOlogic GmbH & Co. KG 03/2014 - Page 21
Experimental and UNIFAC-FV data for polyethylene-ethanol partitioning coefficients have been
taken from Reference [19]. Taking into account the Elbro free volume term and =0.63 for
LDPE as determined from the gas solubility calculations, the COSMOtherm prediction yield
RMSE=0.34 and R2=0.80, compared to UNIFAC-FV with RMSE=0.77 and R
2=0.66, see also
Reference [19].
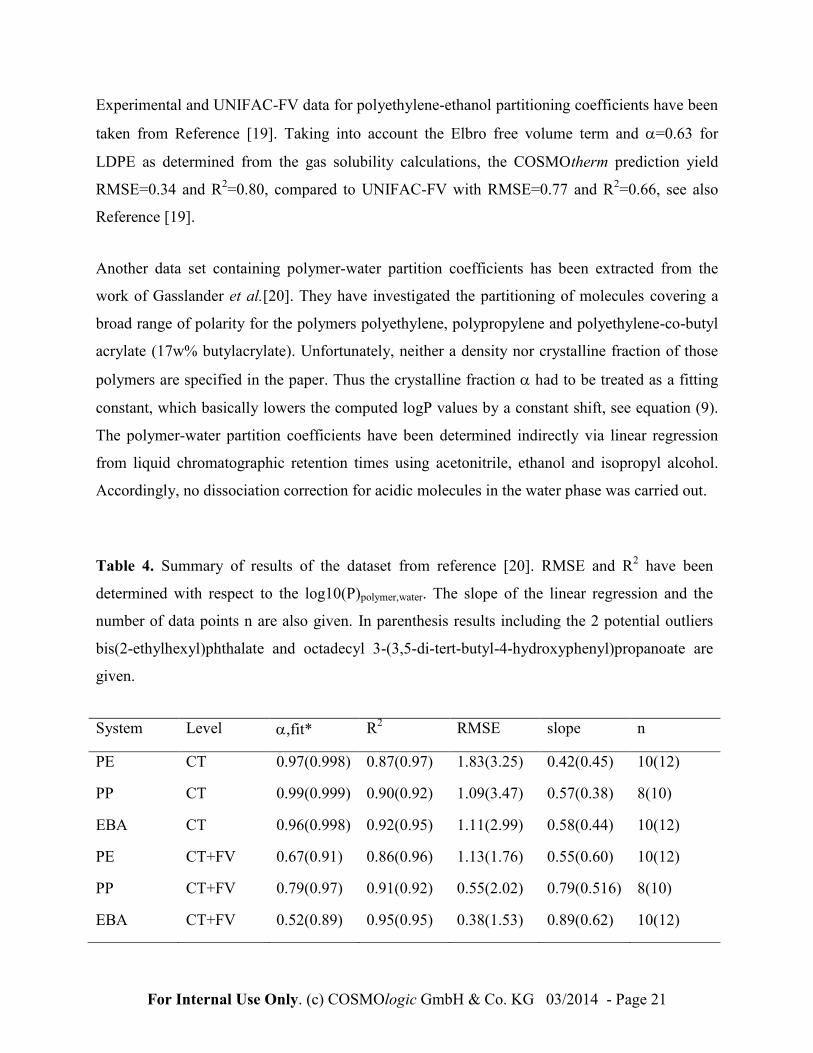
Another data set containing polymer-water partition coefficients has been extracted from the
work of Gasslander et al.[20]. They have investigated the partitioning of molecules covering a
broad range of polarity for the polymers polyethylene, polypropylene and polyethylene-co-butyl
acrylate (17w% butylacrylate). Unfortunately, neither a density nor crystalline fraction of those
polymers are specified in the paper. Thus the crystalline fraction had to be treated as a fitting
constant, which basically lowers the computed logP values by a constant shift, see equation (9).
The polymer-water partition coefficients have been determined indirectly via linear regression
from liquid chromatographic retention times using acetonitrile, ethanol and isopropyl alcohol.
Accordingly, no dissociation correction for acidic molecules in the water phase was carried out.
Table 4. Summary of results of the dataset from reference [20]. RMSE and R2 have been
determined with respect to the log10(P)polymer,water. The slope of the linear regression and the
number of data points n are also given. In parenthesis results including the 2 potential outliers
bis(2-ethylhexyl)phthalate and octadecyl 3-(3,5-di-tert-butyl-4-hydroxyphenyl)propanoate are
given.
System Level ,fit* R2 RMSE slope n
PE CT 0.97(0.998) 0.87(0.97) 1.83(3.25) 0.42(0.45) 10(12)
PP CT 0.99(0.999) 0.90(0.92) 1.09(3.47) 0.57(0.38) 8(10)
EBA CT 0.96(0.998) 0.92(0.95) 1.11(2.99) 0.58(0.44) 10(12)
PE CT+FV 0.67(0.91) 0.86(0.96) 1.13(1.76) 0.55(0.60) 10(12)
PP CT+FV 0.79(0.97) 0.91(0.92) 0.55(2.02) 0.79(0.516) 8(10)
EBA CT+FV 0.52(0.89) 0.95(0.95) 0.38(1.53) 0.89(0.62) 10(12)

For Internal Use Only. (c) COSMOlogic GmbH & Co. KG 03/2014 - Page 22
(a)
(b)
Figure 7: Experimental versus predicted partition coefficients between PE-water (a) and EBA-
water (b). Experimental data has been taken from Reference [20]. Predictions have been obtained
using the free-volume combinatorial term and a (fitted) crystalline fraction of =0.67 (PE) and
=0.52 (EBA).

For Internal Use Only. (c) COSMOlogic GmbH & Co. KG 03/2014 - Page 23
Interestingly, as summarized in table 4, the regression slope of the predictions versus the
experimental data is for all three polymers significantly below unity. This is partially due to the
experimental data points belonging to the rather non-polar compounds, octadecyl 3-(3,5-di-tert-
butyl-4-hydroxyphenyl)propanoate and bis(2-ethylhexyl)phthalate, having very high logK
values, which are possibly out of range of what is reliably measurable. But, even excluding the
two most extreme data points (see Table 4) the regression slope remains still somewhat low.
All in all, the experimental trend is predicted quite reliably, reflected by a squared correlation
coefficient for all polymers of about 0.9, see also Figure 7. Furthermore, the results of table 4
clearly show that more consistent results are obtained if the free volume combinatorial term is
included. The crystalline fraction, which has been used as a fitting constant, corresponds roughly
to what can be expected from experience. The regression slope is somewhat higher, though still
Table 5. Computed partition coefficients using the free volume combinatorial contribution for the
experimental dataset from reference [20].
Log K,PE-water logK, PP-water logK, EBA-water
solute exp CT+FV exp CT+FV exp CT+FV
4-hydroxybenzoic acid -0.8 -3.6 - -0.4 -0.4 -0.6
methyl-4-hydroxybenzoate -0.7 -1.4 - -1.5 0.4 0.3
4-methylbenzyl alcohol -0.7 0.0 -0.6 -0.1 0.3 0.5
2-methylbenzoic acid -0.1 -0.3 0.4 -0.4 0.8 0.8
propyl-4-hydroxybenzoate 0.1 -0.5 0.1 -0.5 1.4 1.1
diethyl phthalate 0.8 1.7 1.0 1.6 1.6 1.8
toluene 1.6 1.9 2.1 1.8 2.5 1.9
3,5-di-tert-butyl-4-
hydroxyphenyl propanoicacid 1.5 2.0 2.2 1.9 2.7 3.3
2,4-di-tert-butylphenol 2.5 3.0 2.6 2.8 3.8 3.4
2,6-di-tert-butyl-4-methylphenol 3.3 4.8 3.9 4.6 4.3 4.9
bis(2-ethylhexyl)phthalate 5.3 7.0 4.5 6.9 4.7 7.1
octadecyl 3-(3,5-di-tert-butyl-4-
hydroxyphenyl)propanoate 8.2 13.3 6.8 13.2 8.4 13.5

For Internal Use Only. (c) COSMOlogic GmbH & Co. KG 03/2014 - Page 24
not unity, leading to a better coincidence with the experimental data and consequently a lower
root mean squared error (RMSE).
7. Conclusion & Outlook
In summary, it is feasible to make quantitative predictions using COSMO-RS theory for
vapor/gas-liquid data and partition coefficients on systems containing polymers. In many cases
consideration of free volume effects seems to improve the results as compared to the simple
omission of the combinatorial term. However, this requires some additional information to be
taken into account, i.e. the density of polymer and solute, the molecular weight and the
crystallinity of the polymer. For the examined data it was sufficient to estimate the free volume
simply based on the computed COSMO volumes. Sometimes, the study of polymer systems is
hampered by the fact that experimental conditions are not specified with sufficient accuracy.
Then, those missing parameters have to be fitted using the remaining experimental information.
Most of the investigated polymer systems were of a rather simple chemical structure,
furthermore, crosslinking and polymer swelling effects were not examined so far. It remains to
be shown whether such effects, which will play an important role in many practical applications,
can be incorporated into COSMO-RS calculations.
Furthermore, the solubility prediction for larger, e.g. drug-like, solutes is not yet addressed here.
Since having extremely long equilibration times in polymers, the experimental solubility data for
such systems are often quite questionable.
References
[1] Klamt A., COSMO-RS: From Quantum Chemistry to Fluid Phase Thermodynamics and Drug
Design, Elsevier Science Ltd., Amsterdam, The Netherlands, 2005.
[2] Diedenhofen M., COSMOlogic, Internal Research Report, 2003.
[3] http://www.nt.ntnu.no/users/skoge/prost/proceedings/aiche-2005/non-
topical/Non%20topical/papers/276e.pdf, accessed 27th of February 2014
[4] Kahlen, J.; Masuch, K. & Leonhard, K. Green Chem. 2010, 12, 2172-2181.
[5] Goss, K.-U. Anal Chem 2011, 83, 5304-5308.
For Internal Use Only. (c) COSMOlogic GmbH & Co. KG 03/2014 - Page 25
[6] Kuo, Y.-C.; Hsu, C.-C. & Lin, S.-T. Industrial & Engineering Chemistry Research 2013, 52,
13505-13515.
[7] Hao, W.; Elbro, H. S.; Alessi, P. Polymer Solution Data Collection; DECHEMA: Frankfurt,
Germany, 1992.
[8] Pauly, S., Polymer Handbook, p. 543: Permeability and Diffusion Data, Wiley 2005.
[9] Elbro, H. S.; Fredenslund, A. & Rasmussen, P. Macromolecules 1990, 23, 4707-4714.
[10] Kouskoumvekaki, I. A.; Michelsen, M. L. & Kontogeorgis, G. M. Fluid Phase Equilibria 2002,
202, 325 - 335.
[11] Pappa, G. D.; Voutsas, E. C. & Tassios, D. P. Ind. Eng. Chem. Res. 1999, 38, 4975-4984.
[12] Eckert, F.; Pohler, L., Klamt, A. COSMOtherm, Version C3.0-Revision 14.01; COSMOlogic
GmbH&Co.KG, Leverkusen, Germany, 2013; see also URL:http://www.cosmologic.de.
[13] Diedenhofen, M., Klamt A., COSMOconf, Version 3.0, COSMOlogic GmbH&Co.KG,
Leverkusen, Germany, 2013.
[14] C. Loschen, A. Hellweg and A. Klamt, COSMOquick, Version 1.2; COSMOlogic GmbH &
Co. KG, Leverkusen, Germany, 2013.
[15] Thompson, L. J. & Long, F. A. J. Am. Chem. Soc. 1954, 76, 5886-5887.
[16] Lazzaroni, M. J.; Bush, D.; Eckert, C. A.; Frank, T. C.; Gupta, S. & Olson, J. D. Ind. Eng.
Chem. Res. 2005, 44, 4075-4083.
[17] PolyInfo Database, www. http://polymer.nims.go.jp/index_en.html, accessed 27th of February
2014.
[18] Bokarev, A. & Bondar, V. J. Phys. Chem. Ref. Data 1999, 28, 1255.
[19] Piringer, O.-G. & Baner, A. (Eds.), Plastic packaging materials for food, Wiley VCH, 2000.
[20] Gasslander, U.; Arbin, A. & Albertsson, A.-C. Polymer 2007, 48, 7523 – 7530
[21] Hierlemann, A.; Zellers, E. T. & Ricco, A. J. Analytical Chemistry 2001, 73, 3458-3466.