Embed Size (px)
Citation preview

RESEARCH Open Access
Using context-specific effect of miRNAs toidentify functional associations between miRNAsand gene signaturesMohammed Alshalalfa1,2*, Reda Alhajj1,3
From IEEE International Conference on Bioinformatics and Biomedicine 2012Philadelphia, PA, USA. 4-7 October 2012
Abstract
Background: MicroRNAs are a class of short regulatory RNAs that act as post-transcriptional fine-tune regulators ofa large host of genes that play key roles in many cellular processes and signaling pathways. A useful step forunderstanding their functional role is characterizing their influence on the protein context of the targets. UsingmiRNA context-specific influence as a functional signature is promising to identify functional associations betweenmiRNAs and other gene signatures, and thus advance our understanding of miRNA mode of action.
Results: In the current study we utilized the power of regularized regression models to construct functional associationsbetween gene signatures. Genes that are influenced by miRNAs directly(computational miRNA target prediction) orindirectly (protein partners of direct targets) are defined as functional miRNA gene signature. The combined direct andindirect miRNA influence is defined as context-specific effects of miRNAs, and is used to identify regulatory effects ofmiRNAs on curated gene signatures. Elastic-net regression was used to build functional associations between context-specific effect of miRNAs and other gene signatures (disease, pathway signatures) by identifying miRNAs whose targetsare enriched in gene lists. As a proof of concept, elastic-net regression was applied on lists of genes downregulatedupon pre-miRNA transfection, and successfully identified the treated miRNA. This model was then extended to constructfunctional relationships between miRNAs and disease and pathway gene lists. Integrating context-specific effects ofmiRNAs on a protein network reveals more significant miRNA enrichment in prostate gene signatures compared tomiRNA direct targets. The model identified novel list of miRNAs that are associated with prostate clinical variables.
Conclusions: Elastic-net regression is used as a model to construct functional associations between miRNAsignatures and other gene signatures. Defining miRNA context-specific functional gene signature by integrating thedownstream effect of miRNAs demonstrates better performance compared to the miRNA signature alone (directtargets). miRNA functional signatures can greatly facilitate miRNA research to uncover new functional associationsbetween miRNAs and diseases, drugs or pathways.
BackgroundMicroRNA(miRNA)-mediated regulation constitutes anew dimension of gene expression regulation research[1-3]. MiRNA are short (18-24) nt non-coding RNA classthat has played a critical regulatory role to fine-tune geneexpression in wide range of biological processes. Since
their discovery [4], they emerged as a significant regulatorylayer of gene regulation at the post-transcriptional level.MiRNAs bind to the 3’UTR of genes and cause destabili-zation or translational repression of target mRNAs in amechanism that is not fully understood. More than 50% ofthe human protein-coding genes are regulated by miRNAs[5]; each miRNA targets hundreds of genes which makesthem critical molecules that deserve considerable amountof research. Several biological processes ranging from celldifferentiation to metabolism are regulated by miRNA [3].
* Correspondence: [email protected] of Computer Science, University of Calgary, Calgary, Alberta,CanadaFull list of author information is available at the end of the article
Alshalalfa and Alhajj BMC Bioinformatics 2013, 14(Suppl 12):S1http://www.biomedcentral.com/1471-2105/14/S12/S1
© 2013 Alshalalfa and Alhajj; licensee BioMed Central Ltd. This is an open access article distributed under the terms of the CreativeCommons Attribution License (http://creativecommons.org/licenses/by/2.0), which permits unrestricted use, distribution, andreproduction in any medium, provided the original work is properly cited.

Additionally, a growing list of diseases [6,7], like cancer,biological pathways, molecular concepts, are associatedwith miRNAs. For example, miRNA-1, miRNA-16,miRNA-143, and many others are very important miRNAsthat have significant impact on prostate cancer develop-ment [8-10].The current major challenge in miRNA research is char-
acterizing miRNA mode of action and determining thepathways and diseases they are involved in. Determiningthe role of individual miRNAs in cellular regulatory pro-cesses is still a major challenge. The function of manymiRNAs remains unknown, and even for relatively wellstudied miRNAs, only a handful of their targets have beencharacterized [11,12]. Characterizing the functions ofmiRNA targets reveals higher level of understanding ofthe miRNA function. Thus one of the key steps in geno-mic studies is to infer miRNAs that target the genes ofinterest. Identifying and characterizing reference biologicalconcepts, for example miRNA targets, overrepresented ina list of genes that results from biological experiments is apowerful methodology to characterize the function hiddenin the gene list. This area of research which is also knownas gene enrichment analysis has gained a considerablebody of research. Several tools, such as DAVID [13] andGeneMANIA [14] that employ the available gene annota-tions have been developed to identify the enriched geneannotations (GO, pathways) in a list of genes of particularinterest, Geneset2miRNA [15] and Expression2kinases[16] are used to discover enriched miRNAs in gene sets. Acomprehensive comparison among 68 enrichment tools[17] identified three major trends in enrichment analysis;namely, Gene Set Enrichment Analysis(GSEA) [18], OverRepresentation Analysis(ORA) and Modular EnrichmentAnalysis(MEA). Most of the 68 tools belong to the secondgroup as they use statistical tests like fisher and hypergeo-metric tests to assess the overrepresentation of particularterm. Though these tools are well established as standardtools for enrichment analysis, we find these tools lackmodular concept of gene lists. Integrating the interactionsbetween gene sets to assess the overrepresentation is apromising direction to follow to gain system level under-standing of gene enrichment analysis.Since the cell is a complex system of interacting genes,
proteins, miRNA and other macromolecules, incorporatingbiological networks is valuable modeling structure to definenetwork-based functional similarity measures betweengenes signatures Constructing functional associationsbetween gene sets (signatures) helps to reveal the underly-ing biological mechanism linking the gene sets. Buildingfunctional associations between diseases and pathwaysuncovers the dysregulated pathways in complex diseaseslike cancer. Taking this into consideration, inferring themiRNA function from the downstream or upstream bio-logical context is effective and has revealed novel miRNA
functions. Integrating the protein context of miRNAtargets is a promising dimension for miRNA function pre-diction and for linking miRNAs to pathways and diseases.Protein-network based functional enrichment analysis is anew trend in enrichment analysis. Several studies startedincorporating the network topology of the gene sets[19-22]. One way to incorporate network in enrichment isto extend the gene sets by incorporating the protein neigh-bors of the genes sets and then apply standard enrichmenttests like Fisher’s and hypergeometric tests [19]. Anothertrack is to assess the connectedness of the overlappedgenes; more interconnected gene sets indicate more func-tional association [21].In the past few years, the functional association
between miRNAs and protein interactions gained a sig-nificant body of attention. Here we use the term context-specific miRNA effect to represent the effect of miRNAthe partners of the miRNA targets in the protein net-work. Though miRNAs target a wide range of genes thatplay role in most of the biological processes, analyzingthe characteristics of the targets in protein networksshowed that there is a significant correlation between theprotein degree in protein networks and the number oftargeting miRNAs, highly connected proteins are con-trolled by larger number of miRNAs [23]. This functionalproperty between topological features of biological net-works has been employed to reduce noise in discoveringmiRNA-mRNA interactions [24]. Single miRNAs andmiRNA custers showed to target multiple protein mem-bers of single protein complexes [25]. For example,SMAD3-SMAD4-FOXO3 complex is enriched with miR-1284 targets, and MAD1-SIN3A-HDAC2 complex isenriched with targets of the miR-510-514 and miR-1912-1264 clusters. Other studies demonstrated that the tar-gets of miRNAs are modular; the targets of particularmiRNA are interacting in protein networks, thus consid-ering the miRNA context-specific effect provides higherlevel of understanding of miRNA function when com-pared to employing only direct targets of miRNAs [23].Previously [26], we showed that using the indirect targetsof miRNA to represent the miRNA gene signature iseffective to reveal the treating miRNAs from a set ofdownregulated genes upon pre-miRNA treatment. Theprevious study showed a proof of concept that integratingprotein networks to form context-specific miRNA effectis informative to identify miRNA mode of action. Ourprevious analysis suggests that integrating functional pro-tein networks to functionally characterize miRNA func-tion helps researchers to gain system-level understandingof the gene list of interest. To the best of our knowledge,no protein network-based method has been developedparticularly for miRNA enrichment analysis.The goal of this work is use interactions among pro-
tein when assessing the overrepresentation of miRNA
Alshalalfa and Alhajj BMC Bioinformatics 2013, 14(Suppl 12):S1http://www.biomedcentral.com/1471-2105/14/S12/S1
Page 2 of 13

targets in a set of genes. This would lead us to buildfunctional associations between gene sets, for example,miRNA targets and disease signatures. For this purposewe used regularized regression model to predict influ-ence coefficient of miRNAs on disease signatures. Theresulted coefficients are used to reveal miRNA enrich-ment in the gene set. This approach is applied touncover functional associations between miRNAs, dis-ease and pathways. This work will advance our under-standing of the mode of action of miRNAs and theirinfluence on the context of the targets. This model canbe applied to associate gene signatures in general. Inthis work we only focused on miRNA gene signatures.
Materials and methodsBiological interactionsFor the course of this study we used two sets ofmiRNA-target interactions. The firs is computationallypredicted miRNA targets downloaded from TargetScan[27] [PredNet], and the second is experimentally vali-dated miRNAs and their targets that were extractedfrom two public databases mirTarbase [28] and miRe-cord [29]. The union of mirTarbase and miRecord wasused as a source of experimentally validated miRNA-tar-get interactions [ExpNet]. For protein networks, we usedundirected functional protein interactions from Reac-tome database [30]. The protein networks are used inconjugation with the miRNA target networks to find thepartners of each miRNA targets.
Defining context-specific effect of miRNA signatureIn this section we first explain how the context-specificeffect of miRNAs is constructed from miRNA-targetsnetworks and protein networks. miRNA(miR) binds to amRNA(m) directly by binding to the miRNA responseelement (MRE) in the 3’UTR or indirectly by influencinga PPIN neighbor of the direct targets. The directmiRNA-target interactions are used from PredNet, andthe indirect interactions, which we will refer to in thiswork as miRNA context-specific effect, is built by inte-grating miRNA-targets with PPIN. The constructedmiRNA context-specific effect (miRNet) was constructedas described in our previous work [26].
Model performance assessmentIn this work we hypothesize that given a gene signature(list of gene of particular interest), we can predict theenriched miRNAs in the gene signature using the pro-posed miRNet miRNA-target interactions. First, we usedseven gene sets that were retrieved from public data setswith known enriched miRNA. This list of genes are genesthat are downregulated upon miRNA transfection to HeLaand LNCaP cell and are used to demonstrate a proof-of-concept of the proposed model. The lists are described in
Table 1. A prostate cancer signature is identified fromMSKCC Prostate cancer cohort(GSE21032); 480 geneswere identified as down regulated in prostate cancer com-pared to normal samples, and 51 as upregulated usingSignificant Analysis of Microarays(SAM) [31].
Predicting miRNA influence coefficient using regularizedregression to build functional associationIn this section we explain how we used regularized regres-sion model to find miRNAs enriched in gene lists. Themodel takes two inputs; miRNA-target(gene) interactionsand a gene list. We used PredNet and miRNet separatelyto determine the initial variables (miRNAs) in the regres-sion model; each variable represents the influence of amiRNA on all targets in miRNA-target interactions. Weused the genes downregulated upon miRNA treatment asresponse variable (GeneSignature) in the regression model.The regularized regression model predicts non-redundantmiRNAs that influence the genes in the gene list. miRNAswith high coefficient indicates that the miRNA highlyaffect the genes in the gene list directly or indirectlydepending on the miRNA-target interaction used. Tosummarize the regularized regression model, let us assumethat GeneSignature represents the list of genes of interest,miRNetj is the targets of miRNA (j), and bj is the predictedinfluence coefficient miRNA (j) on the gene signature. Thepredicted bj values are then used to assess the associationbetween miRNAs and gene signatures.The regularized regression model is described as pre-
viously discussed [26]:
GeneSignature =miR∑
j=1
miRNetj ∗ βj + λPα(β) (1)
where
Pα(β) =miR∑
j=2
[12
(1 − α)β2j + α|βj|] (2)
is the elastic-net penalty. a is a value that ranges from0 to 1 that penalize correlated variables. When a =1,the model is called Lasso regression, and when a =0,the model is called ridge regression. Optimizing a is cri-tical step to obtain good solution with non-spars regres-sion coefficient values(b). Another factor that isimportant to optimize is l that is critical to shape thesparsity of the solution. Depending on the purpose ofthe experiment, if there is a large number of variablesthat need to be reduced (forcing b to 0), then l shouldbe set to a high value.One of the contributions of this study is to assess the
benefit of using the context-specific effect of miRNA forbetter miRNA functional characterization. We used miR-Net that includes the context-specific effect of miRNAs
Alshalalfa and Alhajj BMC Bioinformatics 2013, 14(Suppl 12):S1http://www.biomedcentral.com/1471-2105/14/S12/S1
Page 3 of 13

as the miRNA signature to predict miRNAs enriched ingene signatures from disease and pathway related genes.We can rewrite the model as:
GeneSignature =miR∑
j=1
βj ∗ miRNetj + λPα(β) (3)
where miRNetj is the targets of miRNAj in the con-text-specific miRNA-target interaction. In this model, bis the predicted influence coefficient of miRNAs thatrepresent the enrichment of each miRNA targets in thegene signature. Figure 1 gives an overall description ofthe major components of the model.
Context-specific miRNA effect to find functionalassociations between miRNAs, diseases and pathwaysTo further validate the applicability of the proposedmethod to characterize the mode of action of miRNAs,we used curated genes sets from disease and pathway sig-natures. To build functional association between miR-NAs and diseases, and miRNAs and pathways, weextracted disease gene signatures from microarray datarelated 13 cancers from Gene Expression Omnibus. 450expression profiles including control and disease sampleswere extracted to define a gene signature for each dis-ease. All microarray experiments were conducted usingGPL96 platform to avoid possible platform bias. In addi-tion to avoid any possible bias that might result from thenormalization algorithms, we manually extracted raw
data and normalized them using the RMA normalizationalgorithm [32] implemented in bioconductor. We usedSignificant Analysis of Microarray (SAM)in order toobtain gene signatures for each disease. For each disease,we only considered the top 200 differentially expressedgenes (top upregulated 100 and top downregulated 100)in each experiment. In total, 1942 genes were associatedwith the 13 cancers. The predicted disease-miRNA inter-actions of the regression model were validated against agold standard disease miRNA associations manuallyextracted from miR2disease [33] and HMDD [34] data-bases. The gold standard network contains 743 interac-tions between the 13 cancers and 305 miRNAs. AreaUnder Curve (AUC) is used to assess the performance ofthe proposed model and compare it with the otherresults. On the other hand, to build functional associa-tions between miRNAs and pathways, we used curatedpathways from the Molecular Signatures Database(MSigDB) gene sets [18] that contains 1452 canonicalpathway gene sets. We removed all pathways that haveless than 10 genes and we ended up with 788 pathways.The goal is to find how the miRNA context-specificeffect can explain the pathway or disease genes.
ResultsParameter optimizationIn the proposed model, two parameters(l and a) thatdetermines sparsity of the solution need to be optimized.As both parameters increase, the number of nonzero
Table 1 Summary of gene lists used in this study to validate the performance of the proposed method in comparisonwith existing algorithms
Experiment description EnrichedmiRNAs
Number of reported genes Reference
HeLa cells transfected with miR-1 miR-1 96 repressed genes [35]
HeLa cells transfected with miR-124 miR-124 174 repressed genes [35]
HeLa cells transfected with miR-373 miR-373 65 repressed genes [35]
LNCaP cells treatedwith pre-miR-1 miR-1 88 repressed genes and 80upregulated genes
[36]
LNCaP cells treatedwith pre-miR-206 miR-206 83 repressed genes and 62upregulated genes
[36]
LNCaP cells treatedwith pre-miR-27b miR-27b 51 repressed genes and 157upregulated genes
[36]
LNCaP cells transfected with pre-miR-32 miR-32 67 repressed genes [37]
LNCaP cells transfected with pre-miR-148a miR-148a 79 repressed genes [37]
Genes predicted to be targets of 11prostate miRNAs extracted from PRedNet
miR(1, 204,205, 143,145,221, 222,27b, 133b,31,let-7
1854 [5,12,38]
Altered genes in prostate cancer usingTaylor data
480 downregulated in prostate and 51 upregulated in prostate 269downregulated genes in PCa samples that have BCR recurrence
[39]
Genes associated with BCR event inprostate cancer
[39]
Alshalalfa and Alhajj BMC Bioinformatics 2013, 14(Suppl 12):S1http://www.biomedcentral.com/1471-2105/14/S12/S1
Page 4 of 13

influence coefficients (b) decreases. In our previous work[26], we described how to optimize both a and l. Inbrief, we selected a=0.6 as l-min values started to getsteady as shown in Figure 2. For the selected optimal avalue, 100 values of l were evaluated to select the opti-mal one (Figure 3) that gives the minimum mean squareerror. To find regression coefficients, glmnet implemen-tation in MATLAB from http://www-stat.stanford.edu/~tibs/glmnet-matlab was used.
Regularized regression model identifies the correctmiRNA cell treatmentThe first line of validation of the effectiveness of the pro-posed model is to apply it on gene sets of known refer-ence. In this work we assessed the performance of theproposed regression method using several gene lists
reported by recently published studies that used expres-sion profiling analysis to discover genes that were down-regulated upon miRNA treatment. Full summary of thegene lists used in this study is shown in Table 1. Wecompiled the list we used in our previous work in addi-tion to a new list of signatures.To identify the influence coefficient of each miRNA on
the gene list of interest (repressed genes after miRNAtreatment in this case), the model takes the miRNet andthe gene signatures. The model output is the coefficientvalue of each miRNA in miRNet. To compare our proteinnetwork-based regularized regression model with otherORA based methods, we assessed the performance of eachmethod based on the rank of the miRNA under treatmentas specified in Table 1. For example, using the repressedgenes after treating LNCaP cells with pre-miRNA-1, all
Figure 1 An overview of constructing influential miRNA-GeneSignature interactions. A. miRNA gene signature is identified by transfectingcells with pre-miRNA and then identify gene down-regulated upon the transfection. B. Using the context-specific effects of miRNAs (genesaffected by miRNAs directly and indirectly) to build functional associations between miRNAs and GeneSignatures via elastic-net regressionmodel. This step sheds light on the functional associations between miRNA and pathways, miRNAs and diseases. It is also used as a miRNAenrichment method to identify miRNAs whose targets are enriched in gene lists. Using miRNA-gene networks and disease or pathway genenetworks, the model predicts functional interactions between diseases and miRNAs or pathways and miRNAs.
Alshalalfa and Alhajj BMC Bioinformatics 2013, 14(Suppl 12):S1http://www.biomedcentral.com/1471-2105/14/S12/S1
Page 5 of 13

the methods ranked miRNA-1 as the top miRNA. Table 2summarizes the comparison among the four methodswhich showed to rank the overexpressed miRNA first(part of this results are taken from our previous work[26]).The results from this section demonstrate the applicabil-
ity and effectiveness of the regression models that usescontext-specific effect of miRNAs. Our protein-networkbased regression model outperformed the other ORAbased methods (Expression2Kinase and GeneSet2miRNA),and regression model that does not consider proteinnetworks.
Proposed regression model is robust for gene lists withmultiple miRNAsWe next assessed the proposed model on gene sets thatare targets of multiple miRNAs. For this test we extractedthe targets of 11 prostate cancer miRNAs from PredNetperformance of the model on To further apply the pro-posed model on gene sets that are mixed of multiple
miRNA targets, we identified a set of prostate miRNAsthat showed to play a role in prostate cancer (Table 3).Only regression models were able to predict the 11 miR-NAs as the top 11 retrieved miRNAs (Table 3). This tableis adopted from our previous work [26].
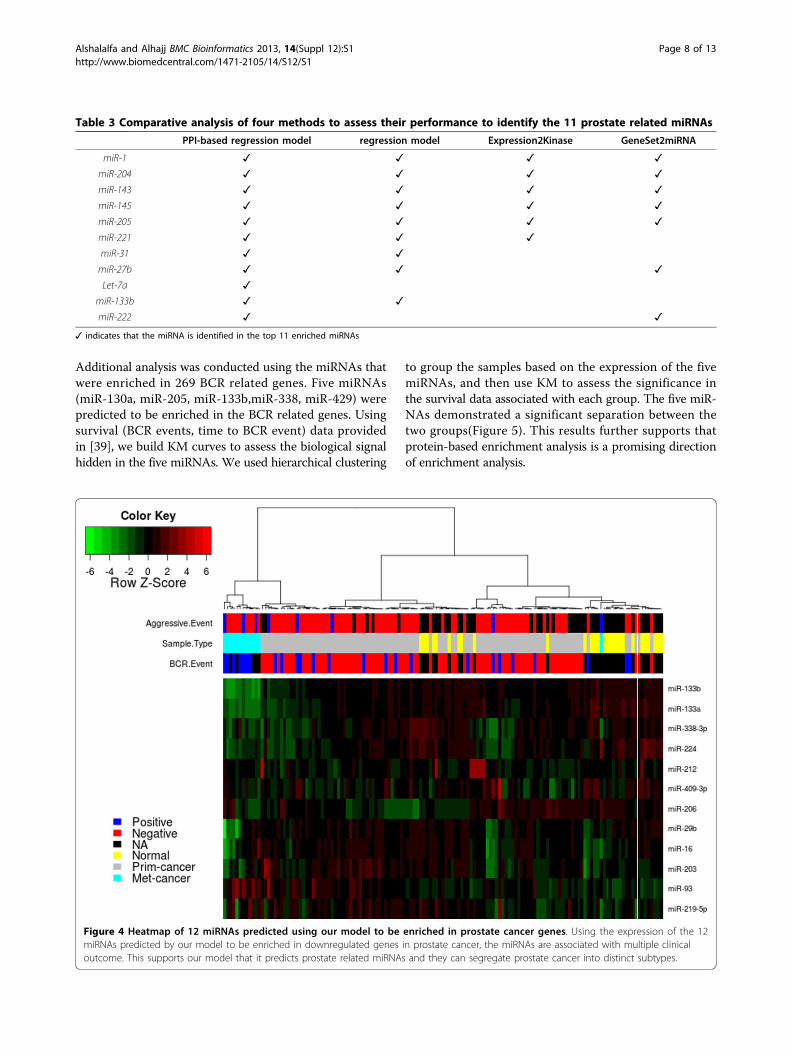
New insights into miRNA systems biology in prostatecancerThe previous analysis conducted in the previous sectionsprovides evidence to the applicability of our model toidentify functional associations between miRNAs and genelists. To take this analysis one step further, we used the480 downregulated and 51 upregulated (Table 1) genes inprostate cancer to identify miRNAs that gives us moreinsights on the dysregulated mechanisms in prostatecancer. The proposed model identified 14 miRNAs, 12 ofwhich have expression data in Taylor data(Figure 4). Theexpression of the 12 miRNAs enriched in the downregu-lated gene in prostate cancer was extracted from theTaylor data to assess the diagnostic significance in prostate
Figure 2 Optimizing alpha value with respect to min-lambda. 20 a values, ranging from 0 to 1, were initially selected to optimize a. Foreach a value, 100 values of l were evaluated. 10-fold cross validation as conducted to select l with minimum meas square error. We selecteda=0.6 as l-min values started to get steady.
Alshalalfa and Alhajj BMC Bioinformatics 2013, 14(Suppl 12):S1http://www.biomedcentral.com/1471-2105/14/S12/S1
Page 6 of 13

cancer. SVM was able to perform better using the 12 miR-NAs predicted by our model (90%) compared to miRNAsfrom Expression2Kinase(85%). The expression of the 12miRNAs is associated with cancer recurrence and otherclinical variables(Figure 4). Previous experimental workhave already shown that miR-146b and miR-206 are pros-tate cancer related miRNAs and targeting ROCK1 [40]and HDAC4 [36], respectively. Using context-specific
miRNA effect regression model, miRNA-16-1 was identi-fied as the most significant miRNA in upregulated genes,in addition to three less significant miRNAs (miR-222,miR-338 and miR-34c). Using Expression2Kinase tool,miR-16-1 did not show significant enrichment. This sup-ports our notion that integrating protein networks toassess overrepresentation of miRNAs in gene lists revealsnovel insights to diseases (prostate cancer in this work).
Figure 3 Mean Square Error vs lambda to optimize lambda value. Lambda value (l) is optimized using 10-fold cross validation. We selected100 values of l and used those that minimize the mean square error when a=0.6.
Table 2 Rank of enriched miRNAs in gene lists downregulated and differentially expressed genes after miRNAtreatment
PPI-based regression model Regression model Expression2Kinase GeneSet2miRNA
Downregulated gene set in LNCaP cells
pre-miRNA-1 1st 1st 1st 1st
pre-miRNA-206 1st 1st 1st 2nd
pre-miRNA-27b 1st 2nd 1st 1st
pre-miRNA-32 1st 3nd 5st 3st
pre-miRNA-148a 1st 1nd 3st 1st
Differentially expressed gene set in LNCaP
pre-miRNA-1 1st 2nd 1st 2nd
pre-miRNA-206 1st 1st 1st 2nd
pre-miRNA-27b 2nd 3rd 10th 15th
Downregulated gene set in HeLa cells
miRNA-1 1st 1st 1st 2nd
miRNA-124 1st 1st 2nd 2nd
miRNA-373 1st 1st 2nd 2nd
Alshalalfa and Alhajj BMC Bioinformatics 2013, 14(Suppl 12):S1http://www.biomedcentral.com/1471-2105/14/S12/S1
Page 7 of 13
Additional analysis was conducted using the miRNAs thatwere enriched in 269 BCR related genes. Five miRNAs(miR-130a, miR-205, miR-133b,miR-338, miR-429) werepredicted to be enriched in the BCR related genes. Usingsurvival (BCR events, time to BCR event) data providedin [39], we build KM curves to assess the biological signalhidden in the five miRNAs. We used hierarchical clustering
to group the samples based on the expression of the fivemiRNAs, and then use KM to assess the significance inthe survival data associated with each group. The five miR-NAs demonstrated a significant separation between thetwo groups(Figure 5). This results further supports thatprotein-based enrichment analysis is a promising directionof enrichment analysis.
Table 3 Comparative analysis of four methods to assess their performance to identify the 11 prostate related miRNAs
PPI-based regression model regression model Expression2Kinase GeneSet2miRNA
miR-1 ✓ ✓ ✓ ✓
miR-204 ✓ ✓ ✓ ✓
miR-143 ✓ ✓ ✓ ✓
miR-145 ✓ ✓ ✓ ✓
miR-205 ✓ ✓ ✓ ✓
miR-221 ✓ ✓ ✓
miR-31 ✓ ✓
miR-27b ✓ ✓ ✓
Let-7a ✓
miR-133b ✓ ✓
miR-222 ✓ ✓
✓ indicates that the miRNA is identified in the top 11 enriched miRNAs
Figure 4 Heatmap of 12 miRNAs predicted using our model to be enriched in prostate cancer genes. Using the expression of the 12miRNAs predicted by our model to be enriched in downregulated genes in prostate cancer, the miRNAs are associated with multiple clinicaloutcome. This supports our model that it predicts prostate related miRNAs and they can segregate prostate cancer into distinct subtypes.
Alshalalfa and Alhajj BMC Bioinformatics 2013, 14(Suppl 12):S1http://www.biomedcentral.com/1471-2105/14/S12/S1
Page 8 of 13

Reconstructing miRNA-disease and miRNA-pathwaysfunctional association using miRNA context-specific effectAfter demonstrating that elastic-net regression successfullyidentified miRNAs from downregulated gene lists post tomiRNA treatment, we applied the regression modeling toidentify miRNAs associated with diseases and pathwaysusing miRNA context-specific effect and disease and path-way signatures. We further analyzed the resulting miRNA-disease and miRNA-pathways functional associations fromthe regression model.We first constructed miRNA context-specific effect and
gene-disease network to be used as predicted andresponse variables, respectively, as input to the regressionmodel. miRNA context-specific effect was constructed byintegrating results from TargetScan and protein interac-tions. This study only focused on genes that are targetedby a miRNA and interact with proteins at the proteinlevel. We obtained 3235 genes that are targeted by 305miRNAs. For the disease gene interactions, we obtained1942 genes as disease signatures across 13 cancers. Ourmodel generated 741 interactions between the 13 cancersand 305 miRNAs. 364 interactions were common withthe gold standard, 157 were in the gold standard andmissed by our method, and 220 were identified by the
model and not in the gold standard. 37 new interactionswere predicted between miRNAs and prostate cancer.Further diagnostic and prognostic characterization of the37 prostate miRNAs were conducted. We used the 37miRNAs to evaluate their association with prostate can-cer. We extracted the miRNA expression from two pros-tate cancer data sets. The first is Taylor data [39](GSE21032) that contains the expression of the miRNAsacross 139 samples (98 primary, 12 metastatic and 29normal). We only obtained 16 miRNAs with expressiondata in the Taylor data. We first tested the ability ofthese miRNAs to predict tumor samples. We used sup-port vector machine (SVM) from the LIBSVM library(http://www.csie.ntu.edu.tw/~cjlin/libsvm/) implementedin MATLAB to assess the performance. 10-fold crossvalidation was used to avoid the overfitting problem. Theresults show that the newly predicted 16 prostate miR-NAs are diagnostically as good as the gold standard pros-tate miRNAs. The predicted prostate miRNAs were ableto classify cancer samples with 90% accuracy in Taylordata. We further conducted survival analysis to assess ifthe 16 miRNAs are associated with cancer recurrence.The results showed that both the 57 miRNAs in commonwith the gold standard and the 16 miRNAs predicted are
Figure 5 Kaplan Meier curves of two groups of patients based on BCR related miRNAs. Using the expression of the 5 miRNAs enriched inBCR related genes, hierarchical clustering was applied to identify two groups and then KM was used to associate them with survival analysis.
Alshalalfa and Alhajj BMC Bioinformatics 2013, 14(Suppl 12):S1http://www.biomedcentral.com/1471-2105/14/S12/S1
Page 9 of 13

able to significantly separate high risk from low riskpatients (p = 0.00025 and 0.007, respectively).To construct miRNA-pathway functional association,
we limited our analysis to the highly significant associa-tions (regression coefficient greater than 0.5) (Figure 6).77 interactions between 13 miRNAs and 60 pathways.Most of the miRNAs are linked to more than one path-way. miRNA-302f is highly involved in several pathwaysincluding Caspase, AR, ARF6 and development path-ways. miRNA-1 and 16 are also highly associated withseveral pathways. We compared this network with miR-Path [41], which is a tool that identifies molecular path-ways altered by miRNAs. miRPath shows that miR-1b isassociated with pentose phosphate and glutathionemetabolism pathways, unlike our method that shows itis associated with transcriptional pathways (ATF2,ARF6, DNA-PK). miRPath is unable to associate miR-16-1 to any pathway, however, our method associated
miR-16 to several pathways (HDAC, Leukemia, VEGF).This results provides new potential pathways and newmiRNA mode of actions that may help to reveal higherlevel of understanding of miRNA function.
DiscussionThe last decade witnessed a revolution and dramaticchanges in high-throughput technologies application inseveral areas in functional genomics, and are becoming astandard routine in many experimental laboratories.Most these experiments deliver a set of genes relevant tothe scientific question under investigation. For example,profiling the gene expression of prostate tumors and nor-mal tissues results in a set of differentially expressedgenes that could shed light on the dysregulated pathwaysin prostate cancer. The first line analysis of gene sets is toreveal the underlying biological knowledge of gene sets.This is accomplished by inferring overrepresentation of
Figure 6 Functional associations between miRNAs and biological pathways. Using the context-specific effects of miRNAs and theGeneSignature of pathways as input to the regression model, functional associations between miRNAs and are constructed. In this figure onlyinteractions of regression coefficient greater than 0.5 are selected.
Alshalalfa and Alhajj BMC Bioinformatics 2013, 14(Suppl 12):S1http://www.biomedcentral.com/1471-2105/14/S12/S1
Page 10 of 13

curated gene signatures in the gene set of interest. One ofthe questions asked is what are the regulatory miRNAsthat explain a particular gene set. To answer this ques-tion, several tools employing gene functional annotationshave been developed. These tools assist biologists tocharacterize the functional role of miRNAs. Most of thedeveloped methods employ statistical overrepresentationanalysis like fisher and hypergeometric test. Unfortu-nately, these methods are static as they do not considerthe systematic effect of miRNAs on the protein networks.In this work, we proposed protein network-based regu-larized regression model to predict influence coefficientof miRNAs on gene list, and thus infer enriched miRNAsin gene sets. High influence here means that the miRNAsare potential regulators for the gene list. Our proposedmodel is based on miRNA context-specific effect, amiRNA-gene interaction network that considers theindirect association between miRNAs and the targets, tobuild functional associations between miRNAs and genesignatures.The first question we asked is that, is context-specific
miRNA effect based regression models effective to inferenriched reference molecular concepts(GO terms, disease,pathway, miRNA). We chose to answer this questionmiRNA gene sets which are list of genes downregulatedupon miRNA treatment. Thus we collected several genesets that were downregulated upon pre-miRNA transfec-tion. Accurate and effective models should infer transfect-ing miRNAs from the downregulated gene set. The firstapplication of the miRNA context-specific effect is to useit as input to the elastic regression model to predict miR-NAs whose targets are enriched in gene lists. Since weknow the miRNA that the models should return, we usedthe rank of the miRNA as a performance assessment mea-sure. Models that rank the correct treatment miRNA areconsidered as effective and accurate. Based on the resultsreported in Table 2, the proposed regression modeldemonstrated a proof-of-concept. Further analyzing theresults in Table 2, the methods showed to agree on somecases(miR-1,miR-206) and disagree on others(miR-27b).Most methods prefer gene sets of large size to have goodperformance.The proposed model showed to be robust against
redundant gene sets. Analyzing the results of the fourmodels on miR-124 and miR-373 revealed that Expres-sion2Kinase and Geneset2miRNA are sensitive tomiRNA families. For example, both tools ranked miR-124 and miR-373 second after miR-506 and miR-520respectively. Looking deeper into the relationshipsbetween these miRNAs, we found that the miRNAs pre-dicted second are from the same family of the treatingmiRNA. For example, miR-1 and miR-206, miR-124 andmiR-506, and miR-373 and miR-520 are from the samefamily and target the same targets.
This is because the elastic net regularize against corre-lated variables and thus reduce redundant sets. Theseresults demonstrated the effectiveness of the context-specific miRNA effect based elnastic-net regressionmodel as enrichment analysis methodology.The next step was to apply the model on gene sets
with unknown regulatory miRNAs. The objective toidentify putative regulatory miRNAs that explains theunderlying regulatory mechanism of the gene set. Forthis test, we used prostate cancer signatures as bothmiRNA and target expression data are available, in addi-tion to survival and clinical data. Since downregulatedgenes in prostate cancer can be noisy as they may har-bour indirect targets of miRNAs and enriched with mul-tiple miRNAs as there is big body of evidence showingthat several miRNAs are dysregulated in prostate cancer.14 miRNAs were enriched in the genes downregulatedin prostate cancer and miR-16-1 was identified to beenriched in the upregulated genes in prostate cancer.The 14 miRNAs are significantly associated with clinicalvariables of prostate cancer which supports their role inprostate cancer development. Earlier experimental stu-dies [5] showed that miR-16-1 is in clinical trails as apromising prognostic biomarker. Further analysisrevealed that miR-16-1 targets BCL2, CCND1, andWNT3A genes [40] which are associated with increasedsurvival and invasion rates. Additional studies [5] sup-port significant role of miR-16-1 in slowing prostatecancer progression, suggesting that using context-speci-fic effect of miRNAs could reveals very significant con-tribution to the miRNA cancer research. Unfortunately,the expression of miR-16-1 was not available in themiRNA expression data we used and thus we wereunable to further confirm its association with clinicaloutcome.After showing that context-specific miRNA effect is
informative to be used to associate miRNAs with genesignatures, we used it to build functional associationbetween miRNAs and other curated gene sets. In thisstudy we used diseases and pathways curated gene setas response variable in our model with the aim to iden-tify the enriched miRNAs in each gene set. Using genesets of multiple diseases and pathways, we expected afunctional association between miRNAs and the othercurated sets. The resulted miRNA-disease associationsreveal new associations between miRNAs and diseases,especially prostate cancer. 16 new prostate cancer miR-NAs are diganostic and prognostic biomarkers that canbe further investigated. The results also uncovered newassociations between miRNAs and pathways. Furtherinvestigations of the miRNA pathways associations helpto explore and validate the power of the model predic-tions. Our findings here suggest that using protein-net-work based regularized regression is a new direction of
Alshalalfa and Alhajj BMC Bioinformatics 2013, 14(Suppl 12):S1http://www.biomedcentral.com/1471-2105/14/S12/S1
Page 11 of 13

miRNA enrichment analysis that could give us morefunctional insights into dysregulated pathways or dis-eases. In addition, the results indicate that miRNA con-text-specific effect allows defining new mode of actionfor miRNAs. Using these findings, functional networksassociating miRNA with diseases or pathways could beconstructed.
ConclusionUncovering miRNA mode of action is a key step to revealfunctional associations between miRNAs, diseases andpathways. A crucial task in functional genomics is tointerpret gene lists based on curated gene annotations. Inthis study we used regularized regression model that istrained on novel miRNA-gene interactions network topredict associations between miRNAs and gene sets (dis-eases, pathways). The model succeeded in the proof-of-concept experiments and showed promise to be appliedto other genes lists that harbour biological function.Using the context-specific effect of miRNAs is moreeffective than just using the direct miRNA targets to inferfunctional miRNAs from gene lists. The results gainedfrom this study provide higher level of understanding ofmiRNA function and how it acts as a key regulator mole-cule in the cellular system. This concludes that the pro-posed model gives more insight into the functional roleof miRNAs in disease development. Although limitationsexist in the current work, the uncovered interactions areimportant for understanding diseases and patternsunderlying miRNA-mediated regulations.
Competing interestsThe authors declare that they have no competing interests.
Authors’ contributionsMA designed the study and performed all the analysis. MA wrote themanuscript. RA proof-read the manuscript. All authors read and approvedthe final version.
AcknowledgementsMohammed Alshalalfa and Reda Ahajj would like to thank iCORE (AlbertaInnovates) and NSERC for funding.
DeclarationThe publication costs for this article were funded by the Open Access Fundof The University of Calgary.This article has been published as part of BMC Bioinformatics Volume 14Supplement 12, 2013: Selected articles from the IEEE InternationalConference on Bioinformatics and Biomedicine 2012: Bioinformatics. The fullcontents of the supplement are available online at http://www.biomedcentral.com/bmcbioinformatics/supplements/14/S12.
Authors’ details1Department of Computer Science, University of Calgary, Calgary, Alberta,Canada. 2Biotechnology Research Center, Palestine Polytechnic University,Hebron, Palestine. 3Computer Science Department, Global University, Beirut,Lebanon.
Published: 24 September 2013
References1. He L, Hannon G: MicroRNAs: small RNAs with a big role in gene
regulation. Nat Rev Genet 2004, 5:522-531.2. Djuranovic S, Nahvi A, Green R: A parsimonious model for gene
regulation by miRNAs. Science 2011, 331:550-553.3. Li L, Liu Y: Diverse small non-coding RNAs in RNA interference pathways.
Methods Mol Biol 2011, 764:169-182.4. Ruvkun G: Molecular biology: Glimpses of a tiny RNA world. Science 2001,
294:797-799.5. Gordanpour A, Nam RK, Sugar L, Seth A: MicroRNAs in prostate cancer:
from biomarkers to molecularly-based therapeutics. Prostate CancerProstatic Dis 2012, 15:314-319.
6. Pang Y, Young C, Yuan H: MicroRNAs and prostate cancer. Acta BiochimBiophys Sin 2010, 42:363-369.
7. Watahiki A, Wang Y, Morris J, Dennis K, ODwyer H, Gleave M, Gout P,Wang Y: MicroRNAs associated with metastatic prostate cancer. PLoS One2011, 6:e24950.
8. He L, Hannon GJ: MicroRNAs: small RNAs with a big role in generegulation. Nat Rev Genet 2004, 5:522-531.
9. Calin G, Croce C: MicroRNA signatures in human cancers. Nature ReviewsCancer 2006, 6:857-866.
10. Esquela-Kerscher A, Slack F: Oncomirs microRNAs with a role in cancer.Nature Reviews Cancer 2006, 6:259-269.
11. Trang P, Weidhaas J, Slack F: MicroRNAs as potential cancer therapeutics.Oncogene 2008, 27:S52-S57.
12. Ozen M, Creighton C, Ozdemir M, Ittmann M: Widespread deregulation ofmicroRNA expression in human prostate cancer. Oncogene 2008,27:1788-1793.
13. Huang da W, Sherman BT, Lempicki RA: Systematic and integrativeanalysis of large gene lists using DAVID bioinformatics resources. NatProtoc 2009, 4:44-57.
14. Mostafavi S, Ray D, Warde-Farley D, Grouios C, Morris Q: GeneMANIA: areal-time multiple association network integration algorithm forpredicting gene function. Genome Biology 2008, 9:S1-S4.
15. Antonov A, Dietmann S, Wong P, Lutter D, Mewes H: GeneSet2miRNA:finding the signature of cooperative miRNA activities in the gene lists.Nucleic Acids Res 2009, 37:W323-W328.
16. Chen E, Xu H, Gordonov S, Lim M, Perkins M, Ma’ayan A:Expression2Kinases: mRNA profiling linked to multiple upstreamregulatory layers. Bioinformatics 2012, 28:105-111.
17. Huang D, Sherman B, Lempicki R: Bioinformatics enrichment tools: pathstoward the comprehensive functional analysis of large gene lists. NucleicAcids Res 2009, 37:1-13.
18. Subramanian A, Tamayo P, Mootha V, Mukherjee S, Ebert B, Gillette M,Paulovich A, Pomeroy S, Golub T, Lander E, Mesirov J: Gene setenrichment analysis: A knowledge-based approach for interpretinggenome-wide expression profiles. PNAS 2005, 102:15545-15550.
19. Glaab E, Baudot A, Krasnogor N, Schneider R, Valencia A: EnrichNet:network-based gene set enrichment analysis. Bioinformatics 2012,28:451-457.
20. Stojmirovic A, Yu Y: Robust and accurate data enrichment statistics viadistribution function of sum of weights. Bioinformatics 2010, 26:2752-2759.
21. Yip A, Horvath S: Gene network interconnectedness and the generalizedtopological overlap measure. BMC Bioinformatics 2007, 8:22.
22. Poirel C, Owens C, Murali T: Network-based functional enrichment. BMCBioinformatics 2011, 12:S14.
23. Hsu C, Juan H, Huang H: Characterization of microRNA-regulated protein-protein interaction network. Proteomics 2008, 8:1975-1979.
24. Sualp M, Can T: Using network context as a filter for miRNA targetprediction. Biosystems 2011, 105:201-209.
25. Sass S, Dietmann S, Burk U, Brabletz S, Lutter D, Kowarsch A, Klaus F,Mayer K, Brabletz T, Ruepp A, Theis F, Wang Y: MicroRNAs coordinatelyregulate protein complexes. BMC Systems Biology 2011, 5:136.
26. Alshalalfa M, Alhajj R: Integrating protein networks for identifyingcooperative miRNA activity in disease gene signatures. Bioinformatics andBiomedicine (BIBM), 2012 IEEE International Conference on: 4-7 October 20122012, 1-8.
27. Grimson A, Farh K, Johnston W, Garrett-Engele P, Lim L, Bartel D: MicroRNATargeting Specificity in Mammals: Determinants beyond Seed Pairing.Molecular Cell 2007, 27:91-105.
Alshalalfa and Alhajj BMC Bioinformatics 2013, 14(Suppl 12):S1http://www.biomedcentral.com/1471-2105/14/S12/S1
Page 12 of 13

28. Hsu S, Lin F, Wu W, Liang C, Huang W, Chan W, Tsai W, Chen G, Lee C,Chiu C, Chien C, Wu M, Huang C, Tsou A, Huang H: miRTarBase: adatabase curates experimentally validated microRNA target interactions.Nucleic Acids Res 2011, 39:D163-D169.
29. Xiao F, Zuo Z, Cai G, Kang S, Gao X, Li T: miRecords: an integratedresource for microRNA target interactions. Nucleic Acids Res 2009, 37:D105-D110.
30. Wu G, Feng X, Stein L: A human functional protein interaction networkand its application to cancer data analysis. Genome Biology 2010, 11:R53.
31. Tusher V, Tibshirani R, Chu G: Significance analysis of microarrays appliedto the ionizing radiation response. Proc Natl Acad Sci 2001, 98:5116-5121.
32. Irizarry RA, Bolstad BM, Collin F, Cope LM, Hobbs B, Speed TP: Summariesof Affymetrix GeneChip probe level data. Nucleic Acids Res 2003, 31:e15.
33. Jiang Q, Wang Y, Hao Y, Juan L, Teng M, Zhang X, Li M, Wang G, Liu Y:miR2Disease: a manually curated database for microRNA deregulation inhuman disease. Nucleic Acids Res 2009, 37:D98-104.
34. Lu M, Zhang Q, Deng M, Miao J, Guo Y, Gao W, Cui Q: An analysis ofhuman microRNA and disease associations. PLoS One 2008, 3:e3420.
35. Lim L, Lau N, Garrett-Engele P, Grimson A, Schelter J, Castle J, Bartel D,Linsley P, Johnson J: Microarray analysis shows that some microRNAsdownregulate large numbers of target mRNAs. Nature 2005, 433:769-773.
36. Hudson RS, Yi M, Esposito D, Watkins SK, Hurwitz AA, Yfantis HG, Lee DH,Borin JF, Naslund MJ, Alexander RB, Dorsey TH, Stephens RM, Croce CM,Ambs S: MicroRNA-1 is a candidate tumor suppressor and prognosticmarker in human prostate cancer. Nucleic Acids Res 2012, 40:3689-3703.
37. Jalava S, Urbanucci A, Latonen L, Waltering K, Sahu B, Jnne O, Seppl J,Lhdesmki H, Tammela T, Visakorpi T: Androgen-regulated miR-32 targetsBTG2 and is overexpressed in castration-resistant prostate cancer.Oncogene 2012, 31:4460-71.
38. Porkka K, Pfeiffer M, Waltering K, Vessella R, Tammela T, Visakorpi T:MicroRNA Expression Profiling in Prostate Cancer. Cancer Research 2007,67:6130.
39. Taylor B, Schultz N, Hieronymus H, Gopalan A, Xiao Y, Carver B, Arora V,Kaushik P, Cerami E, Reva B, Antipin Y, Mitsiades N, Landers T, Dolgalev I,Major J, Wilson M, Socci N, Lash A, Heguy A, Eastham J, Scher H, Reuter V,Scardino P, Sander C, Sawyers C, Gerald W: Integrative Genomic Profilingof Human Prostate Cancer. Cancer Cell 2010, 18:11-22.
40. Saini S, Majid S, Dahiya R: Diet, microRNAs and prostate cancer. Pharm Res2010, 27:1014-1026.
41. Vlachos I, Kostoulas N, Vergoulis T, Georgakilas G, Reczko M, Maragkakis M,Paraskevopoulou M, Prionidis K, Dalamagas T, Hatzigeorgiou A: DIANAmiRPath v.2.0: investigating the combinatorial effect of microRNAs inpathways. Nucleic Acids Res 2012, 40:W498-504.
doi:10.1186/1471-2105-14-S12-S1Cite this article as: Alshalalfa and Alhajj: Using context-specific effect ofmiRNAs to identify functional associations between miRNAs and genesignatures. BMC Bioinformatics 2013 14(Suppl 12):S1.
Submit your next manuscript to BioMed Centraland take full advantage of:
• Convenient online submission
• Thorough peer review
• No space constraints or color figure charges
• Immediate publication on acceptance
• Inclusion in PubMed, CAS, Scopus and Google Scholar
• Research which is freely available for redistribution
Submit your manuscript at www.biomedcentral.com/submit
Alshalalfa and Alhajj BMC Bioinformatics 2013, 14(Suppl 12):S1http://www.biomedcentral.com/1471-2105/14/S12/S1
Page 13 of 13