Embed Size (px)
Citation preview


Executive Summary ……………………..………………………………………………………………..…….... 3
What Is Coal Gasification and Why Has It Been Promoted? ..… ……………………..………...………. 4
Southern Company/Mississippi Power’s Kemper Plant: A $7.5 Billion Failure .………….….....…...…. 7
Duke Energy’s Edwardsport Plant: Unreliable Power at Five Times Market Prices …………………. 10
Demonstration IGCC Plants Built in the U.S. During the 1990s Have Shown Similar Results …...….. 20
Conclusion ………………………………..……………………………………………………………...…….... 21

Efforts to gasify coal for power generation have been major failures, technologically
and financially.
Only two of the 25 coal-gasification electricity generating plants proposed in the U.S.
since 2000 have ever come on line: Southern Company’s Kemper plant in Mississippi
and Duke Energy’s Edwardsport plant in Indiana.
Both Kemper and Edwardsport have been economic disasters for consumers and
investors alike.
Under pressure from the Mississippi Public Service Commission for having logged billions
of dollars in cost overruns at Kemper, the Southern Company affiliate Mississippi Power
announced in July 2017 that it will halt coal burning at Kemper. Henceforth the plant will
run only on natural gas.
That leaves Edwardsport as the sole remaining plant built in the U.S. in the last decade
burning gasified coal to produce power. It is the only modern plant built around "clean
coal" gasification technology that continues to be promoted as a viable way to
generate electricity but in fact is not.
Edwardsport has been plagued by
technological problems, and four
years after opening is still not running
properly. Because of its operational
problems and its huge construction
cost overruns, Edwardsport’s
electricity is wildly expensive. Power
from the plant costs more than five
times what electricity sells for in
wholesale energy markets in Indiana.
Some in the electric utility and coal
industries continue to push for new
coal-gasification projects, even
though natural gas plants are much
less expensive to build and are more
reliable, and wind- and solar-
generated electricity is cheaper.
The technology used in coal
gasification plants—known as
Integrated Gasification Combined
Cycle (IGCC)—poses major risks to
ratepayers and investors alike as the
technology remains both unreliable
and expensive.

A number of important and painful lessons have emerged from Kemper and
Edwardsport:
• Modern IGCC plants are far more expensive to build than proponents have
been willing to publicly acknowledge.
• Such plants take much longer to construct than proponents typically assert.
• IGCC plants are very expensive to operate.
• IGCC plants have proven unreliable due to problems with modern coal-
gasification technology.
• The high costs of building and operating IGCC plants, and their unreliable
operations, mean that the technology is not an economically feasible option for
capturing and sequestering carbon dioxide emissions from coal plants.
• IGCC plants cannot compete with wholesale market power prices or with falling
prices for wind- and solar-generated electricity.
In sum, Kemper and Edwardsport prove the high cost and unreliability of IGCC
technology and serve as a stark warning against investing in such projects.
Traditional coal-fired power plants produce electricity by burning crushed coal in a
boiler to produce steam. The steam then flows into a turbine-generator to generate
electricity.
Coal gasification adds several steps to this straightforward, time-tested process. It still
uses coal as its base fuel, but converts it—typically in one or two gasifiers—to create
“syngas,” a synthetic energy product that resembles natural gas. The syngas is then
used to fuel a conventional combined cycle electricity generating power plant—a
facility using gas-fired turbines to produce electricity and that captures the excess heat
to power steam-driven turbines to produce additional electricity.
Such generating facilities are known as Integrated Gasification Combined Cycle
(IGCC) plants.
IGCCs—which are often promoted as “clean coal” plants—are purportedly designed
to reduce air pollution emissions while burning coal as the primary fuel. The origins of
these plants stem from a time in which natural gas and renewables were not as
abundant and cheap as they are today.
The concept of coal gasification is not new: Well over a century ago, coal was
commonly converted into “town gas,” a term for gaseous fuel produced from coal
before the widespread use of natural gas. Town gas was sold to municipalities and

piped to customers for light, heating and cooking. Like coal-fired electricity generation,
town gas production was a relatively simple process.
However, applying and implementing coal gasification in large electric power plants
has proven to be technologically tricky and extremely expensive.
In the first decade of this century, more than 25 utility companies in the U.S., under
pressure to reduce emissions and wanting at the time to continue to burn coal for fuel
considered building new IGCC plants. (Natural gas and renewable energy prices were
still comparatively high). In 2000, the U.S. had two small demonstration projects up and
running, but there were no IGCC plants in operation anywhere in the world that were
comparable in size to the proposed IGCC projects under consideration or that used the
new technologies that were under consideration. All these projects carried a “first
mover risk” as the first-of-their-kind commercial power plants.1
Many utilities and independent power plant developers around the U.S. (and two state
regulatory commissions) rejected IGCC projects because the technology was untested
and involved higher financial risk than conventional coal-fired power plants.
In June 2007, the Tondu Corp. in Houston announced that it was suspending plans to
build a planned 600-megawatt (MW) IGCC facility in Texas, citing high costs and other
issues related to technology and construction risks.2 Similarly, Xcel Energy announced in
October 2007 that it was deferring indefinitely its plans to build an IGCC plant in
Colorado because the development costs were higher than the utility originally
expected.3
At about the same time, the federal government pulled the plug on the marquee
FutureGen project, an undertaking in which the U.S. Department of Energy had agreed
to provide 74 percent of the funding, with private investors putting up the balance. This
was to be a test project combining IGCC technology with carbon capture and
sequestration (CCS). In early 2008, the Bush administration cancelled FutureGen, citing
cost overruns. The proposal was revived under the Obama administration with the
support of Congress. The U.S. Department of Energy cancelled it again in 2015 “in order
to best protect taxpayer interests.”4
Some state regulatory commissions also refused to make ratepayers bear the risks of
new IGCC project. In August 2007, the Minnesota Public Utilities Commission rejected a
contract under which Xcel Energy would have purchased power from a proposed
1 Duke Energy Indiana claimed during construction that the Edwardsport IGCC project merely merged two mature
technologies or represented the scaling-up of the technology used at the two existing demonstration projects in the U.S. This claim is analogous to saying that a new Boeing 747 did not represent a new airplane design in 1970 because the concepts of wind, lift and aircraft propulsion had been around since the Wright Brothers’ first biplane flew at the turn of the 20th Century.
2 http://www.reuters.com/article/companyNewsAndPR/idUSN1526955320070615 3 “Xcel Delays IGCC Power Plant.” Denver Business Journal, October 30, 2007,
https://www.bizjournals.com/denver/stories/2007/10/29/daily26.html 4 http://www.chicagobusiness.com/article/20150203/NEWS11/150209921/futuregen-clean-coal-plant-is-dead
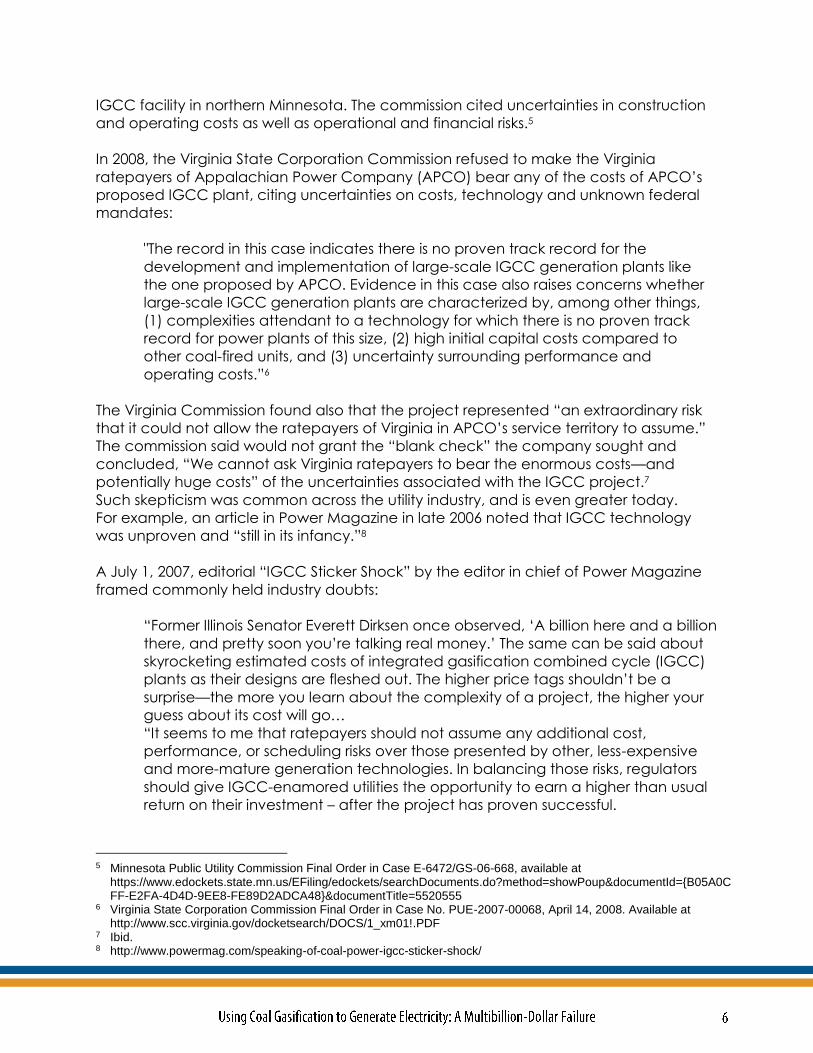
IGCC facility in northern Minnesota. The commission cited uncertainties in construction
and operating costs as well as operational and financial risks.5
In 2008, the Virginia State Corporation Commission refused to make the Virginia
ratepayers of Appalachian Power Company (APCO) bear any of the costs of APCO’s
proposed IGCC plant, citing uncertainties on costs, technology and unknown federal
mandates:
"The record in this case indicates there is no proven track record for the
development and implementation of large-scale IGCC generation plants like
the one proposed by APCO. Evidence in this case also raises concerns whether
large-scale IGCC generation plants are characterized by, among other things,
(1) complexities attendant to a technology for which there is no proven track
record for power plants of this size, (2) high initial capital costs compared to
other coal-fired units, and (3) uncertainty surrounding performance and
operating costs.”6
The Virginia Commission found also that the project represented “an extraordinary risk
that it could not allow the ratepayers of Virginia in APCO’s service territory to assume.”
The commission said would not grant the “blank check” the company sought and
concluded, “We cannot ask Virginia ratepayers to bear the enormous costs—and
potentially huge costs” of the uncertainties associated with the IGCC project.7
Such skepticism was common across the utility industry, and is even greater today.
For example, an article in Power Magazine in late 2006 noted that IGCC technology
was unproven and “still in its infancy.”8
A July 1, 2007, editorial “IGCC Sticker Shock” by the editor in chief of Power Magazine
framed commonly held industry doubts:
“Former Illinois Senator Everett Dirksen once observed, ‘A billion here and a billion
there, and pretty soon you’re talking real money.’ The same can be said about
skyrocketing estimated costs of integrated gasification combined cycle (IGCC)
plants as their designs are fleshed out. The higher price tags shouldn’t be a
surprise—the more you learn about the complexity of a project, the higher your
guess about its cost will go…
“It seems to me that ratepayers should not assume any additional cost,
performance, or scheduling risks over those presented by other, less-expensive
and more-mature generation technologies. In balancing those risks, regulators
should give IGCC-enamored utilities the opportunity to earn a higher than usual
return on their investment – after the project has proven successful.
5 Minnesota Public Utility Commission Final Order in Case E-6472/GS-06-668, available at
https://www.edockets.state.mn.us/EFiling/edockets/searchDocuments.do?method=showPoup&documentId={B05A0CFF-E2FA-4D4D-9EE8-FE89D2ADCA48}&documentTitle=5520555
6 Virginia State Corporation Commission Final Order in Case No. PUE-2007-00068, April 14, 2008. Available at http://www.scc.virginia.gov/docketsearch/DOCS/1_xm01!.PDF
7 Ibid. 8 http://www.powermag.com/speaking-of-coal-power-igcc-sticker-shock/

“Fair allocation of the incremental costs and rewards of IGCC should be the goal
of every state public service commission, as its ratepayers’ eyes and ears. At the
end of the day, the shareholders who elected the management team to make
wise technology decisions should pay the freight if those decisions go south.
“Corporate management teams come and go, but a bad project lives forever.”9
Plans for all but two of the more than 25 proposed IGCC plants in the U.S. were
cancelled because of customer and/or investor risks associated with high costs related
to technology and construction.
As noted, those two IGCC plants were Southern Company’s Kemper Plant in Mississippi
and Duke Energy Indiana’s Edwardsport Project.
When Southern Company subsidiary Mississippi Power first requested approval from the
Mississippi Public Service Commission to build the Kemper plant, in late 2009, it put the
project’s cost at slightly below $2.9 billion, and said the 824MW-rated plant would be in
full operation by May 2014. Kemper was supposed to burn lignite coal in its gasification
process—one of the lowest-quality forms of coal—from the Red Hills Mine in Mississippi.
The Sierra Club and the Public Service Commission’s independent consultant warned
that the cost of the project would be much higher than Southern Company estimating
and that it would take much longer to build.10 Nonetheless, the project was approved
in early 2010.
Southern Company sought successfully to shift much of the project risk to ratepayers.
While the company argued against having to bear such risks, it refused to agree to
share any profits it stood to earn had the project succeeded and if it were able to sell
the technology in other countries.11
The costs to build Kemper steadily increased as construction proceeded, as shown in
Figure 1, below, and its scheduled commercial in-service date was repeatedly delayed.
The “cost cap” in Figure 1 represents the cap adopted by the Mississippi Public Service
Commission and was based on Southern Company’s original cost estimate.
9 Ibid. 10 See the Direct Testimony of David A. Schlissel on Behalf of the Sierra Club in Mississippi Public Service Commission Docket No. 2009-UA-014, available at http://schlissel-technical.com/docs/testimony/testimony_21.pdf and Kemper Update, Mississippi Business Journal, February 2, 2010, http://msbusiness.com/2010/02/kemper-
update-psc-resource-hearings-on-kemper-county-coal-plant/ 11 Ibid.

Figure 1: Kemper IGCC Project’s Increasing Cost12
Although Kemper began producing electricity in mid-2014 as a conventional combined
cycle power plant burning natural gas, problems with the operation of its unproven
gasification systems—which were to have come online that same year—led to further
cost increases and schedule delays. By June 2017, Kemper’s estimated cost had
jumped to $7.5 billion, and construction and startup testing of its gasifiers was still
incomplete.
As the cost of building Kemper has skyrocketed, Southern Company has taken nearly
$6 billion in pre-tax charges for its estimated losses on the project.
12 Source: SNL Financial, a unit of S&P Global Market Intelligence.

Figure 2: Southern Company’s Estimated Losses on Kemper From 2013 to June 2017.13
As its construction costs rose, Mississippi Power’s estimates for how much it would cost to
operate the project as an IGCC plant for its first five years also jumped from its $205
million estimate in 2010 to $730 million, an increase of more than 250 percent. The total
capital expenditures that Mississippi Power said would be needed during the plant’s first
five years of operations skyrocketed from $52 million to more than $270 million.14
In a late concession to market realities, Mississippi Power released a study in February
2017 that suggested that low natural gas prices and the true costs of operating Kemper
meant that the plant was far more viable running just on natural gas.15 This was
essentially the same point made in a Sierra Club affidavit to the Mississippi Public Service
Commission filed in early 2012.16 As that affidavit noted, the very decline in natural gas
prices that has undermined the viability of the Kemper IGCC project was foreseeable.
As a result of the rising costs and continuing problems with the gasification system at
Kemper, the Mississippi Public Service Commission expressed its intention on June 21,
2017, to order that Southern Company, in the interest of ratepayers, cease burning coal
13 Southern Company’s Quarterly Earnings Reports and SEC Form 10-K filings for calendar years 2013, 2014, 2015,
and 2016 and its SEC Form Q filing for the first half of 2017. 14 Direct Testimony of Bruce C. Harrington on behalf of Mississippi Power Company, Mississippi Public Service
Commission Docket No. 2016-AD-0161, October 13, 2016. 15 http://mississippipowernews.com/2017/02/22/mississippi-power-issues-statement-regarding-kemper-county-energy-
facility-progress-and-schedule-2/ 16 Sierra Club “Motion for Status Conference Pending Remand,” Mississippi Public Service Commission Docket No. 2009-UA-014, March 19, 2012.
$1,180$868
$365 $428
$3,120
$5,961
$0
$3,500
$7,000
2013 2014 2015 2016 1st Half of2017
Total 2013-1st Half of
2017
Mil
lio
ns
of
Do
lla
rs

at Kemper and use only natural gas to run the plant.17 The commission also expressed its
belief that Kemper’s gasifier technology was not and will not become “used and
useful” in serving Mississippi customers and that Kemper’s gasification technology has
not operated reliably and is not likely do so in the near future.
In response, Southern Company announced on June 28, 2017, that it would stop
burning coal at the plant, and the commission finalized its directive in an order issued
on July 6.18 Consequently, Kemper is now operating what is undoubtedly the world’s
most expensive natural-gas fired power plant—and it will not burn syngas made from
gasified coal. The only outstanding question is how much of the costs of the Kemper
debacle will be borne by Mississippi Power customers.
When Duke Energy Indiana asked the Indiana Utility Regulatory Commission (IURC) in
October 2006 for approval to build an IGCC plant in Edwardsport, it estimated the
project’s construction cost at just under $2 billion. By the time the 618 MW-rated plant
officially went online in June 2013, construction costs had ballooned to $3.5 billion—a
number that did not include some $600 million Duke’s Indiana customers were charged
before June 2013.19
Since being declared operational in June 2013, Edwardsport has not operated reliably
and has now cost Duke Energy Indiana customers over than $1 billion more than what
they would have paid to buy the same amount of power from the competitive
wholesale market.
There are many ways to measure a power plant’s operational effectiveness, and
Edwardsport performs poorly by all of them.
For example, a power plant’s equivalent forced outage rate (EFOR) measures how
much a plant is out of service as a result of unplanned outages or reductions in output
(“derates”). The higher the EFOR, the worse a plant is performing. As shown below,
Edwardsport’s EFOR is more than 3.5 times higher than the typical combined cycle
plant that burns natural gas—that is, a plant that does not include gasifiers/gasification
technology.
17http://www.psc.state.ms.us/mpsc/press%20releases/2017/Joint%20Press%20Kemper%20Stipulation%20Docket%206
.21.17.pdf 18 http://www.southerncompany.com/newsroom/2017/june-2017/0628-kemper.html 19 In addition, Duke Energy Indiana recorded pretax charges of approximately $897 million on its earnings through 2014
as a result of cost overruns at Edwardsport. See Duke Energy’s SEC Form 10-K for the Year Ending December 31, 2014.

Figure 3: Edwardsport’s Equivalent Forced Outage Rate (EFOR) vs. Industry Average20
Thus, Edwardsport was out of service for unplanned outages, on average, more than
3.5 times as often as a typical natural gas-fired combined cycle unit.
In addition to unplanned outages, Edwardsport has been shut down every year for
extended planned maintenance and was off line for planned spring and fall
maintenance in 2014, 2015, 2016 and 2017. Each of those outages led to at least one of
Edwardsport’s two gasifiers being out of service for days or weeks.
Another measure of a plant’s operating performance is its heat rate which measures
how efficiently the plant burns fuel. The higher the heat rate, the less efficiently the
plant burns fuel. The lower the heat rate, the more efficient the plant is. In other words,
the higher the plant’s heat rate, the more fuel it must burn to generate the same
amount of power. This makes the plant less economic for consumers and less
competitive with other plants in the wholesale market.
While Edwardsport was being built, Duke and General Electric, the plant’s designer,
claimed that it would achieve an average annual heat rate of less than 9,000 BTUs per
KWh of generation.21 Edwardsport’s actual annual heat rates have ranged between a
high of 13,882 BTU/KWh in 2013 and a low of 11,102 BTU/KWh in 2015. As shown in Figure
4, this means that Edwardsport’s actual heat rate has been significantly higher than
promised and far above the heat rates of other coal and gas-fired combined cycle
units.
20 Edwardsport data provided by Duke Energy Indiana in Indiana Utility Regulatory Commission Cause 43114, Sub-
Dockets IGCC-12/13, IGCC-15 and IGCC-16. Industry data from the Generating Availability Data System of the North American Electric Reliability Corp., or NERC.
21 See http://www.purdue.edu/discoverypark/energy/assets/pdfs/cctr/presentations/EdwardsportIGCC-041609.pdf
24.2%22.3%
20.2% 19.9%
13.4%
20.3%
0%
15%
30%
2013 2014 2015 2016 January - July2017
Average June2013-July
2017Edwardsport Annual EFOR5.53% Class Average EFOR for Combined Cycle Units
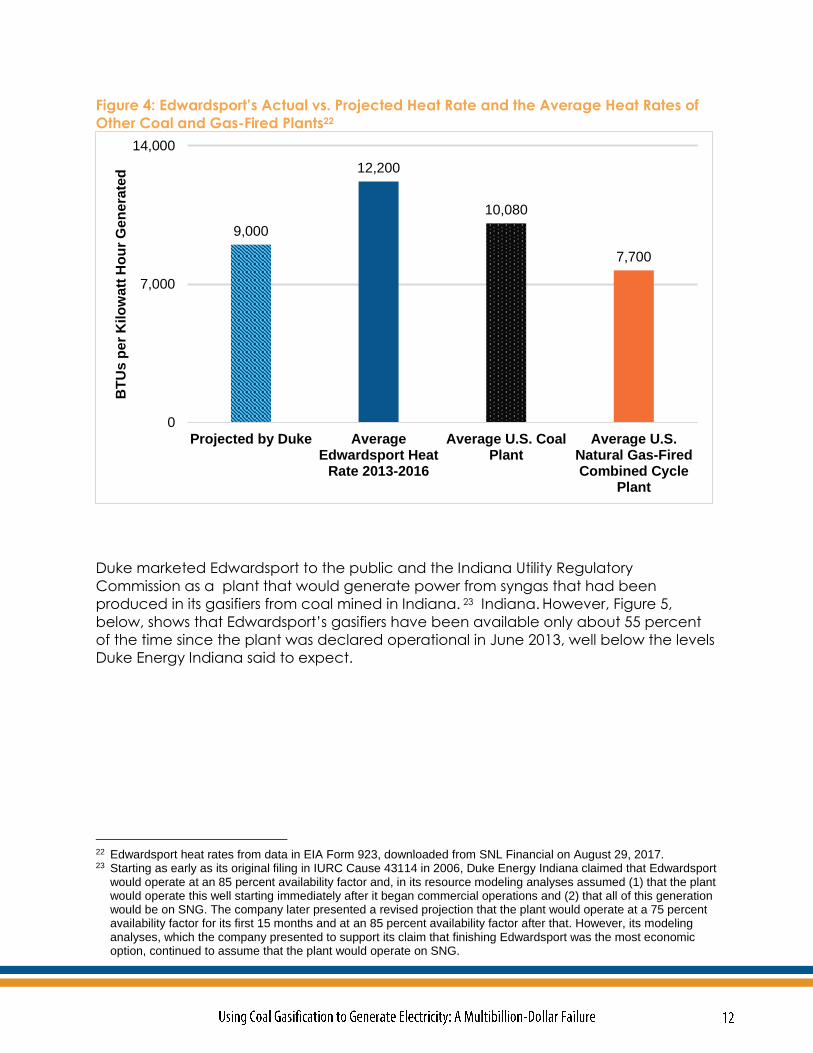
Figure 4: Edwardsport’s Actual vs. Projected Heat Rate and the Average Heat Rates of
Other Coal and Gas-Fired Plants22
Duke marketed Edwardsport to the public and the Indiana Utility Regulatory
Commission as a plant that would generate power from syngas that had been
produced in its gasifiers from coal mined in Indiana. 23 Indiana. However, Figure 5,
below, shows that Edwardsport’s gasifiers have been available only about 55 percent
of the time since the plant was declared operational in June 2013, well below the levels
Duke Energy Indiana said to expect.
22 Edwardsport heat rates from data in EIA Form 923, downloaded from SNL Financial on August 29, 2017. 23 Starting as early as its original filing in IURC Cause 43114 in 2006, Duke Energy Indiana claimed that Edwardsport
would operate at an 85 percent availability factor and, in its resource modeling analyses assumed (1) that the plant would operate this well starting immediately after it began commercial operations and (2) that all of this generation would be on SNG. The company later presented a revised projection that the plant would operate at a 75 percent availability factor for its first 15 months and at an 85 percent availability factor after that. However, its modeling analyses, which the company presented to support its claim that finishing Edwardsport was the most economic option, continued to assume that the plant would operate on SNG.
9,000
12,200
10,080
7,700
0
7,000
14,000
Projected by Duke AverageEdwardsport Heat
Rate 2013-2016
Average U.S. CoalPlant
Average U.S.Natural Gas-FiredCombined Cycle
Plant
BT
Us
pe
r K
ilo
wa
tt H
ou
r G
en
era
ted

Figure 5: Edwardsport’s Actual vs. Projected Gasifier Availability24
Because of its unreliable gasification systems, Edwardsport has generated far less power
than Duke Energy Indiana said it would when Duke was arguing to the Indiana Utility
Regulatory Commission that the plant should be built. We know this because the plant’s
actual capacity factors have been significantly below what Duke Energy said they
would be. Capacity factor is a measure of how much power a plant actually produces
in a month or a year compared to how much it would have produced had it operated
at full power in that month or year.
24 Ibid.
0%
25%
50%
75%
100%
June2013
January2014
January2015
January2016
January2017
Actual Gasifier Availability Factor Projected 75% Availability on Syngas
Projected 85% Availability on Syngas

Figure 6: Edwardsport’s Actual vs. Projected Capacity Factors25 26
Edwardsport has averaged only a 51 percent capacity factor since it began
commercial operations, far below the nearly 80 percent capacity factor Duke told the
IURC it would. The plant’s average capacity factor while running on syngas has been
even lower, averaging only 37 percent through May 2017.
While Figures 3, 5 and 6 show that while Edwardsport’s operating performance
improved during the first seven months of 2017, it did not reach the levels the company
promised when it was seeking to build the plant. Nor does this improved performance
make the plant economic for consumers.
Another contributor to Edwardsport’s poor operating performance is the fact that
running the equipment for the gasification portion of the plant consumes a lot of
power. A power plant’s gross generation is the total amount of energy that it generates.
Its net generation is the amount of power it sends out onto the electric grid. The
difference between gross and net power is the “parasitic” load—the amount of power
25 Projected Edwardsport capacity factors from data provided by Duke Energy Indiana in IURC Cause 43114. Actual
Edwardsport capacity factors on syngasl and natural gas from data submitted by the company in Form 923 of the Energy Information Administration (EIA).
26 The Edwardsport actual capacity factor for 2017 in Figure 6 on both natural gas and syngas is for the months of January thru July. The capacity factor for the year on syngas alone is just for the months of January thru May 2017.
34%
40%
57% 57%
75%
51%
72%75%
82% 82% 82%79%
24%
32%38%
41%
57%
37%
0%
100%
2013 2014 2015 2016 2017 June 2013-July2017
Ne
t C
ap
ac
ity F
ac
tor
Edwardsport's Actual Net Capacity Factor - Both Syngas & Natural Gas
What Duke Claimed in 2011 Would be Edwardsport's Combined Capacity Factor on Both Fuels
Edwardsport's Actual Net Capacity Factor on Syngas Alone

needed to operate onsite auxiliary equipment. When Edwardsport is operating on
syngas, approximately 30 percent of its gross generation is lost to parasitic load.27
Thus, when it is operating on syngas, Edwardsport could be using as much as 190 MW of
its 618 MW of capacity just to run internal equipment including gasifiers and other
components of the gasification portion of the plant. As shown in Figure 7, below, this is
much higher than the parasitic loads for natural gas-fired combined cycle plants; this
on-site consumption of power adversely affects Edwardsport’s economics.
Figure 7: Edwardsport vs. Typical Power Plant Annual Parasitic Loads
Beyond having been very expensive to build and operating unreliably, Edwardsport is
very costly to run. Figure 8, below, compares the annual cost of operating and
maintaining Edwardsport with the average cost of buying power (both energy and
capacity) from the competitive wholesale market in the Midwest.
27 Based on a comparison of Edwardsport’s gross generation on syngas provided in monthly compliance reports to the
Lt. Governor of Indiana and the IURC and the plant’s net generation reported in EIA Form 923.
30%
7%-10%
3%-4%
Edwardsport Coal-burning plants 20years and older
Natural gas-burningcombined cycle plants

Figure 8: Edwardsport’s Annual Operating & Maintenance Costs (O&M) per MWh28
Customers don’t pay just for the cost of operating and maintaining the Edwardsport
IGCC plant. They also ultimately pay interest on the funds borrowed to build the plant,
they pay for returns (profits) to Duke Energy Indiana, they pay the plant’s property taxes
and they absorb depreciation of plant costs. Customers pay as well for annual capital
expenditures (“capex”) to keep the plant operating and to keep it in compliance with
environmental regulations.
All of these add up to the “All-In” cost of power from Edwardsport and represent all of
the costs that customers must pay for the plant. Figure 9, below, shows that
Edwardsport’s “All-In” cost has been significantly more expensive than the cost of
power in competitive wholesale markets.
28 Edwardsport costs from Duke Energy Indiana FERC Form 1 filings for the years 2013 through 2016. Market prices for
MISO’s Indiana Zone downloaded from SNL Financial.
$73 $73
$56
$64 $65
$32$36
$28 $27$30
$0
$50
$100
Last 7 Months of2013
2014 2015 2016 June 2013-December 2016
Do
llars
pe
r M
eg
aw
att H
ou
r
Edwardsport's Annual Operating & Maintenance Cost
Average Annual Cost of Puchasing Same Energy from Competitive Markets

Figure 9: Edwardsport “All-In” Cost vs. Cost of Buying Same Amounts of Energy and
Capacity from Competitive Wholesale Markets.
As a result, in the 43 months from June 2013 through December 2016, Duke Energy
Indiana’s customers paid almost five times as much, or around $1 billion more, for
power from Edwardsport than they would have paid had Duke simply bought the same
amounts of electricity and capacity from competitive wholesale markets.
Given Edwardsport’s very high “All-In” costs, as shown in Figure 9, above—and given
that the general expectation that future prices in the competitive wholesale markets
will grow slowly for at least the next decade—it is extremely unlikely that the cost of
buying capacity and energy from the competitive wholesale markets will ever equal,
let alone exceed, the cost of the power produced by Edwardsport. This is true even if
the company manages to maintain the improved plant performance reported during
the first seven months of 2017.
$205$188
$131 $135
$153
$32 $37$29 $31 $32
$0
$50
$100
$150
$200
$250
Last 7 Months of2013
2014 2015 2016 June 2013-December 2016
Do
llars
pe
r M
eg
aw
att H
ou
r
Average All-In Price of Power from Edwardsport
Average Cost of Puchasing Same Amounts of Energy and Capacity from Competitive Markets

Figure 10: Edwardsport’s All-In Cost vs. the Market’s Expectation for Future Energy
Market Prices in Indiana29
Meanwhile—as Edwardsport has struggled to perform and as its costs have mounted—
prices for wind- and solar-generated power have declined so far and so fast that wind
and solar power now cost a fraction of the electricity produced at Edwardsport. And
the prices for wind- and solar-generated power are expected to decline even further in
coming years.
Table 1: Edwardsport’s Annual Operating & Maintenance and All-In Costs vs. the Costs
of Wind and Solar Resources
29 The projected market prices in Figure 10 reflect (i) forward energy market prices as of August 7, 2017 and (ii) the
conservative assumption that capacity prices in MISO will jump back up to $72 per MW-day from their current level of $1.50 per MW-day and, on average, will remain at the level through 2026.
30 Moody’s Investors Service, Rate-Basing Wind Generation Adds Momentum to Renewables, March 15, 2017, and U.S. Department of Energy, 2016 Wind Technologies Market Report, available at
https://emp.lbl.gov/sites/default/files/2016_wind_technologies_market_report_final_optimized.pdf 31 Utility-Scale Solar 2015: An Empirical Analysis of Project Cost, Performance and Pricing Trends in the United States,
Lawrence Berkeley National Laboratory. Available at https://emp.lbl.gov/sites/all/files/lbnl-1006037_report.pdf 32 UBS Global Research, The Renewable Cost Deflation Trends Continue, February 16, 2017,
https://neo.ubs.com/shared/d1X1OBuc7TKNdeG/ 33 Ibid.
$0
$70
$140
2018 2019 2020 2021 2022 2023 2024 2025 2026
Do
lla
rs p
er
Me
gaw
att
H
ou
r
AverageEdwardsport "All-In" Cost in 2015and 2016
Projected Pricesfor MarketPurchases ofEnergy & Capacityin MISO's IndianaZone
Cost per MWh
Edwardsport Average Operating & Maintenance Costs 2013-2016 $65
Edwardsport Average All-In Costs 2013-2016 $153
Average of Recent U.S. Wind Long-Term PPA Prices30 $22
Average of Recent U.S. Solar Long-Term PPA Prices31 $40
Market Expectations for Future Long-Term Wind PPA Prices in Early
2020s, Without Any Wind Production Tax Credit32
$20-$30
Market Expectations for Future Long-Term Solar PPA Prices in Early
2020s, Without Any Solar Investment Tax Credit33
$20-40

When Duke Energy Indiana filed its petition in 2006 for a certificate to build Edwardsport,
the company said that carbon capture technology would become a “strong potential
benefit of IGCC plants”34:
“Although capture and storage or sequestration techniques have not yet been
commercially proven, IGCC technology offers the potential for relatively easier
and less energy-intensive means of capturing CO2 than [pulverized coal]
plants.”35
The company also cited a U.S. Department of Energy study that estimated that the
costs of outfitting an IGCC plant with carbon capture equipment would increase the
cost of producing electricity by about 30 percent, whereas the impact of adding
carbon capture equipment to a supercritical pulverized coal plant would have an
impact of around 68 percent on the plant’s cost of producing electricity.36
Duke Energy Indiana decided not to pursue carbon capture after the Indiana Utility
Regulatory Commission refused to approve the company’s recovery of costs
associated with the technology. As a result, Edwardsport now emits millions of tons of
CO2 into the atmosphere each year. In fact, Edwardsport today emits more CO2, on a
pounds per MMBTU basis, than any of Duke Energy Indiana’s other coal-fired
generators.37
34 Testimony of James E. Rogers, IURC Cause No. 43114, October 24, 2006, page 11, line 21, through page 12, line 3. 35 Ibid. 36 Ibid., page 12, line 22, through page 13, line 3. 37 Mississippi Power planned to capture 65 percent of the CO2 from Kemper and sell it for enhanced oil recovery in a
nearby oil field. However, this plan does not appear to be viable given the switch from coal gasification to burning natural gas.

Figure 11: Annual CO2 Emission Rates, Edwardsport and Duke Energy Indiana’s Other
Coal-Fired Generators38
Two demonstration projects using IGCC technology to generate electricity from coal
were built during the 1990s: The Wabash Valley Power IGCC plant in Indiana and the
Polk IGCC plant near Tampa, Fla.
Wabash Valley Power IGCC plant began operations in November 1995 but was retired
after 20 years in operation, a relatively short life span for a power plant. With about 150
MW of net summer capacity, the plant was less than one-quarter the size of either
Edwardsport or Kemper.
The plant did not operate reliably, achieving only an average 31 percent capacity
factor over its operating life, which included a three-year period (2008-2010) when it did
38 Emissions data downloaded from the EIA CEMS program through SNL Financial.
218224
227
205 205 205
150
180
210
240
2014 2015 2016
Po
un
ds
pe
r M
MB
TU
Edwardsport Gibson Cayuga R. Gallagher Wabash ST

not generate any power at all. The cost of producing power at the plant was high,
averaging from $40 per MWh to $60 per MWh in its last five years of operation.
The Polk IGCC plant is also substantially smaller than Edwardsport or Kemper, with only
294 MW of operating capacity versus Edwardsport’s 618 MW and Kemper’s 824 MW.
Although it operated more often than Wabash Valley (achieving an average 58
percent capacity factor from 1996 to 2016), much of its generation was produced by
burning natural gas, not syngas, especially in recent years.
Power from Polk IGCC has been expensive, reaching $60 per MWh in 2011 and 2012.
The cost of producing power at the plant started to decline in 2013 when it began to
burn more natural gas. The average price of power from the plant dropped to $36.21
per MWh in 2016, from $60.41 in 2012. The owner of Polk IGCC, Tampa Electric, received
a permit from the Florida Department of Environmental Protection in October 2016 to
burn natural gas only for 3,000 hours each year, up from a previous limit of 876 hours.
Given the low price of natural gas, this will almost certainly lead to far more generation
from natural gas and less from syngas.
The Kemper and Edwardsport experiments, the only two coal gasification plants built in
the U.S. in the past decade, show that Integrated Gasification Combined Cycle (IGCC)
technology does not operate as advertised. Further, they demonstrate how high
construction costs, unreliable performance, and high operating costs keep such plants
from being financially viable or from effectively reducing carbon-dioxide emissions.
Coal-gasification technology for the purposes of electricity generation is not feasible,
especially given the declining costs of solar and wind resources and the expectation
that natural gas prices will remain low for the foreseeable future.

The Institute for Energy Economics and Financial Analysis (IEEFA) conducts research and
analyses on financial and economic issues related to energy and the environment. The
Institute’s mission is to accelerate the transition to a diverse, sustainable and profitable
energy economy.More can be found at www.ieefa.org.
IEEFA would like to acknowledge the assistance of Alan Lindsay for his technical and
financial modelling input.
David Schlissel, director of resource planning analysis for IEEFA, has been a regulatory
attorney and a consultant on electric utility rate and resource planning issues since
1974. He has testified as an expert witness before regulatory commissions in more than
35 states and before the U.S. Federal Energy Regulatory Commission and Nuclear
Regulatory Commission. He also has testified as an expert witness in state and federal
court proceedings concerning electric utilities. His clients have included state regulatory
commissions in Arkansas, Kansas, Arizona, New Mexico and California. He has also
consulted for publicly owned utilities, state governments and attorneys general, state
consumer advocates, city governments, and national and local environmental
organizations.
Schlissel testified as an expert witness in state regulatory commission cases in Mississippi
and Indiana involving the Kemper and Edwardsport IGCC plants. In his testimony, he
noted that because the projects involved first-of-their-kind technologies, the plants
would cost far more and take much longer to build than the developers
acknowledged. Schlissel testified also that future natural gas and energy market prices
would be substantially lower than the developers projected.
Schlissel has undergraduate and graduate engineering degrees from the
Massachusetts Institute of Technology and Stanford University. He has a Juris Doctor
degree from Stanford University School of Law.
This report is for information and educational purposes only. The Institute for Energy
Economics and Financial Analysis (“IEEFA”) does not provide tax, legal, investment or
accounting advice. This report is not intended to provide, and should not be relied on
for, tax, legal, investment or accounting advice. Nothing in this report is intended as
investment advice, as an offer or solicitation of an offer to buy or sell, or as a
recommendation, endorsement, or sponsorship of any security, company, or fund.

IEEFA is not responsible for any investment decision made by you. You are responsible
for your own investment research and investment decisions. This report is not meant as a
general guide to investing, nor as a source of any specific investment
recommendation. Unless attributed to others, any opinions expressed are our current
opinions only. Certain information presented may have been provided by third parties.
IEEFA believes that such third-party information is reliable, and has checked public
records to verify it wherever possible, but does not guarantee its accuracy, timeliness or
completeness; and it is subject to change without notice.