Embed Size (px)
Citation preview
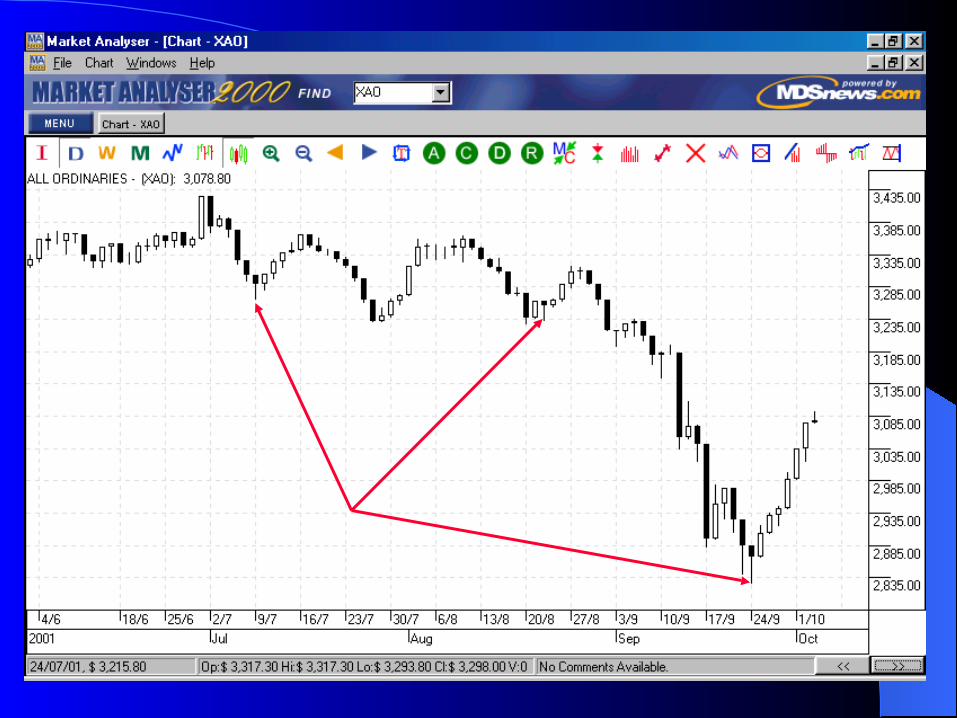
Using Candle Stick Charts
by Simon Shannon
The Candlestick style of charting is one of the four most popular methods used to show the course of prices.
Contrary to to the bar chart, another important piece of information is added.
The analysts not only sees the movement in prices, but thanks to the color of a single bar, can quickly recognize whether the prices have risen or fallen within the measured period.
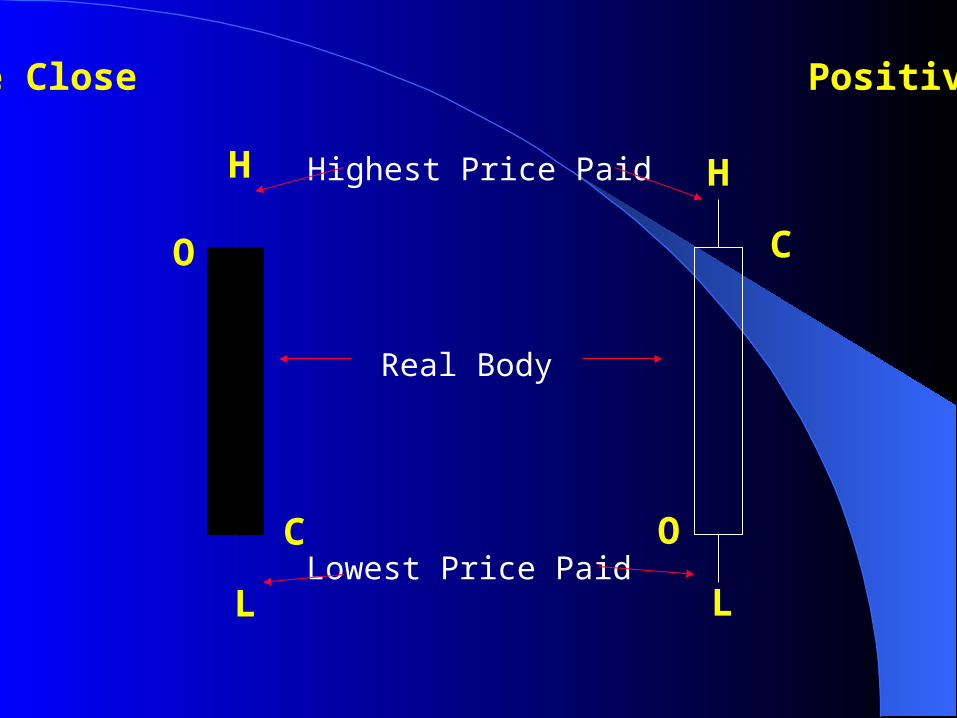
Negative Close Positive Close
O
C O
C
H
L
H
L
Highest Price Paid
Lowest Price Paid
Real Body
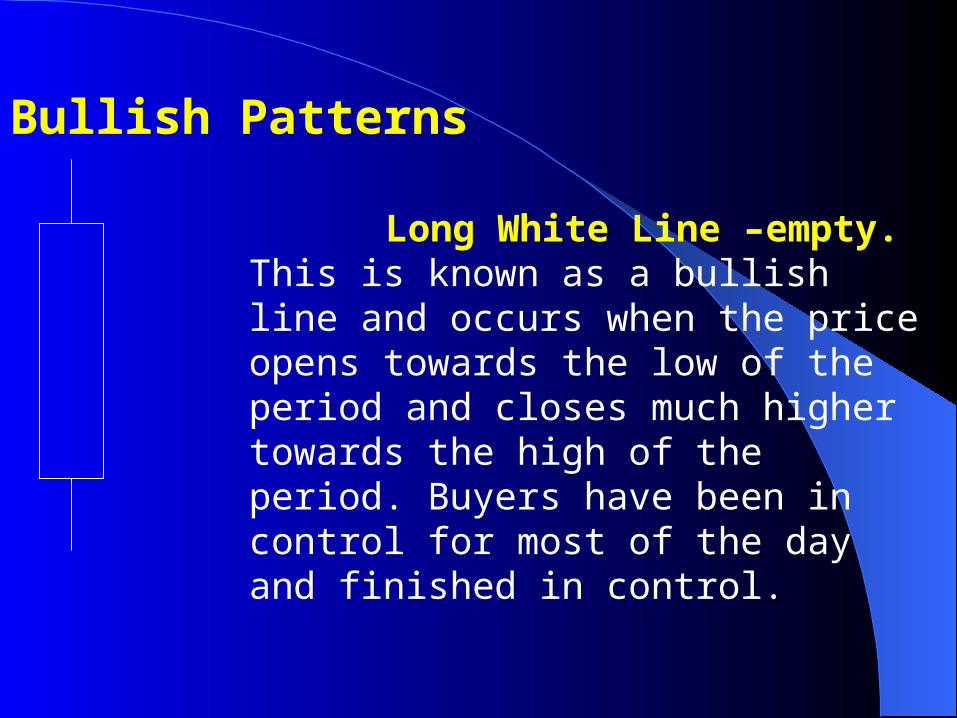
Bullish Patterns
Long White Line –empty. This is known as a bullish line and occurs when the price opens towards the low of the period and closes much higher towards the high of the period. Buyers have been in control for most of the day and finished in control.
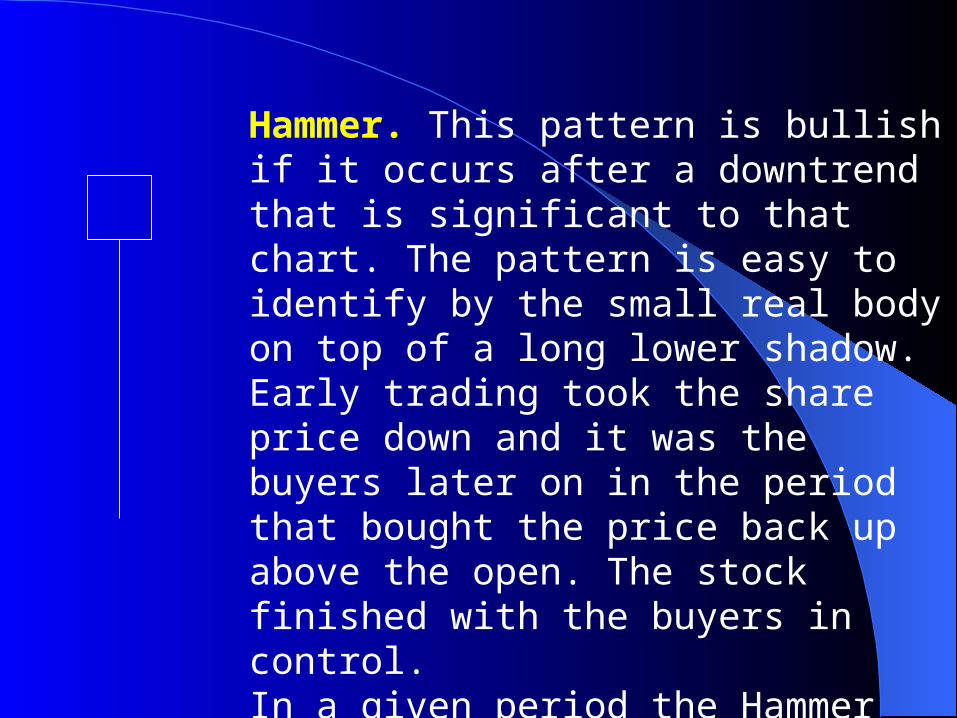
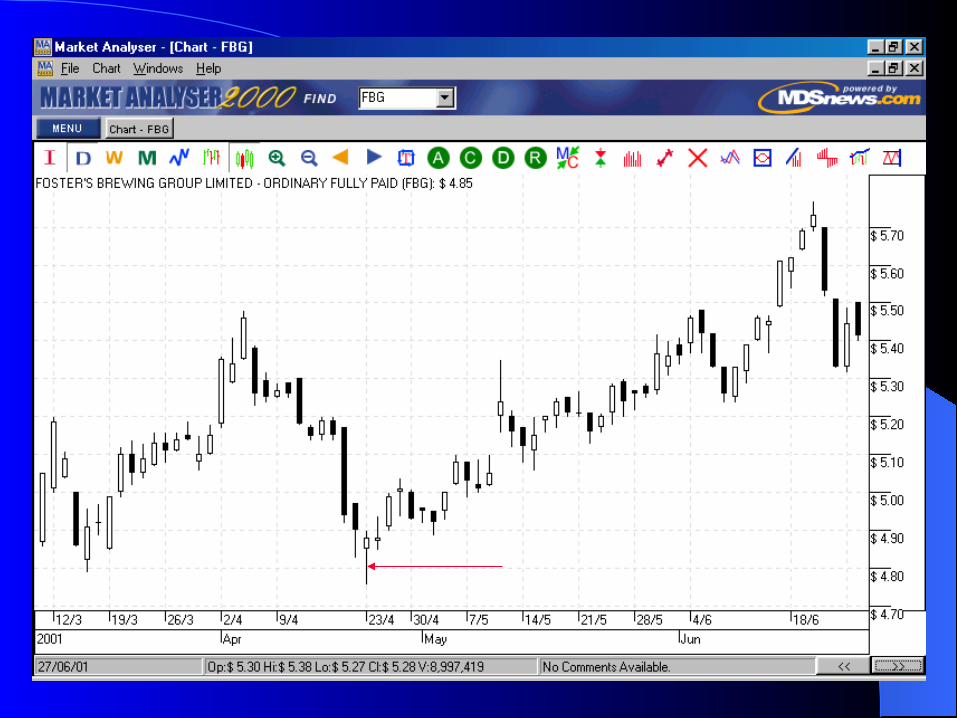
Hammer. This pattern is bullish if it occurs after a downtrend that is significant to that chart. The pattern is easy to identify by the small real body on top of a long lower shadow. Early trading took the share price down and it was the buyers later on in the period that bought the price back up above the open. The stock finished with the buyers in control.In a given period the Hammer was observed 37 times with a very high statistical hit ratio of 72%, and an average 20/point increase in price.

Piercing line. The day preceding the long white is a negative close period. The long white must open lower than the first periods low and then must close better than halfway up the first period’s real body.
Results showed 51%. Not overly convincing.
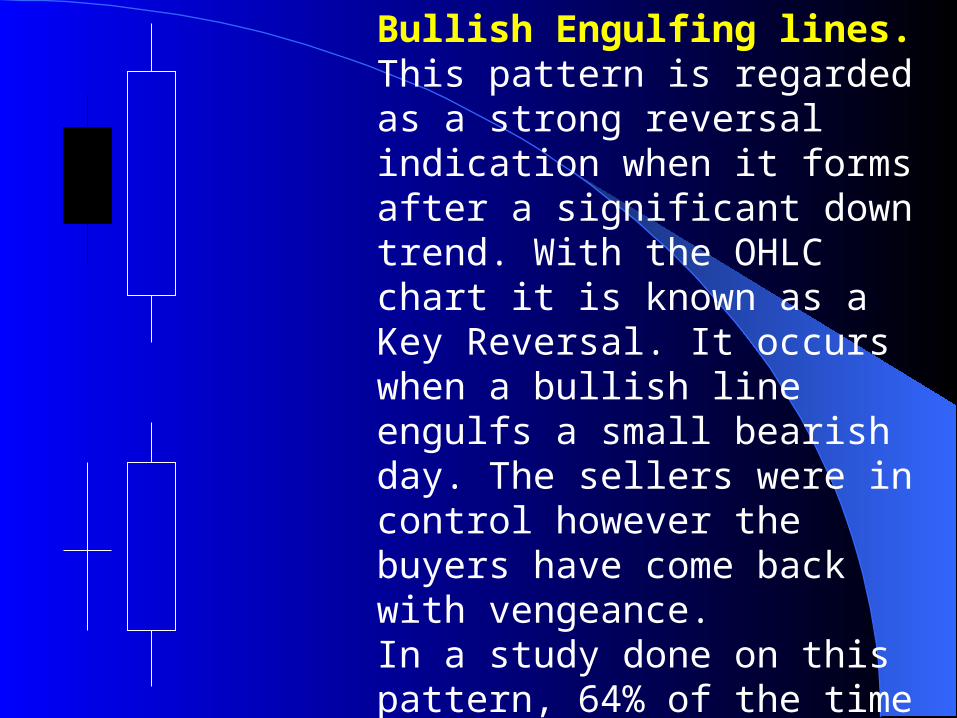
Bullish Engulfing lines. This pattern is regarded as a strong reversal indication when it forms after a significant down trend. With the OHLC chart it is known as a Key Reversal. It occurs when a bullish line engulfs a small bearish day. The sellers were in control however the buyers have come back with vengeance.In a study done on this pattern, 64% of the time the price rose in the following days. Almost 70% for the Bullish Doji Engulfing Pattern.

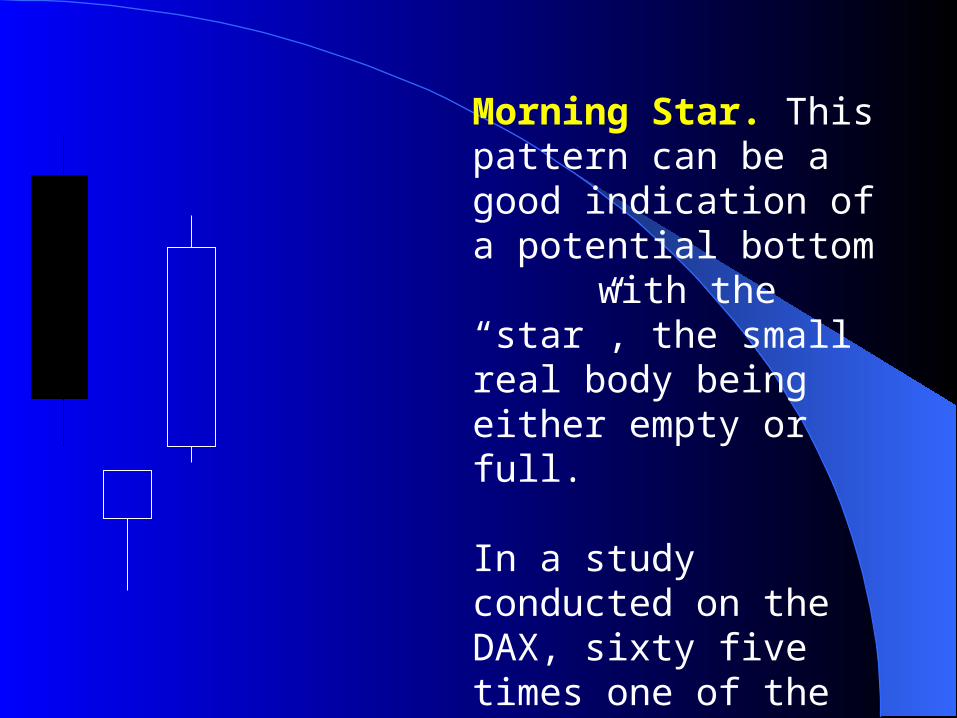
Morning Star. This pattern can be a good indication of a potential bottom with the “star”, the small real body being either empty or full.
In a study conducted on the DAX, sixty five times one of the two star patterns were found in the period of examination, and in 61% of these cases prices were higher within three days.
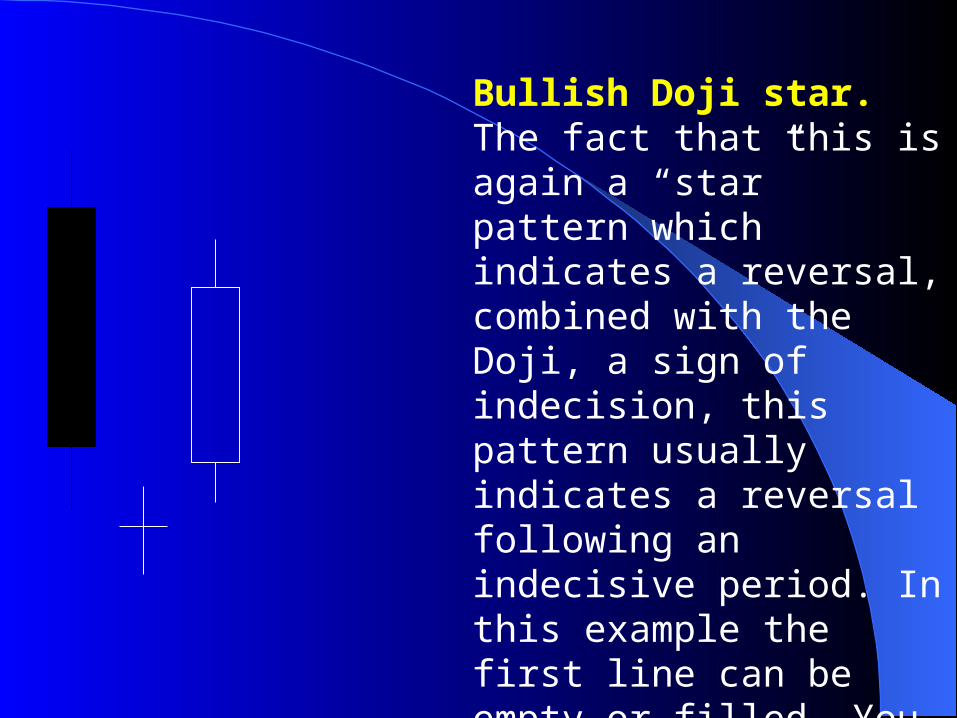
Bullish Doji star. The fact that this is again a “star” pattern which indicates a reversal, combined with the Doji, a sign of indecision, this pattern usually indicates a reversal following an indecisive period. In this example the first line can be empty or filled. You should wait for confirmation of the change in trend before trading a Doji star.
Bearish Patterns
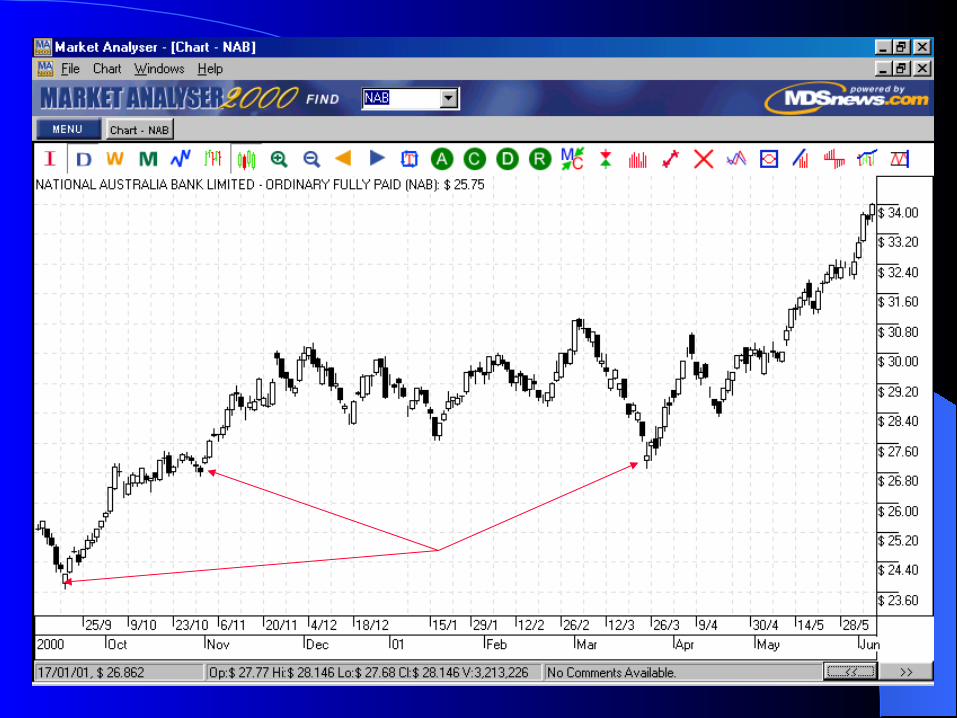
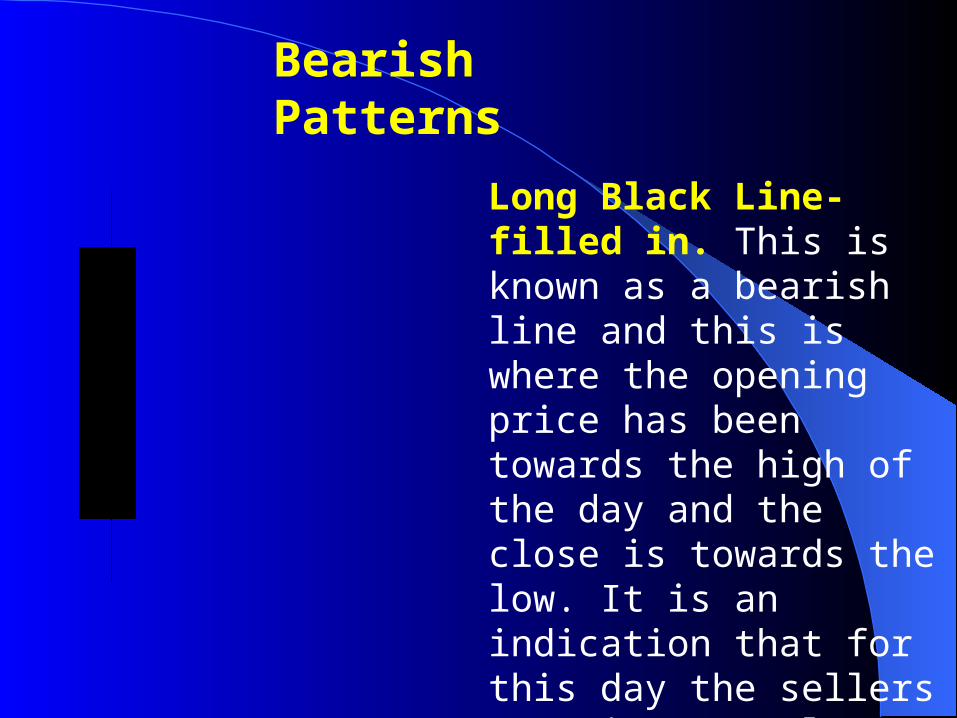
Long Black Line-filled in. This is known as a bearish line and this is where the opening price has been towards the high of the day and the close is towards the low. It is an indication that for this day the sellers were in control.

Hanging Man. These are a bearish sign if they are present after a significant uptrend. As the diagram indicates the real bodies can be either filled or empty. They have small real bodies, the difference between the open and close prices, with a long lower shadow.
Again the study showed a 66% strike rate.
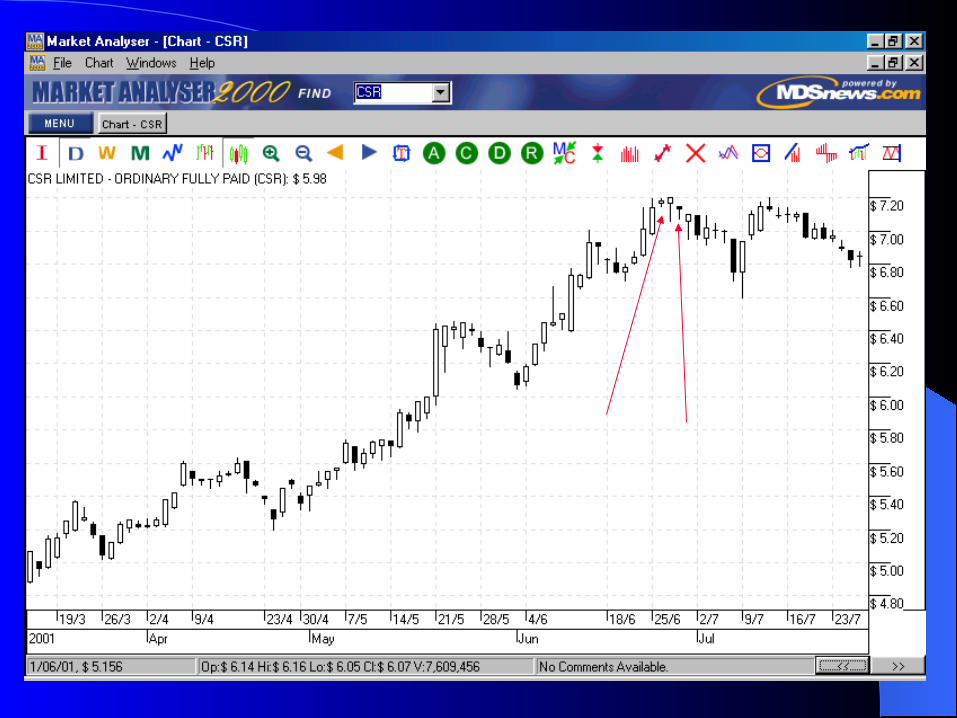
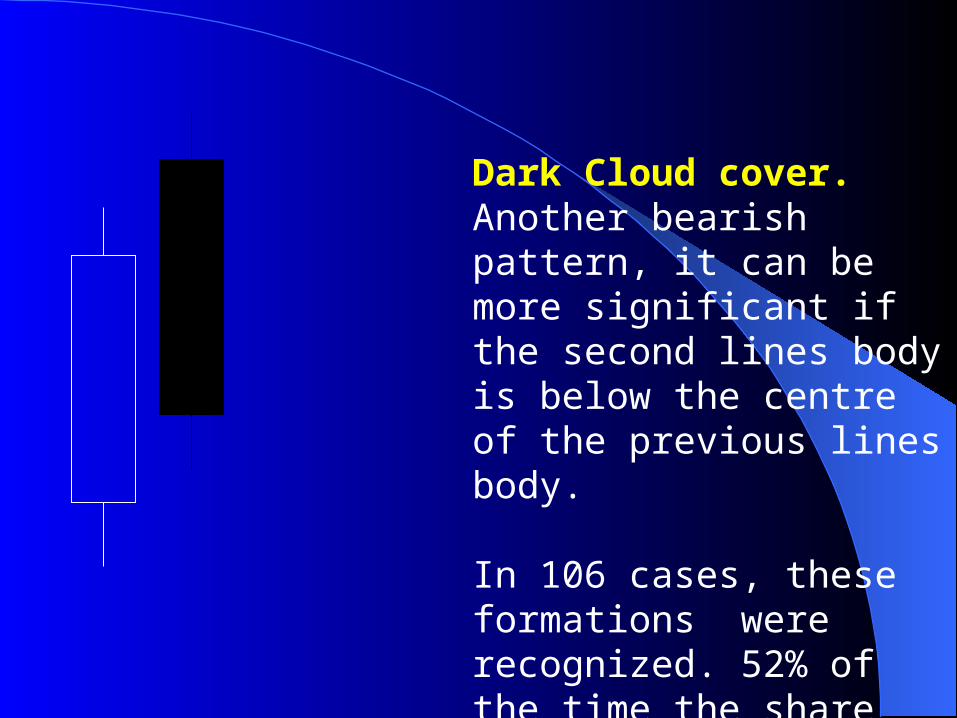
Dark Cloud cover. Another bearish pattern, it can be more significant if the second lines body is below the centre of the previous lines body.
In 106 cases, these formations were recognized. 52% of the time the share was lower and 48% it was higher.
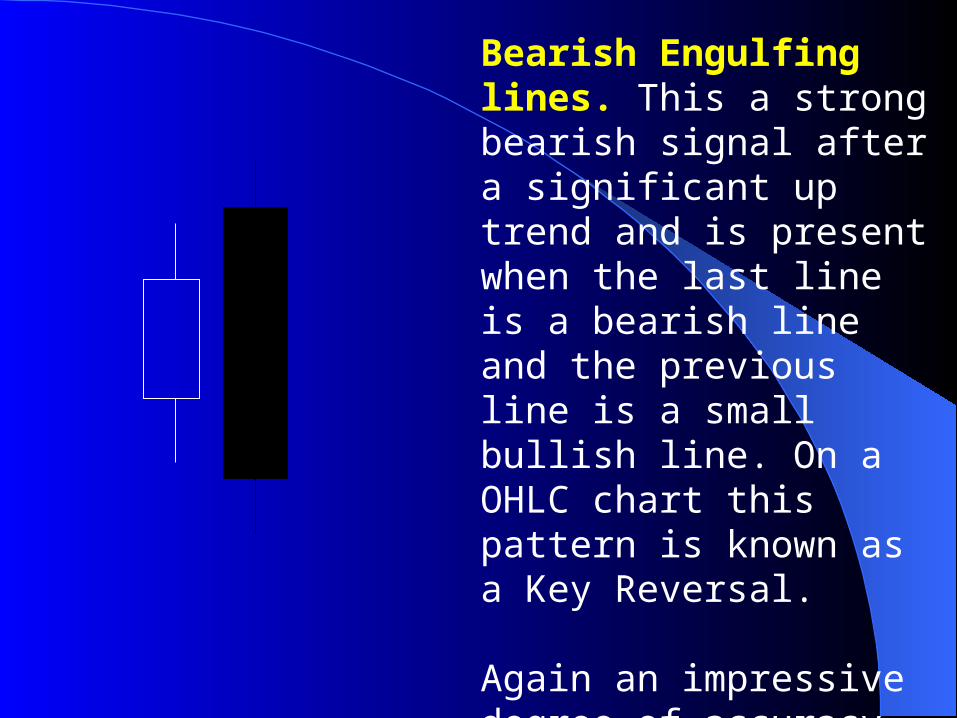
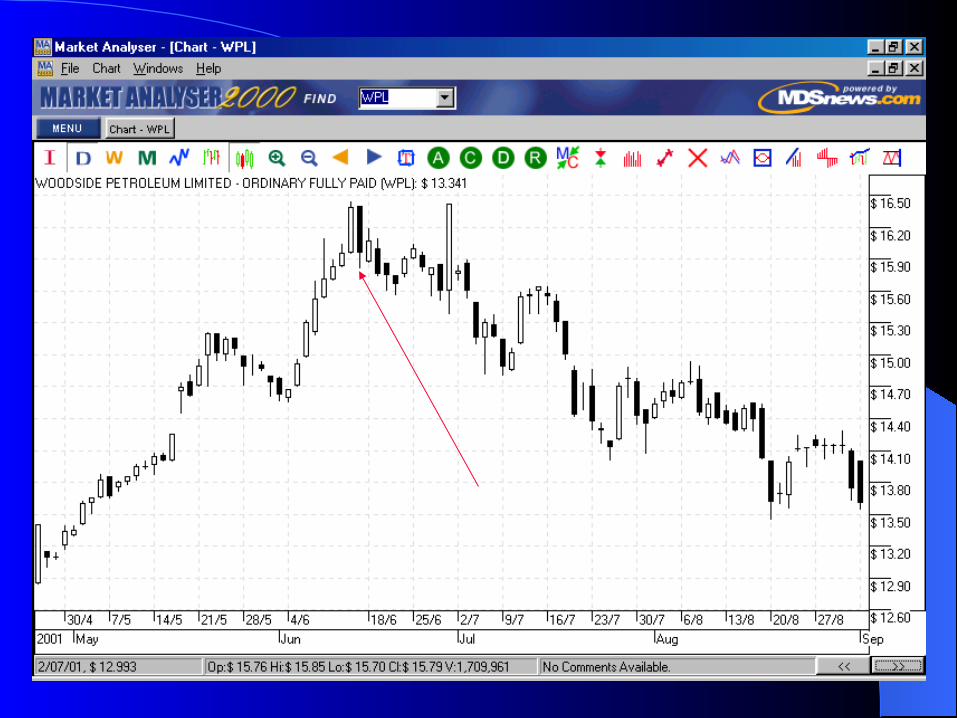
Bearish Engulfing lines. This a strong bearish signal after a significant up trend and is present when the last line is a bearish line and the previous line is a small bullish line. On a OHLC chart this pattern is known as a Key Reversal.
Again an impressive degree of accuracy was attend with this pattern. In fact in 65% of the examples the price feel on average 7/points.
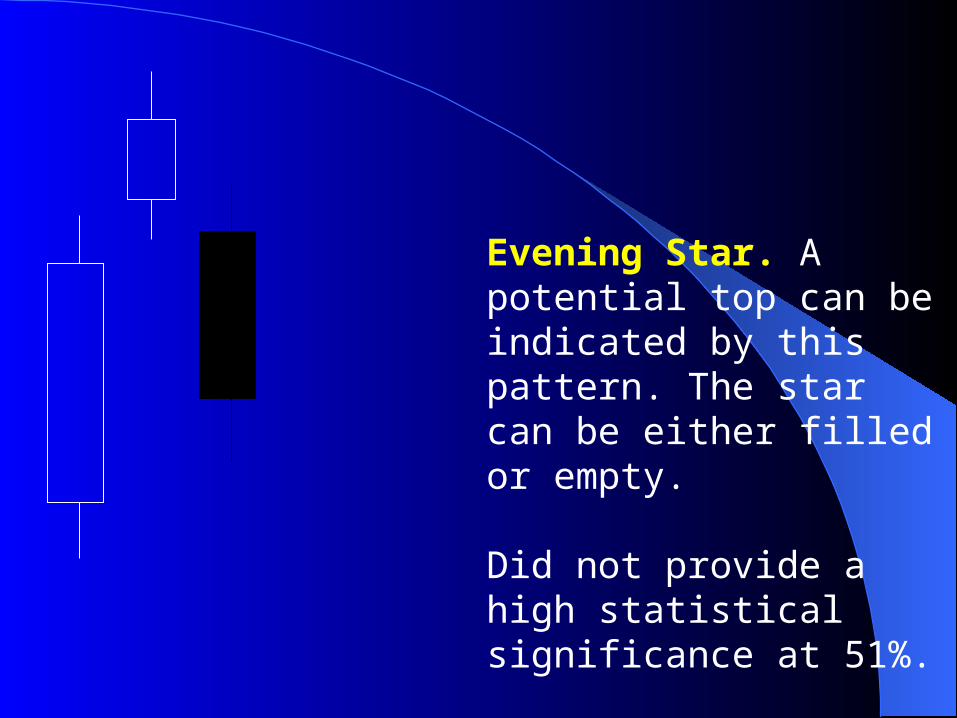
Evening Star. A potential top can be indicated by this pattern. The star can be either filled or empty.
Did not provide a high statistical significance at 51%.
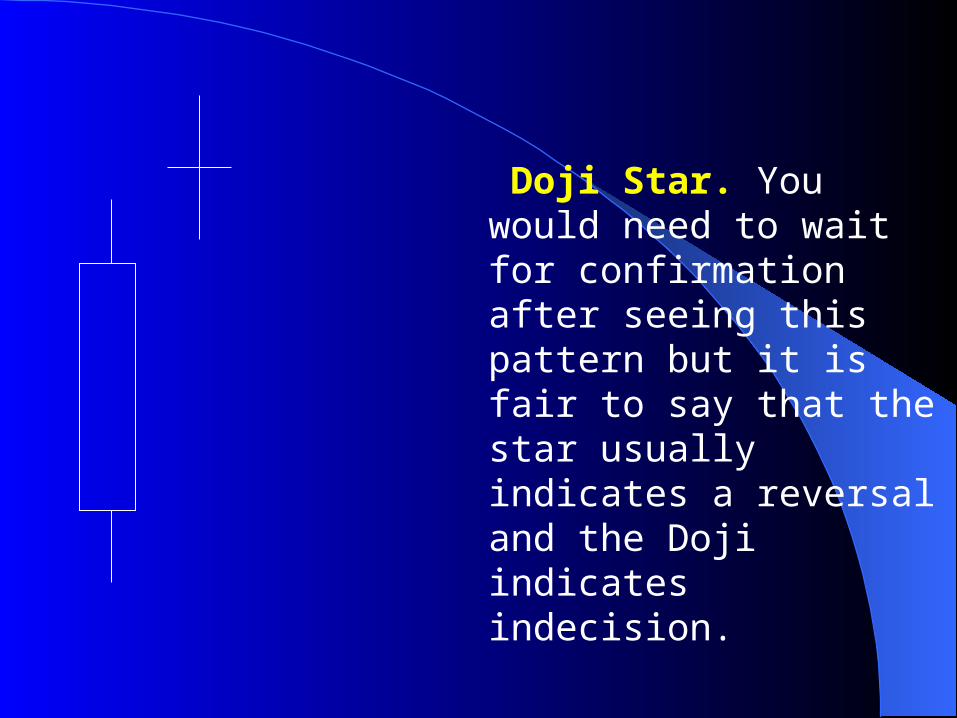
Doji Star. You would need to wait for confirmation after seeing this pattern but it is fair to say that the star usually indicates a reversal and the Doji indicates indecision.
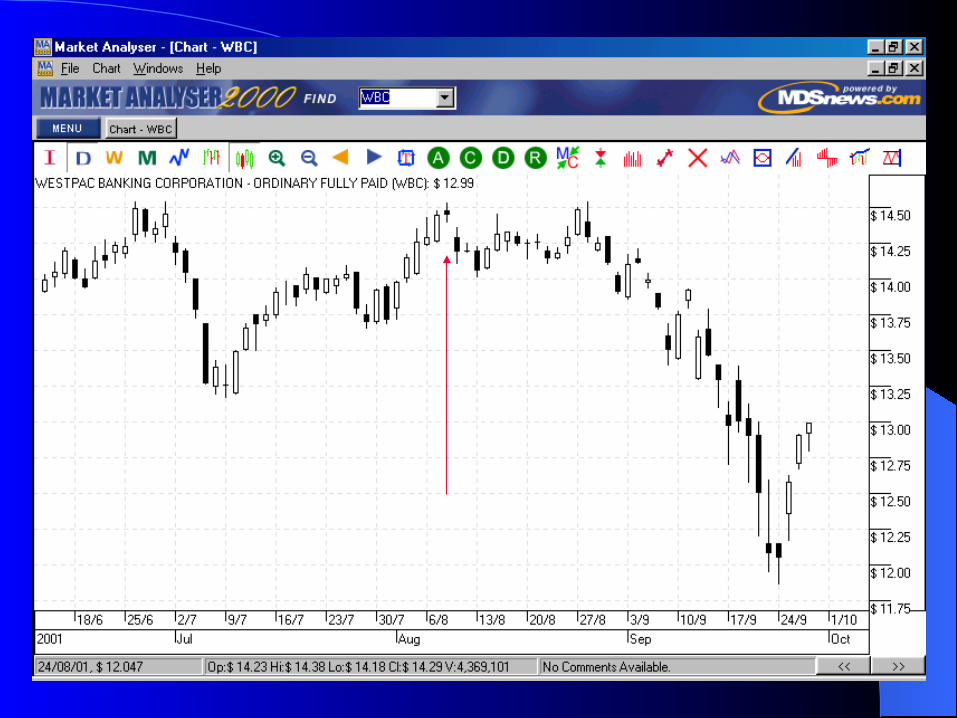
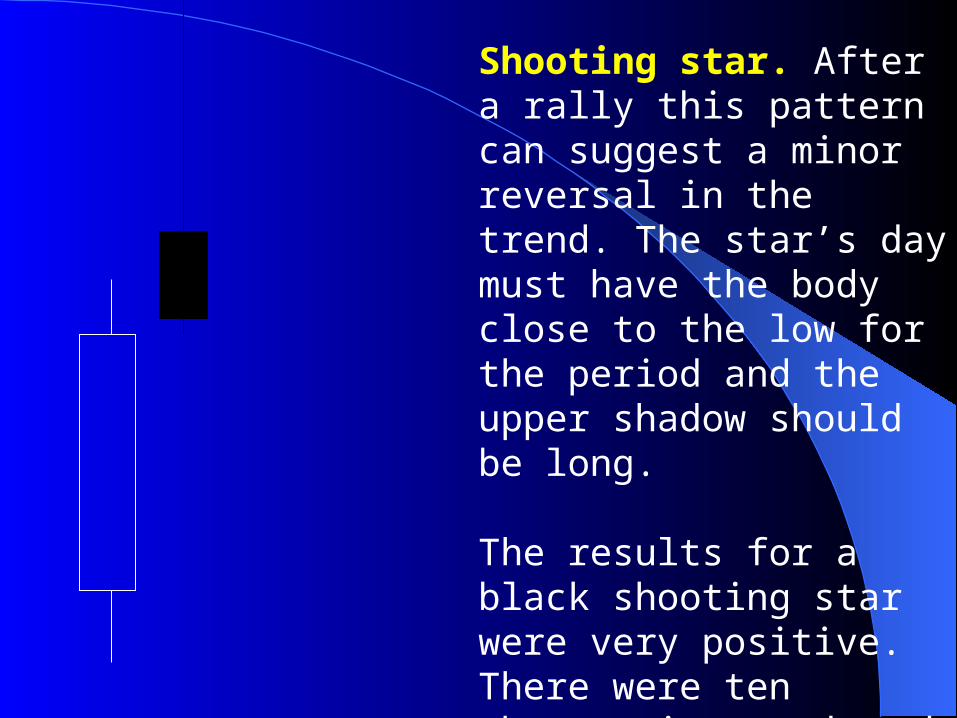
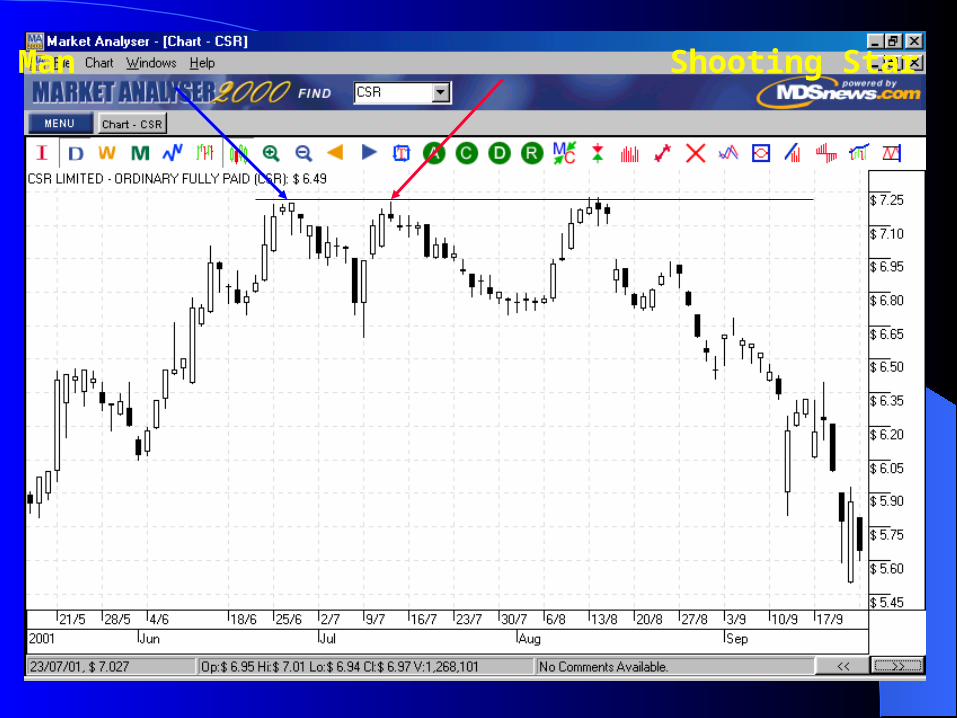
Shooting star. After a rally this pattern can suggest a minor reversal in the trend. The star’s day must have the body close to the low for the period and the upper shadow should be long.
The results for a black shooting star were very positive. There were ten observations and each time within the next three days the price was around 13 points lower.
Hanging Man Shooting Star
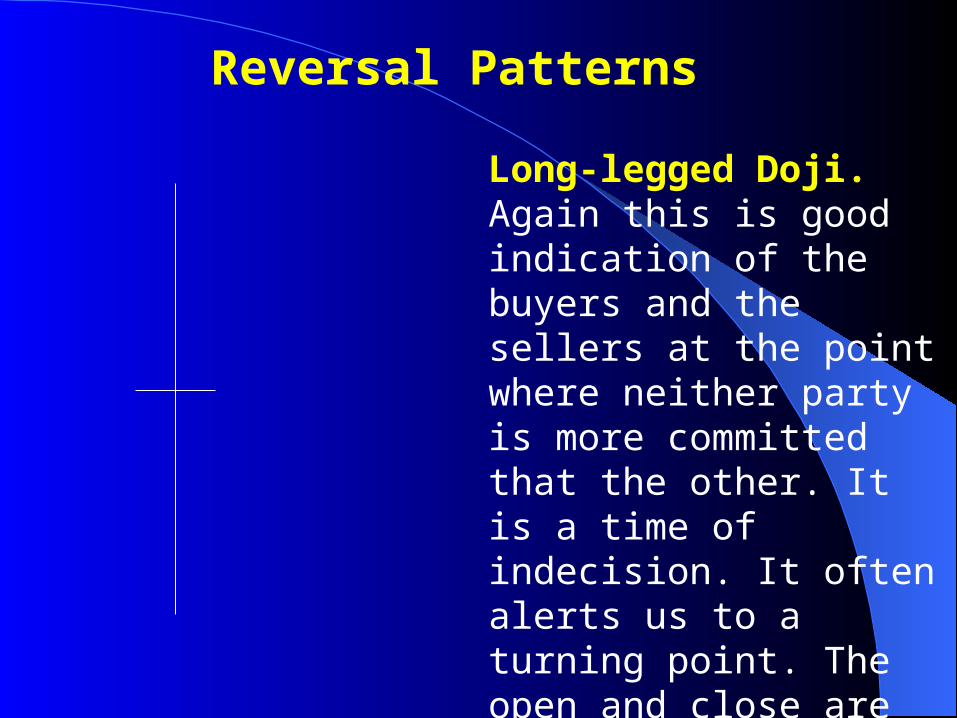
Long-legged Doji. Again this is good indication of the buyers and the sellers at the point where neither party is more committed that the other. It is a time of indecision. It often alerts us to a turning point. The open and close are at the same price while the range between the high and low are relatively large.
Reversal Patterns
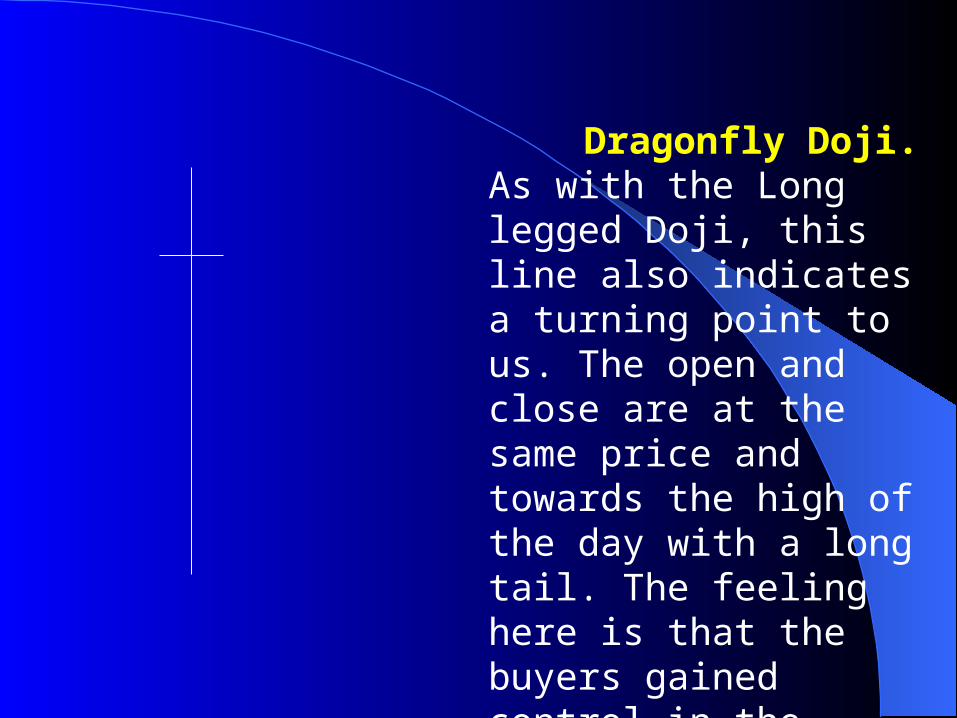
Dragonfly Doji. As with the Long legged Doji, this line also indicates a turning point to us. The open and close are at the same price and towards the high of the day with a long tail. The feeling here is that the buyers gained control in the latter part of the day.
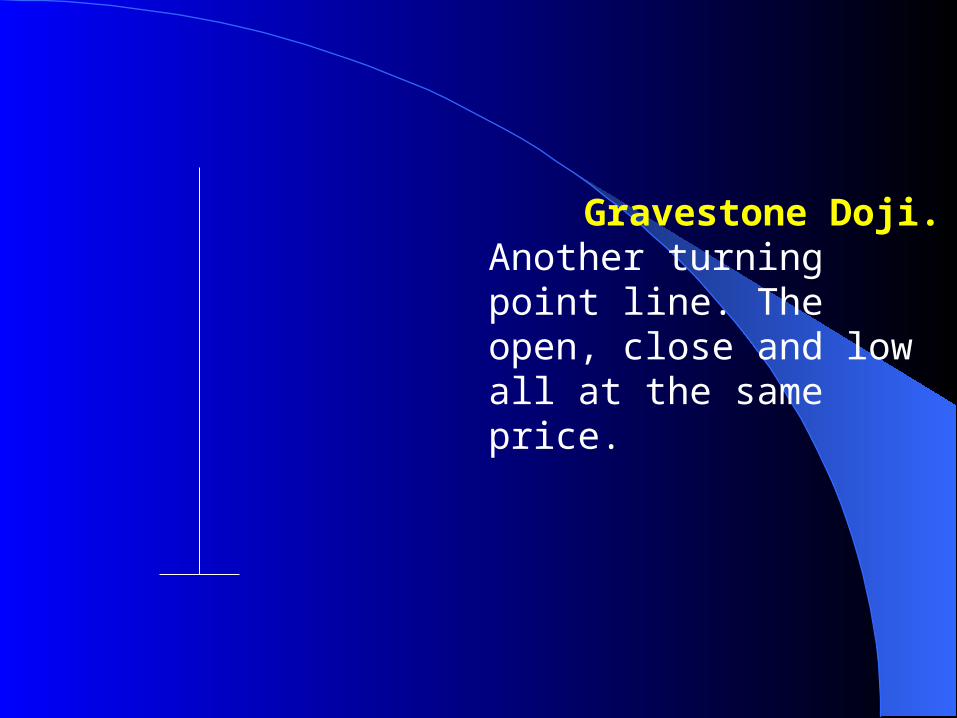
Gravestone Doji. Another turning point line. The open, close and low all at the same price.
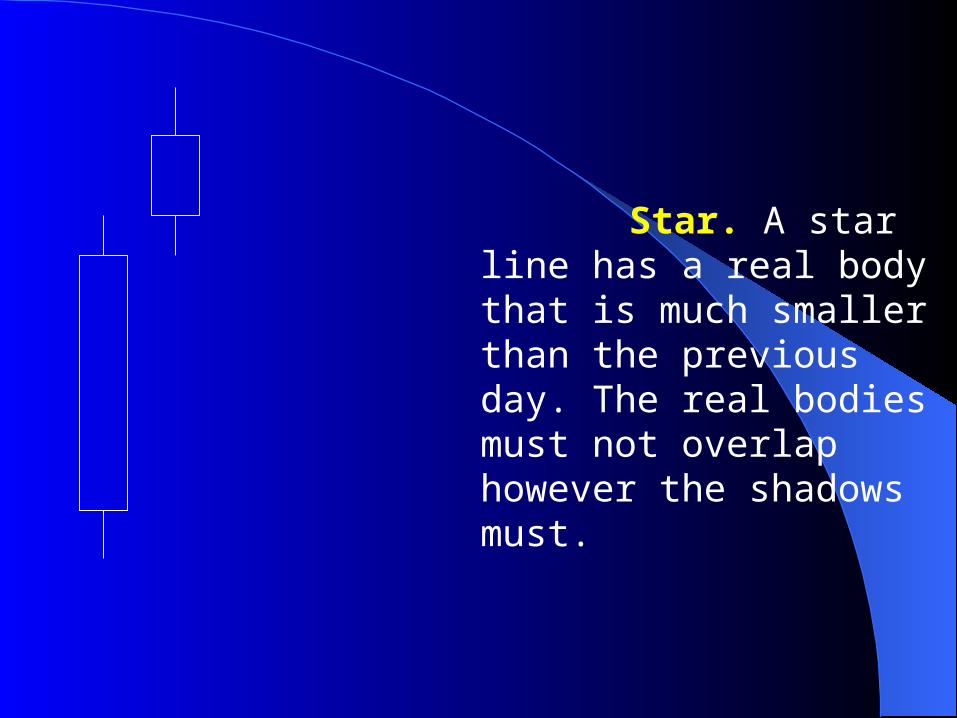
Star. A star line has a real body that is much smaller than the previous day. The real bodies must not overlap however the shadows must.
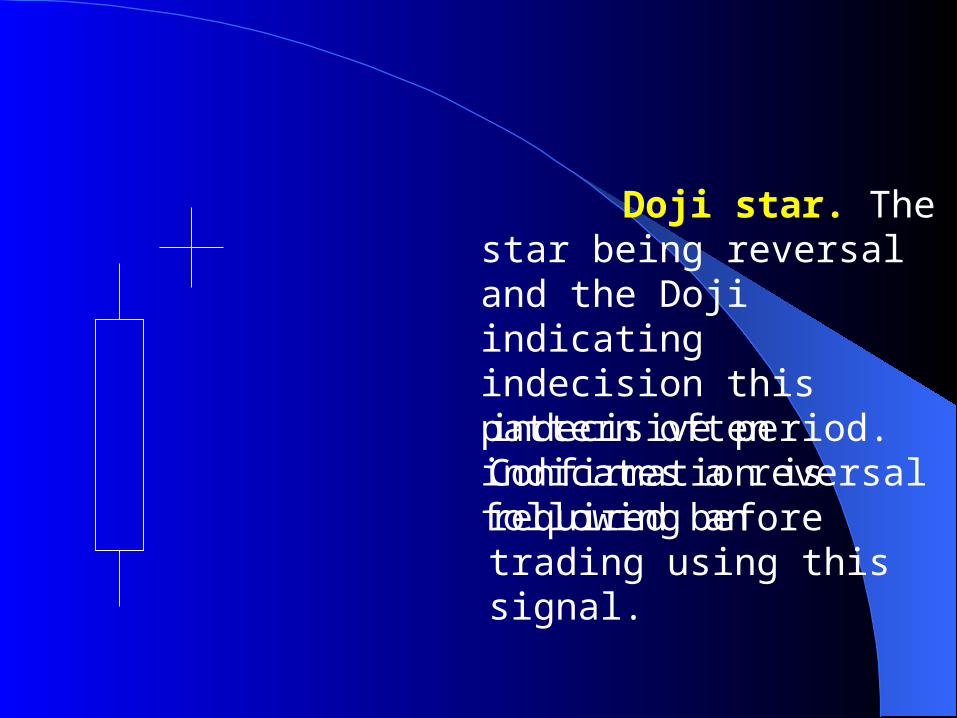
indecisive period. Confirmation is required before trading using this signal.
Doji star. The star being reversal and the Doji indicating indecision this pattern often indicates a reversal following an
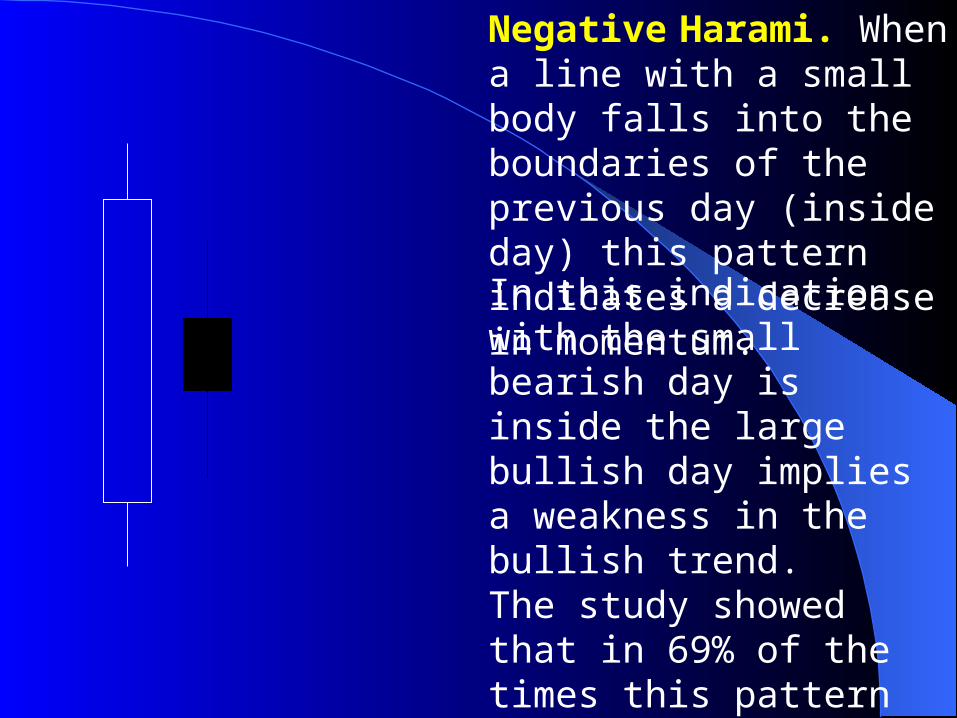
Negative Harami. When a line with a small body falls into the boundaries of the previous day (inside day) this pattern indicates a decrease in momentum.In this indication with the small bearish day is inside the large bullish day implies a weakness in the bullish trend.The study showed that in 69% of the times this pattern came up the share price drop within the next three days, on average 16 points.
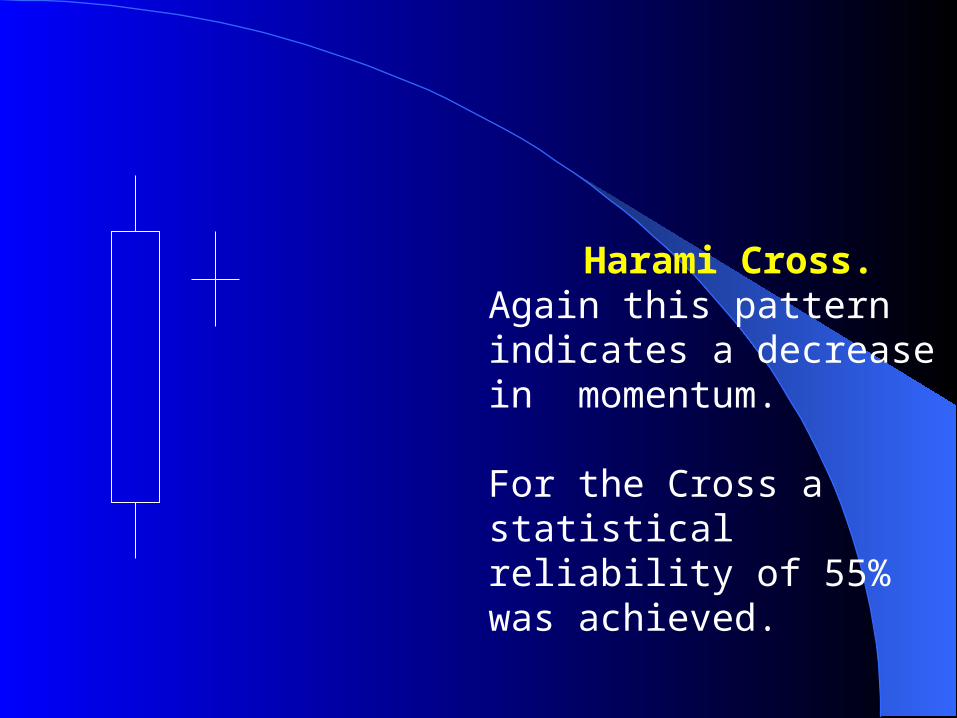
Harami Cross. Again this pattern indicates a decrease in momentum.
For the Cross a statistical reliability of 55% was achieved.
Neutral Patterns
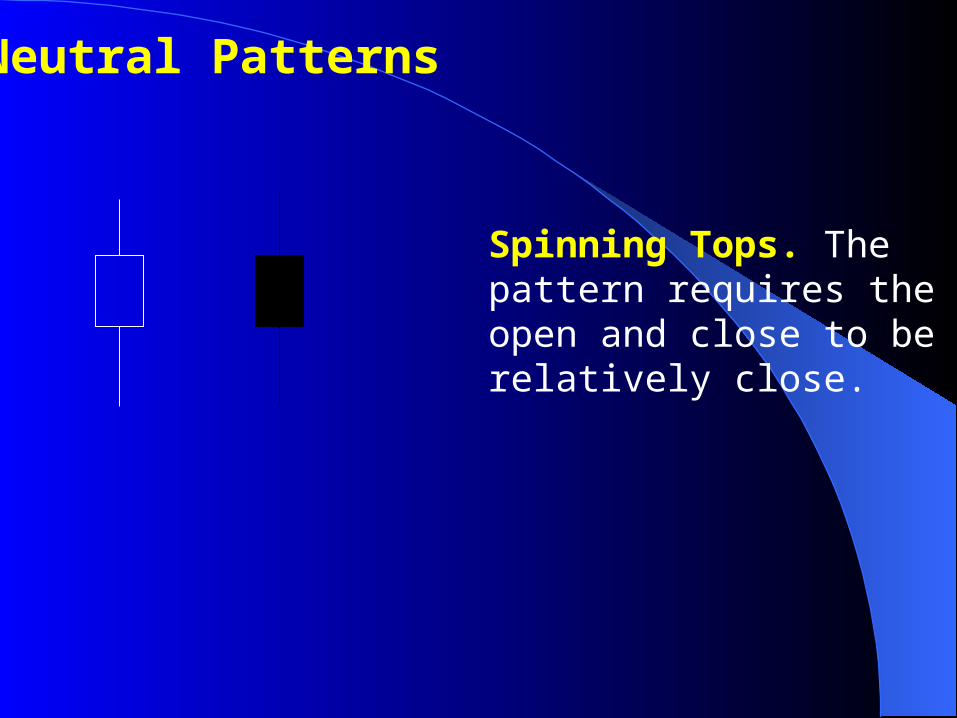
Spinning Tops. The pattern requires the open and close to be relatively close.
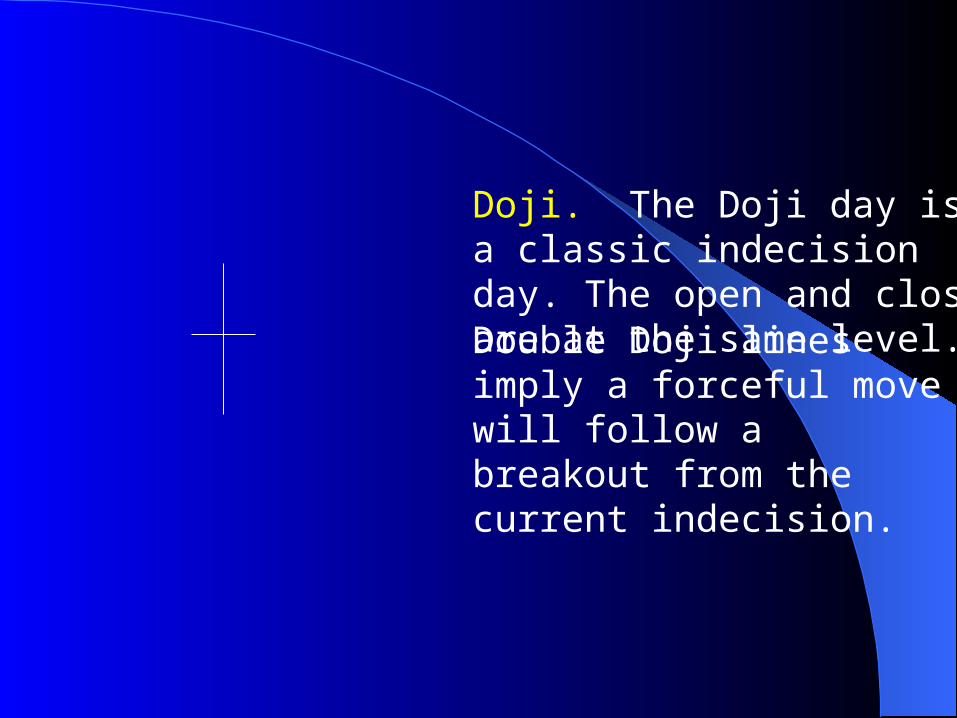
Doji. The Doji day is a classic indecision day. The open and close are at the same level.Double Doji lines imply a forceful move will follow a breakout from the current indecision.
Signals of candle formations should only be analyzed and evaluated in connection with the market context.
All signals of candle formations should be confirmedon the following day.
With the use of candles you may be able to highlight the opportunity earlier but there's nothing quite like confirmation.