Embed Size (px)
Citation preview
Raj Chetty
Using Big Data To Solve
Economic and Social Problems
Photo Credit: Florida Atlantic University
Chance that a child born to parents in the bottom fifth of
the income distribution reaches the top fifth:
The American Dream?

Chance that a child born to parents in the bottom fifth of
the income distribution reaches the top fifth:
Canada
Denmark
UK
USA
13.5%
11.7%
7.5%
9.0%Blanden and Machin 2008
Boserup, Kopczuk, and Kreiner 2013
Corak and Heisz 1999
Chetty, Hendren, Kline, Saez 2014
The American Dream?

Chance that a child born to parents in the bottom fifth of
the income distribution reaches the top fifth:
Chances of achieving the “American Dream” are almost
two times higher in Canada than in the U.S.
Canada
Denmark
UK
USA
13.5%
11.7%
7.5%
9.0%Blanden and Machin 2008
Boserup, Kopczuk, and Kreiner 2013
Corak and Heisz 1999
Chetty, Hendren, Kline, Saez 2014
The American Dream?
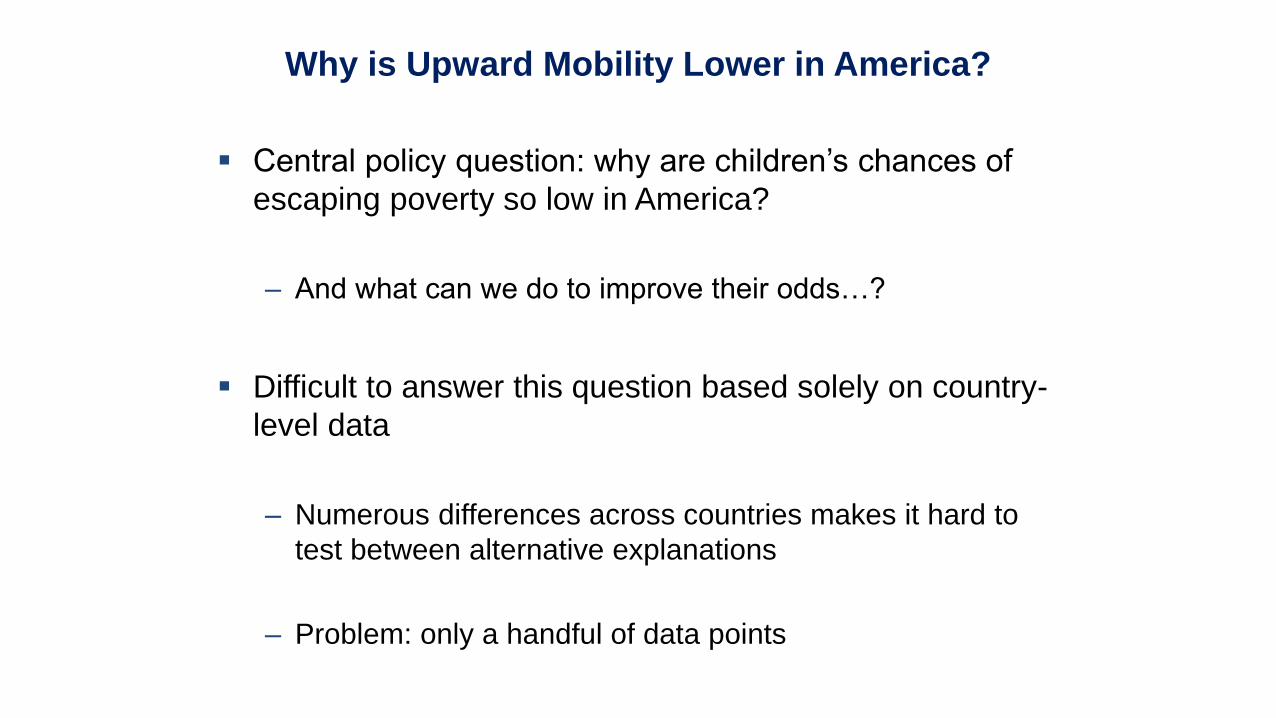
Central policy question: why are children’s chances of
escaping poverty so low in America?
– And what can we do to improve their odds…?
Difficult to answer this question based solely on country-
level data
– Numerous differences across countries makes it hard to
test between alternative explanations
– Problem: only a handful of data points
Why is Upward Mobility Lower in America?

Until recently, social scientists have had limited data to
study policy questions like this
Social science has therefore been a theoretical field
– Develop mathematical models (economics) or qualitative
theories (sociology)
– Use these theories to explain patterns and make policy
recommendations, e.g. to improve upward mobility
Theoretical Social Science
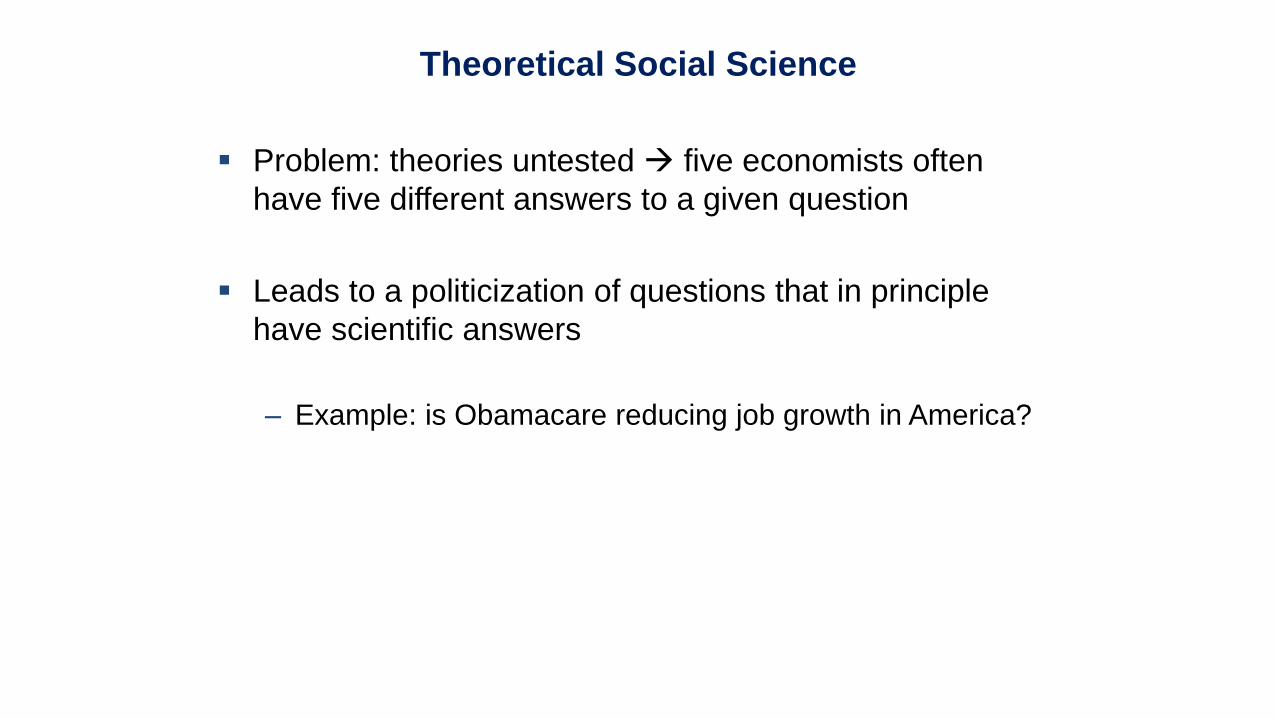
Problem: theories untested five economists often
have five different answers to a given question
Leads to a politicization of questions that in principle
have scientific answers
– Example: is Obamacare reducing job growth in America?
Theoretical Social Science

Today, social science is becoming a more empirical field
thanks to the growing availability of data
– Test and improve theories using real-world data
– Analogous to natural sciences
The Rise of Data and Empirical Evidence
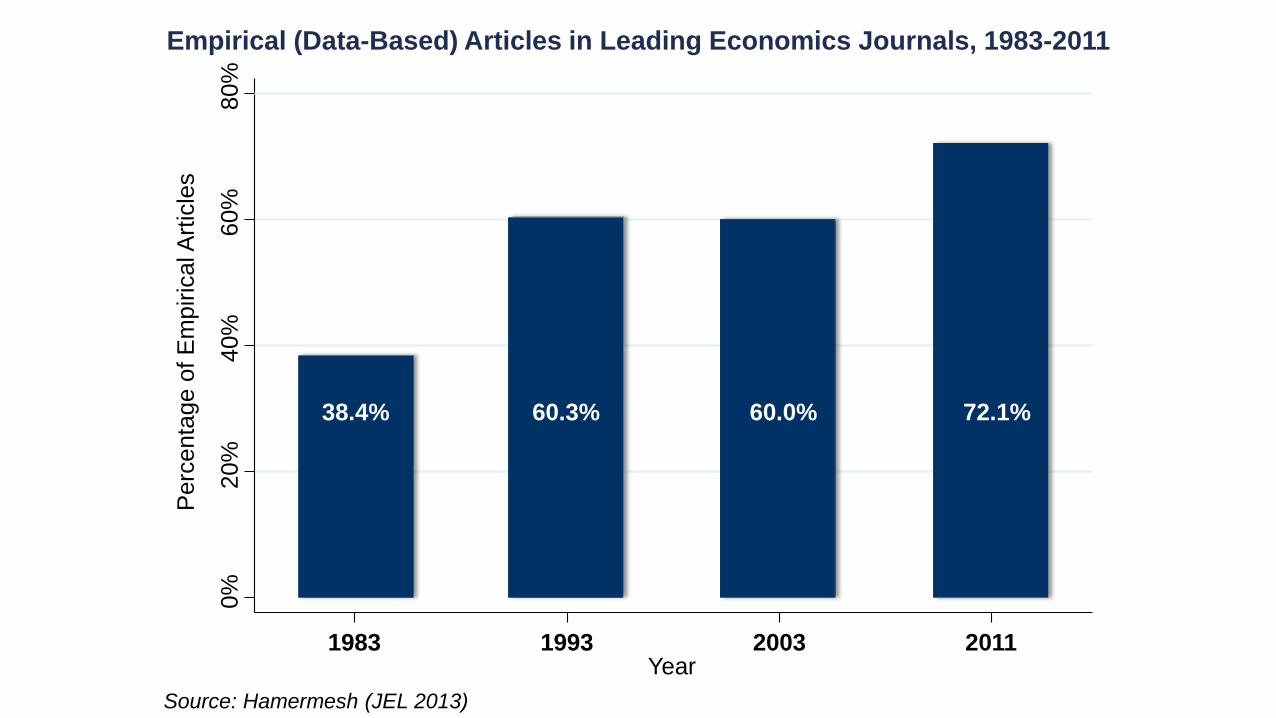
0%
20%
40%
60%
80%
1983 1993 2003 2011Year
38.4% 60.3% 60.0% 72.1%
Perc
enta
ge o
f E
mpiric
al A
rtic
les
Empirical (Data-Based) Articles in Leading Economics Journals, 1983-2011
Source: Hamermesh (JEL 2013)
Recent availability of “big data” has accelerated this trend
– Large datasets are starting to transform social science, as
they have transformed business
Examples:
– Government data: tax records, Medicare
– Corporate data: Facebook, retailer data
– Unstructured data: Twitter, newspapers
Social Science in the Age of Big Data

1. Greater reliability than surveys
2. Ability to measure new variables (e.g., emotions)
3. Universal coverage can “zoom in” to subgroups
4. Large samples can approximate scientific experiments
Why is Big Data Transforming Social Science?

Silicon Valley has been very successful in solving private-
sector problems using technology and big data
Goal of this course: show how same skills can be used to
address important social and economic problems
– We need more talent in this area given pressing
challenges such as rising inequality and global warming
To achieve this goal, provide an introduction to a broad
range of topics, methods, and real-world applications
Why This Course?
1. Equality of Opportunity
2. Education
3. Health
4. Environment
5. Criminal Justice and Discrimination
6. Political Polarization
Overview of Topics
1. Descriptive Data Analysis
2. Experiments
3. Quasi-Experiments
4. Machine Learning
5. Stata programming
Overview of Methods
Big data can be classified into two types
– “Long” data: many observations relative to variables
(e.g., tax records)
Methods: Two Types of “Big Data”


Big data can be classified into two types
– “Long” data: many observations relative to variables
(e.g., tax records)
– “Wide” data: few observations relative to variables
(e.g. Amazon clicks, newspapers)
Methods: Two Types of “Big Data”


Statistics/computer science has focused on “wide” data
– Main application: prediction
– Example: predicting income to target ads
Social science has focused on “long” data
– Main application: identifying causal effects
– Example: effects of improving schools on income
Methods: Two Types of “Big Data”

Lecture 1: Equality of Opportunity
1. Local Area Differences in Upward Mobility within America
2. Geographical Variation: Causal Effects of Places or Sorting?
3. Characteristics of Low vs. High Mobility Areas
Lecture 1 is based primarily on two papers:
Chetty, Hendren, Kline, Saez. “Where is the Land of Opportunity? The
Geography of Intergenerational Mobility in the U.S.” QJE 2014
Chetty and Hendren. “The Effects of Neighborhoods on Children’s Long-
Term Outcomes” 2017a, b

Part 1
Local Area Variation in Upward Mobility
Part 1Local Area Variation
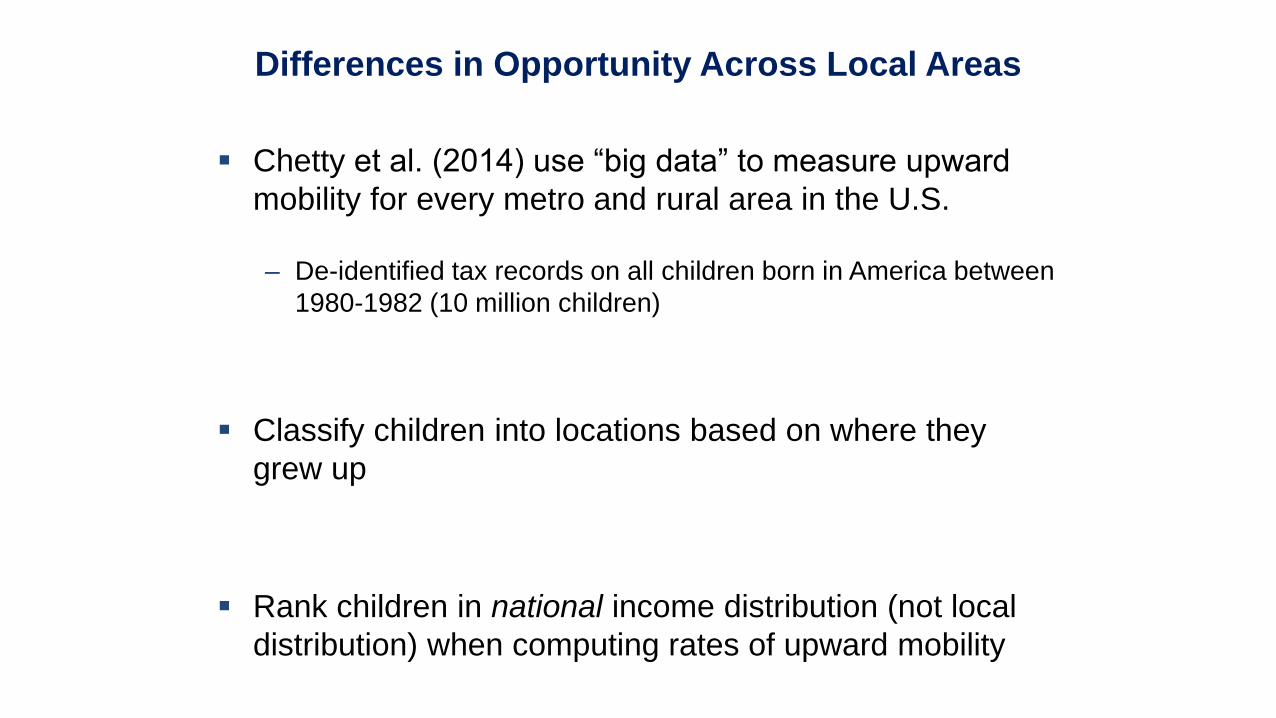
Chetty et al. (2014) use “big data” to measure upward
mobility for every metro and rural area in the U.S.
– De-identified tax records on all children born in America between
1980-1982 (10 million children)
Classify children into locations based on where they
grew up
Rank children in national income distribution (not local
distribution) when computing rates of upward mobility
Differences in Opportunity Across Local Areas

The Geography of Upward Mobility in the United States
Chances of Reaching the Top Fifth Starting from the Bottom Fifth by Metro Area
San
Jose
12.9%
Salt Lake City 10.8%Atlanta 4.5%
Washington DC 11.0%
Charlotte 4.4%
Note: Lighter Color = More Upward Mobility
Download Statistics for Your Area at www.equality-of-opportunity.org
Minneapolis 8.5%
Chicago
6.5%
New York City 10.5%
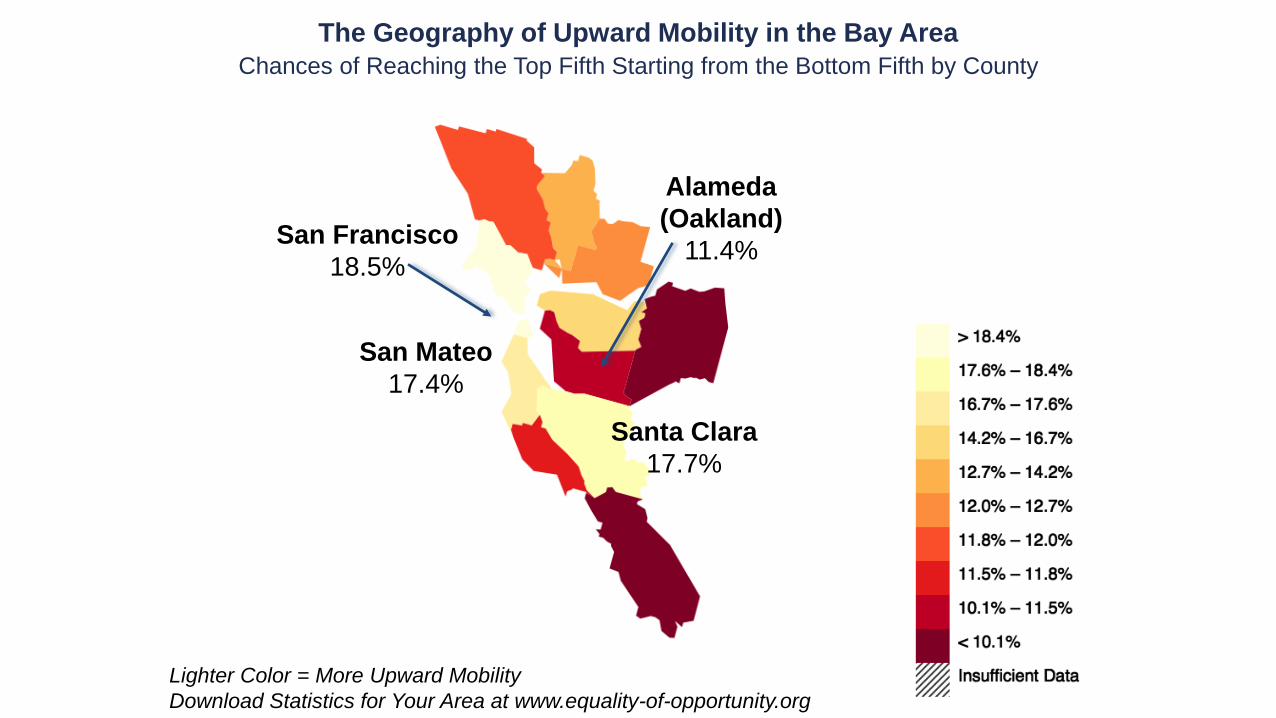
The Geography of Upward Mobility in the Bay Area
San Mateo
17.4%
Santa Clara
17.7%
Alameda
(Oakland)
11.4%San Francisco
18.5%
Lighter Color = More Upward Mobility
Download Statistics for Your Area at www.equality-of-opportunity.org
Chances of Reaching the Top Fifth Starting from the Bottom Fifth by County
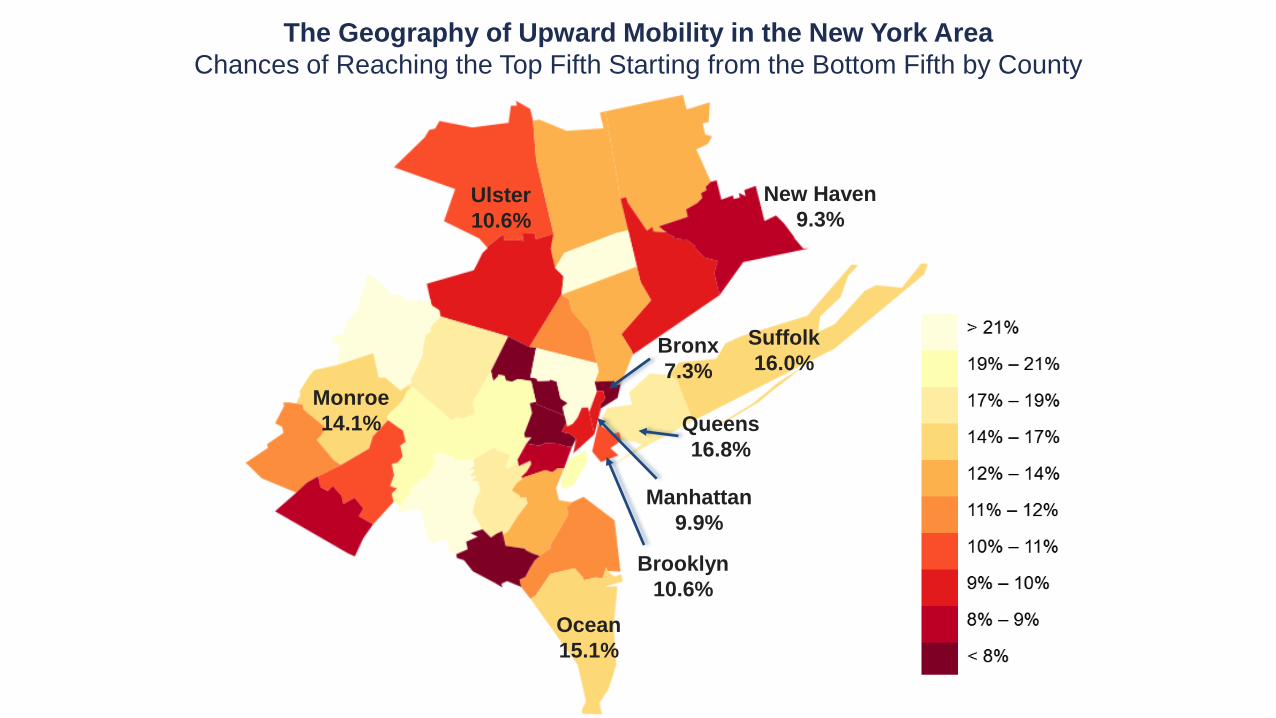
Bronx
7.3%
Queens
16.8%
Manhattan
9.9%
Ocean
15.1%
New Haven
9.3%
Suffolk
16.0%
Ulster
10.6%
Monroe
14.1%
The Geography of Upward Mobility in the New York Area
Chances of Reaching the Top Fifth Starting from the Bottom Fifth by County
Brooklyn
10.6%

Part 1
Local Area Variation in Upward Mobility
Part 2Causal Effects of Neighborhoods

Causal Effects of Neighborhoods vs. Sorting
Two very different explanations for variation in children’s
outcomes across areas:
1. Sorting: different people live in different places
2. Causal effects: places have a causal effect on upward
mobility for a given person
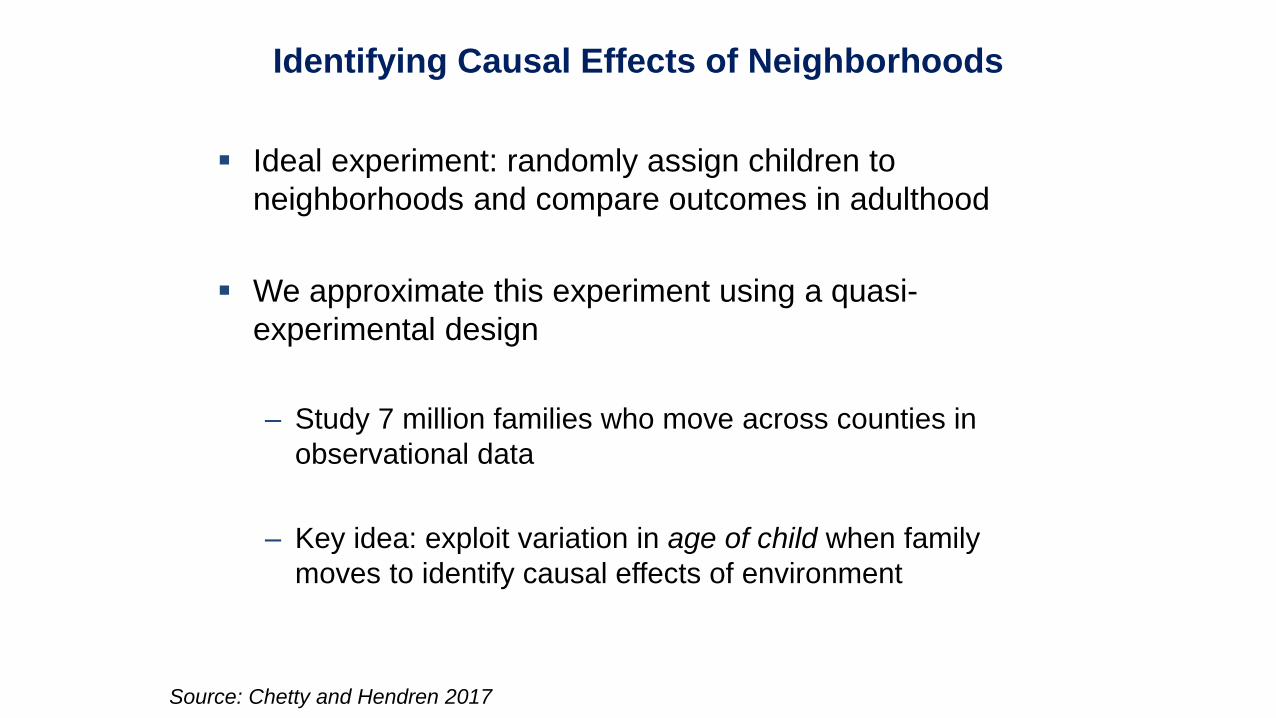
Identifying Causal Effects of Neighborhoods
Ideal experiment: randomly assign children to
neighborhoods and compare outcomes in adulthood
We approximate this experiment using a quasi-
experimental design
– Study 7 million families who move across counties in
observational data
– Key idea: exploit variation in age of child when family
moves to identify causal effects of environment
Source: Chetty and Hendren 2017

0%
20%
40%
60%
80%
100%
10 15 20 25 30
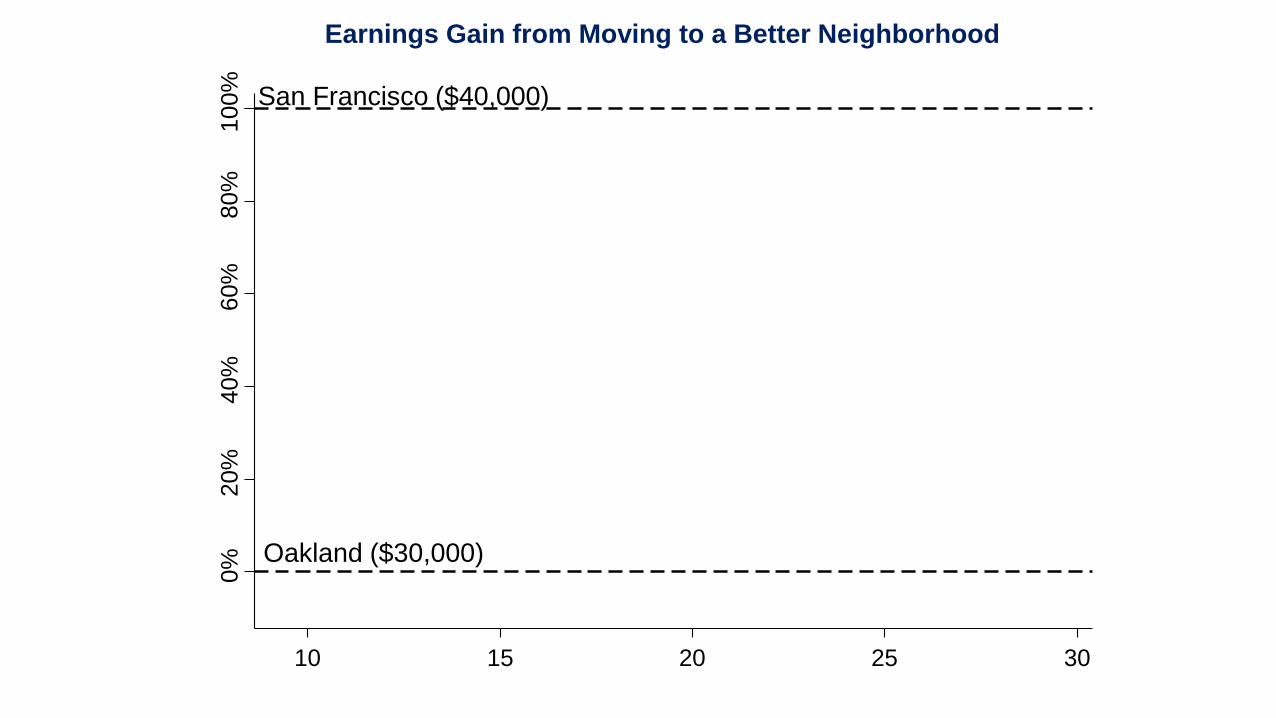
Oakland ($30,000)
Earnings Gain from Moving to a Better Neighborhood
0%
20%
40%
60%
80%
100%
10 15 20 25 30
Oakland ($30,000)
Earnings Gain from Moving to a Better Neighborhood
San Francisco ($40,000)

0%
20%
40%
60%
80%
100%
10 15 20 25 30
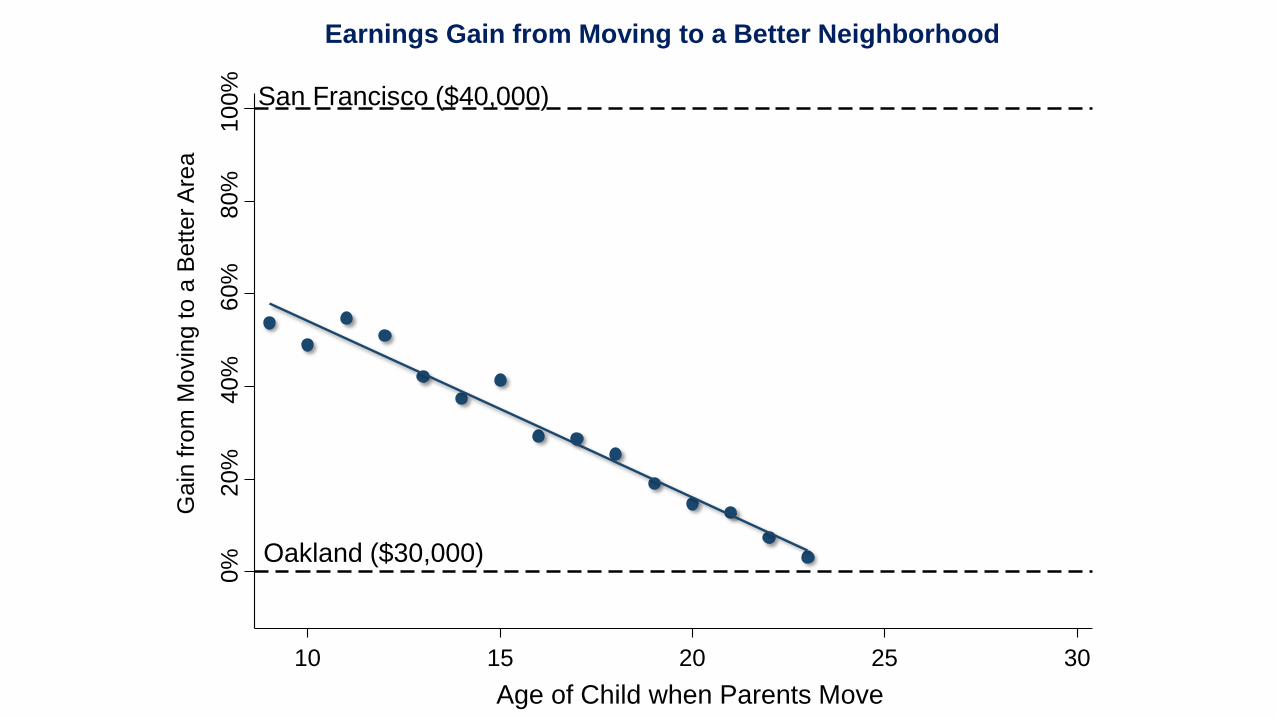
Age of Child when Parents Move
Gain
fro
m M
ovin
g t
o a
Better A
rea
Oakland ($30,000)
Earnings Gain from Moving to a Better Neighborhood
Move at age 9 54% of gain from
growing up in San Francisco since birth
San Francisco ($40,000)
0%
20%
40%
60%
80%
100%
10 15 20 25 30
Age of Child when Parents Move
Gain
fro
m M
ovin
g t
o a
Better A
rea
Oakland ($30,000)
Earnings Gain from Moving to a Better Neighborhood
San Francisco ($40,000)
0%
20%
40%
60%
80%
100%
10 15 20 25 30
Age of Child when Parents Move
Gain
fro
m M
ovin
g t
o a
Better A
rea
Oakland ($30,000)
Earnings Gain from Moving to a Better Neighborhood
San Francisco ($40,000)
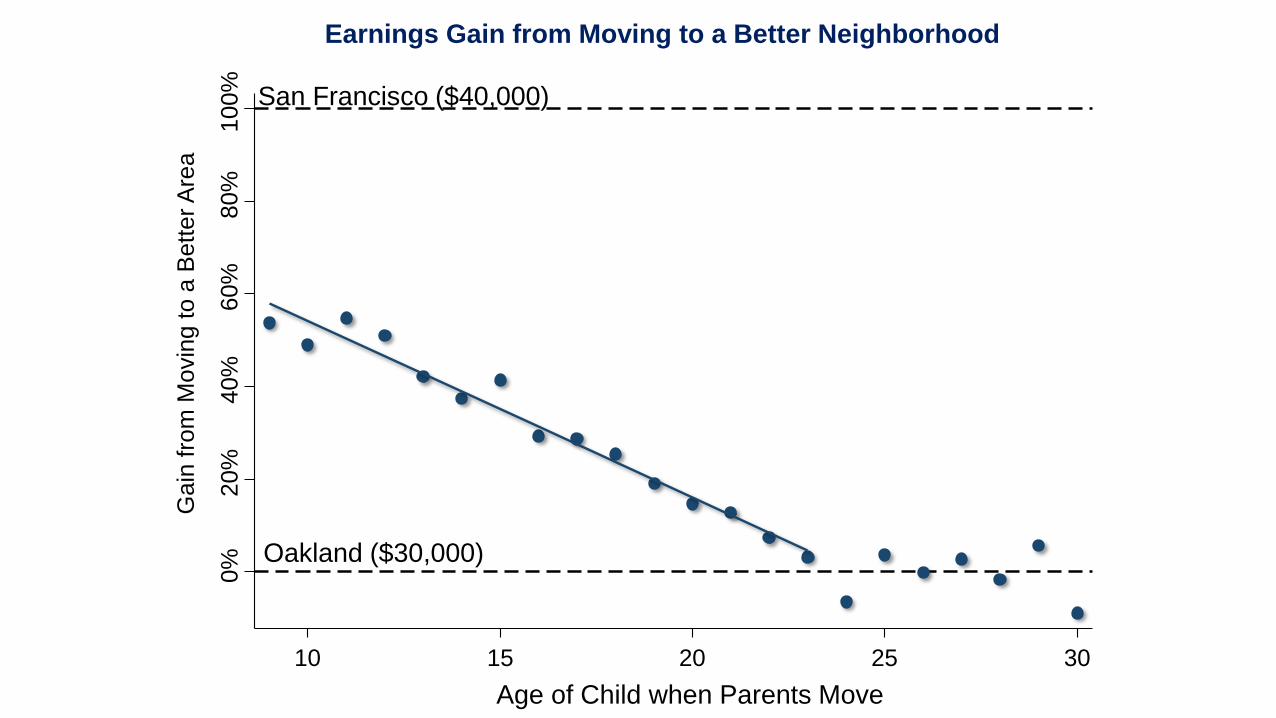
Identifying Causal Effects of Neighborhoods
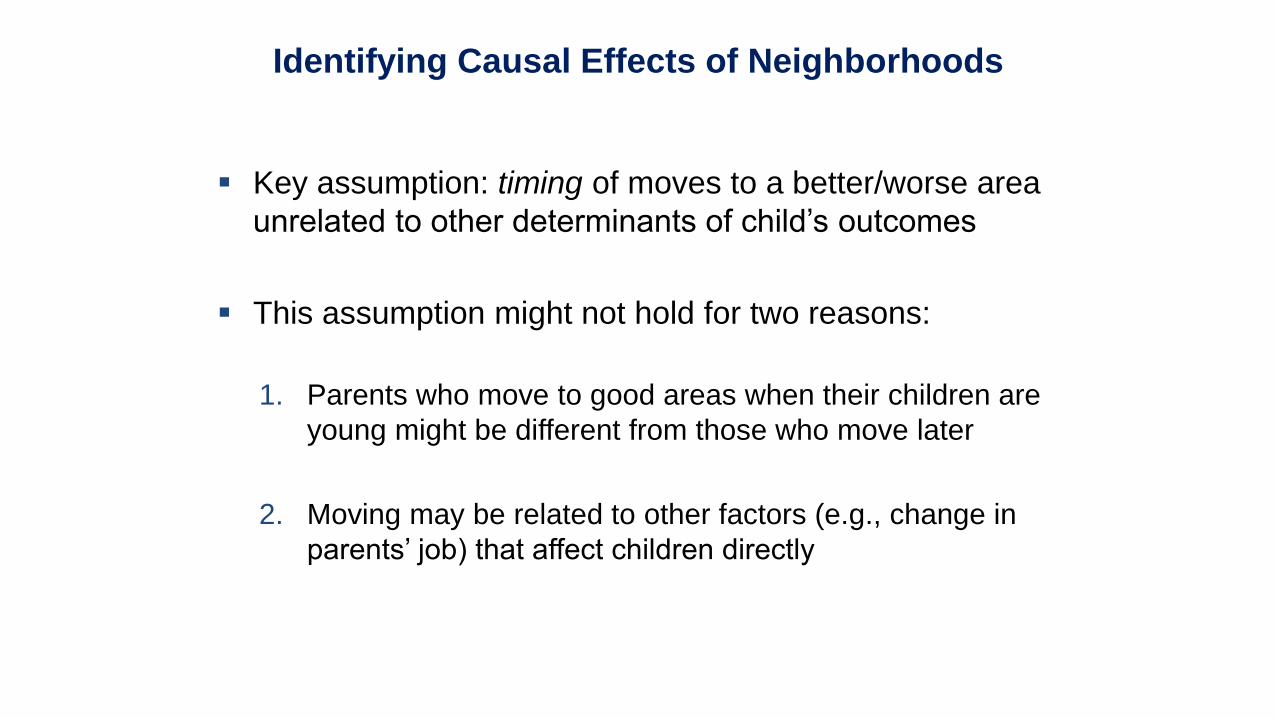
Key assumption: timing of moves to a better/worse area
unrelated to other determinants of child’s outcomes
This assumption might not hold for two reasons:
1. Parents who move to good areas when their children are
young might be different from those who move later
2. Moving may be related to other factors (e.g., change in
parents’ job) that affect children directly

Identifying Causal Effects of Neighborhoods
Two approaches to evaluating validity of this assumption:
1. Compare siblings’ outcomes to control for family effects

Identifying Causal Effects of Neighborhoods
Two approaches to evaluating validity of this assumption:
1. Compare siblings’ outcomes to control for family effects
2. Use differences in neighborhood effects across subgroups
to implement “placebo” tests
– Ex: some places (e.g., low-crime areas) have better
outcomes for boys than girls
– Move to a place where boys have high earnings son
improves in proportion to exposure but daughter does not
Causal Effects of Neighborhoods: Summary
Key lesson of this section: 70-80% of the variation in children’s
outcomes across areas is due to causal effects
This result has refocused public discussion on improving
upward mobility in America to a local level


Part 1
Local Area Variation in Upward Mobility
Part 3Characteristics of High-Mobility Areas
Why Does Upward Mobility Differ Across Areas?
Why do some places produce much better outcomes for disadvantaged
children than others?
Begin by characterizing the features of areas with high rates of upward
mobility
Five Strongest Correlates of Upward Mobility
1. Segregation
– Greater racial and income segregation associated with lower levels of mobility
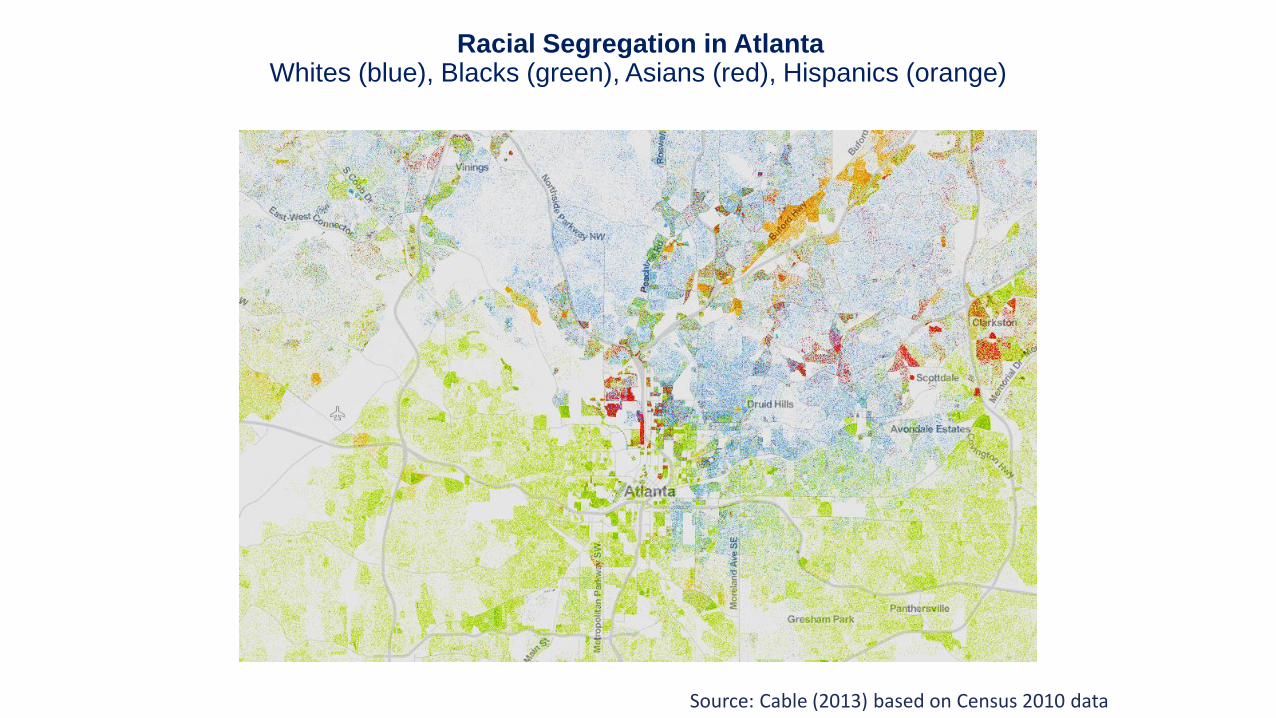
Racial Segregation in AtlantaWhites (blue), Blacks (green), Asians (red), Hispanics (orange)
Source: Cable (2013) based on Census 2010 data

Racial Segregation in SacramentoWhites (blue), Blacks (green), Asians (red), Hispanics (orange)
Source: Cable (2013) based on Census 2010 data
Five Strongest Correlates of Upward Mobility
1. Segregation
2. Income Inequality
– Places with smaller middle class have much less mobility
Five Strongest Correlates of Upward Mobility
1. Segregation
2. Income Inequality
3. School Quality
– Higher expenditure, smaller classes, higher test scores correlated with more mobility

Five Strongest Correlates of Upward Mobility
1. Segregation
2. Income Inequality
3. School Quality
4. Family Structure
– Areas with more single parents have much lower mobility
– Strong correlation even for kids whose own parents are married

Five Strongest Correlates of Upward Mobility
1. Segregation
2. Income Inequality
3. School Quality
4. Family Structure
5. Social Capital
– “It takes a village to raise a child”
– Putnam (1995): “Bowling Alone”