Embed Size (px)
Citation preview
Instructions for authors, subscriptions and further details:
http://redimat.hipatiapress.com
Using a New Schema Approach with Primary at Risk Students in Word Problem Solving Parvaneh Amiripour1, John Arthur Dossey2 and Ahmad Shahvarani1 1) Islamic Azad University 2) Illinois State University
Date of publication: October 24th, 2017 Edition period: October 2017-February 2018
To cite this article: Amiripour, P, Dossey, J.A., & Shahvarani, A. (2017).
Using a new schema approach with primary at-risk students in word problem
solving. REDIMAT, 6(3), 228-255. doi: 10.1783/redimat.2017.2612
To link this article: http://dx.doi.org/10.17583/redimat.2017.2612
PLEASE SCROLL DOWN FOR ARTICLE
The terms and conditions of use are related to the Open Journal System and
to Creative Commons Attribution License (CC-BY).
REDIMAT, Vol. 6 No. 3 October 2017 pp. 228-255
2017 Hipatia Press
ISSN: 2014-3621
DOI: 10.17583redimat.2017.2612
Using a New Schema Approach
with Primary At-Risk Students in
Word Problem Solving
Parvaneh Amiripour Islamic Azad University
John A. Dossey Illinois State University
Ahmad Shahvarani Islamic Azad University
(Received: 03 March 2017; Accepted: 06 October 2017; Published: 24 October 2017)
Abstract
This comparative study of two approaches contrasts a schema-based approach to
represent a solution approach to solving whole number contextual problems for
grades 2 and 3 with the traditional textbook approach. The participants are 9 to 11-
year-old Afghani refugee students enrolled in non-public schools administered by
NGO organization in Iran. The subjects have difficulty with grade-level
mathematics and have been retained in grade at least one year. Subjects were
randomly selected from four classrooms in two schools. The schema-based
experimental approach is called the Problem Patterns (PP) approach. Students
receiving this instructional approach were taught to break problems into data, units,
and desired solution, removing irrelevant information, and make a solution model
with manipulatives. Control students followed the traditional classroom approach.
All classes were taught by the first researcher. Evaluation results showed the PP
students had higher achievement and growth scores than the control students. The
results also showed the schema building portion of instruction contributed most to
the differences in performance of the experimental groups’ students.
Keywords: Mathematical learning, problem pattern approach, schema-based
problem solving, word problems, at-risk students
REDIMAT, Vol. 6 No. 3 Octubre 2017 pp. 228-255
2017 Hipatia Press
ISSN: 2014-3621
DOI: 10.17583redimat.2017.2612
Uso de un Nuevo Enfoque
Esquemático de Resolución de
Problemas con Palabras con
Estudiantes de Primaria en
Riesgo
Parvaneh Amiripour Islamic Azad University
John A. Dossey Illinois State University
Ahmad Shahvarani Islamic Azad University
(Recibido: 03 Marzo 2017; Aceptado: 06 Octubre 2017; Publicado: 24 Octubre 2017) Resumen
En este estudio se comparan dos enfoques, uno basado en esquemas para representar
una forma de solución para resolver problemas contextuales con números enteros
para los grados 2 y 3, con otro basado en el enfoque tradicional del libro de texto.
Los participantes son estudiantes refugiados afganos de 9 a 11 años inscritos en
escuelas no públicas administradas por una organización no gubernamental en Irán.
Los sujetos fueron seleccionados al azar de cuatro clases en dos escuelas. Los
estudiantes en el grupo de control siguieron el enfoque tradicional de la clase. Todas
las clases fueron impartidas por el primer investigador. Los resultados de evaluación
muestran que los alumnos que usaron el enfoque PP tuvieron un mejor rendimiento
que los alumnos en el grupo de control. Los resultados también muestran que la
porción de formación de esquemas de la enseñanza fue lo que más contribuyó a las
diferencias en rendimiento de los estudiantes en el grupo experimental.
Palabras clave: Estudiantes en riesgo, aprendizaje matemático, enfoque de
patrones de problemas, resolución de problemas basada en esquemas
Amiripour, Dossey & Shahvarani – New Schema Approach
228
tudies of elementary students’ achievement and progress in
mathematics highlights the important role played by the ability to
establish and develop the fundamental skills in solving numerical
problems delivered in context (National Mathematics Advisory Panel,
2008). This study focuses on a new approach to teaching and assessing
instruction for at-risk second and third grade students’ in mastering such
skills and procedures. With numeracy skills needed more than ever in the
work place, today’s students must be able to compute fluently, engage in
logical reasoning and use mathematics to tackle novel problems. However,
PISA 2012 results show that only a minority of 15-year-old students in
most countries grasp and can work with core mathematics
concepts…'Opportunity to learn' refers to the content taught in the
classroom and the time a student spends learning this content. Not all
students, not even those in the same school, experience equal opportunities
to learn. Reducing inequalities in access to mathematics is not an
impossible task. PISA results show that performance disparities between
socio-economically advantaged and disadvantaged students are largely
linked to differences in students’ familiarity with mathematics. Thus,
raising disadvantaged students’ opportunities to learn mathematics concepts
and processes may help reduce inequalities and improve the average level
of performance” (OECD, 2016, p. 13).
McCann & Austin (1988) described three features of an at-risk student: • Learner in severe danger of not attaining the ends of
education exhibited through failure to reach local or state
standards for high school graduation and/or failure to gain
the understandings, skills, and dispositions to become an
industrious participant of society.
• Learner who displays actions that instructors categorize as
interfering with the learning and educational processes
• Learner whose domestic or community upbringing and/or
experience may place him or her at-risk. Conventionally,
educationalists have examined the economic status of
students and used it as an initial indication in efforts to
determine if a student is at-risk of not succeeding in
school. (p. 4)
S
REDIMAT 6(3)
229
Mathematics Difficulties at the Elementary Level
Mathematics difficulties (MD) at the elementary level, in addition to the
growth of at-risk factors, lead to long-term difficulties in learning. "In the
absence of effective interventions, many students who enter first grade with
mathematics delays stay behind throughout their school careers" (Morgan et
al., 2009, p. 311). When these children enter school with difficulties, they
are unable to experience the same progress and success as their
counterparts. This, in turn, leads to a pattern of unpreparedness for
mathematics instruction in the following elementary grades (Jordan, 2007;
Jordan et al., 2006; National Mathematics Advisory Panel, 2008; National
Research Council, 2009; Starkey et al., 2004). These reports indicate that
"low-income children comprise 76% of fourth graders who scored in the
lowest 25% for mathematics, an increase of 2% from earlier reports."
These, and other, results suggest that the use of effective and systematic
intervention for MDs is so important for at-risk children with difficulties in
culture, social, and educational venues. Assessments of number
competencies and skills are a major estimate of the degree of mathematics
achievement these students will experience (Jordan et al., 2009, p. 862).
The level of mathematics achievement of kindergarten children is
constantly found to be a major predictor of mathematics achievement in
later grades (Claessens et al., 2009; Duncan et al., 2007; Duncan &
Magnuson, 2011). "Understanding of number concepts and relations helps
children perform arithmetic operations and can be applied to other
mathematical domains such as measurement, data analysis, and geometry"
(National Research Council, 2009, p. 332). Children, who have difficulties
with number competencies and rote memorization, will have difficulties in
skills for PS, arithmetic and computation (Robinson et al., 2002). The
Common Core State Standards in Mathematics (CCSSM) reported that "by
the end of kindergarten, children should be able to count to 100 by ones and
tens, write numbers from 0 to 20, understand one-to-one correspondence
and cardinality, compare numbers, solve addition and subtraction problems
with objects, solve word problems (WP), and fluently add and subtract
within five, among other skills" (National Governors Association Center for
Best Practices & Council of Chief State School Officers, 2010, p. 332).
Practices that are based in understanding contribute to learners'
Amiripour, Dossey & Shahvarani – New Schema Approach
230
knowledge through 'long-term representations' of combinations. An early
focus on conceptual understanding and representations of such knowledge
forms a basis that is accessible for application in future contexts (Fuchs et
al., 2013; Jordan, 2007).
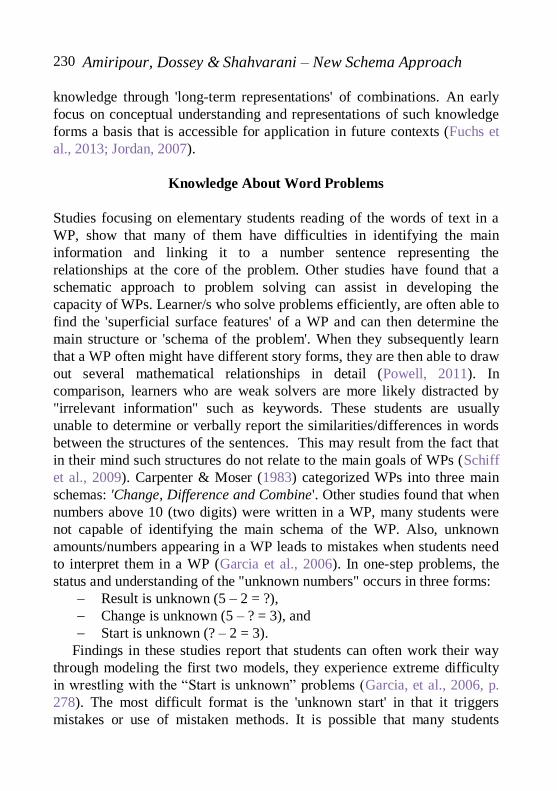
Knowledge About Word Problems
Studies focusing on elementary students reading of the words of text in a
WP, show that many of them have difficulties in identifying the main
information and linking it to a number sentence representing the
relationships at the core of the problem. Other studies have found that a
schematic approach to problem solving can assist in developing the
capacity of WPs. Learner/s who solve problems efficiently, are often able to
find the 'superficial surface features' of a WP and can then determine the
main structure or 'schema of the problem'. When they subsequently learn
that a WP often might have different story forms, they are then able to draw
out several mathematical relationships in detail (Powell, 2011). In
comparison, learners who are weak solvers are more likely distracted by
"irrelevant information" such as keywords. These students are usually
unable to determine or verbally report the similarities/differences in words
between the structures of the sentences. This may result from the fact that
in their mind such structures do not relate to the main goals of WPs (Schiff
et al., 2009). Carpenter & Moser (1983) categorized WPs into three main
schemas: 'Change, Difference and Combine'. Other studies found that when
numbers above 10 (two digits) were written in a WP, many students were
not capable of identifying the main schema of the WP. Also, unknown
amounts/numbers appearing in a WP leads to mistakes when students need
to interpret them in a WP (Garcia et al., 2006). In one-step problems, the
status and understanding of the "unknown numbers" occurs in three forms:
Result is unknown (5 – 2 = ?),
Change is unknown (5 – ? = 3), and
Start is unknown (? – 2 = 3).
Findings in these studies report that students can often work their way
through modeling the first two models, they experience extreme difficulty
in wrestling with the “Start is unknown” problems (Garcia, et al., 2006, p.
278). The most difficult format is the 'unknown start' in that it triggers
mistakes or use of mistaken methods. It is possible that many students
REDIMAT 6(3)
231
attempt to reword/rework WP into this style: ? – 2 = 3 → 3+2 = 5. It seems
that maybe some students are unable to find form, or format, to apply when
they face such WP contexts. To develop real efficiency with at-risk students
with WPs, it appears that we may have to follow another teaching method
for WPs (Kroesbergen et al., 2003). There are many direct approaches for
teaching students WPs to at-risk students (Jitendra & Xin, 1997). These
direct approaches to WPs include:
Diagramming WPs (Van Garderen, 2007),
Identifying keywords and solving with emphasis on the keywords,
Using computer-assisted instruction with direct step-by-step
strategies (Mastropieri et al., 1997),
Using 'mnemonic tools' to guide WPs (Miller & Mercer, 1993),
Teaching meta-cognitive approaches to control WPs process (Case
et al., 1992);
Using a checklist of steps to solve WPs along with supervising
using meta-cognitive approaches (Montague & Applegate, 2000).
A progressive approach to helping at-risk students learn how to solve
WPs, which has been improved over the last 30 years, is the use of a
'schematic diagram' to solve WPs (e.g., Fuchs et al., 2004; Jitendra & Hoff,
1996). "WP instruction using schemas differs from typical WP instruction
(e.g., key words, checklist of steps) because students first identify a WP as
belonging to a problem type and then use a specific problem-type schema to
solve the problem" (p. 3). In routine WP teaching, students may identify
WP information or/and follow a mnemonic tool to work step-by-step during
WPs. It seems that students, and especially at-risk students require many
teaching approaches when they solve WPs. One of these approaches is the
use of schema embedded in concrete models. Such an approach, which we
call the Problem Pattern (PP) approach, is at the core of our study.
Method
Participants
Two grades 2 and two grades 3 classes were purposeful selected from each
of the four participating schools administrated by the non-governmental
organizations: Society for Protecting the Rights of the Child and the
Amiripour, Dossey & Shahvarani – New Schema Approach
232
Association of Protection of Children Labor. Such societies in Iran focus on
at-risk children in education, health care, consultative services for families,
and life skills training for children injured in war and natural disasters. In
the present study, all the students selected were at-risk Afghani students
living in the southern sectors of Tehran. Further, these students laboured a
portion of each day as sellers in the markets or in performing menial labour.
Participants from the classes were then purposefully selected using the
criteria of having a record of mathematical difficulties and having been
retained in grade at least once so far in their schooling. These students’
classrooms were then randomly assigned to be either in a control or
experimental classroom.
Instruments
The researcher sought and created a variety of measures of aspects of
number and operation items to use in assessing student learning of WPs
learning throughout study. The instruments included pretests and posttests,
and four interim tests given at two-week intervals throughout study,
including the beginning and end of the study. Each test consisted of ten-
word problems (WPs) attuned to the lessons so that they contained the same
variety of difficulty levels of problems for each grade: easy (2 questions),
difficult (4 questions), and very difficult (4 questions). In the pretests, some
of the WPs had irrelevant information added, while other problems
included cases that required students to carefully relate the information
involved to develop a final solution to the problem. Some of WPs required
more than one operation. In the second grade, WPs required two operators:
addition or subtraction. However, WPs for third graders required up to four
main operations: addition, subtraction, multiplication, or division. For
pretests and posttests, ten WPs were developed following the same
difficulty structure. Some of the WPs had added information and some
required more than one operation for solving them. Each test had a total
possible score of 20 points (See Table 1). These tests were examined by
teachers in the schools and by university mathematics educators. Both
groups agreed that the items were appropriate for the grade levels and
appropriately classified with respect to difficulty. Thus, the tests were
accepted as valid measures of student achievement. With respect to the
reliability of the mathematical tests developed for pretests, interim tests,
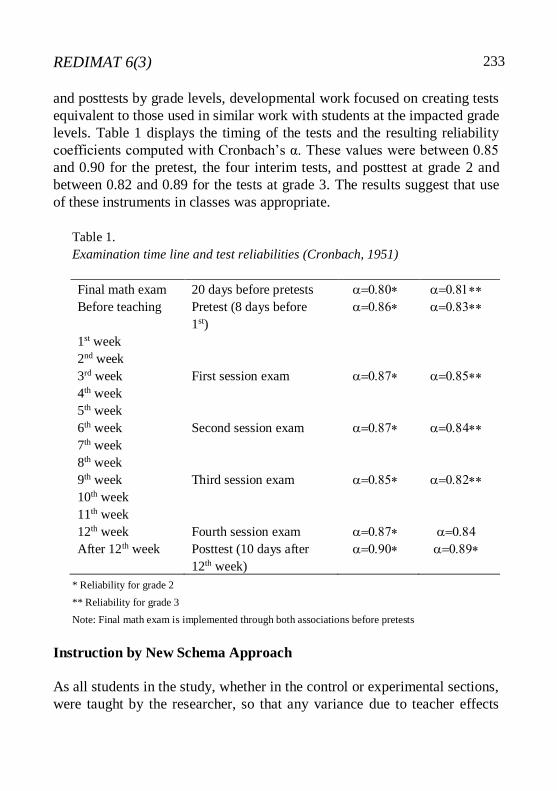
REDIMAT 6(3)
233
and posttests by grade levels, developmental work focused on creating tests
equivalent to those used in similar work with students at the impacted grade
levels. Table 1 displays the timing of the tests and the resulting reliability
coefficients computed with Cronbach’s α. These values were between 0.85
and 0.90 for the pretest, the four interim tests, and posttest at grade 2 and
between 0.82 and 0.89 for the tests at grade 3. The results suggest that use
of these instruments in classes was appropriate.
Table 1.
Examination time line and test reliabilities (Cronbach, 1951)
Final math exam 20 days before pretests
Before teaching Pretest (8 days before
1st)
1st week
2nd week
3rd week First session exam
4th week
5th week
6th week Second session exam
7th week
8th week
9th week Third session exam
10th week
11th week
12th week Fourth session exam
After 12th week Posttest (10 days after
12th week)
* Reliability for grade 2
** Reliability for grade 3
Note: Final math exam is implemented through both associations before pretests
Instruction by New Schema Approach
As all students in the study, whether in the control or experimental sections,
were taught by the researcher, so that any variance due to teacher effects
Amiripour, Dossey & Shahvarani – New Schema Approach
234
was lessened to the degree possible. Further, many of the students were
repeating their current grade, so they were repeating the traditional method
of instruction from the Iranian grade text book for a second year. The only
variation in instruction by the researcher was that when the content of the
word problem solving (WPs) portion of the curriculum was covered the
experimental sections, the problem pattern approach (PP) to solving WPs
was taught in grades 2 and 3. When the traditional approach for teaching
WPs was taught in the control sections, the researcher followed the
approach used in the Iranian textbook for each of the respective grades.
Neither the researcher nor the student’s regular classroom teachers were
graduates of a teacher education program. Thus, all were acting from their
experience in teaching mathematics based on general experience in
teaching, not knowledge of specific teaching approaches tied to the
materials with grade 2 and grade 3 students. Further, the problems on the
instruments described below were new to all the students.
Linear PPs
The researcher used a simple PP format as a pilot step for experimental
group students. Such a PP structure is found in the form of three main WPs.
Consider the following problems that were developed by Jitendra (2002),
along with a schema for solving each problem.
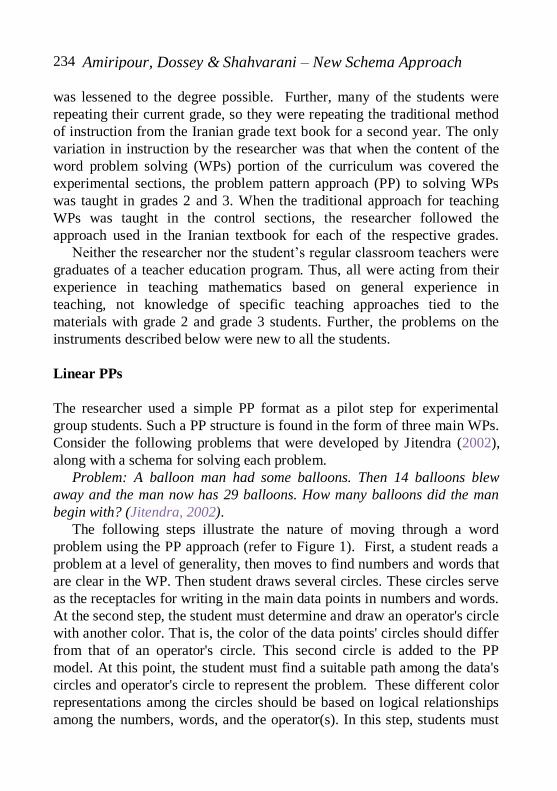
Problem: A balloon man had some balloons. Then 14 balloons blew
away and the man now has 29 balloons. How many balloons did the man
begin with? (Jitendra, 2002).
The following steps illustrate the nature of moving through a word
problem using the PP approach (refer to Figure 1). First, a student reads a
problem at a level of generality, then moves to find numbers and words that
are clear in the WP. Then student draws several circles. These circles serve
as the receptacles for writing in the main data points in numbers and words.
At the second step, the student must determine and draw an operator's circle
with another color. That is, the color of the data points' circles should differ
from that of an operator's circle. This second circle is added to the PP
model. At this point, the student must find a suitable path among the data's
circles and operator's circle to represent the problem. These different color
representations among the circles should be based on logical relationships
among the numbers, words, and the operator(s). In this step, students must
REDIMAT 6(3)
235
draw connecting lines among circles with another color. As a third step, the
student observes a main way of drawing a PP for the WP. This main way
indicates 'unknown and known information'.
Figure 1. The steps of drawing a linear PP for the change problem
Amiripour, Dossey & Shahvarani – New Schema Approach
236
The student can discover that an addition operator is needed by
assistance from the teacher the first time through the problem. But, then
he/she should select the operator later by herself or himself. In the fourth
step, it is obvious that student must add the two main numerical pieces of
data information to access the final answer. 'Addition operator' can show
numbers of balloons at start (see Figure 1). It is essential that the answer
and operator's circle differ from the color of the other data circle.
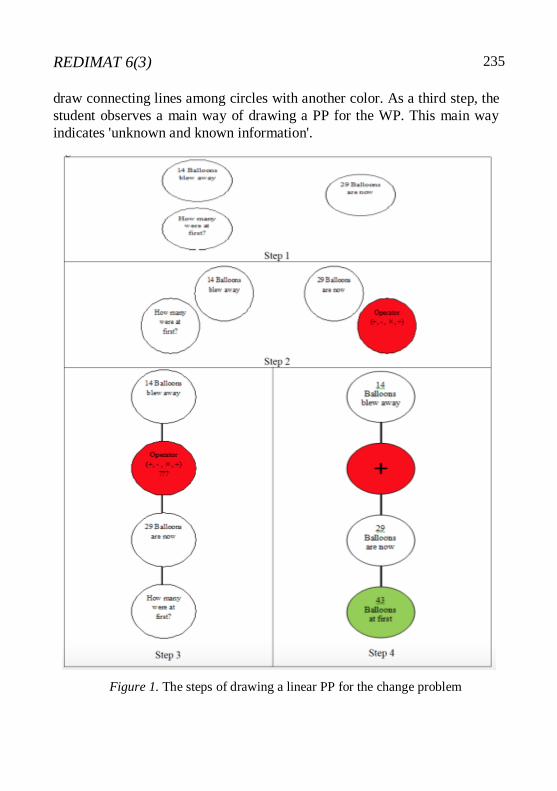
In constructing a PP approach model, one may have an information
circle/s that has no relationship to other circles. Such information with no
relationship to the other information is irrelevant to a solution. The Figure 2
below is such a problem.
Problem: Barbara is 37 years old. Cindy is 7 years older than Barbara.
Anne is 8 years old too. How old is Cindy?
In this problem, the age of Anne is irrelevant information, as the PP
model shows clearly this circle has no relationship to other circles. Anne’s
age circle is not connected to any of the other circles.
Figure 2. A linear PP problem with irrelevant information
REDIMAT 6(3)
237
Nonlinear PPs
Many WPs situations have more than one operator, but their connection of
circles differs from that found in linear PPs. They differ in the fact that their
solution cannot be represented as a linear path or segment. When a student
reads a nonlinear WP, he/she notes that the structure of that problem
requires two or more operators. The difficulty resides in finding the
connection/s among the main information (numbers and words) and
operators. When the student recognizes there appears to be too many circles
representing information circles and operator circles, they have their first
clue that the situation may call for a nonlinear PP model. In linear PPs, lines
have same color, but not so for nonlinear PPs. If the student tries to make a
PP with lines of the same color, the student will not be able to find a main
path involving its operator circles. Thus, students must determine ways
using connecting lines with different colors. This makes the main path
among circles and lines more easily determined. Through using different
colored lines, students find how to follow and merge a collection of paths
for accessing a main path for the solution. Among nonlinear PP problems, it
is observed that: (a) Each sub-path has one operator, (b) Irrelevant
information does not fit into any paths or operator, (c) Each sub-path has a
unique color, (d) Two operators or more cannot be in a single path, and (e)
Nonlinear PPs are unique; that is, a PP that can be slid or rotated onto the
shape of a correct PP which is also a correct solution. Consider the
following problem.
Problem: Mary has $1000. She wants to buy 2 red apples which are $50
apiece and 4 cucumbers which are $50 apiece. How many dollars did she
spend? How many dollars has she now?
Considering the problem, a student finds numbers and words that have a
relationship to the context. Write numbers/words in circles as shown in the
first step. For the second step, the student must find the total price of 2 red
apples and 4 cucumbers. From previous experiences, a student knows that
'multiplication' is the operator. Returning to previous knowledge regarding
linear PPs, a student can find the price of both 2 red apples and 4
cucumbers separately (see Figure 3). For the third step, the student is
required to read through the problem again. The main question is to what
remains from Mary's original amount of money. Thus, student must first
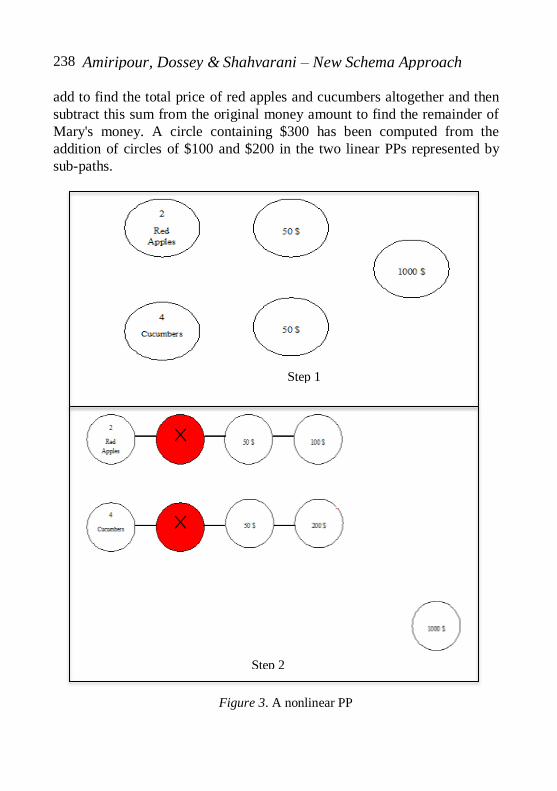
Amiripour, Dossey & Shahvarani – New Schema Approach
238
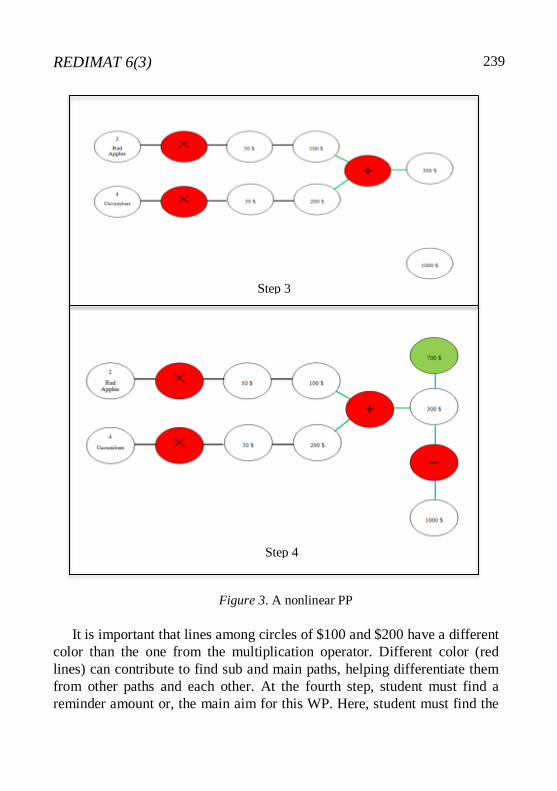
add to find the total price of red apples and cucumbers altogether and then
subtract this sum from the original money amount to find the remainder of
Mary's money. A circle containing $300 has been computed from the
addition of circles of $100 and $200 in the two linear PPs represented by
sub-paths.
Figure 3. A nonlinear PP
Step 1
Step 2
REDIMAT 6(3)
239
Figure 3. A nonlinear PP
It is important that lines among circles of $100 and $200 have a different
color than the one from the multiplication operator. Different color (red
lines) can contribute to find sub and main paths, helping differentiate them
from other paths and each other. At the fourth step, student must find a
reminder amount or, the main aim for this WP. Here, student must find the
Step 3
Step 4
Amiripour, Dossey & Shahvarani – New Schema Approach
240
final main path illustrated with a different color (blue lines). Now, the
student must find the final answer through subtraction. This is why some of
these problem cases are so difficult. Suppose a student has completed a PP,
the teacher can ask of him/her to interpret the WP through his/her PP. This
type of explanation contributes to WPs, to the design of a problem with
these information and operation/s, and through modeling efforts causing
students think through in such a problem situation. Students can review
their work PP through reading the data and operations again.
The following problem, used in the traditional control classrooms,
suggests that a student should have to develop a solution this problem, but
the authors have not proposed how to structure this pattern.
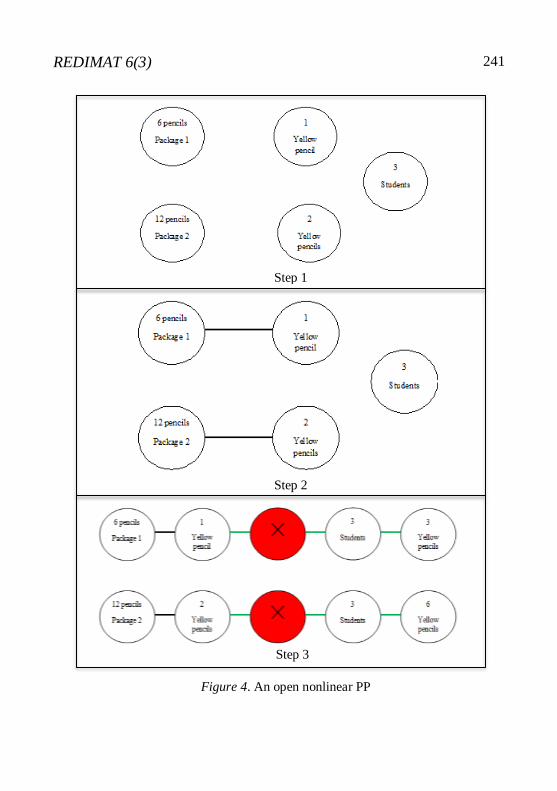
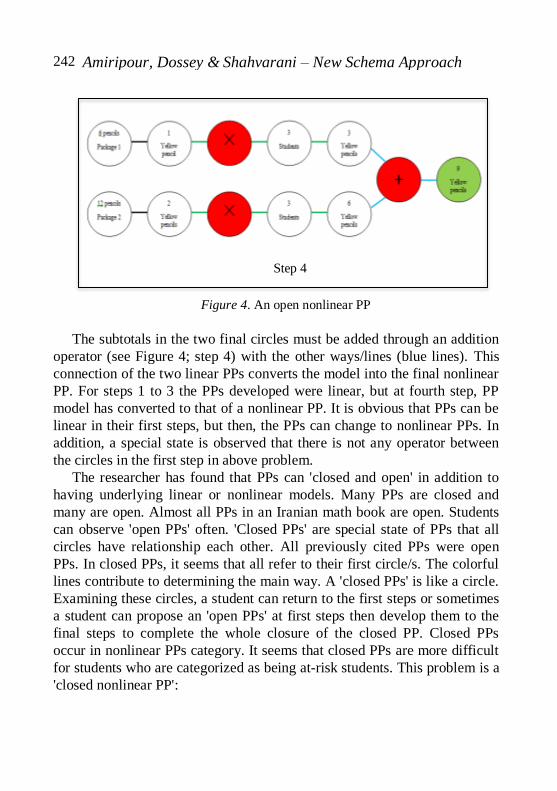
Problem: Each of three students has two colorful packages of pencils: a
package has 6 pencils (package 1), and the other 12 pencils (package 2).
Package 1 has 1 yellow pencil and Package 2 has 2 yellow pencils. How
many yellow pencils have these three students? (Davoodi et al., 2014-
2015).
The researcher suggests that students attempt a PP structure for their
solutions. A student must put circles for main numbers along with words
(step 1). Then, as shown, packages 1 and 2 should relate to 6 and 12 pencils
respectively without an operator between them in this PP. Some PPs, such
as the PP for the pencil problem, some of the circles have no operator
between them (see Figure 4; step 1). Step 2 indicates that one yellow pencil
and two yellow pencils have relationship to both package 1's and package
2's circles, respectively. This indicates circles from right hand belong to
circles from left hand. Certainly, no operator can be put between these
circles. The lines between them are solid black. This line must differ in
color from that of other lines. In the third step, a student finds that 1 yellow
pencil for each three students will be 3 yellow pencils by using either
multiplication or addition separately, and for the rationing of 2 yellow
pencils for each of three students will result in 6 yellow pencils.
This can be found either through multiplication or addition separately
(see Figure 4; step 3). This PP has used a multiplication operator. Lines
among them are red. Returning to read the original problem, the student
finds the problem asked that the student must find the overall total number
of yellow pencils. Thus, other operator must add the subtotals found in the
two linear sub-PPs.
REDIMAT 6(3)
241
Figure 4. An open nonlinear PP
Step 1
Step 2
Step 3
Amiripour, Dossey & Shahvarani – New Schema Approach
242
Figure 4. An open nonlinear PP
The subtotals in the two final circles must be added through an addition
operator (see Figure 4; step 4) with the other ways/lines (blue lines). This
connection of the two linear PPs converts the model into the final nonlinear
PP. For steps 1 to 3 the PPs developed were linear, but at fourth step, PP
model has converted to that of a nonlinear PP. It is obvious that PPs can be
linear in their first steps, but then, the PPs can change to nonlinear PPs. In
addition, a special state is observed that there is not any operator between
the circles in the first step in above problem.
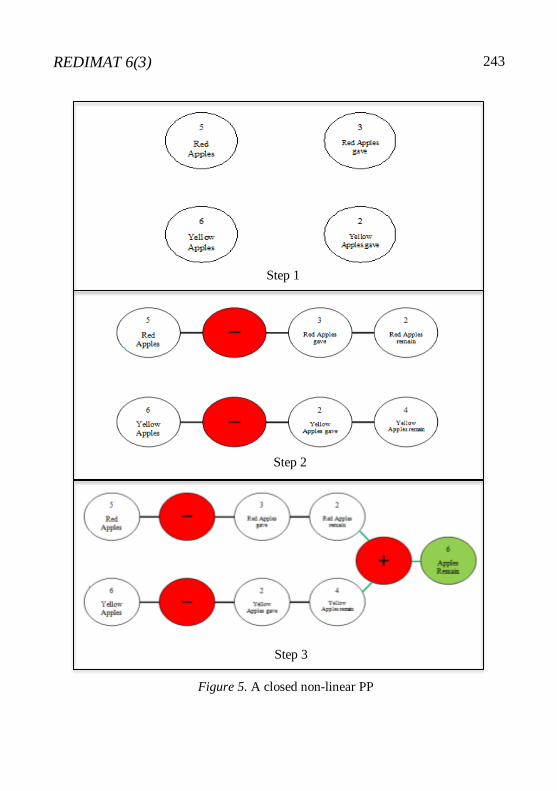
The researcher has found that PPs can 'closed and open' in addition to
having underlying linear or nonlinear models. Many PPs are closed and
many are open. Almost all PPs in an Iranian math book are open. Students
can observe 'open PPs' often. 'Closed PPs' are special state of PPs that all
circles have relationship each other. All previously cited PPs were open
PPs. In closed PPs, it seems that all refer to their first circle/s. The colorful
lines contribute to determining the main way. A 'closed PPs' is like a circle.
Examining these circles, a student can return to the first steps or sometimes
a student can propose an 'open PPs' at first steps then develop them to the
final steps to complete the whole closure of the closed PP. Closed PPs
occur in nonlinear PPs category. It seems that closed PPs are more difficult
for students who are categorized as being at-risk students. This problem is a
'closed nonlinear PP':
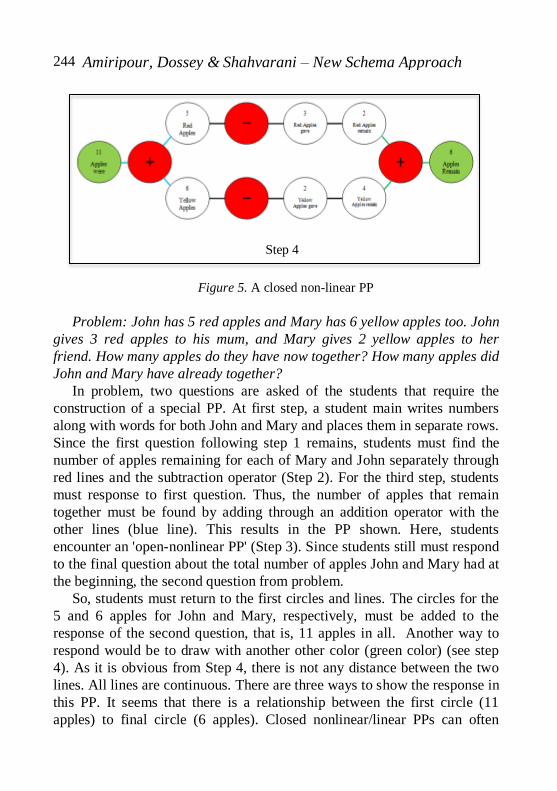
Step 4
REDIMAT 6(3)
243
Figure 5. A closed non-linear PP
Step 1
Step 2
Step 3
Amiripour, Dossey & Shahvarani – New Schema Approach
244
Figure 5. A closed non-linear PP
Problem: John has 5 red apples and Mary has 6 yellow apples too. John
gives 3 red apples to his mum, and Mary gives 2 yellow apples to her
friend. How many apples do they have now together? How many apples did
John and Mary have already together?
In problem, two questions are asked of the students that require the
construction of a special PP. At first step, a student main writes numbers
along with words for both John and Mary and places them in separate rows.
Since the first question following step 1 remains, students must find the
number of apples remaining for each of Mary and John separately through
red lines and the subtraction operator (Step 2). For the third step, students
must response to first question. Thus, the number of apples that remain
together must be found by adding through an addition operator with the
other lines (blue line). This results in the PP shown. Here, students
encounter an 'open-nonlinear PP' (Step 3). Since students still must respond
to the final question about the total number of apples John and Mary had at
the beginning, the second question from problem.
So, students must return to the first circles and lines. The circles for the
5 and 6 apples for John and Mary, respectively, must be added to the
response of the second question, that is, 11 apples in all. Another way to
respond would be to draw with another other color (green color) (see step
4). As it is obvious from Step 4, there is not any distance between the two
lines. All lines are continuous. There are three ways to show the response in
this PP. It seems that there is a relationship between the first circle (11
apples) to final circle (6 apples). Closed nonlinear/linear PPs can often
Step 4
REDIMAT 6(3)
245
indicate a rational relationship existing among the information. This is a
difference between a closed PP and an open PP. In open PP
(linear/nonlinear), the WPs often follows a unique question but for almost
all closed PPs (linear/nonlinear) this does not occur. Closed PPs have many
lines and there is a main solution goal tying the first way (circle) and final
way showing the total in the right-hand circle in Step 4. In addition, closed
PPs are unique as open PPs. PPs must be drawn about special principles
governing either linear PPs or nonlinear PPs. As it is shown, all circles
written/drawn on left hand and operator's circles must be put among data's
circles so that they direct the calculation of how the students
add/subtract/multiple/divide numbers.
Findings
This section reviews the data outlining the model, data, and demographic
data related underpinning the hypothesis that at-risk students taught WPs
through the PP approach in the experimental sections will perform
statistically significantly better on the posttest than students taught via
traditional teacher led instruction in the control sections. While the entire
study involved other questions, covered in additional papers, this paper
focuses on the major hypothesis: The post-test performance of at-risk
students taught by the PP approach differs statistically (p < 0.05) from the
posttest performance of students taught by the traditional method.
The test data was analyzed by grade levels of the students involved in
the experiment due to the differences in the content on the pre- and
posttests for students in the two levels: grade 2 and grade 3. Changes were
made in the methods of data analysis because of differences in the numbers
of students in the second and third grade experimental samples and others
from differences in the variability within in these groups themselves.
Note that there were 35 students in grade 2 and 65 students in grade 3.
These numbers resulted from the distribution of at-risk students meeting the
criteria of having mathematical learning difficulties and having been
retained in grade at least once in kindergarten through grade 3.
The average age of students in the control sections was between 9 and
10 the Society for Protecting the Rights of the Child (Naser Khosrow &
Shosh Houses) and the Association of Protection of Children Labor (Molavi
Amiripour, Dossey & Shahvarani – New Schema Approach
246
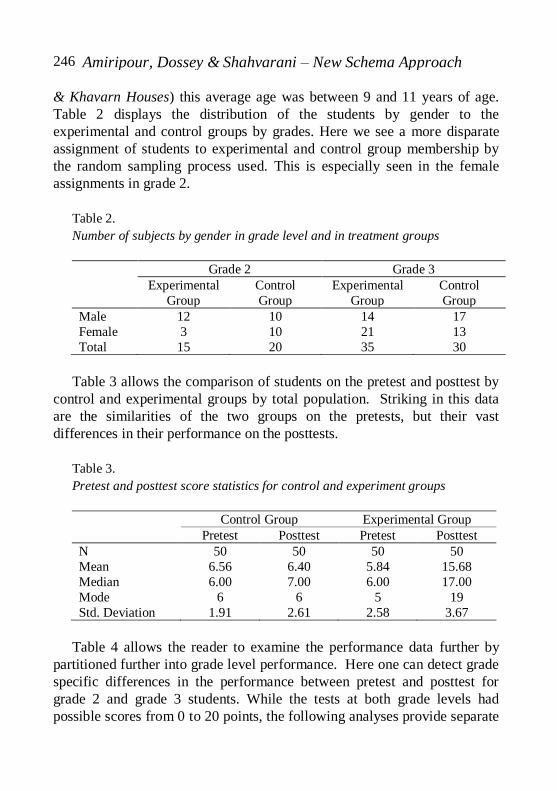
& Khavarn Houses) this average age was between 9 and 11 years of age.
Table 2 displays the distribution of the students by gender to the
experimental and control groups by grades. Here we see a more disparate
assignment of students to experimental and control group membership by
the random sampling process used. This is especially seen in the female
assignments in grade 2.
Table 2.
Number of subjects by gender in grade level and in treatment groups
Grade 2 Grade 3
Experimental
Group
Control
Group
Experimental
Group
Control
Group
Male 12 10 14 17
Female 3 10 21 13
Total 15 20 35 30
Table 3 allows the comparison of students on the pretest and posttest by
control and experimental groups by total population. Striking in this data
are the similarities of the two groups on the pretests, but their vast
differences in their performance on the posttests.
Table 3.
Pretest and posttest score statistics for control and experiment groups
Control Group Experimental Group
Pretest Posttest Pretest Posttest
N 50 50 50 50
Mean 6.56 6.40 5.84 15.68
Median 6.00 7.00 6.00 17.00
Mode 6 6 5 19
Std. Deviation 1.91 2.61 2.58 3.67
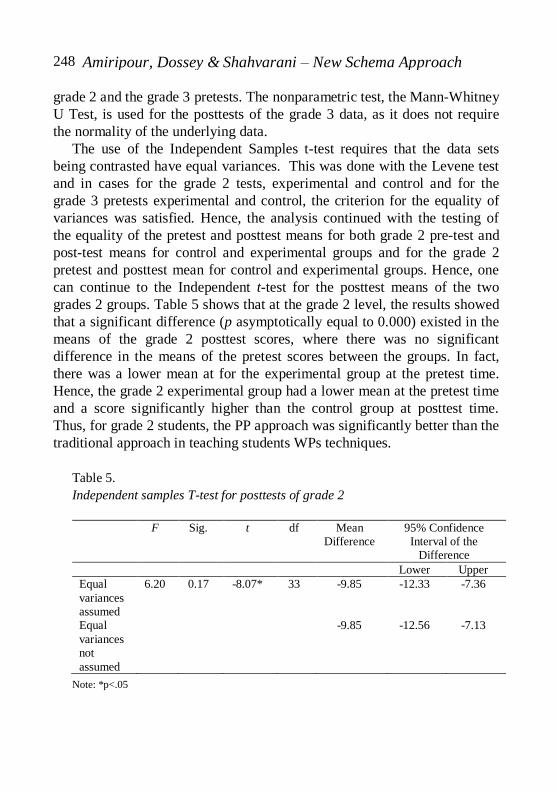
Table 4 allows the reader to examine the performance data further by
partitioned further into grade level performance. Here one can detect grade
specific differences in the performance between pretest and posttest for
grade 2 and grade 3 students. While the tests at both grade levels had
possible scores from 0 to 20 points, the following analyses provide separate
REDIMAT 6(3)
247
discussions of the control and experimental groups by grade levels, as the
combination of their data for analysis would be open to validity challenges
because of the differing content tested at the two grade levels. One should
also note grade 2 experimental students started below the grade 2 control
students but finished considerable higher than them.
Table 4.
Pretest and posttest scores by grades for experimental and control groups
By Test Control Group Experimental Group
Pretest Posttest Pretest Posttest
By Grade Second Third Second Third Second Third Second Third
N 20 30 20 30 15 35 15 35
Mean 6.40 6.73 5.35 7.10 6.20 5.68 15.20 15.91
Median 6.00 7.00 6.00 7.00 6.00 6.00 17.00 17.00
Mode 6 6 2 10 6 5 19 18
Std. Dev. 1.95 1.99 2.68 2.36 3.02 2.39 4.50 3.33
The hypothesis states that: The post-test performance of at-risk students
taught by the PP approach differs statistically (p < 0.05) from the posttest
performance of students taught by the traditional method. In the following
pages, we will investigate whether there is evidence that allows one to say
that chances are that students exposed to the PP approach perform better
than their peers in the control group at the p < 0.05 level.
Before testing groups by performance on their respective pretests and
posttests, it necessary to check to assure that the data for each approach is
normally distributed, as this is a basic assumption of the t-test planned for
use. The test results using the Kolmogorov-Smirnov test for the normal
distribution of responses in the data for pretests from the control and from
the experimental groups by grade 2 and grade 3 levels returned mixed
results. The results showed that the data testing normality for both control
and experimental classes in grade 2 pretest and posttest classes and in grade
3 pretest classes satisfied the normality criterion (p > 0.05). However, while
the data for the grade 3 control group satisfied the normality criterion, the
data for the grade 3 experimental group for posttest were not normally
distributed (p < 0.05). Thus, the parametric test, the Independent Samples
t-Test, is chosen to test for differences in the pretest performance of all
Amiripour, Dossey & Shahvarani – New Schema Approach
248
grade 2 and the grade 3 pretests. The nonparametric test, the Mann-Whitney
U Test, is used for the posttests of the grade 3 data, as it does not require
the normality of the underlying data.
The use of the Independent Samples t-test requires that the data sets
being contrasted have equal variances. This was done with the Levene test
and in cases for the grade 2 tests, experimental and control and for the
grade 3 pretests experimental and control, the criterion for the equality of
variances was satisfied. Hence, the analysis continued with the testing of
the equality of the pretest and posttest means for both grade 2 pre-test and
post-test means for control and experimental groups and for the grade 2
pretest and posttest mean for control and experimental groups. Hence, one
can continue to the Independent t-test for the posttest means of the two
grades 2 groups. Table 5 shows that at the grade 2 level, the results showed
that a significant difference (p asymptotically equal to 0.000) existed in the
means of the grade 2 posttest scores, where there was no significant
difference in the means of the pretest scores between the groups. In fact,
there was a lower mean at for the experimental group at the pretest time.
Hence, the grade 2 experimental group had a lower mean at the pretest time
and a score significantly higher than the control group at posttest time.
Thus, for grade 2 students, the PP approach was significantly better than the
traditional approach in teaching students WPs techniques.
Table 5.
Independent samples T-test for posttests of grade 2
F Sig. t df Mean
Difference
95% Confidence
Interval of the
Difference
Lower Upper
Equal
variances
assumed
6.20 0.17 -8.07* 33 -9.85 -12.33 -7.36
Equal
variances
not
assumed
-9.85 -12.56 -7.13
Note: *p<.05
REDIMAT 6(3)
249
To complete the analysis, we turn to a non-parametric Mann-Whitney U
test for examining the difference of means for the posttests at the grade 3
level. The difference of the control and experimental results for grade 3 at
the posttest level was significant. The results of the Mann-Whitney U-test
showed that comparison of the ranks for the two grades 3 samples (Table 6)
to be statistically significant favoring the experimental group (p
asymptotically equivalent to 0.000) in Table 7. We must reject the null
hypothesis and accept the alternative hypothesis give the resulting p–value
approaching 0.000, a value clearly satisfying the (p < 0.05) criterion. One
then rejects the null hypothesis of no difference in performance and accepts
the alternative hypothesis that students in the experimental group performed
significant better in the experimental group at the grade 3 level.
Table 6.
Calculated ranks for the posttests of the grade 3
Code N Mean rank Sum of ranks
Control
group
30 16.60 498.00
Experiment
group
35 47.06 1647.00
Total 65
Combining this result with the similar finding at the grade 2 level, we
conclude that the use of the PP approach to the teaching of WPs was
significantly better than the traditional approach in the learning of WPs.
Table 7.
Mann-Whitney test for posttest of grade 3
Statistics Posttests
Mann-Whitney U 33.00
Wilcoxon W 498.00
Z -6.50*
Note: *p<.05
Amiripour, Dossey & Shahvarani – New Schema Approach
250
Conclusion
In the present research, the PP approach is proposed as a strategy for WPs.
Since many students cannot solve complex WPs, it seemed that teachers
should introduce a new and efficient strategy for WPs as an educational
intervention. The PPs approach was developed and after revisions following
pilot testing, the research team found evidence for introduced PPs for at-
risk students in the experimental study described. At-risk students were
chosen from among students having mathematical difficulties and who had
also been retained in grade in at least one year. Further, they did not pass
the school’s final mathematics examination in the previous year. These
students’ work with WPs was characterized by repeated mistakes in WPs.
In the first instructional sessions with PPs in the experimental classes,
at-risk students practiced building models for linear PPs through colorful
colored clay and pipe cleaner models. The researcher introduced the PPs
approach by having the students work in small groups to model linear
problems. At first, at-risk students were unable to design PPs correctly,
voicing a dislike the new PP approach. Students could not think through the
identification of the main structure of the natural number WPs. The
researcher then asked them to find the main information at first. Then, the
students were directed to examine the relationship between the known data
and unknown in the WPs. This was followed by finding and relating a
main operation (+, −, , ÷) to the linear PPs models. Conversations
between the researcher and at-risk students often contributed to students’
increased understanding and improvement in their designs for PPs. After
one month, they could identify and design the main path between the main
information (numbers and unknowns) and find the operation related to the
problems presented. Then, a second step was to solidify students’ capability
to find the main path among data and unknowns, operation/s, and the final
answer. Many students found that smaller numbers could not be used as
subtrahends in subtraction problems. The relational places that number(s)
take in finding the main path to finding a final answer began to develop.
After the second month, at-risk students had improved their linear PPs
from the first month level, so they began working on nonlinear PPs. This
shift was very difficult for them. For nonlinear WPs, at-risk students faced
many challenges. When the number of operations was greater than the one,
students had extreme difficulty working with the related nonlinear PPs.
REDIMAT 6(3)
251
This change created a greater information-processing load for at-risk
students as this also increased the number of data points and unknowns
involved in the WPs. Students discovered that the separation of main
information was possible through viewing individual PPs as part of
building a model for the more complex nonlinear problems. This allowed
at-risk students to handle the nonlinear settings. As students worked with
both linear and nonlinear PPs, problems were presented based in stories
(dramas) of a family engaged in routine problem situations requiring
mathematical-based solutions. At-risk students were thus engaged in
settings using "age, money, time, categorize, distance, length, and weight"
along with the four main operations in PPs. The researcher had to supply
more help in the first steps of structuring and answering nonlinear PPs. At
this point, the researcher first asked and modeled answering the questions to
be asked. It was here that the researcher found that at-risk students had to
use different colors for modeling the data and pipe cleaner for the two
embedded PPs. This step of using use different colors for the embedded
linear PPs found in nonlinear PPs assisted at-risk students in finding the
separate embedded paths the first information, its answer, and the
movement to the final solution. During the third month, many of the at-risk
students began to design open nonlinear PPs and extended their
understandings to closed nonlinear PPs. Closed nonlinear PPs were very
difficult for at-risk students, particularly second graders. Conversations
between the researcher and experimental sessions students took place
during the three months of the experimental treatment, as well as pretest,
four intersession exams, and a posttest. In the control groups students’
classroom teachers proceeded as normal with texts normally found in the
Iranian school mathematics curriculum and taught students in the control
sections in the participating schools the solution of WPs as traditionally
done. The only difference for them was the administration of the tests
associated with the experiment.
In the control group, the researcher worked with at-risk students under
the same conditions as with the experiment group except for teaching from
the adopted mathematics text, which was the same text in all classes
involved, differing only by the grade level intended. The PP approach was
not used in the control sections. One classroom assessment difference was
asking control students to draw a representation of problems which was not
Amiripour, Dossey & Shahvarani – New Schema Approach
252
a textbook-based instructional method. However, the results showed this
did not have a significant effect on control students versus experimental
students. However, students in the experiment groups could propose PPs
correctively and draw a design or schema that led to finding the main path/s
and final solution. As all the at-risk students have essentially the same
surrounding conditions regarding social, cultural, and financial situations,
as well as all students were workers outside of class with hard working
conditions, it appears that the PP approach is a promising approach for use
in classes with at-risk students.
References
Carpenter, T. P. & Moser, J. M., (1983). The acquisition of addition and
subtraction concepts. In R. Lesh & M. Landau (Eds.), Acquisition of
mathematical concepts and processes (pp. 7–44). New York:
Academic Press.
Case, L. P, Harris K. R, & Graham S. (1992). Improving the mathematical
problem solving skills of students with learning disabilities: Self-
regulated strategy development. Journal of Special Education, 26, 1–
19. doi: 10.1177/002246699202600101
Claessens, A., Duncan, G. J., & Engel, M. (2009). Kindergarten skills and
fifth-grade achievement: Evidence from the ECLS-K. Economics of
Education Review, 28(4), 415–427.
doi:http://journals.sagepub.com/doi/10.1177/002246699202600101
Cronbach, L. J. (1951). Coefficient alpha and the internal structure of tests.
Psychometrika, 22(3), 297-33. Doi: 10.1007/BF02310555
Davoodi, KH., Rastegar, A., & Alamiyan, V. (2014-2015). 3rd Math book.
Tehran: Islamic Republic of Iran Education.
Duncan, G. J., Dowsett, C. J., Classens, A., Magnuson, K., Huston, A. C.,
Klebanov, P., & Japel, C. (2007). School readiness and later
achievement. Developmental Psychology, 43(6), 1428–1446.
doi:10.1037/0012-1649.43.6.1428.
Duncan, G. J., & Magnuson, K. A. (2011). The nature and impact of
achievement skills, attention skills, and behavior problems. In G. J.
Duncan & R. J. Murnane (Eds.), Whither opportunity? Rising
inequality, schools, and children's life chances (pp. 47–69). New
York: Russell Sage Foundation.
REDIMAT 6(3)
253
Fuchs, L.S., Fuchs, D., Finelli, R., Courey, S.J., & Hamlett, C.L. (2004).
Expanding schema-based transfer instruction to help third graders
solve real-life mathematical problems. American Educational
Research Journal, 41, 419–445. doi: 10.3102/00028312041002419
Fuchs, L. S., Geary, D. C., Compton, D. L., Fuchs, D., Schatschneider, C.,
Hamlett, C. L., & Changas, P. (2013). Effects of first-grade number
knowledge tutoring with contrasting forms of practice. Journal of
Educational Psychology, 105(1), 58–77. doi:10.1037/a0030127.
Garcia, A. I., Jimenez, J. E. & Hess, S. (2006). Solving arithmetic word
problems: An analysis of classification as a function of difficulty in
children with and without arithmetic learning difficulties. Journal of
Learning Disabilities, 39(3), 270–281. doi:
10.1177/00222194060390030601
Jitendra, A., & Xin, Y.P., (1997). Mathematical word problem-solving
instruction for students with mild disabilities and students at risk for
math failure: A research synthesis. The Journal of Special Education,
30, 412–438. doi: 10.1177/002246699703000404
Jitendra, A. (2002). Teaching students’ math problem solving through
graphic representations. Teaching Exceptional Children, 34(4), 34-
38. doi: 10.1177/004005990203400405
Jitendra, A.K., & Hoff, K. (1996). The effects of schema-based instruction
on mathematical word-problem-solving performance of students with
learning disabilities. Journal of Learning Disabilities, 29, 422–431.
[PubMed: 8763557]. doi: 10.1177/002221949602900410
Jordan, N. C. (2007). The need for number sense. Educational Leadership,
65(2), 63–66.
Jordan, N. C., Kaplan, D., Ola´h, L. N., & Locuniak, M. N. (2006). Number
sense growth in kindergarten: A longitudinal investigation of
children at risk for mathematics difficulties. Child Development,
77(1), 153–175. doi: 10.1111/j.1467-8624.2006.00862.x
Jordan, N.C., Kaplan, D., Ramineni, C., & Locuniak. M.N. (2009). Early
math matters: Kindergarten number competence and later
mathematics outcomes. Developmental Psychology, 45(3), 850-867.
doi: 10.1037/a0014939
Kroesbergen, E. H., & Van Luit, J. E. H. (2003). Mathematical
interventions for children with special educational needs. Remedial
Amiripour, Dossey & Shahvarani – New Schema Approach
254
and Special Education, 24, 97–114. doi:
10.1177/07419325030240020501
McCann, R. A., & Austin, S. (1988). At-risk youth: Definitions, dimensions
and relationships. Philadelphia: Research for Better Schools Inc.
(ERIC Document Reproduction Service, No. 307/359).
Mastropieri, M. A, Scruggs, T. E, Shiah, R. (1997). Can computers teach
problem solving strategies to students with mild mental retardation?
Remedial and Special Education, 18, 157–165. doi:
10.1177/074193259701800304
Miller, S.P., & Mercer, C.D. (1993). Using data to learn about concrete
semi concrete abstract instruction for students with math disabilities.
Learning Disabilities Research and Practice, 8, 89–96. doi:
10.1111/1540-5826.00068
Montague, M., & Applegate, B., (2000). Middle school students'
perceptions, persistence, and performance in mathematical problem
solving. Learning Disability Quarterly, 23, 215–227. doi:
10.2307/1511165
Morgan, P. L., Farkas, G., & Wu, Q. (2009). Five-year growth trajectories
of kindergarten children with learning difficulties in mathematics.
Journal of Learning Disabilities, 42(4), 306–321.
doi:10.1177/0022219408331037
National Governors Association Center for Best Practices & Council of
Chief State School Officers. (2010). Common Core State Standards
for Mathematics. Washington, DC: Author. Retrieved from
http://www.corestandards.org/assets/CCSSI_Math%20Standards.pdf.
National Mathematics Advisory Panel. (2008). Foundations for success:
The final report of the National Mathematics Advisory Panel (ED
00424P). Washington, DC: U.S. Department of Education.
National Research Council. (2009). Mathematics learning in early
childhood: Paths toward excellence and equity. Washington, DC:
National Academies Press.
OECD (2016), Equations and Inequalities: Making Mathematics Accessible
to All, PISA, Paris: OECD Publishing. doi: 10.1787/9789264258495-
en
Powell, S. (2011). Solving word problems using schemas: A review of the
literature. Learning Disabilities Research & Practice, 26, 94–108.
doi: 10.1111/j.1540-5826.2011.00329.x
REDIMAT 6(3)
255
Robinson, C. S., Menchetti, B. M., & Torgesen, J. K. (2002). Toward a
two-factor theory of one type of mathematics disabilities. Learning
Disabilities Research & Practice, 17(2), 81–89. doi:10.1111/1540-
5826.00035.
Schiff, R., Bauminger, N., & Toledo, I. (2009). Analogical problem solving
in children with verbal and nonverbal learning disabilities. Journal of
Learning Disabilities, 42(1), 3–13. doi: 10.1177/0022219408326213
Starkey, P., Klein, A., & Wakeley, P. (2004). Enhancing young children's
mathematical knowledge through a pre-kindergarten mathematics
intervention. Early Childhood Research Quarterly, 19(1), 99–120.
doi:10.1016/j.ecresq.2004.01.002.
Van Garderen, D. (2007). Teaching students with LD to use diagrams to
solve mathematical word problems. Journal of Learning Disabilities,
40, (540-553). doi: 10.1177/00222194070400060501
Parvaneh Amiripour is PhD student in the Department of
Mathematics, Science and Research Branch, Islamic Azad University,
Tehran, Iran.
John A. Dossey is emeritus professor in the Department of
Mathematics, at Illinois State University, USA.
Ahmad Shahvarani is associated professor in the Department of
Mathematics, Science and Research Branch, Islamic Azad University,
Tehran, Iran.
Contact Address: Direct correspondence concerning this article,
should be addressed to the author. Postal address: 65111 East Crystal
Ridge, Tucson, AZ, 85739, USA. Email: [email protected] ,


![schema design, DDL, DML] [Basic queries (SELECT, WHERE ...From first lecture: A database schema is a collection of tables related by keys 55. Primary Key 56 A primary key is a field](https://img.pdfslide.us/doc/110x75/6007c84702cbfa2f861e9648/schema-design-ddl-dml-basic-queries-select-where-from-first-lecture-a.jpg)