Embed Size (px)
Citation preview
General rights Copyright and moral rights for the publications made accessible in the public portal are retained by the authors and/or other copyright owners and it is a condition of accessing publications that users recognise and abide by the legal requirements associated with these rights.
Users may download and print one copy of any publication from the public portal for the purpose of private study or research.
You may not further distribute the material or use it for any profit-making activity or commercial gain
You may freely distribute the URL identifying the publication in the public portal If you believe that this document breaches copyright please contact us providing details, and we will remove access to the work immediately and investigate your claim.
Downloaded from orbit.dtu.dk on: Jun 26, 2020
Using a finite element pediatric hip model in clinical 2 evaluation - a feasibility study
Skytte, T. L. ; Mikkelsen, Lars Pilgaard; Sonne-Holm, Stig; Wong, C.
Published in:Journal of Bioengineering & Biomedical Sciences
Link to article, DOI:10.4172/2155-9538.1000241
Publication date:2017
Document VersionPublisher's PDF, also known as Version of record
Link back to DTU Orbit
Citation (APA):Skytte, T. L., Mikkelsen, L. P., Sonne-Holm, S., & Wong, C. (2017). Using a finite element pediatric hip model inclinical 2 evaluation - a feasibility study. Journal of Bioengineering & Biomedical Sciences, 7(5), [1000241].https://doi.org/10.4172/2155-9538.1000241
Volume 7 • Issue 5 • 1000241J Bioengineer & Biomedical Sci, an open access journalISSN: 2155-9538
Research Article Open Access
Skytte et al., J Bioengineer & Biomedical Sci 2017, 7:5DOI: 10.4172/2155-9538.1000241Journal of
Bioengineering & Biomedical Science Jour
nal o
f Bioe
ngineering & Biomedical Science
ISSN: 2155-9538
*Corresponding author: Wong C, Department of Orthopaedics, University Hospital of Hvidovre, Kettegard Alle 30, 2650 Hvidovre, Denmark, Tel: +45 36 32 23 33; E-mail: [email protected]
Received: November 27, 2017; Accepted: December 24, 2017; Published: December 31, 2017
Citation: Skytte TL, Mikkelsen LP, Sonne-Holm S, Wong C (2017) Using a Finite Element Pediatric Hip Model in Clinical Evaluation - A Feasibility Study. J Bioengineer & Biomedical Sci 7: 241. doi: 10.4172/2155-9538.1000241
Copyright: © 2017 Skytte TL, et al. This is an open-access article distributed under the terms of the Creative Commons Attribution License, which permits unrestricted use, distribution, and reproduction in any medium, provided the original author and source are credited.
AbstractThe paper describe a method to construct a finite element model of the hip joint of a child based on clinical
recorded CT data. A model which can be used for diagnostic aid and pre-operative surgical evaluation. First part of this development is a feasibility study of this method. A scan of the asymptomatic left hip of a 10-year-old girl with a dysplastic right hip was used. Cartilage was not visible why it was modeled as an interaction with constant thickness between two surfaces. For every point on the acetabular and femoral bone surfaces, the shortest distance to the other surface was used to calculate the resulting stress in the normal direction. At a load of 233% BW the model predicted peak pressures in the hip joint of 9.7-13.8 MPa and an area in contact of 351-405 mm2. Experimental validation using the hip joint of a child was not ethical viable. Instead, our results were compared to previous published experimental studies and computational models investigating the adult hip joint. Good correlation between the current model and previous models were found. The current case specific modeling technique may be a useful complement to the previously developed hip models.
Using a Finite Element Pediatric Hip Model in Clinical Evaluation - A Feasibility StudySkytte TL1, Mikkelsen LP2, Sonne-Holm S1 and Wong C1*1Department of Orthopaedics, University Hospital of Hvidovre, Kettegard Alle 30, Hvidovre, Denmark2Composits and Materials Mechanics, Technical University of Denmark, Frederiksborgvej 399, Roskilde, Denmark
Keywords: Finite element; Hip joint cartilage; Pediatric child
IntroductionSeveral studies indicate that the development of hip osteoarthritis
(OA) is strongly correlated with malformations of the hip joint [1-3]. Malformations of the joint may lead to elevated cartilage contact stresses increasing the risk of developing OA [4]. Human in vivo studies of the hip joint are important to increase our knowledge regarding the mechanics leading to OA, but they are difficult and unethical to conduct. Instead several three-dimensional finite element (FE) models have been constructed to evaluate the biomechanics of the mature human pelvis and hip joint. Some studies combined experimental trials with FE analyses in order to validate the stress distribution in the pelvic cortical bone or contact forces in the articular cartilage of FE models [5-7]. Harris et al. constructed FE models of 10 hips and found large variations among subjects when considering contact forces in the articular cartilage [8]. Most FE models to date were constructed from an adult or elderly hip. To the knowledge of the authors, only Kim et al. used the hip from a 10-year-old girl to construct their FE model [9]. It is of significant relevance to construct FE models of the patient specific pediatric hip, because congenital malformations are believed to be of importance in the development of OA [8]. These FE models could be used to investigate preventive treatments of OA, which is ethical unfeasible in in vivo studies.
Geometry for FE models were mainly based on post mortem recorded data or computed tomography (CT) scanning with a contrast agent injected into the joint cavity to visualize the cartilage layers [8,10]. Majumder et al. used in situ CT scan data to construct their FE model, but they assumed the femoral head and the acetabulum to be rigidly connected [11]. The aim of the current study, is to construct a realistic FE model of the hip joint of a child using standard pre-operative CT scan data. A potentially useful tool for surgeons, when planning surgery strategies of dysplastic hips, since our current state of knowledge in the mechanical consequences of hip luxation, related surgeries and, most of all, indications to the latter are limited [12]. Compared to previous models, this model is a more useful tool in the clinic because:
• A model is created from standard pre-operative CT scan data.
• It is relatively quick to construct a patient specific model,
because only the geometrical structure of the bones is patient specific.
This study will investigate if our method is feasible, and for this purpose our FE generated output, were compared to findings from published experimental studies and computational models.
Materials and MethodsCT scan of the hip of a 10-year-old girl was performed as part of
the clinical treatment protocol. A body weight (BW) of kg was used throughout the paper. In the specific case the right hip was found to be slightly dysplastic while the left hip was evaluated as normal with an acetabular index (AI) of 14.7 and a centre edge (CE) angle of 33.5°. Normal values for a 10-year-old are AI = 9.1 ± 4.6 and CE-angle = 32.6° ± 6.0° (mean ± SD). The evaluation was made by two experienced pediatric orthopedics. The left asymptomatic hip was used as the basis for the current FE model. Four different models were created based on the bone geometry from the 10-year-old girl: (1) adult’s bone mechanical properties (greater stiffness and yield stress) and cartilage thickness of 5.0 mm, (2) adult’s bone mechanical properties and cartilage thickness of 2.7 mm, (3) children’s bone mechanical properties (lower stiffness and yield stress) and cartilage thickness of 5.0 mm and (4) children’s bone mechanical properties and cartilage thickness of 2.7 mm. The geometrical structure of the bones were the same in all four models.
Challenges
CT scan of the hip of a 10-year-old girl was performed as part

Citation: Skytte TL, Mikkelsen LP, Sonne-Holm S, Wong C (2017) Using a Finite Element Pediatric Hip Model in Clinical Evaluation - A Feasibility Study. J Bioengineer & Biomedical Sci 7: 241. doi: 10.4172/2155-9538.1000241
Page 2 of 7
Volume 7 • Issue 5 • 1000241J Bioengineer & Biomedical Sci, an open access journalISSN: 2155-9538
of the clinical treatment protocol. A body weight (BW) of 32 kg was used throughout the paper. In the specific case the right hip was found to be slightly dysplastic while the left hip was evaluated as normal with an acetabular index (AI) of 14.7 and a centre edge (CE) angle of 33.5° [3,13]. Normal values for a 10-year-old are AI = 9.1 ± 4.6 and CE-angle = 32.6° ± 6.0° (mean ± SD) [14]. The evaluation was made by two experienced pediatric orthopedics. The left asymptomatic hip was used as the basis for the current FE model. Four different models were created based on the bone geometry from the 10-year-old girl:
(1) Adult’s bone mechanical properties (greater stiffness and yield stress) and cartilage thickness of 5.0 mm, (2) Adult’s bone mechanical properties and cartilage thickness of 2.7 mm, (3) Children’s bone mechanical properties (lower stiffness and yield stress) and cartilage thickness of 5.0 mm and (4) Children’s bone mechanical properties and cartilage thickness of 2.7 mm. The geometrical structure of the bones were the same in all four models.
Model generation
The geometry of the bone was segmented from CT using ScanIP+FE 5.1 (Simpleware, Exeter, UK). The segmentation was mainly automatic using gray scale values. Morphological filters and smoothing of the surfaces were used. The cortical bone was assigned a thickness of approximately 2 mm and a stiffness of E=17.0 GPa [15]. No correlation between Hounsfield Unit (HU) and density was available for the current data. Instead, the density (ρ [gcm−3]) of the trabecular bone was assumed to be within the range of ρ=0.1-0.7 g cm−3.37 A linear relationship between HU and density was used [11]. Stiffness (E [MPa]) of trabecular bone were dependent of density by E = 2017.3 MPa
•(ρ/ρ0)2.46 for the pelvic bone16 and E=1157 MPa
•(ρ/ρ0)1.78 for the femoral bone37, where ρ0=1 g/cm3
Cortical and trabecular bone were assigned plastic material properties with yield stress (σy, [MPa]) corresponding to the compressive strengths reported by Wirtz et al. [15]. Material properties and numbers of elements are listed in Table 1. Ohman et al. (2011) found that children’s femoral cortical bone had significant lower compressive Young’s modulus (-34%) and yield stress (-38%), but higher compressive ultimate strain (+24%) than the adult bone tissue. Therefore models with bone mechanical properties of a child were also created. Stiffness and yield stress of trabecular bone were scaled using the findings by O¨ hman et al. (Table 2) [4].
Boundary conditions and loading
The geometry was exported as an orphan mesh to Abaqus 6.13-3 (Simulia Corp., Providence, RI, USA). The positions of pelvis and femur during the scan were maintained. Nodes at the pubis symphysis, sacroiliac joint and the superior rim of the pelvis were fixed as a reference position (Figure 1). Boundaries were picked far from the acetabulum to ensure the output of interest was not influenced. The distal part of the femoral bone was constrained by four springs with a spring stiffness of 10 N/mm, but was otherwise free to translate and rotate. Load was applied to the center of the femoral head using directions found by Bergmann et al. [16]. They reported a maximum load of 233% BW during normal walking (medial=52%, anterior=32%, superior=225%). The direction was maintained while the magnitude was scaled from 50% to 300% BW. Only one loading direction was used because Harris et al. found greater variation among subjects than among loading scenarios [16]. Muscles and
Material Property Reference
Cortical bone (pelvic and
femoral)
Linear elastic plastic, isotropic, homogeneous Stiffness, E=17.0 GPa
[14,25]Poisson's ratio, v=0.29
Yield stress, ay=70-100 MPa
No. elements (pelvis)=94 141
No. elements (femur)=36 754
Pelvic trabecular
bone
Linear elastic plastic, isotropic
Stiffness, E=9-506 MPa
[6,7,14]Poisson's ratio, ll=0.2
Yield stress ay=1-13 Mpa
No. elements=95 405
Femoral trabecular
bone
Linear elastic, isotropic Stiffness, E=23-508 MPa Poisson's ratio, v=0.2 [14,31]
Yield stress, ay=1-13 MPa
No. elements=45 745
Cartilage
Hyper-elastic neo-Hookean (eq. 1) Shear modulus, a=6.8 MPa Poisson's
ratio, v=0.490
[1,7,10,12,13]
Thickness=5.0 mm
OR Thickness=2.7 mm
Table 1: Material properties used in the adult-property models.
Material Property Reference
Cortical boneStiffness, E=11.8 GPa
Ohman et al. [4]Yield stress, o-y=78-146 MPa
Pelvic bone trabecularStiffness, E=6-324 MPa Scaled using
Ohman et al. [4]Yield stress, o-y=0.6-8 MPa
Femoral bone trabecularStiffness, E=15-325 MPa Scaled using
Ohman et al. [4]Yield stress, o-y=0.6-8 MPa
Table 2: Material properties used in the child-property models. Properties are only stated if different from the adult properties listed in Table 1.
ligaments were not included in the model. Instead, their effect on the hip joint was replaced by applying the load to the femoral head [17]. To avoid rigid rotations and improve stability, 12 springs were applied around the joint (k = 1 N/mm). Analyses were conducted in Abaqus/Explicit. Explicit analyses are efficient for large models and have a robust contact algorithm. Because explicit problems are solved as wave propagation problems, waves of stress in the model are seen. The problem was solved as a quasistatic problem and for numerical purposes, mass scaling was used.
Cartilage
Cartilage was modeled as an interaction between the surfaces of the bone in the acetabulum and the femoral head. Cartilage thickness in the hip joint of children have been measured to 5.41 ± 0.17 mm by Hughes et al. and 2.59 ± 0.41 mm by Spannow et al. [18,19]. Because of this large difference, models were created with an interaction thickness of either 5.0 mm or 2.7 mm. The contact surfaces of both the acetabulum and the femoral head were picked by hand. For every node on each surface, the shortest distance to the opposite surface

Citation: Skytte TL, Mikkelsen LP, Sonne-Holm S, Wong C (2017) Using a Finite Element Pediatric Hip Model in Clinical Evaluation - A Feasibility Study. J Bioengineer & Biomedical Sci 7: 241. doi: 10.4172/2155-9538.1000241
Page 3 of 7
Volume 7 • Issue 5 • 1000241J Bioengineer & Biomedical Sci, an open access journalISSN: 2155-9538
laretaLroiretnA
Figure 1: FE model of the hip joint in anterior and lateral view. Boundary conditions are marked in orange.
was extracted and used to calculate the resulting stress in the normal direction. Equation 1 expresses the normal stress in a hyper-elastic neo-Hookean material [20].
( ) ( ) ( ) ( )( ) ( )5 2 /3 2 2 2 1 22 11 1 1
3v v v vvµ
σ λ λ λ λ− + + − −+= − + −
Here λ =]0, 1], where λ = ε + 1 with ε being the engineering strain, ε = ∆l/l. The material 134 properties used were shear modulus µ = 6.8 MPa and Poisson’s ratio ν = 0.490 (Table 1).
Verification For modeling surface pressure in an idealized joint, FE models
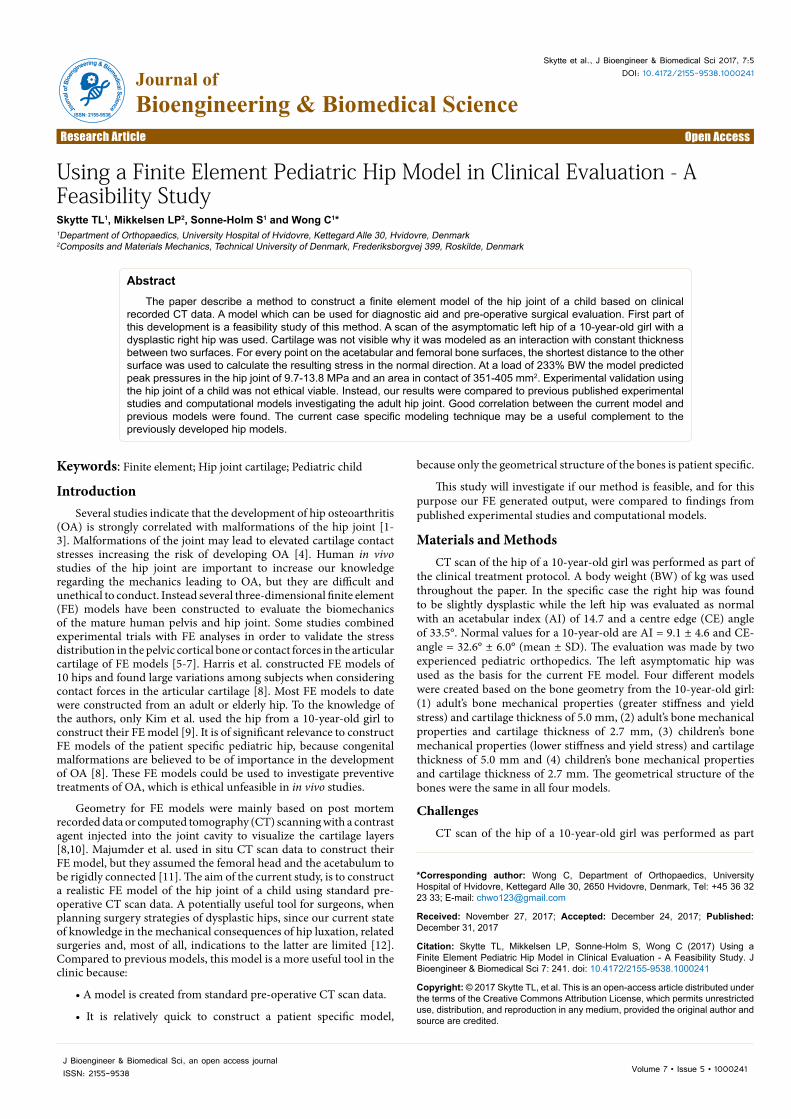
with geometrical layers of cartilage, have previously been verified using analytical models [21,22]. To explore the effect of incorporating the cartilage into the interaction model, FE models of an idealized joint were constructed and compared. Cartilage was modeled by one- or two-layers of geometrical cartilage or an interaction (Figure 2). When subjecting the models to the same load, the contact area and pattern were compared. Contact areas were expressed as a percentage of the maximum area. For both the interaction model and the one-layer model, the rise in contact area is steep compared to the two-layer model (Figure 3). The interaction model reaches the maximum area in contact with a load of 100 N while the two-layer model reaches maximum as the load exceeds 400 N. For the one-layer model, the contact area does not exceed 85% of the maximum possible area, but this is reached at a load of 150 N. The contact pressure at the outer rim is low for the interaction and one-layer cartilage models compared to the two-layer cartilage model (Figure 4). In the two-layer model, a minimum is located in the center of the socket. The maximum contact pressure is similar for the interaction and two-layer cartilage models (1.05 and 1.06 MPa respectively), while it is higher for the one-layer model (1.40 MPa). The low contact pressure in the center of the two-layer model and the higher pressure at the rim are more clear if the contact pressure is plotted with respect to the normalized distance from the center (Figure 5). Although the geometry is idealized, points of high pressure are locally seen in the models. This is caused by stress wave propagation in the explicit analyses, but is judged not to influence the overall response. Anderson et al. combined an experimental and a computational study to validate a FE model of the hip joint with respect to cartilage contact pressure and contact area [7]. Their cartilage consisted of two geometrical
27.6 mm 25.0 mm 1.3 mm
2 Layer
27.6 mm 25.0 mm 2.6 mm
1 Layer
27.6 mm 25.0 mm 2.6 mm
Interaction
Figure 3: Contact area and force due to contact pressure in the model with an idealised geometry when modelling the cartilage as an interaction, two geometrical layers or one geometric layer. The contact area is expressed as a percentage of maximum possible contact area.
Figure 4: Contour plots of the contact pressure [MPa] in the socket model with an idealised geometry when modelling the cartilage as an interaction, two geometrical layers or one geometric layer. Maximum contact pressure were 1.05, 1.06 and 1.40 MPa respectively for the three models.
layers with varying thickness. This approach may be considered to be the gold standard in FE modeling of the hip joint. Based on the observed behavior of the simplified joint model, the FE models of the actual hip geometry, incorporating the cartilage into the interaction, are expected to (1) overestimate area in contact with loads below 400 N, (2) underestimate contact pressure at the outer rim and (3) overestimate contact pressure at the center of the socket.
ResultsThe model was loaded by 50-300% BW. As the load was increased,
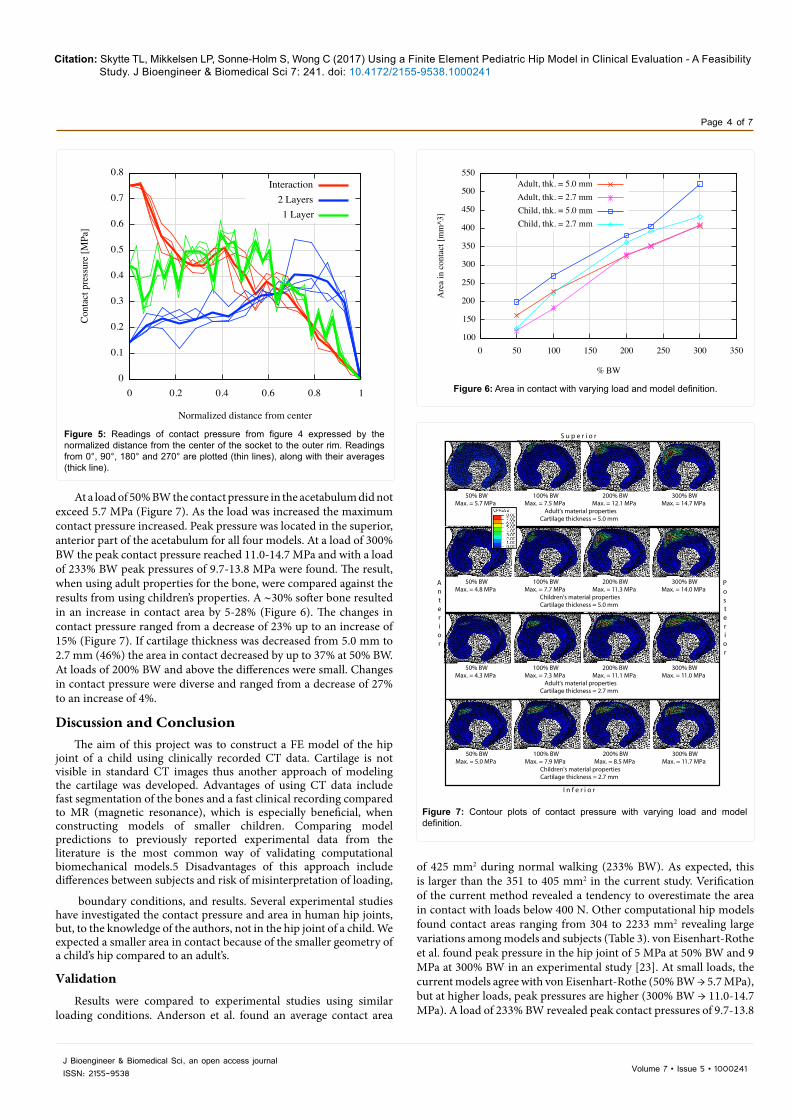
the area in contact in the hip joint was increased (Figure 6). At 233% BW the area in contact ranged from 351 to 405 mm2 depending on cartilage thickness and bone properties. At 50% BW the area in contact ranged 120-198 mm2 while a load of 300% BW revealed a contact area of 407-521 mm2.
Figure 2: FE model of an idealized joint used for verification of the interaction. Model with cartilage modelled as an interaction (left), with two-layers of geometrical cartilage (middle), and with one-layer of geometrical cartilage (right). The dark grey region represents the bone; the light gray region is the cartilage, while the arrows represent the interaction. The black region shows the frictionless interface from where results were extracted.
Citation: Skytte TL, Mikkelsen LP, Sonne-Holm S, Wong C (2017) Using a Finite Element Pediatric Hip Model in Clinical Evaluation - A Feasibility Study. J Bioengineer & Biomedical Sci 7: 241. doi: 10.4172/2155-9538.1000241
Page 4 of 7
Volume 7 • Issue 5 • 1000241J Bioengineer & Biomedical Sci, an open access journalISSN: 2155-9538
Figure 5: Readings of contact pressure from figure 4 expressed by the normalized distance from the center of the socket to the outer rim. Readings from 0°, 90°, 180° and 270° are plotted (thin lines), along with their averages (thick line).
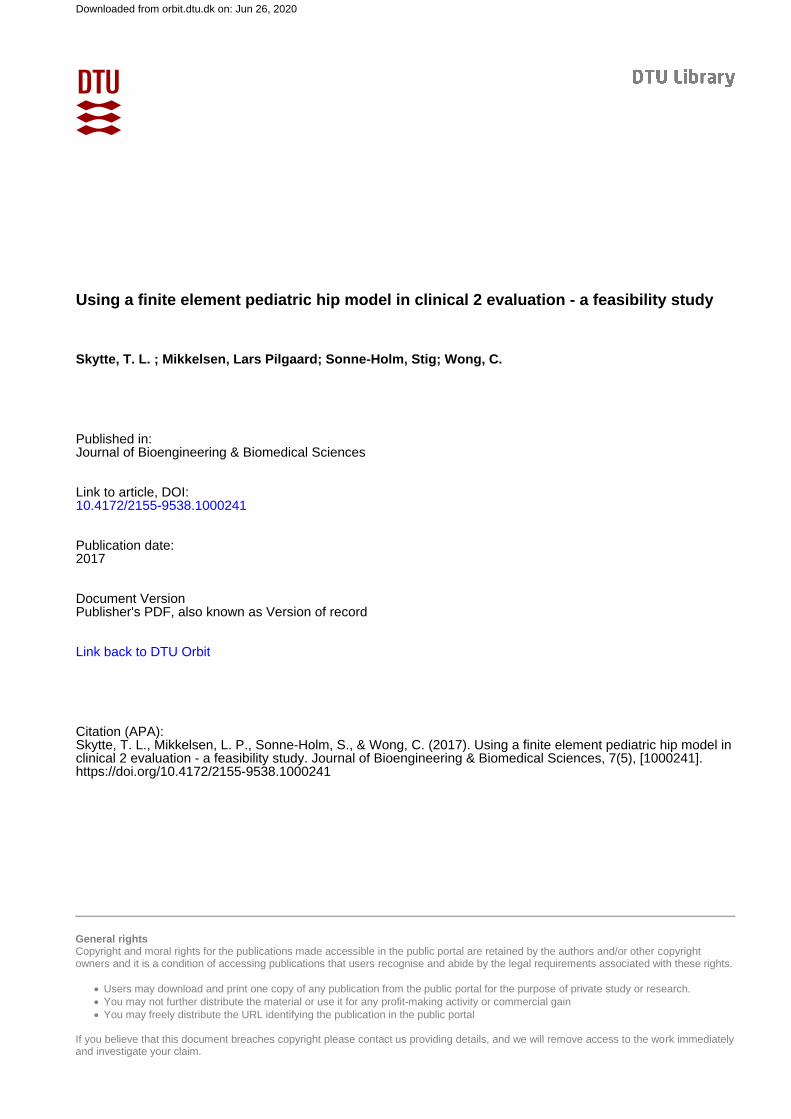
At a load of 50% BW the contact pressure in the acetabulum did not exceed 5.7 MPa (Figure 7). As the load was increased the maximum contact pressure increased. Peak pressure was located in the superior, anterior part of the acetabulum for all four models. At a load of 300% BW the peak contact pressure reached 11.0-14.7 MPa and with a load of 233% BW peak pressures of 9.7-13.8 MPa were found. The result, when using adult properties for the bone, were compared against the results from using children’s properties. A ∼30% softer bone resulted in an increase in contact area by 5-28% (Figure 6). The changes in contact pressure ranged from a decrease of 23% up to an increase of 15% (Figure 7). If cartilage thickness was decreased from 5.0 mm to 2.7 mm (46%) the area in contact decreased by up to 37% at 50% BW. At loads of 200% BW and above the differences were small. Changes in contact pressure were diverse and ranged from a decrease of 27% to an increase of 4%.
Discussion and ConclusionThe aim of this project was to construct a FE model of the hip
joint of a child using clinically recorded CT data. Cartilage is not visible in standard CT images thus another approach of modeling the cartilage was developed. Advantages of using CT data include fast segmentation of the bones and a fast clinical recording compared to MR (magnetic resonance), which is especially beneficial, when constructing models of smaller children. Comparing model predictions to previously reported experimental data from the literature is the most common way of validating computational biomechanical models.5 Disadvantages of this approach include differences between subjects and risk of misinterpretation of loading,
boundary conditions, and results. Several experimental studies have investigated the contact pressure and area in human hip joints, but, to the knowledge of the authors, not in the hip joint of a child. We expected a smaller area in contact because of the smaller geometry of a child’s hip compared to an adult’s.
Validation
Results were compared to experimental studies using similar loading conditions. Anderson et al. found an average contact area
Adult's material propertiesCartilage thickness = 5.0 mm
50% BWMax. = 5.7 MPa
100% BWMax. = 7.5 MPa
200% BWMax. = 12.1 MPa
300% BWMax. = 14.7 MPa
Children's material propertiesCartilage thickness = 5.0 mm
50% BWMax. = 4.8 MPa
100% BWMax. = 7.7 MPa
200% BWMax. = 11.3 MPa
300% BWMax. = 14.0 MPa
Adult's material propertiesCartilage thickness = 2.7 mm
50% BWMax. = 4.3 MPa
100% BWMax. = 7.3 MPa
200% BWMax. = 11.1 MPa
300% BWMax. = 11.0 MPa
Children's material propertiesCartilage thickness = 2.7 mm
50% BWMax. = 5.0 MPa
100% BWMax. = 7.9 MPa
200% BWMax. = 8.5 MPa
300% BWMax. = 11.7 MPa
Posterior
Anterior
S u p e r i o r
I n f e r i o r
Figure 7: Contour plots of contact pressure with varying load and model definition.
of 425 mm2 during normal walking (233% BW). As expected, this is larger than the 351 to 405 mm2 in the current study. Verification of the current method revealed a tendency to overestimate the area in contact with loads below 400 N. Other computational hip models found contact areas ranging from 304 to 2233 mm2 revealing large variations among models and subjects (Table 3). von Eisenhart-Rothe et al. found peak pressure in the hip joint of 5 MPa at 50% BW and 9 MPa at 300% BW in an experimental study [23]. At small loads, the current models agree with von Eisenhart-Rothe (50% BW → 5.7 MPa), but at higher loads, peak pressures are higher (300% BW → 11.0-14.7 MPa). A load of 233% BW revealed peak contact pressures of 9.7-13.8
Figure 6: Area in contact with varying load and model definition.

Citation: Skytte TL, Mikkelsen LP, Sonne-Holm S, Wong C (2017) Using a Finite Element Pediatric Hip Model in Clinical Evaluation - A Feasibility Study. J Bioengineer & Biomedical Sci 7: 241. doi: 10.4172/2155-9538.1000241
Page 5 of 7
Volume 7 • Issue 5 • 1000241J Bioengineer & Biomedical Sci, an open access journalISSN: 2155-9538
MPa in the current study. This is in agreement with an experimental study by Anderson et al. that found contact pressures to exceed 10 MPa at 233% BW [7]. Abraham et al. used a similar approach for modeling cartilage with discrete element analysis (DEA) but with position dependent cartilage thickness and rigid bones [24]. DEA estimated higher contact stresses and lower contact area compared to a FE model with hyperelastic cartilage and rigid bones. Unfortunately, they did not evaluate their model against a FE model with elastic bones despite Anderson et al. demonstrated that assuming rigid bones might alter cartilage contact stresses in the hip joint [7]. Anderson et al. investigated the impact of several common simplifications in FE models [25]. Using a model with subject-specific bone geometry, cartilage thickness, and bone material properties as the gold standard, they found models with constant cartilage thickness to overestimate contact cartilage pressure and underestimate contact area. Keeping this in mind, we expected the current models to overestimate peak pressures and reveal a smaller area in contact compared to other
studies. When reviewing published studies, both experimental and computational, this was true in most cases (Table 3). Differently from other studies, the bone geometry from a 10-year-old girl’s hip was used. This revealed several challenges. Than et al. evaluated radiographic parameters of the hip joint from birth to adolescence. At 10-years of age, 70% had the center of the femoral head located inside the acetabulum entrance, while at 16-years of age the number was 95%. Therefore, the current model was less stable than a model of a mature hip. These challenges were overcome by applying springs around the hip joint. In the CT data, the femoral growth plate and Y-cartilage in the acetabulum were visible. The bone geometry was incomplete when automatic segmentation by threshold was used, and manual adjustment was necessary. Material properties of growth plates resemble that of cartilage [26]. For evaluation purposes, the growth plates were omitted to simulated a scenario as close to the adult hip as possible. Soft tissues such as cartilage or labrum is not visible in standard CT data. Most experimental studies and computational
Experimental Study Hips Loads Peak pressure Area in a in contact
Brown and Shaw [20] Cadaver Normal, n=17, no info on labrum Resultant joint load=2.7 kN 8.80 MPa -
Afoke et al. [2] Cadaver Normal, n=5, male=2, age=58 86, weight=60-73 kg, labrum removed Walking (3.3, 1.3, 4.1 × BW) 2.9-10.6 Mpa -
von Eisenhart-Rothe et al. [33] Cadaver Normal, n=2, male, age=34, 52, labrum intact Slow walking, 50-300% BW 5-9 Mpa -
von Eisenhart et al. [33] Cadaver Healthy, n=8, age=18-75 labrum intact Midstance, 345% BW 3.75-9.75 Mpa -
Anderson et al. [6] Cadaver Normal, n=1, male, age=25, weight=82 kg,
labrum removed Avg. normal walking 1.7-10.0k MPa 425.1 mm2 (entire range)
Computational Study Hips Load Peak pressure Area in contact
Bachtar et al. [17] FE, cadaver, Normal, n=1, female, age=71, weight=41kg,
no labrum Normal walking (avg.) 5.50 MPa - (at≈ 200% BW) -
Russel et al. [34] FE, CT with contrast
Normal, n=1, male, age=38, weight=90 kg, no labrum
Gait (stance phase) of 67 kg 72-year-old male
1.75 Mpa 2233 mm2
Dysplastic, n=6, male=1, age=28-53 weight=51-74 kg, no labrum 6.59 ± 1.90 Mpa 569 ± 97 mm2
Asymptomatic, n=5, male=1, age=28-53, weight=51-74 kg, no labrum 5.25 ± 1.02 Mpa 663 ± 55 mm2
Anderson et al. [2] FE, cadaver, Normal, n=1, male, age=25, weight=82 kg,
no labrum Avg. normal walking 10.78 MPa 304 mm2
Harris et al. [8] FE, CT with contrast Healthy, n=10, male=5, age=26+4, no labrum Daily activities (avg.) 7.16 ± 2.62 Mpa
657 + 43 mm2 (total = 1936 +
295)
Abraham et al. [2]
DEA, cadaver/FEA, cadaver
Normal, n=1, male, age=25, weight=82 kg, no labrum, rigid bones Daily activities (avg.)
9.8-13.6 Mpa 870-1220 mm2
6.2-9.8 Mpa 900-1320 mm2-
Current study FE, clinical CT Asymptomatic, n=1, girl, age=10 weight=32, no labrum
Max. during normal walking 233% BW 9.7-13.8 Mpa 351-405 mm2
351-405 mm2
50% BW 4.3-5.7 Mpa 120-198 mm2
300% BW 11.0-14.7 Mpa 407-521 mm2
Table 3: Computational and experimental studies concerning cartilage contact forces. Computational models are only included is they are based on subject specific anatomy and modeled in 3 dimensions.

Citation: Skytte TL, Mikkelsen LP, Sonne-Holm S, Wong C (2017) Using a Finite Element Pediatric Hip Model in Clinical Evaluation - A Feasibility Study. J Bioengineer & Biomedical Sci 7: 241. doi: 10.4172/2155-9538.1000241
Page 6 of 7
Volume 7 • Issue 5 • 1000241J Bioengineer & Biomedical Sci, an open access journalISSN: 2155-9538
models regarding the hip joint have removed labrum (Table 3). Henak et al. investigated the impact of including or removing labrum in FE models [27]. In a normal hip, the load supported by the labrum was limited, but in a dysplastic hip, the labrum did support a significant amount of load. It is possible that labrum and other soft tissues do provide a considerable amount of support in the pediatric hip joint as well, but we compensated for this by applying supporting springs. The current model was constructed with subject specific bone geometry while the cartilage thickness was assumed to be constant. Because of discrepancies in the literature concerning cartilage thickness in the hip joints of children, a thickness of either 2.7 or 5.0 mm were used [19,20]. Because of the lack of an appropriate experimental study for validation purposes, it was not possible to determine which of the constant thicknesses that provides the most realistic response. In general, the thicker cartilage revealed a larger area in contact, but also a higher peak pressure. Kim et al. constructed a FE model of the pelvis of a 10-year old child and used an experimental study to adjust the material properties from an adult’s to a child’s [25]. Their updated bone material properties were in accordance with the findings by Currey and Butler [28]. Due to different loading conditions it was not possible to compare findings from their study with the majority of FE studies concerning hip joints. In the current study, we used the same loading conditions as the majority of similar studies, why it is not possible to compare our results to Kim et al. [18] The outer geometry of the bone was subject specific, but the thickness of the cortical bone was estimated in this study. Both Dalstra et al. [29] and Anderson et al. [30] combined an experimental study with a FE model of the pelvis modeled with either mean or position dependent cortical bone thickness [5,6]. For predicting von Mises stress in the cortical bone, a FE model with position-dependent cortical thickness performed better, though not significantly [6]. Joint mechanics was not investigated. Therefore, the impact of using an even cortical bone thickness is unclear when the output parameters are contact area and contact pressure in the hip joint.
Although the current model was constructed from an asymptomatic hip that was deemed normal, the other hip was slightly dysplastic. Russel et al. used FE models to compare cartilage contact pressures in symptomatic (n=6) and asymptomatic (n=5) hips in patients with dysplasia [10]. They concluded that although an asymptomatic hip appears normal on plane radiographs, the cartilage contact pressure cannot be assumed to be normal. Harris et al. [31,32] used FE models to investigate the contact stresses in 12 normal, healthy human hips and found greater variation among subjects than among loading scenarios [19]. An experimental study by Dalstra et al. used both the left and right hip from the same subject and found large left/right differences in cortical principal stresses [17,33,34]. Even in normal, healthy hips, large variations among subjects are therefore to be expected. In conclusion, we have created a FE model of the hip joint of a child from a clinical recorded CT. The impact of changing material properties of bone or the thickness of the cartilage was limited if the output was contact area or pressure. The models showed good correlation to experimental studies, when using loading conditions as close to experimental as possible. For comparison of several hips, the current method is relevant, because it is relatively fast to construct a new model from CT data.
Conflict of Interest
We gratefylly acknowledge financial support from the Lundbeck Foundation, Elsass Foundation, Dagmar Marshall Foundation, Axel Muusfeldt Foundation, Direktør Jacob Madsenog Hustru Olga Madsen Foundation and RegionH.
Acknowledgment
We thank R. Salmingo, M. Traberg and K. Henneberg from Department of Electrical Engineering at the Technical University of Denmark for support with segmentation of the models.
References
1. Helwig P, Hindenlang U, Hirschmu¨ller A, Konstantinidis L, Su¨dkamp N, et al. (2011) A femoral model with all relevant muscles and hip capsule ligaments. Comput Methods Biomech Biomed Engin 16: 669-677.
2. Harris M, Anderson A, Henak C, Ellis B, Peters C, et al. (2012) Finite element prediction of cartilage contact stresses in normal human hips. J Orthop Res 30: 1133-1139.
3. Li G, Sakamoto M, Chao E (1997) A comparison of different methods in predicting static pressure distribution in articulating joints. J Biomech 30: 635-638.
4. Ohman C, Baleani M, Pani C, Taddei F, Alberghini M, et al. (2011) Compressive behaviour of child and adult cortical bone. Bone 49: 769-776.
5. Gosvig K, Jacobsen S, Sonne-Holm S, Palm H, Troelsen A (2010) Prevalence of malformations of the hip joint and their relationship to sex, groin pain, and risk of osteoarthritis: A population-based survey. J Bone Joint Surg Am 92: 1162-1169.
6. Anderson A, Peters C, Tuttle B, Weiss J (2005) Subject-specific finite element model of the pelvis: Development, validation and sensitivity studies. J Biomech Eng 127: 364-373.
7. Anderson A, Ellis B, Maas S, Peters C, Weiss J (2008) Validation of finite element predictions of cartilage contact pressure in the human hip joint. J Biomech Eng 130: 051008.
8. Harris W (1986) Etiology of osteoarthritis of the hip. Clin Orthop Relat Res, pp: 20-33.
9. Klit J, Gosvig K, Jacobsen S, Sonne-Holm S, Troelsen A (2011) The prevalence of predisposing deformity in osteoarthritic hip joints. Hip Int 21: 537-541.
10. Spannow A, Stenboeg E, Pfeier-Jensen M, Herlin T (2007) Ultrasound measurement of joint cartilage thickness in large and small joints in healthy children: A clinical pilot study assessing observer variability. Pediatr Rheumatol Online J 5: 3.
11. Mavcic B, Iglic A, Kralj-Iglic A, Brand R, Vengust R (2008) Cumulative hip contact stress predicts osteoarthritis in DDH. Clin Orthop Relat Res 466: 884-891.
12. Brown C, Nguyen T, Moody H, Crawford R, Oloyede A (2009) Assessment of common hyperelastic constitutive equations for describing normal and osteoarthritic articular cartilage. Proc Inst Mech Eng H 223: 643-652.
13. Hughes L, Aronson J, Smith H (1999) Normal radiographic values for cartilage thickness and physeal angle in the pediatric hip. J Pediatr Orthop 19: 443-448.
14. Wirtz D, Schiers N, Pandorf T, Radermacher K, Weichert D, et al. (2000) Critical evaluation of known bone material properties to realize anisotropic FE-simulation of the proximal femur. J Biomech 33: 1325-1330.
15. Eisenhart VR, Adam C, Steinlechner M, Mu¨ller-Gerbl M, Eckstein F (1999) Quantitative determination of joint incongruity and pressure distribution during simulated gait and cartilage thickness in the human hip joint. J Orthop Res 17: 532-539.
16. Bergmann G, Deuretzbacher G, Heller M, Graichen F, Rohlmann A, et al. (2001) Hip contact forces and gait patterns from routine activities. J Biomech 34: 859-871.
17. Bachtar F, Chen X, Hisada T (2006) Finite element contact analysis of the hip joint. Med Biol Eng Comput 44: 643-651.
18. Kim JE, Li Z, Ito Y, Huber C, Shih A, et al. (2009) Finite element model development of a child pelvis with optimization-based material identification. J Biomech 42: 2191-2195.
19. Than P, Sillinger T, Kranicz J, Bellyei A (2004) Radiographic parameters of the hip joint from birth to adolescence. Pediatr Radiol 34: 237-244.
20. Brown T, Shaw D (1983) In vitro contact stress distributions in the natural human hip. J Biomech 16: 373-384.
21. Bartel D, Burstein A, Toda M, Edwards D (1985) The efect of conformity and plastic thickness on contact stresses in metal-backed plastic implants. J Biomech Eng 107: 193-199.

Citation: Skytte TL, Mikkelsen LP, Sonne-Holm S, Wong C (2017) Using a Finite Element Pediatric Hip Model in Clinical Evaluation - A Feasibility Study. J Bioengineer & Biomedical Sci 7: 241. doi: 10.4172/2155-9538.1000241
Page 7 of 7
Volume 7 • Issue 5 • 1000241J Bioengineer & Biomedical Sci, an open access journalISSN: 2155-9538
22. Majumder S, Roychowdhury A, Pal S (2007) Simulation of hip fracture in sideways fall using a 3D finite element model of pelvis-femur-soft tissue complex with simplified representation of whole body. Med Eng Phys 29: 1167-1178.
23. Wiberg G (1939) Studies on dysplastic acetabula and congenital subluxation of the hip joint with special reference to the complication of osteo-arthritis. Acta Chir Scand.
24. Abraham C, Maas S, Weiss J, Ellis B, Peters C, et al. (2013) A new discrete element analysis method for predicting hip joint contact stresses. J Biomech 46: 1121-1127.
25. Anderson A, Ellis B, Maas S, Weiss J (2010) Efects of idealized joint geometry on finite element predictions of cartilage contact stresses in the hip. J Biomech 43: 1351-1357.
26. Currey J, Butler G (1975) The mechanical properties of bone tissue in children. J Bone Joint Surg Am 57: 810-814.
27. Hilgenreiner H (1925) For the early diagnosis and early treatment of the innate hip joint dislocation (In German). Med Klin 21: 1385.
28. Dalstra M, Huiskes R, Odgaard A, Van Erning L (1993) Mechanical and textural
properties of pelvic trabecular bone. J Biomech 26: 523-535.
29. Dalstra M, Huiskes R, Van Erning L (1995) Development and validation of a three-dimensional finite element model of the pelvic bone. J Biomech Eng 117: 272-278.
30. Anderson A, Ellis B, Weiss J (2007) Verification validation and sensitivity studies in computational biomechanics. Comput Methods Biomech Biomed Engin 10: 171-184.
31. Henak C, Ellis B, Harris M, Anderson A, Peters C, et al. (2011) Role of the acetabular labrum in load support across the hip joint. J Biomech 44: 2201-2206.
32. Bergmann G, Graichen F, Rohlmann A (1993) Hip joint loading during walking and running, measured in two patients. J Biomech 26: 969-990.
33. Eisenhart-Rothe VR, Eckstein F, Mu¨ller-Gerbl M, Landgraf J, Rock C, et al. (1997) Direct comparison of contact areas, contact stress and subchondral mineralization in human hip joint specimens. Anat Embryol 195: 279-288.
34. Russell M, Shivanna K, Grosland N, Pedersen D (2006) Cartilage contact pressure elevations in dysplastic hips: a chronic overload model. J Orthop Surg Res 1: 6.