Embed Size (px)
Citation preview
USGS Oil and Gas ResourceAssessments and Hydraulic Fracturing
Brenda Pierce, U.S. Geological Survey
June 8, 2012

Total Petroleum System
24803
Petroleum System ElementsPetroleum System Elements
120° F120° F
350° F350° FGenerationGeneration
MigrationMigration
Seal RockSeal Rock
Reservoir RockReservoir Rock
OilOil
WaterWater
Gas CapGas Cap
EntrapmentEntrapment
Source Rock
Armentrout, 2001

Conventional Reservoir
Medium-grained,
cross-bedded sandstone
Thin section photomicrograph
Spiro Sandstone
Core slab

Continuous Reservoir
Weakly Laminated
Shale
Strongly Laminated
Shale
(Slatt and others, 2011)
Thin section photomicrographs
Woodford Shale

QOQO
Photomicrograph of an uncemented sandstone from the Jurassic Morrison Fm. Blue is epoxy that fills primary pores (between grains) and some secondary pores that have developed from partial dissolution of some detrital feldspar grains.
Photomicrograph from a tight sandstone in the Bossier Fm. It is tight due to abundantquartz overgrowths (QO), and porosity exists between adjacent quartz overgrowths
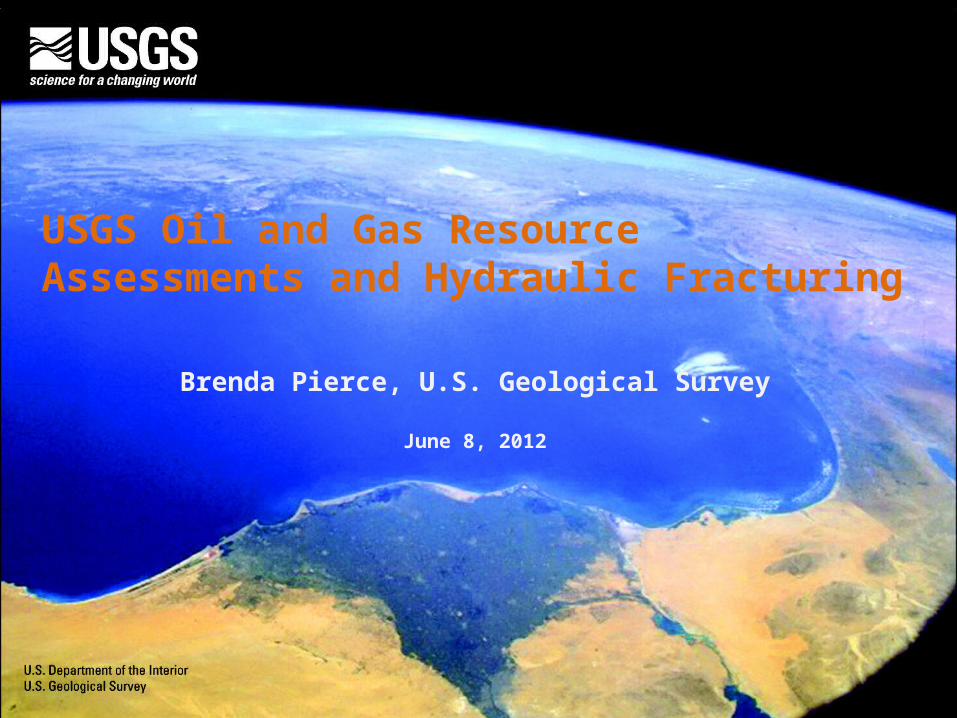
Goal of USGS Assessments

Continuous Methodology
Geologic characterization of assessment units Drainage areas of wells (cell sizes) Number of potential cells (tested and untested) Engineering data –
well production and
performance EUR (estimated
ultimate recovery)
distribution
Woodford Shale – Horizontal Well Density

USGS Continuous Oil and Gas Resource Estimates
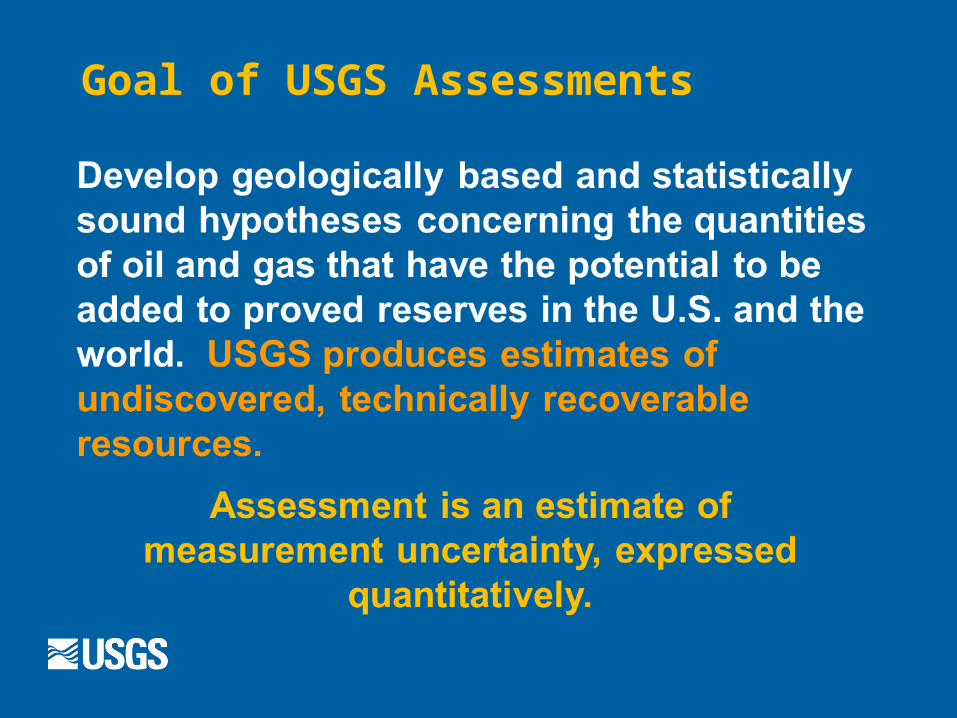
http://energy.usgs.gov/OilGas/AssessmentsData/NationalOilGasAssessment/AssessmentUpdates.aspx
USGS Shale Gas and Tight Gas Resource Estimates

Source rocks of the Alaska North Slope: estimates (95-percent to 5-percent probability) range from zero to 2 billion barrels of oil and from zero to nearly 80 trillion cubic feet of gas.

Example: Bakken Formation (2008)
Mean total = 3.65 BBO (F95=3.0 BBO; F5=4.3 BBO)
Changes result from improved geologic understanding, technological developments, other factors
USGS 1995 Bakken Assessment: Mean total = 151 MMBO
973 MMBO
909 MMBO
868 MMBO
410 MMBO
485 MMBO
Resource Assessments Change Over Time

http://www.eia.gov/todayinenergy/detail.cfm?id=3750
Bakken Oil Production

1989
1990
1991
1992
1993
1994
1995
1996
1997
1998
1999
2000
2001
2002
2003
2004
2005
2006
2007
2008
2009
0
500
1000
1500
2000
2500
3000
3500
U.S. Unconventional Gas ProductionB
illio
ns o
f Cub
ic F
eet
Year
Coalbed Methane
Shale Gas
Source: Energy Information Administration

Hydraulic Fracturing• Water use• Chemicals used• Fate of injected fluid• Flowback quality

Collection of produced water
Characterization, Impacts, and Use of Produced Waters
USGS produced waters database and extent of U.S. shale gas plays
Bakken Formation – extent of USGS assessment units and hydraulically , fractured wells.

http://energy.usgs.gov