Embed Size (px)
Citation preview
S fU.S. Department of Energy’s Vehicle Technologies Program
NYC TLC - Plug-in Electric Vehicle I f t t d U I f tiInfrastructure and Usage Information
Jim FrancfortIdaho National Laboratoryy
NYC Taxi and Limousine CommissionNew York, New York,February 2013This presentation does not contain any proprietary or sensitive information
Idaho National Laboratory Bio-massBio-mass
N lNuclearHydropowerHydropower
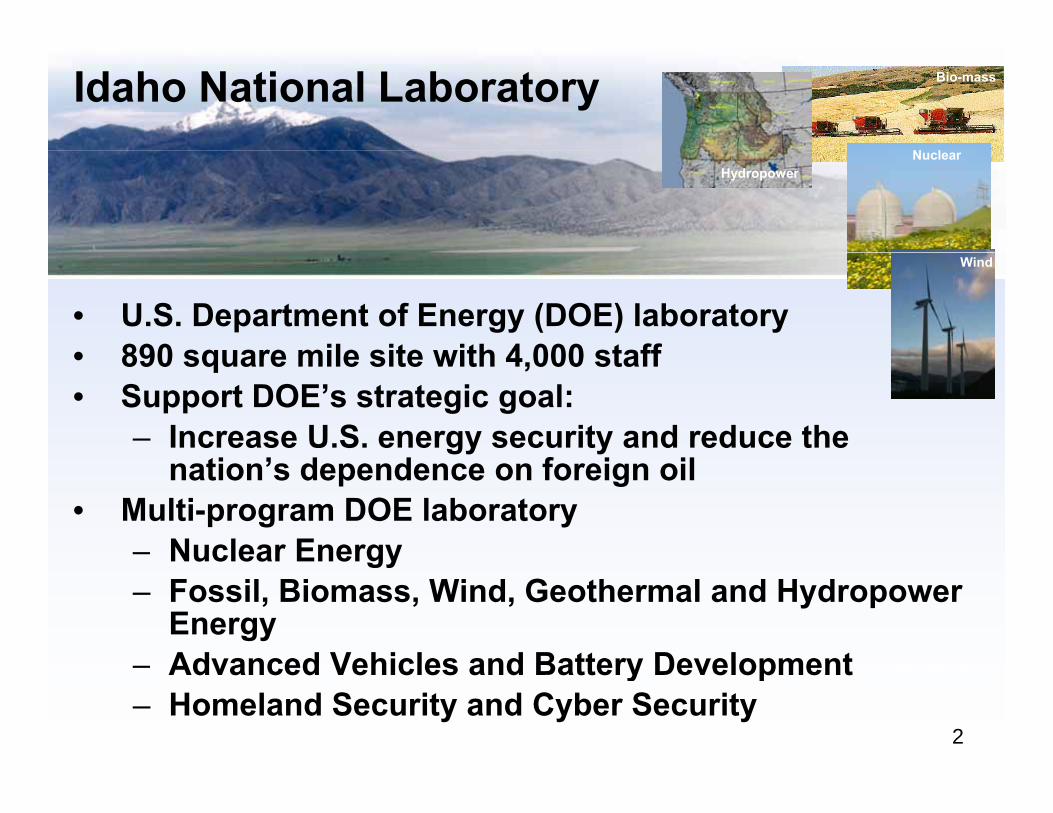
• U.S. Department of Energy (DOE) laboratory • 890 square mile site with 4 000 staff
WindWind
• 890 square mile site with 4,000 staff• Support DOE’s strategic goal:
– Increase U.S. energy security and reduce the ti ’ d d f i ilnation’s dependence on foreign oil
• Multi-program DOE laboratory– Nuclear EnergyNuclear Energy– Fossil, Biomass, Wind, Geothermal and Hydropower
EnergyAdvanced Vehicles and Battery Development G th l
2
– Advanced Vehicles and Battery Development– Homeland Security and Cyber Security
Geothermal
AVTA ParticipantsTh Ad d V hi l T ti A ti it (AVTA) i th U S• The Advanced Vehicle Testing Activity (AVTA) is the U.S. Department of Energy, Vehicle Technologies Program’s (VTP) singular field, tract, and laboratory based source of t ti li ht d t h l hi l t d b ttesting light-duty whole vehicle systems and subsystems– Idaho National Laboratory manages the AVTA for VTP– ECOtality provides testing support via a competitively y p g pp p y
bid NETL (National Energy Testing Laboratory) contract
• For the EV Project, ECOtality is the project lead and INL j , y p jprovides data collection, analysis and dissemination support
• Test partners include electric utilities, Federal, state andTest partners include electric utilities, Federal, state and local government agencies, private companies, and individual vehicle owners
3
AVTA GoalsTh AVTA l• The AVTA goals– Petroleum reduction and energy security– Benchmark technologies that are developed via DOEBenchmark technologies that are developed via DOE
research investments• Provide benchmark data to DOE, National Laboratories
(ANL, NREL, ORNL, PNNL), Federal Agencies (DOD, DOI,(ANL, NREL, ORNL, PNNL), Federal Agencies (DOD, DOI, DOT, EPA, USPS), technology modelers, R&D programs, vehicle manufacturers (via USCAR’s VSATT, EESTT, GITT), and target and goal setters ), g g
• Assist fleet managers, via Clean Cities, FEMP and industry gatherings, in making informed vehicle and infrastructure deployment and operating decisionsinfrastructure deployment and operating decisions
4
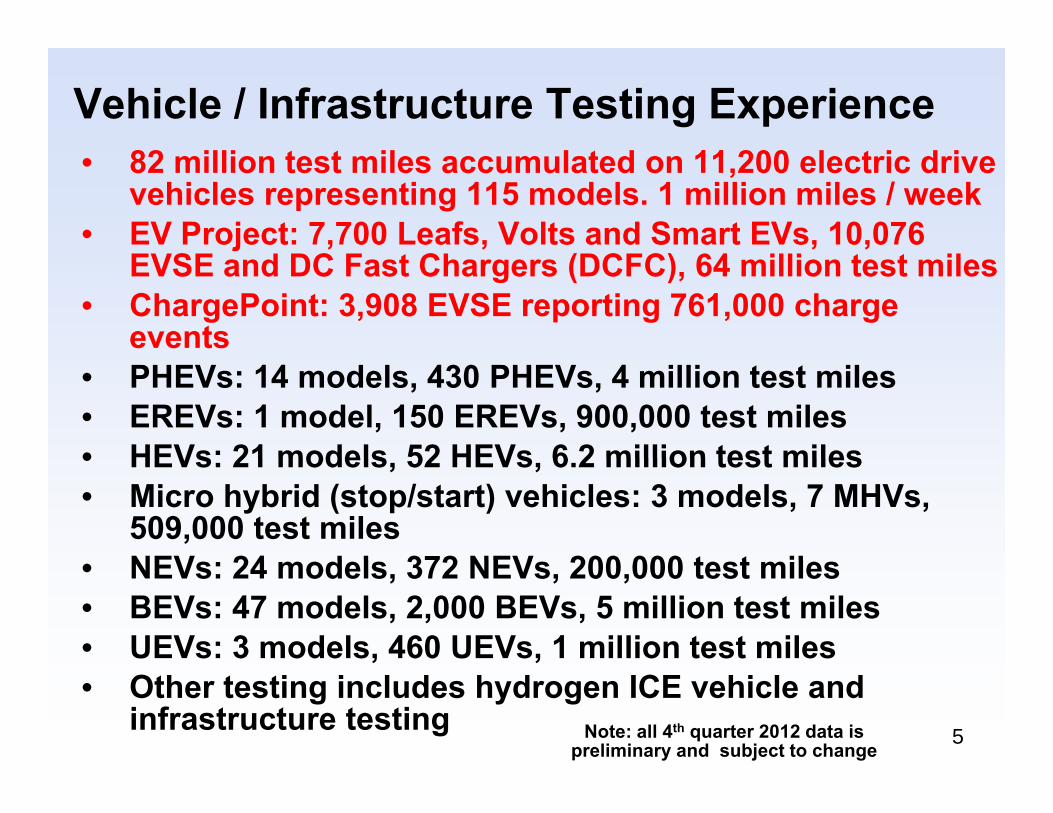
Vehicle / Infrastructure Testing Experience82 illi il l d 11 200 l i d i• 82 million test miles accumulated on 11,200 electric drive vehicles representing 115 models. 1 million miles / week
• EV Project: 7,700 Leafs, Volts and Smart EVs, 10,076 EVSE and DC Fast Chargers (DCFC), 64 million test miles
• ChargePoint: 3,908 EVSE reporting 761,000 charge events
• PHEVs: 14 models, 430 PHEVs, 4 million test miles• EREVs: 1 model, 150 EREVs, 900,000 test miles• HEVs: 21 models 52 HEVs 6 2 million test miles• HEVs: 21 models, 52 HEVs, 6.2 million test miles • Micro hybrid (stop/start) vehicles: 3 models, 7 MHVs,
509,000 test miles NEV 24 d l 372 NEV 200 000 t t il• NEVs: 24 models, 372 NEVs, 200,000 test miles
• BEVs: 47 models, 2,000 BEVs, 5 million test miles • UEVs: 3 models, 460 UEVs, 1 million test miles
5
, ,• Other testing includes hydrogen ICE vehicle and
infrastructure testing Note: all 4th quarter 2012 data is preliminary and subject to change
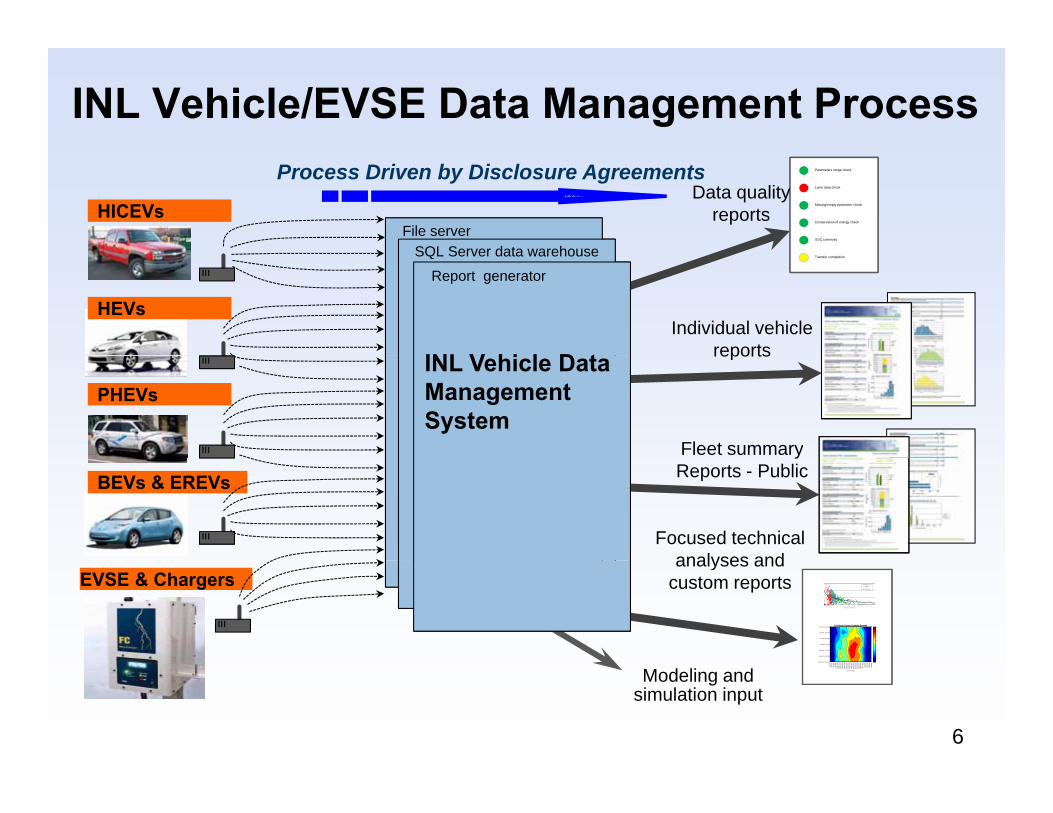
INL Vehicle/EVSE Data Management Process
File serverFile serverSQL Server data warehouseSQL Server data warehouse
File serverSQL Server data warehouse
HICEVs
Parameters range checkParameters range check
Lame data checkLame data check
Missing/empty parameter checkMissing/empty parameter check
Conservation of energy checkConservation of energy check
SOC continuitySOC continuity
Parameters range check
Lame data check
Missing/empty parameter check
Conservation of energy check
SOC continuity
Data qualityreports
Process Driven by Disclosure Agreements
INL Database
SQL Server data warehouseSQL Server data warehouse
Report generatorReport generator
SQL Server data warehouse
Report generator
HEVs
INL V hi l D t
Transfer completionTransfer completionTransfer completion
Individual vehicle reports
PHEVsINL Vehicle Data Management System
reports
Fleet summary
BEVs & EREVs
yReports - Public
Focused technicalanalyses and
EVSE & Chargersanalyses and
custom reports25 50 75 100 125 150 175 200 225 250 275 30
Trip Fuel Economy (mpg)
p gg ( p p p )
CD trips
CD/CS trips
CS trips
Log. (CD trips)
Log. (CD/CS trips)
Avg Hourly Vehicle Charging Demand
9 9 9 9 9 9 9 9 9 9 9 9 9 9 9 9 9 9 9 9 9 9 9 9
Mon AM - Tues AM
Tue AM - Wed AM
Wed AM - Thu AM
Thu AM - Fri AM
Fri AM - Sat AM
Sat AM - Sun AM
Sun AM - Mon AM
0.1
0.2
0.3
0.4
0.5
0.6
0.7
0.8
25 50 75 100 125 150 175 200 225 250 275 30
Trip Fuel Economy (mpg)
p gg ( p p p )
CD trips
CD/CS trips
CS trips
Log. (CD trips)
Log. (CD/CS trips)
Avg Hourly Vehicle Charging Demand
9 9 9 9 9 9 9 9 9 9 9 9 9 9 9 9 9 9 9 9 9 9 9 9
Mon AM - Tues AM
Tue AM - Wed AM
Wed AM - Thu AM
Thu AM - Fri AM
Fri AM - Sat AM
Sat AM - Sun AM
Sun AM - Mon AM
0.1
0.2
0.3
0.4
0.5
0.6
0.7
0.8
6
Time of Day
600-
659
700-
759
800-
859
900-
959
1000
-105
911
00-1
159
1200
-125
913
00-1
359
1400
-145
915
00-1
559
1600
-165
917
00-1
759
1800
-185
919
00-1
959
2000
-205
921
00-2
159
2200
-225
923
00-2
359
000
- 059
100-
159
200-
259
300-
359
400-
459
500-
559
Time of Day
600-
659
700-
759
800-
859
900-
959
1000
-105
911
00-1
159
1200
-125
913
00-1
359
1400
-145
915
00-1
559
1600
-165
917
00-1
759
1800
-185
919
00-1
959
2000
-205
921
00-2
159
2200
-225
923
00-2
359
000
- 059
100-
159
200-
259
300-
359
400-
459
500-
559
Modeling and simulation input
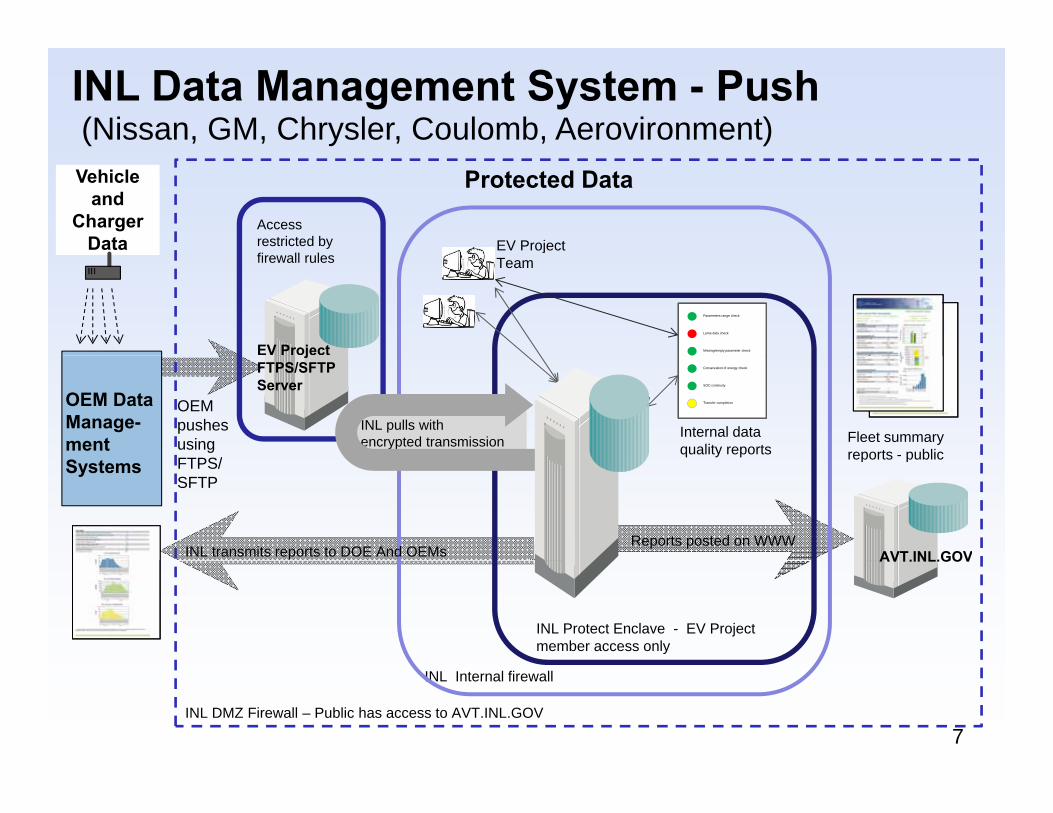
INL Data Management System - Push(Nissan, GM, Chrysler, Coulomb, Aerovironment)
Protected Data
EV Project Access restricted by fi ll l
Vehicle and
Charger Data
Parameters range checkParameters range check
Lame data checkLame data check
Missing/empty parameter checkMissing/empty parameter check
Parameters range check
Lame data check
Missing/empty parameter check
jTeam
EV Project
firewall rules
Conservation of energy checkConservation of energy check
SOC continuitySOC continuity
Transfer completionTransfer completion
Conservation of energy check
SOC continuity
Transfer completion
Internal data quality reports
Fleet summaryreports - public
OEM pushes using FTPS/
jFTPS/SFTP Server
INL pulls with encrypted transmission
OEM Data Manage-ment reports publicFTPS/
SFTP
INL transmits reports to DOE And OEMsReports posted on WWW
AVT.INL.GOV
Systems
INL Protect Enclave - EV Project member access only
AVT.INL.GOV
7
INL Internal firewall
INL DMZ Firewall – Public has access to AVT.INL.GOV
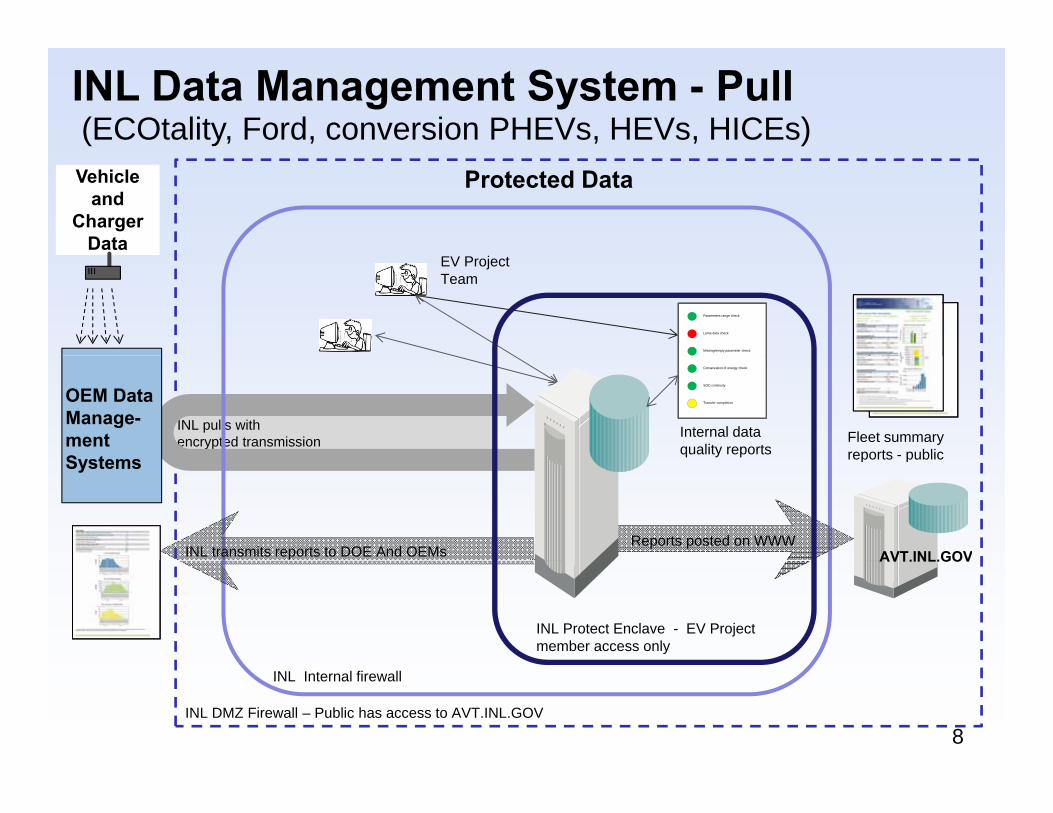
INL Data Management System - Pull(ECOtality, Ford, conversion PHEVs, HEVs, HICEs)
Protected DataVehicle and
Charger Data
EV Project Team
Parameters range checkParameters range check
Lame data checkLame data check
Missing/empty parameter checkMissing/empty parameter check
Parameters range check
Lame data check
Missing/empty parameter check
INL pulls with encrypted transmission
Conservation of energy checkConservation of energy check
SOC continuitySOC continuity
Transfer completionTransfer completion
Conservation of energy check
SOC continuity
Transfer completion
Internal data quality reports
Fleet summaryreports - public
OEM Data Manage-ment S t
Reports posted on WWWINL transmits reports to DOE And OEMs
reports public
AVT.INL.GOV
Systems
INL Protect Enclave - EV Project member access only
AVT.INL.GOV
8
INL Internal firewall
INL DMZ Firewall – Public has access to AVT.INL.GOV
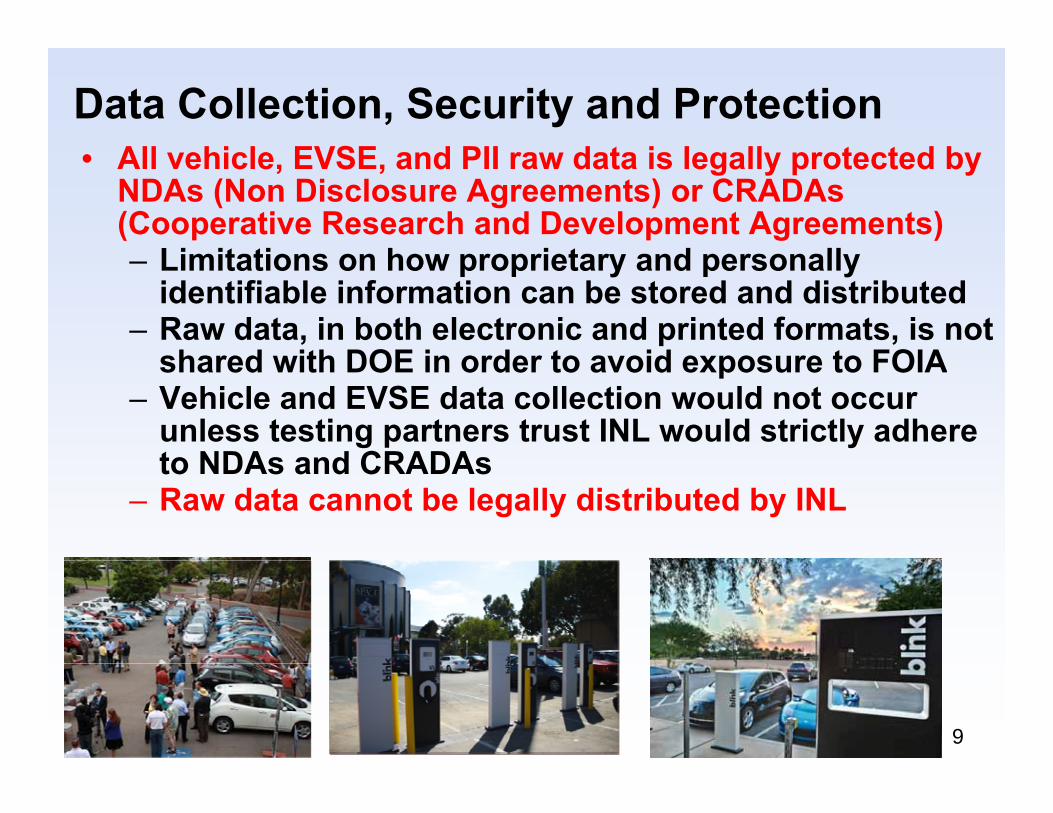
Data Collection, Security and ProtectionAll hi l EVSE d PII d t i l ll t t d b• All vehicle, EVSE, and PII raw data is legally protected by NDAs (Non Disclosure Agreements) or CRADAs (Cooperative Research and Development Agreements)
Li it ti h i t d ll– Limitations on how proprietary and personally identifiable information can be stored and distributed
– Raw data, in both electronic and printed formats, is not shared ith DOE in order to a oid e pos re to FOIAshared with DOE in order to avoid exposure to FOIA
– Vehicle and EVSE data collection would not occur unless testing partners trust INL would strictly adhere to NDAs and CRADAsto NDAs and CRADAs
– Raw data cannot be legally distributed by INL
9
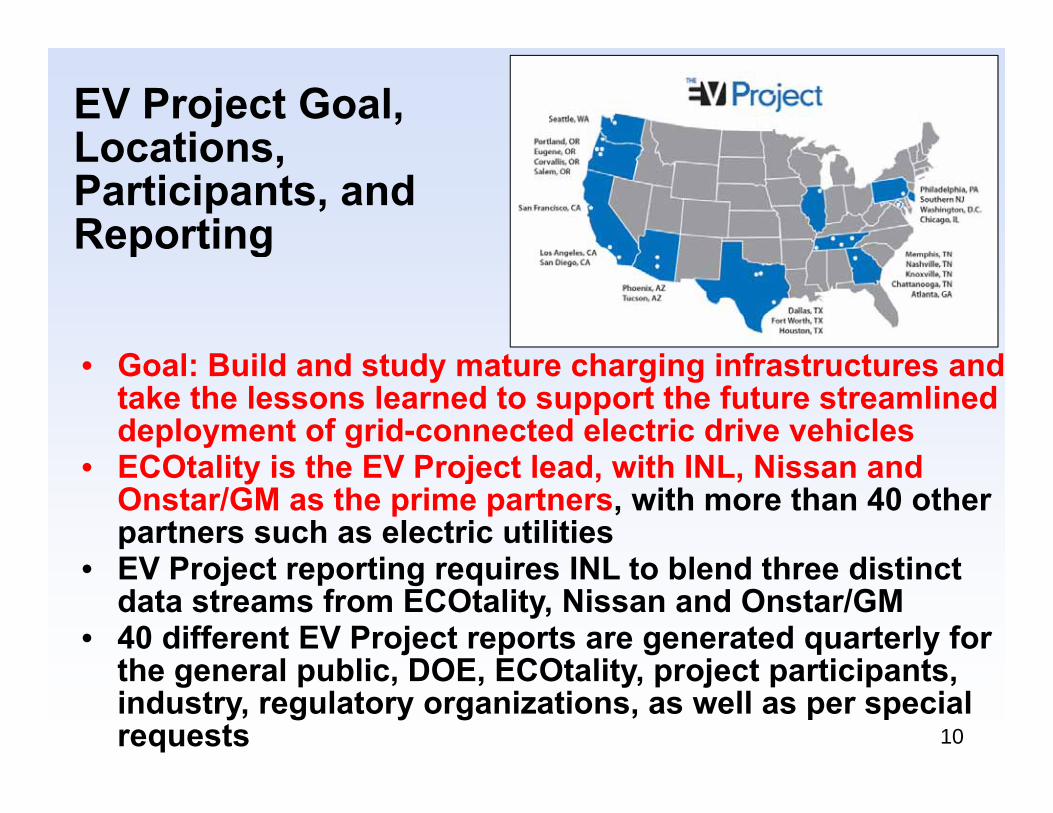
EV Project Goal, LocationsLocations, Participants, and Reportingp g
G l B ild d t d t h i i f t t d• Goal: Build and study mature charging infrastructures and take the lessons learned to support the future streamlined deployment of grid-connected electric drive vehiclesECOt lit i th EV P j t l d ith INL Ni d• ECOtality is the EV Project lead, with INL, Nissan and Onstar/GM as the prime partners, with more than 40 other partners such as electric utilitiesEV P j t ti i INL t bl d th di ti t• EV Project reporting requires INL to blend three distinct data streams from ECOtality, Nissan and Onstar/GM
• 40 different EV Project reports are generated quarterly for th l bli DOE ECOt lit j t ti i t
10
the general public, DOE, ECOtality, project participants, industry, regulatory organizations, as well as per special requests
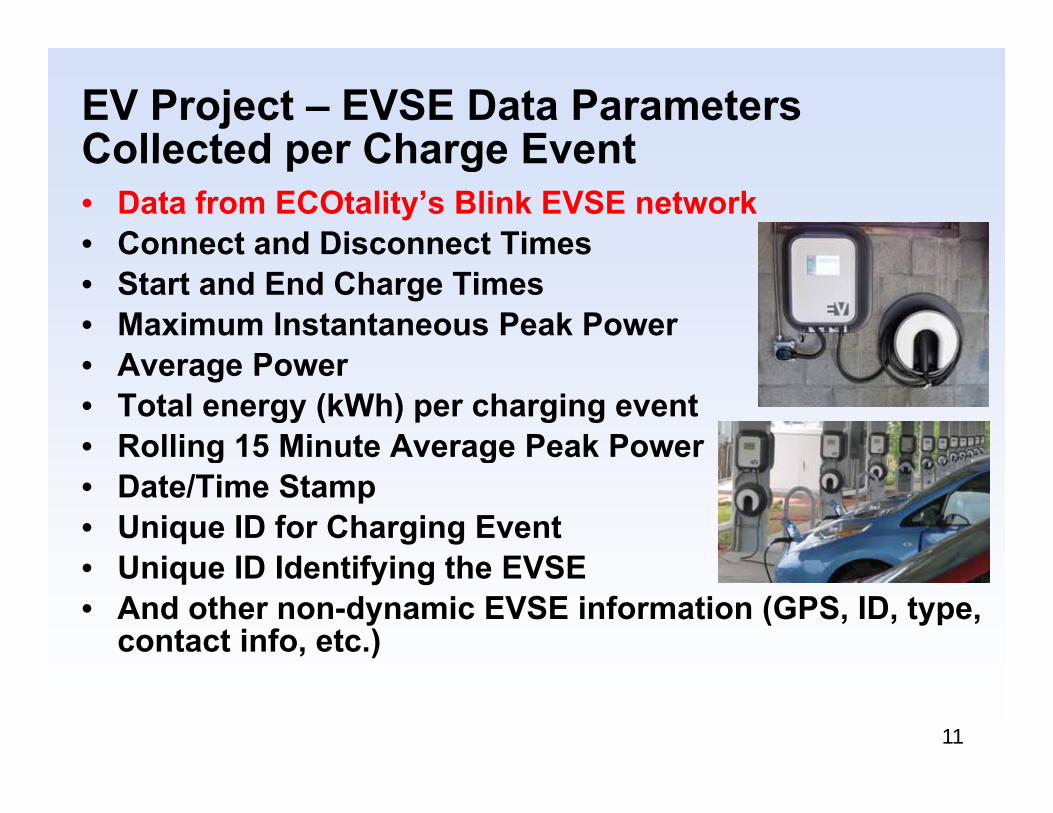
EV Project – EVSE Data Parameters Collected per Charge EventCollected per Charge Event • Data from ECOtality’s Blink EVSE network• Connect and Disconnect TimesConnect and Disconnect Times• Start and End Charge Times• Maximum Instantaneous Peak Power
A P• Average Power• Total energy (kWh) per charging event• Rolling 15 Minute Average Peak Powerg g• Date/Time Stamp • Unique ID for Charging Event
U i ID Id tif i th EVSE• Unique ID Identifying the EVSE • And other non-dynamic EVSE information (GPS, ID, type,
contact info, etc.)
11

EV Project – Vehicle Data Parameters Collected per Start/Stop EventCollected per Start/Stop Event• Data is received via telematics providers from Chevrolet
Volts and Nissan Leafs• Odometer• Battery state of charge • Date/Time Stamp• Date/Time Stamp • Vehicle ID• Event type (key on / key off) • GPS (longitude and latitude)• Recorded for each key-on and key-off event
Additi l d t i i d• Additional data is received monthly from Car2go for the Smart EVs
12
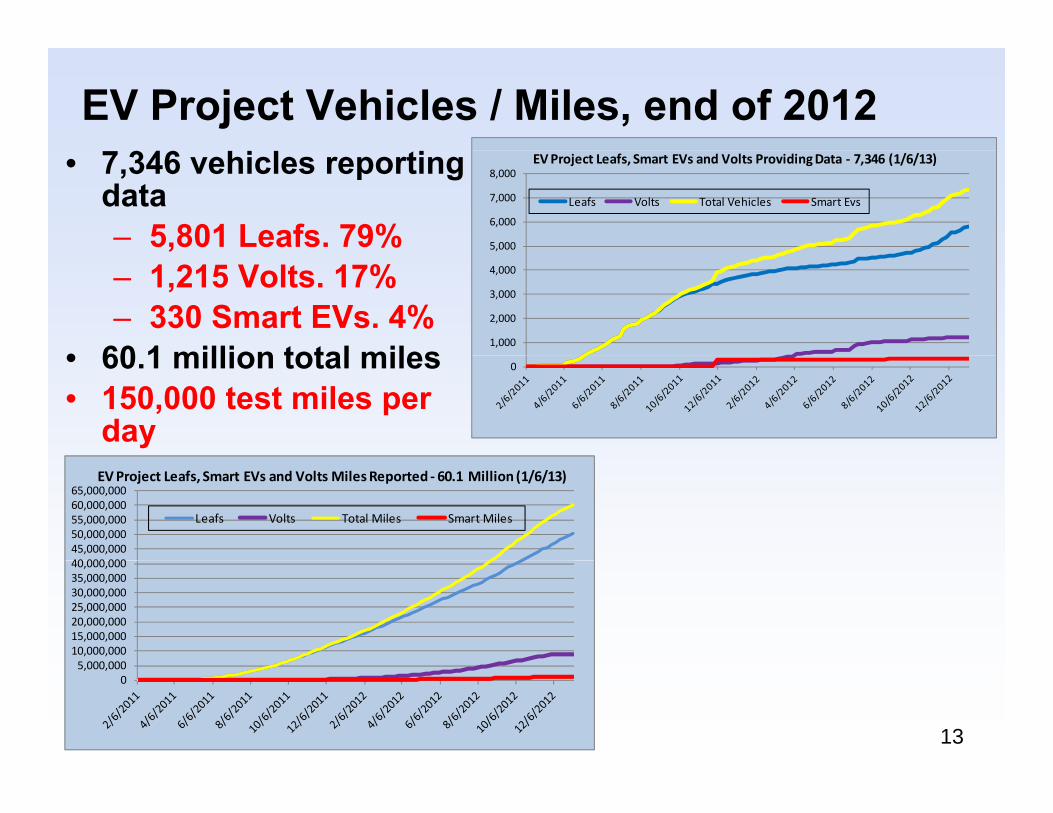
EV Project Vehicles / Miles, end of 2012• 7,346 vehicles reporting
data– 5,801 Leafs. 79% 5,000
6,000
7,000
8,000
Leafs Volts Total Vehicles Smart Evs
EV Project Leafs, Smart EVs and Volts ProvidingData ‐ 7,346 (1/6/13)
– 1,215 Volts. 17%– 330 Smart EVs. 4%
• 60 1 million total miles1,000
2,000
3,000
4,000
• 60.1 million total miles• 150,000 test miles per
day
0
40 000 00045,000,00050,000,00055,000,00060,000,00065,000,000
Leafs Volts Total Miles Smart Miles
EV Project Leafs, Smart EVs and Volts Miles Reported ‐ 60.1 Million (1/6/13)
5 000 00010,000,00015,000,00020,000,00025,000,00030,000,00035,000,00040,000,000
13
05,000,000
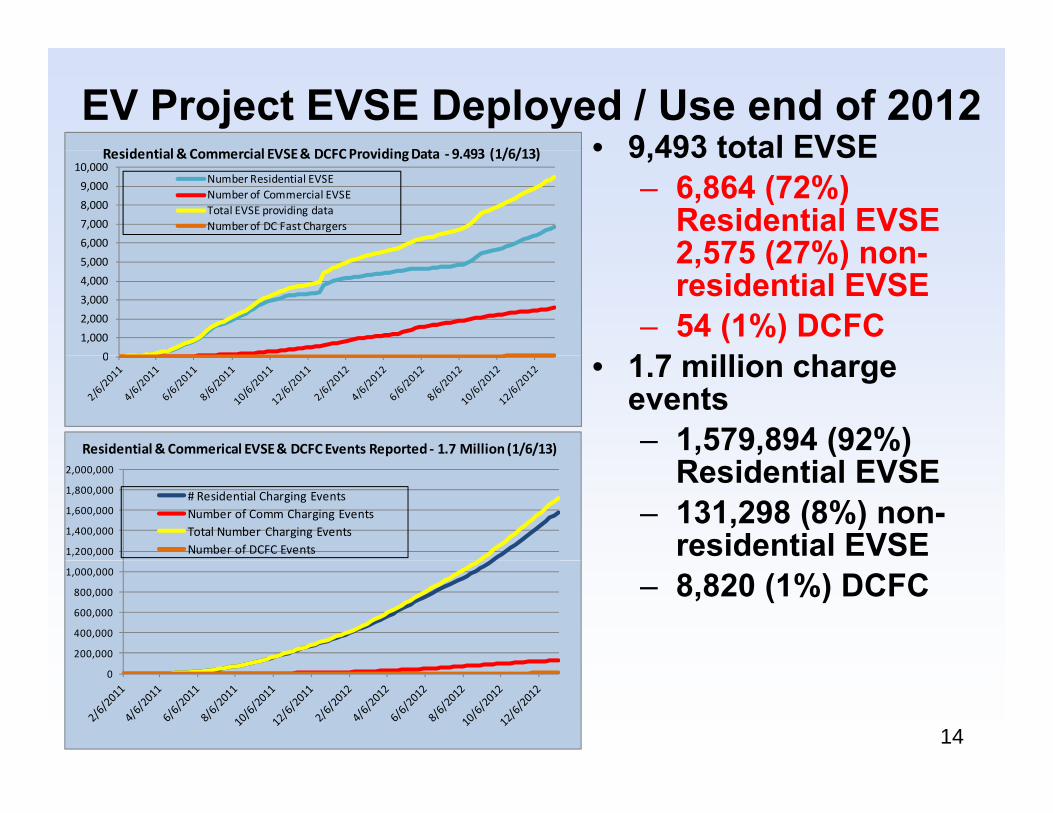
EV Project EVSE Deployed / Use end of 2012• 9 493 total EVSER id ti l & C i l EVSE& DCFCP idi D t 9 493 (1/6/13) • 9,493 total EVSE
– 6,864 (72%) Residential EVSE 2 575 (27%) non-6,000
7,000
8,000
9,000
10,000Number Residential EVSENumber of Commercial EVSETotal EVSE providing dataNumber of DC Fast Chargers
Residential &Commercial EVSE & DCFC ProvidingData ‐ 9.493 (1/6/13)
2,575 (27%) non-residential EVSE
– 54 (1%) DCFC1 7 illi h0
1,000
2,000
3,000
4,000
5,000
• 1.7 million charge events– 1,579,894 (92%)
0
Residential& Commerical EVSE & DCFC Events Reported ‐ 1.7 Million (1/6/13)
Residential EVSE– 131,298 (8%) non-
residential EVSE1,200,000
1,400,000
1,600,000
1,800,000
2,000,000
# Residential Charging EventsNumber of Comm Charging EventsTotal Number Charging EventsNumber of DCFC Events
– 8,820 (1%) DCFC
200,000
400,000
600,000
800,000
1,000,000
14
0
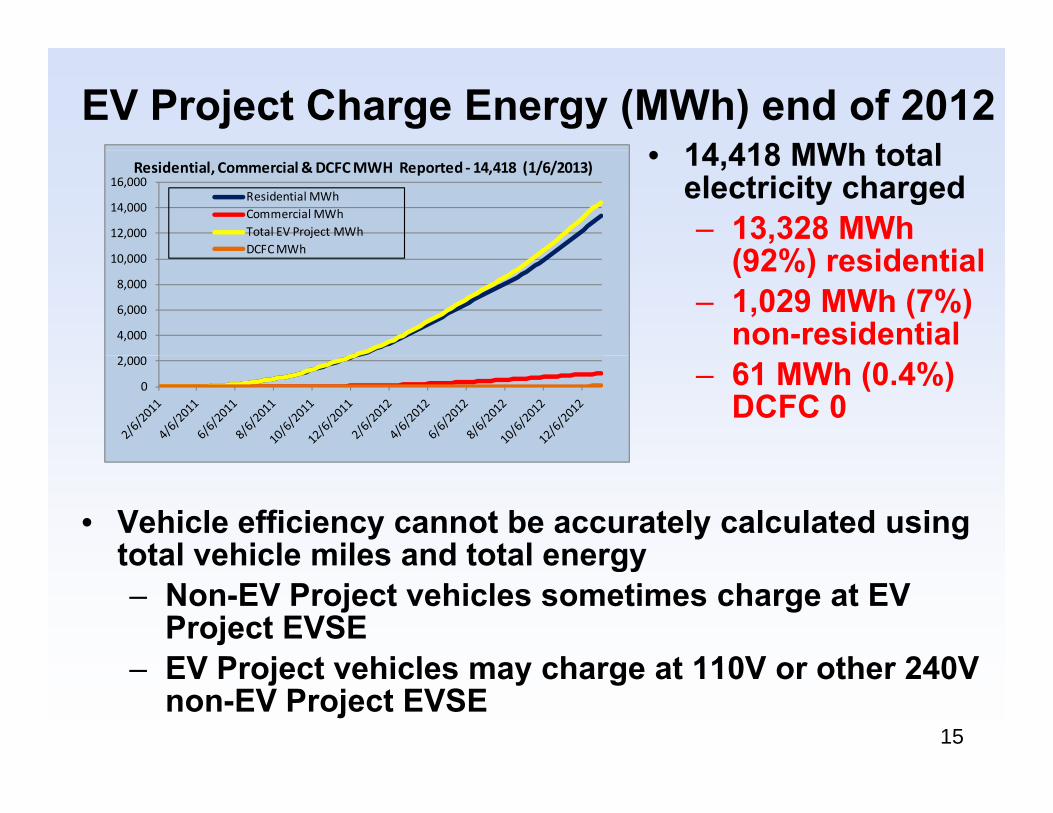
EV Project Charge Energy (MWh) end of 201214 418 MWh total• 14,418 MWh total electricity charged– 13,328 MWh
(92%) id ti l12,000
14,000
16,000Residential MWhCommercial MWhTotal EV Project MWhDCFCMWh
Residential, Commercial & DCFCMWH Reported ‐ 14,418 (1/6/2013)
(92%) residential– 1,029 MWh (7%)
non-residential4,000
6,000
8,000
10,000DCFC MWh
– 61 MWh (0.4%) DCFC 0
0
2,000
• Vehicle efficiency cannot be accurately calculated using total vehicle miles and total energytotal vehicle miles and total energy– Non-EV Project vehicles sometimes charge at EV
Project EVSEEV Project vehicles may charge at 110V or other 240V
15
– EV Project vehicles may charge at 110V or other 240V non-EV Project EVSE
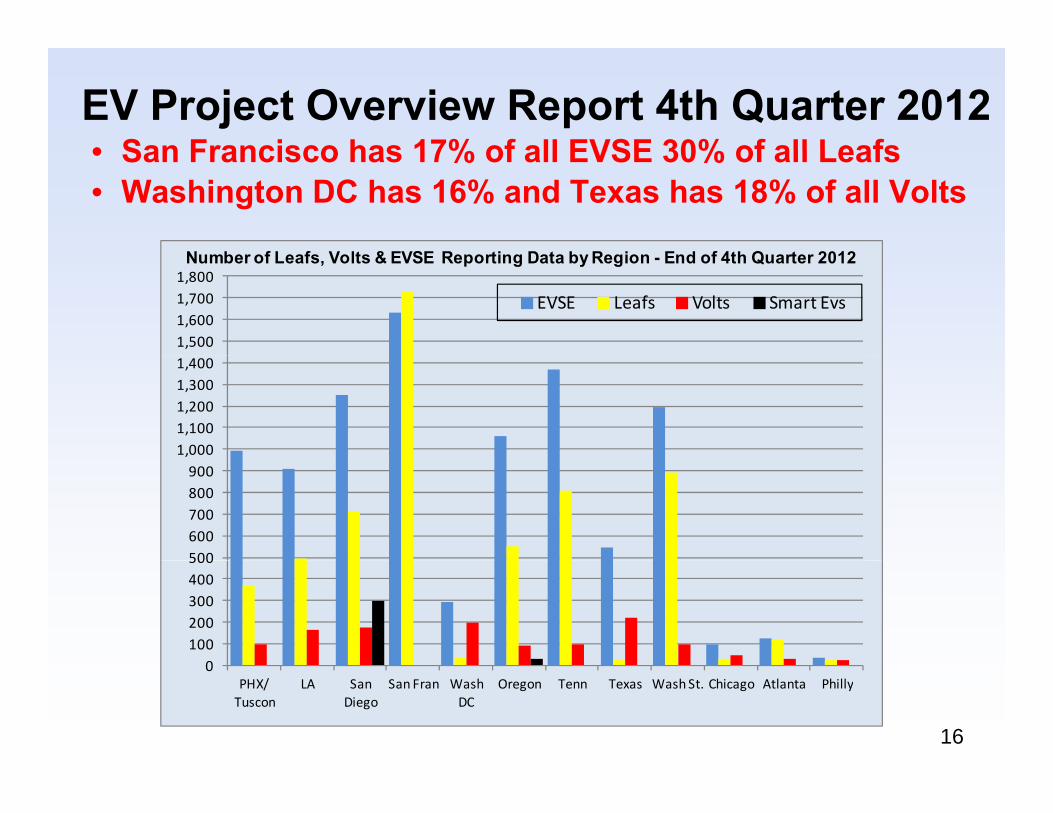
EV Project Overview Report 4th Quarter 2012• San Francisco has 17% of all EVSE 30% of all Leafs
N b f L f V lt & EVSE R ti D t b R i E d f 4th Q t 2012
• San Francisco has 17% of all EVSE 30% of all Leafs• Washington DC has 16% and Texas has 18% of all Volts
1,5001,6001,7001,800
EVSE Leafs Volts Smart Evs
Number of Leafs, Volts & EVSE Reporting Data by Region - End of 4th Quarter 2012
1,0001,1001,2001,3001,400
500600700800900
0100200300400500
16
0PHX/ Tuscon
LA San Diego
San Fran Wash DC
Oregon Tenn Texas Wash St. Chicago Atlanta Philly
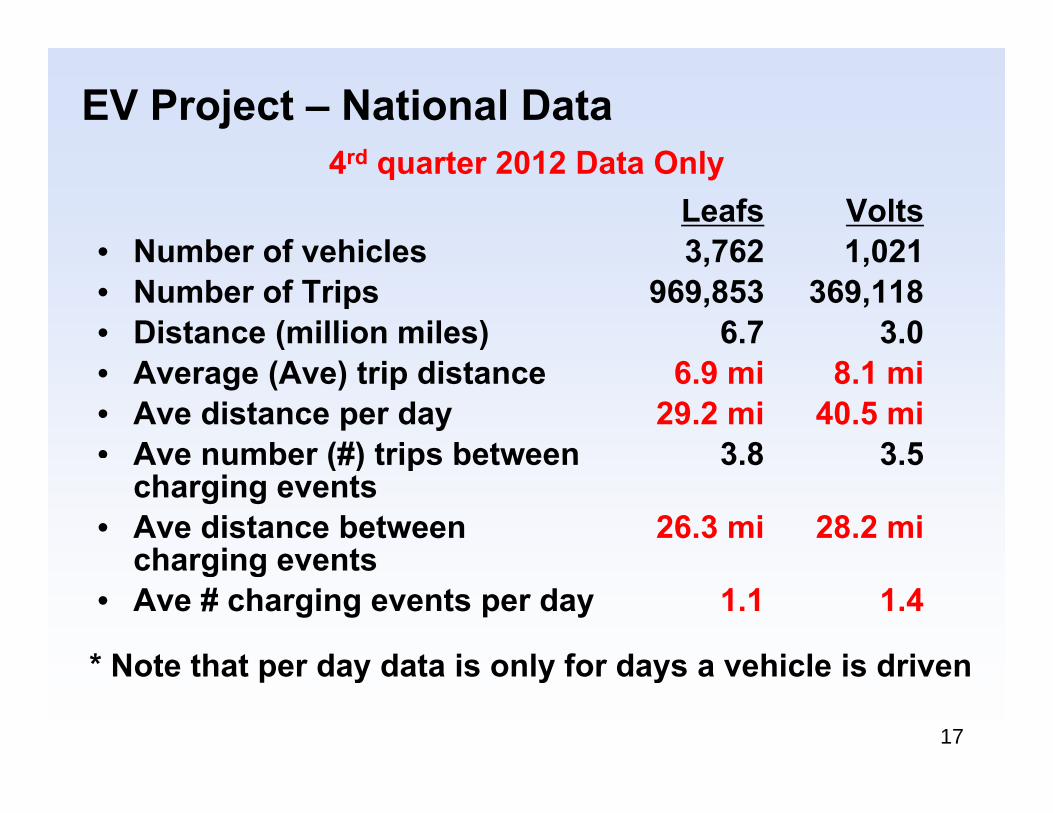
EV Project – National Datad
• Number of vehiclesLeafs3 762
Volts1 021
4rd quarter 2012 Data Only
• Number of vehicles• Number of Trips• Distance (million miles)
3,762969,853
6.7
1,021369,118
3.0• Average (Ave) trip distance• Ave distance per day• Ave number (#) trips between
6.9 mi29.2 mi
3 8
8.1 mi40.5 mi
3 5Ave number (#) trips between charging events
• Ave distance between charging events
3.8
26.3 mi
3.5
28.2 micharging events
• Ave # charging events per day 1.1 1.4
* Note that per day data is only for days a vehicle is driven
17
* Note that per day data is only for days a vehicle is driven
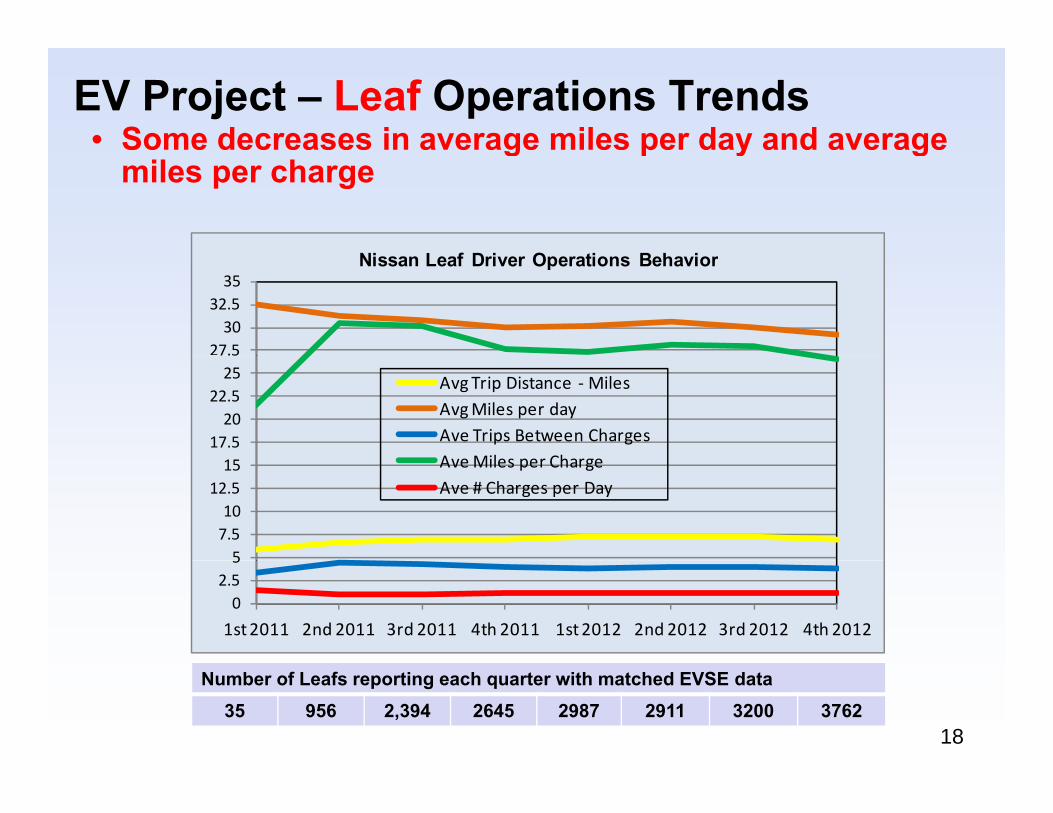
EV Project – Leaf Operations Trends • Some decreases in average miles per day and average g p y g
miles per charge
Ni f D i O i B h i
27.530
32.535
Nissan Leaf Driver Operations Behavior
17.520
22.5257.5
Avg Trip Distance ‐MilesAvg Miles per dayAve Trips Between ChargesA Mil Ch
57.510
12.515 Ave Miles per Charge
Ave # Charges per Day
02.55
1st 2011 2nd 2011 3rd 2011 4th 2011 1st 2012 2nd 2012 3rd 2012 4th 2012
18
Number of Leafs reporting each quarter with matched EVSE data35 956 2,394 2645 2987 2911 3200 3762
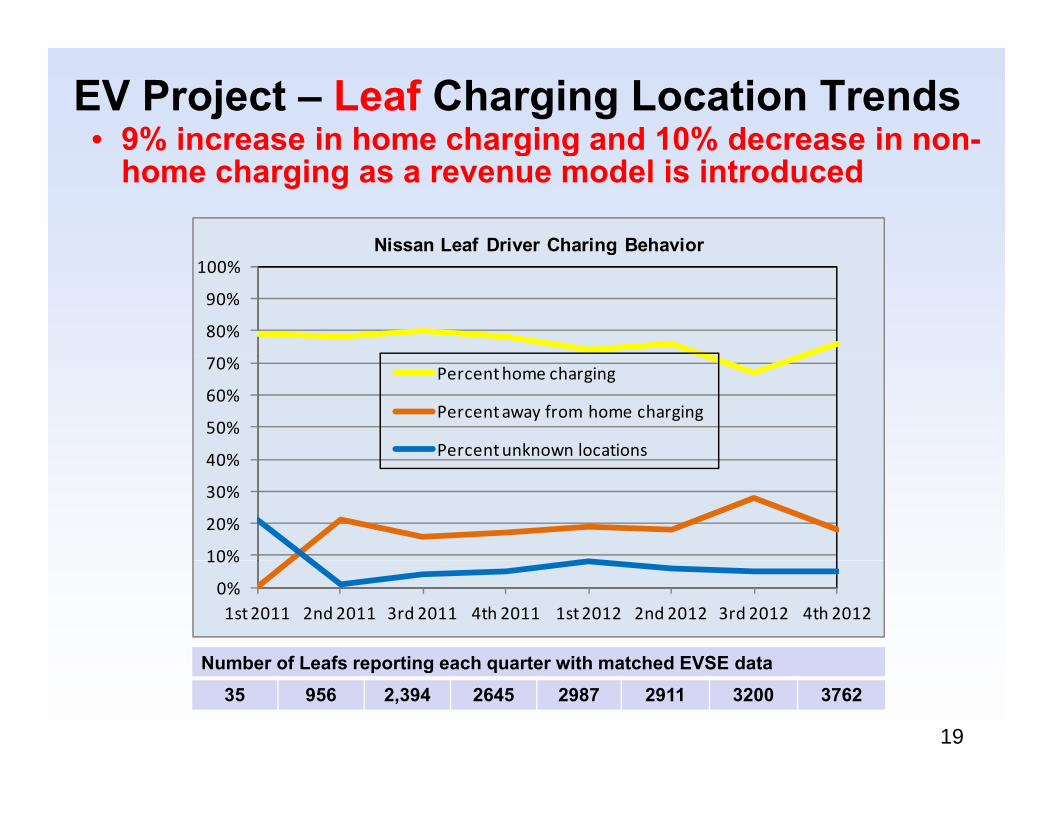
EV Project – Leaf Charging Location Trends• 9% increase in home charging and 10% decrease in non-% g g %
home charging as a revenue model is introduced
Nissan Leaf Driver Charing Behavior
80%
90%
100%g
40%
50%
60%
70% Percent home charging
Percent away from home charging
Percent unknown locations
10%
20%
30%
40%
Number of Leafs reporting each quarter with matched EVSE data
0%
10%
1st 2011 2nd 2011 3rd 2011 4th 2011 1st 2012 2nd 2012 3rd 2012 4th 2012
19
Number of Leafs reporting each quarter with matched EVSE data35 956 2,394 2645 2987 2911 3200 3762
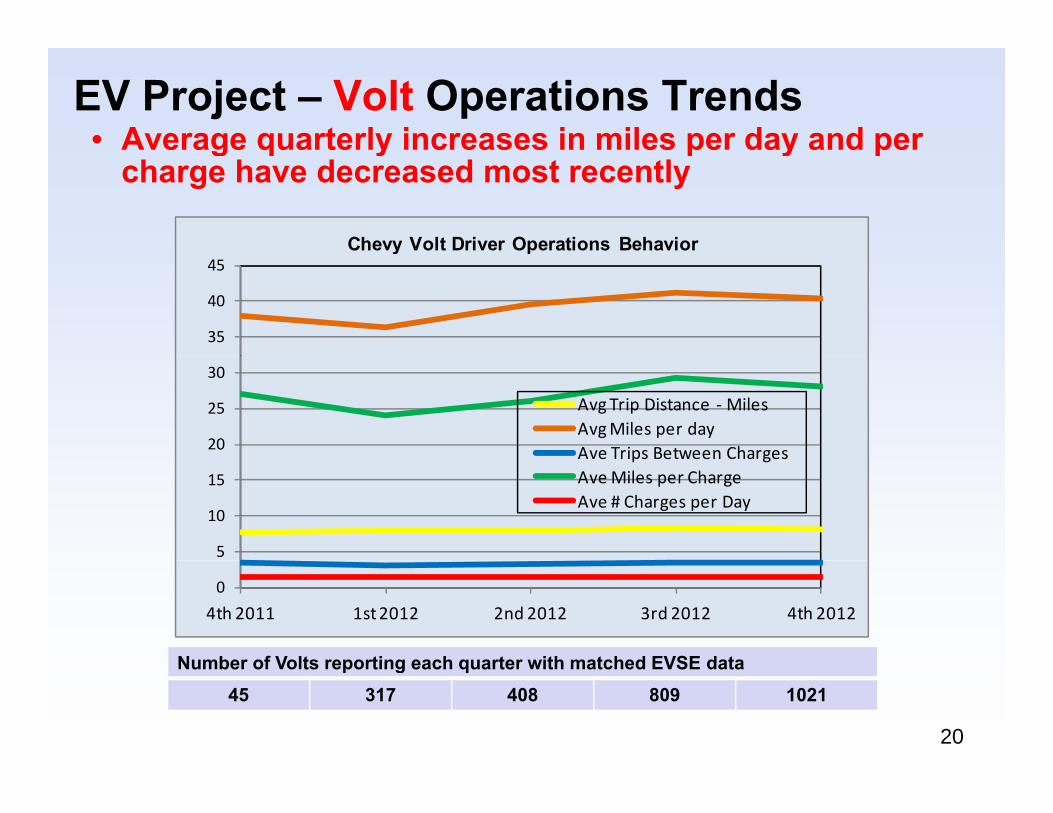
EV Project – Volt Operations Trends • Average quarterly increases in miles per day and per g q y p y p
charge have decreased most recently
Chevy Volt Driver Operations Behavior
35
40
45y p
20
25
30
Avg Trip Distance ‐MilesAvg Miles per dayAve Trips Between Charges
5
10
15
Ave Trips Between ChargesAve Miles per ChargeAve # Charges per Day
Number of Volts reporting each quarter with matched EVSE data
0
4th 2011 1st 2012 2nd 2012 3rd 2012 4th 2012
20
Number of Volts reporting each quarter with matched EVSE data45 317 408 809 1021
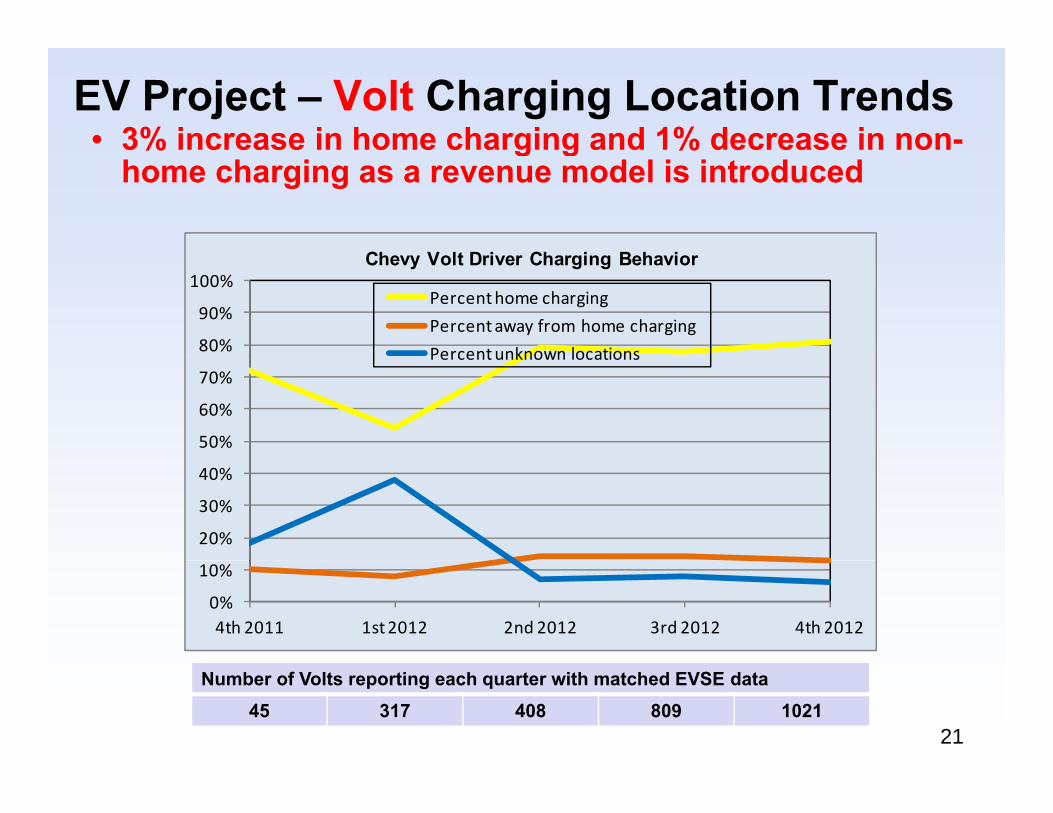
EV Project – Volt Charging Location Trends• 3% increase in home charging and 1% decrease in non-% g g %
home charging as a revenue model is introduced
Ch V lt D i Ch i B h i
80%
90%
100%Percent home charging
Percent away from home charging
Percentunknown locations
Chevy Volt Driver Charging Behavior
50%
60%
70%Percent unknown locations
20%
30%
40%
0%
10%
4th 2011 1st 2012 2nd 2012 3rd 2012 4th 2012
21
Number of Volts reporting each quarter with matched EVSE data45 317 408 809 1021
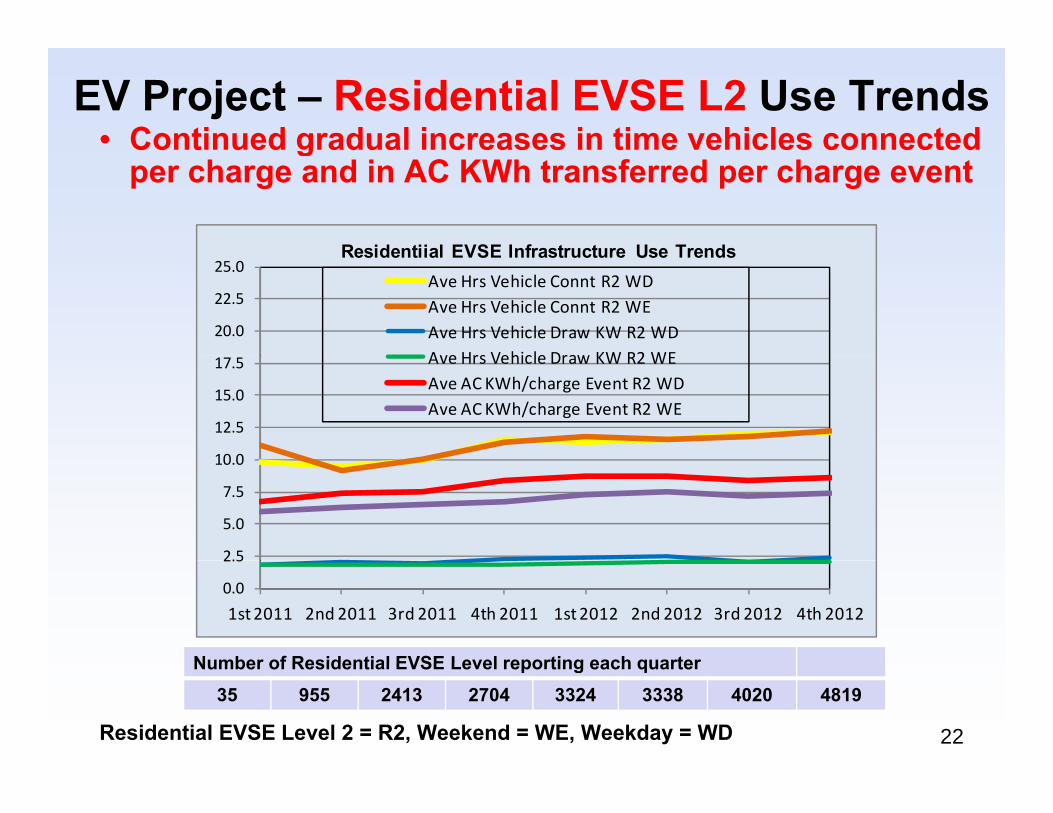
EV Project – Residential EVSE L2 Use Trends • Continued gradual increases in time vehicles connected g
per charge and in AC KWh transferred per charge event
Residentiial EVSE Infrastructure Use Trends
20.0
22.5
25.0Ave Hrs Vehicle Connt R2 WDAve Hrs Vehicle Connt R2 WEAve Hrs Vehicle Draw KW R2 WDAve Hrs Vehicle Draw KW R2 WE
Residentiial EVSE Infrastructure Use Trends
10 0
12.5
15.0
17.5 Ave Hrs Vehicle Draw KW R2 WEAve AC KWh/charge Event R2 WDAve AC KWh/charge Event R2 WE
2.5
5.0
7.5
10.0
Number of Residential EVSE Level reporting each quarter
0.0
2.5
1st 2011 2nd 2011 3rd 2011 4th 2011 1st 2012 2nd 2012 3rd 2012 4th 2012
22
Number of Residential EVSE Level reporting each quarter35 955 2413 2704 3324 3338 4020 4819
Residential EVSE Level 2 = R2, Weekend = WE, Weekday = WD
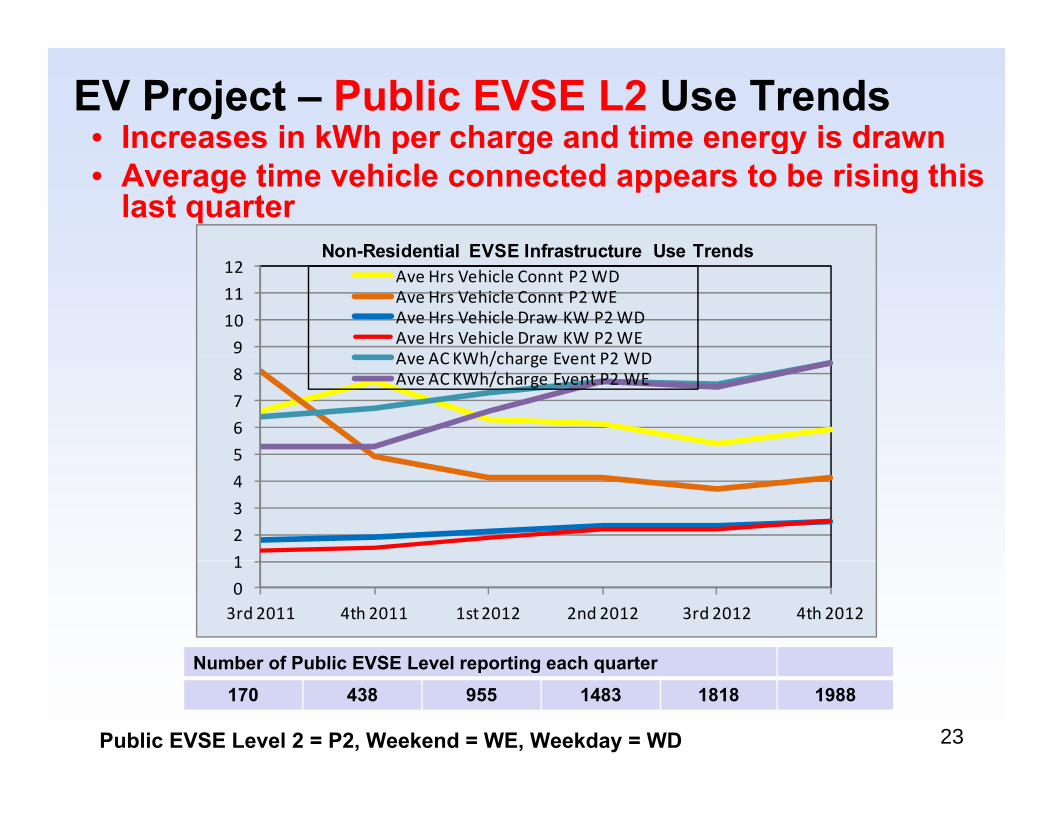
EV Project – Public EVSE L2 Use Trends • Increases in kWh per charge and time energy is drawnp g gy• Average time vehicle connected appears to be rising this
last quarter Non-Residential EVSE Infrastructure Use Trends
9
10
11
12 Ave Hrs Vehicle Connt P2 WDAve Hrs Vehicle Connt P2 WEAve Hrs Vehicle Draw KW P2 WDAve Hrs Vehicle Draw KW P2 WEA e ACKWh/charge E ent P2 WD
Non-Residential EVSE Infrastructure Use Trends
5
6
7
8Ave AC KWh/charge Event P2 WDAve AC KWh/charge Event P2 WE
1
2
3
4
5
Number of Public EVSE Level reporting each quarter
0
1
3rd 2011 4th 2011 1st 2012 2nd 2012 3rd 2012 4th 2012
23
Number of Public EVSE Level reporting each quarter170 438 955 1483 1818 1988
Public EVSE Level 2 = P2, Weekend = WE, Weekday = WD
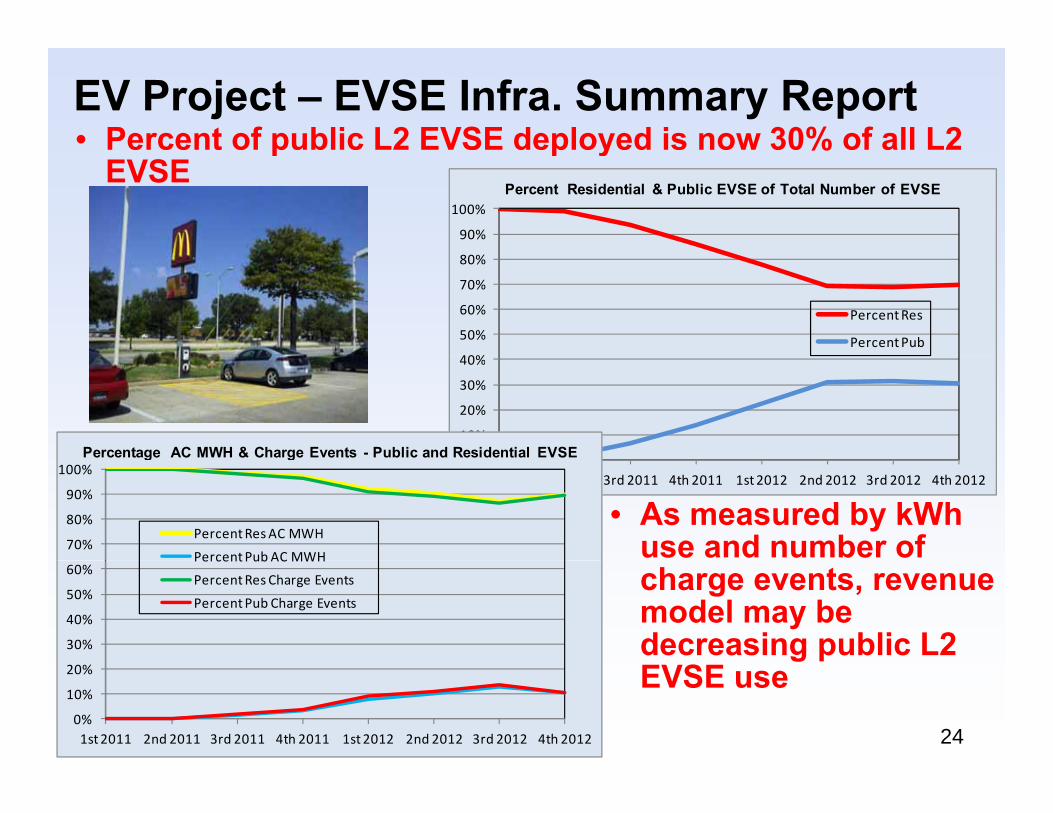
EV Project – EVSE Infra. Summary Report• Percent of public L2 EVSE deployed is now 30% of all L2 p p y %
EVSE
90%
100%Percent Residential & Public EVSE of Total Number of EVSE
40%
50%
60%
70%
80%
Percent Res
Percent Pub
0%
10%
20%
30%
40%
Percentage AC MWH & Charge Events - Public and Residential EVSE0%1st 2011 2nd 2011 3rd 2011 4th 2011 1st 2012 2nd 2012 3rd 2012 4th 2012
70%
80%
90%
100%
Percent Res AC MWH
PercentPub AC MWH
g g
• As measured by kWh use and number of
30%
40%
50%
60%Percent Pub AC MWH
Percent Res Charge Events
Percent Pub Charge Eventscharge events, revenue model may be decreasing public L2
240%
10%
20%
1st 2011 2nd 2011 3rd 2011 4th 2011 1st 2012 2nd 2012 3rd 2012 4th 2012
EVSE use
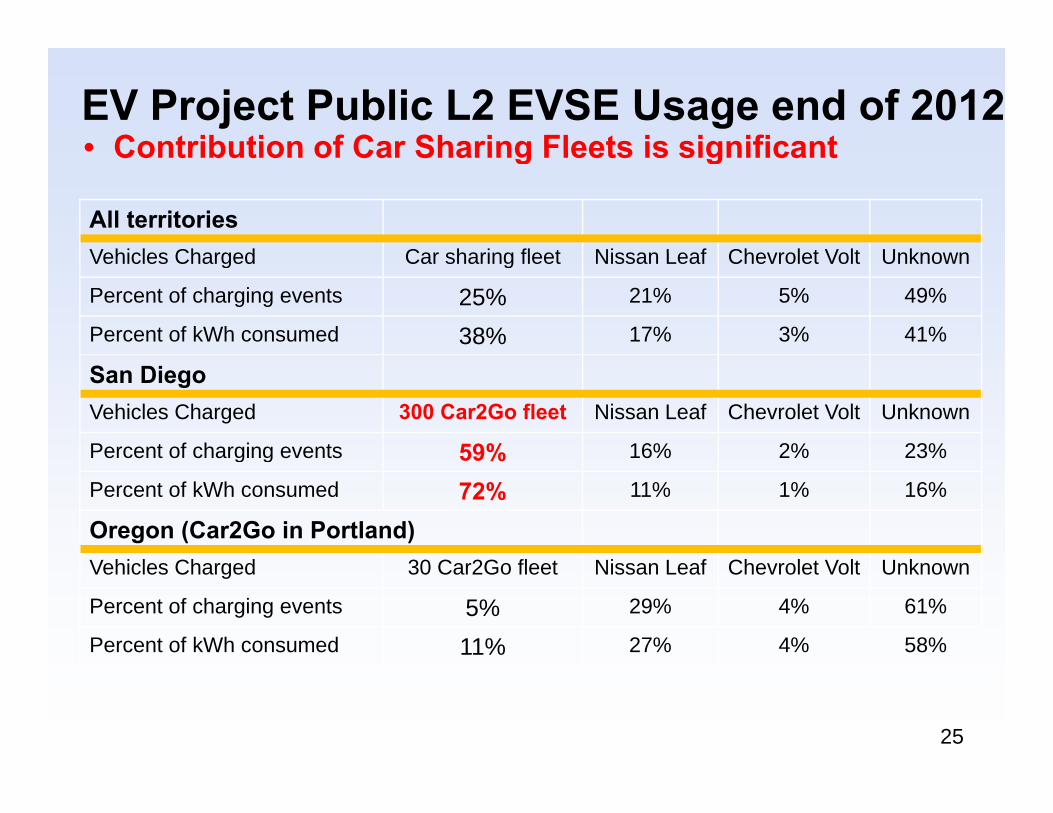
EV Project Public L2 EVSE Usage end of 2012• Contribution of Car Sharing Fleets is significant
All territoriesVehicles Charged Car sharing fleet Nissan Leaf Chevrolet Volt Unknown
• Contribution of Car Sharing Fleets is significant
Vehicles Charged Car sharing fleet Nissan Leaf Chevrolet Volt Unknown
Percent of charging events 25% 21% 5% 49%
Percent of kWh consumed 38% 17% 3% 41%
San DiegoVehicles Charged 300 Car2Go fleet Nissan Leaf Chevrolet Volt Unknown
Percent of charging events 59% 16% 2% 23%e ce t o c a g g e e ts 59% 6% % 3%
Percent of kWh consumed 72% 11% 1% 16%
Oregon (Car2Go in Portland)V hi l Ch d 30 C 2G fl t Ni L f Ch l t V lt U kVehicles Charged 30 Car2Go fleet Nissan Leaf Chevrolet Volt Unknown
Percent of charging events 5% 29% 4% 61%
Percent of kWh consumed 11% 27% 4% 58%
25
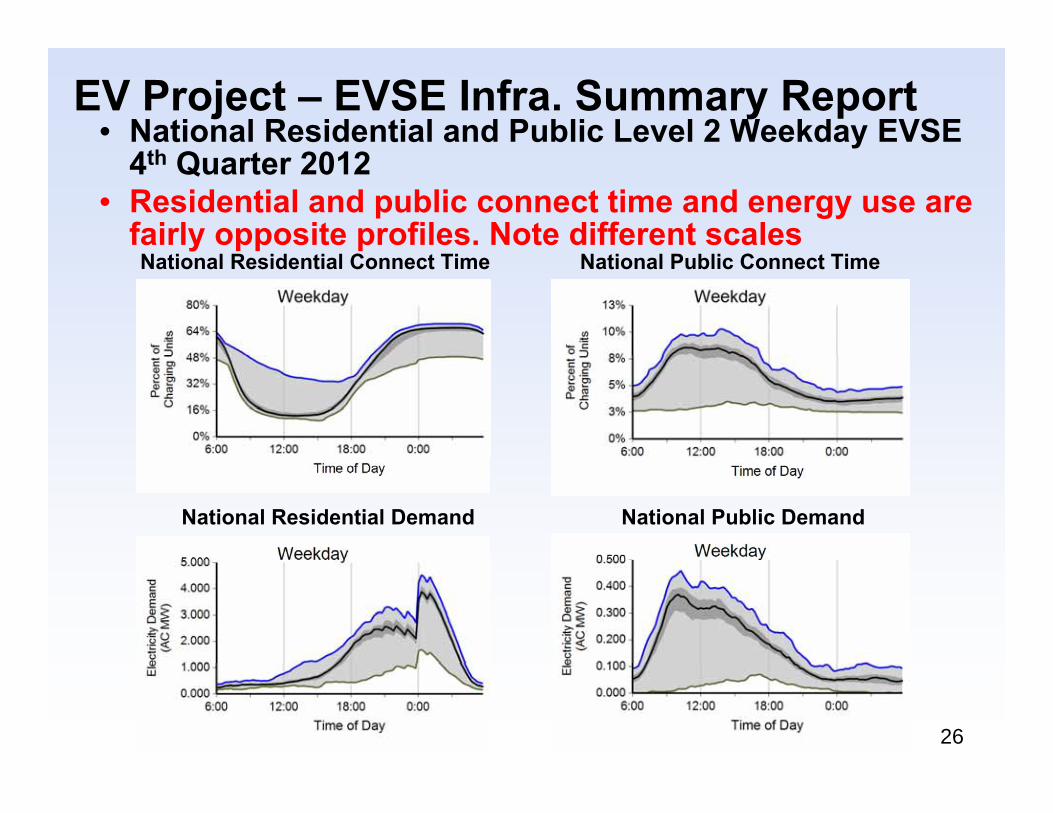
EV Project – EVSE Infra. Summary Report• National Residential and Public Level 2 Weekday EVSE
th4th Quarter 2012• Residential and public connect time and energy use are
fairly opposite profiles. Note different scalesNational Residential Connect Time National Public Connect Time
National Public DemandNational Residential Demand
26
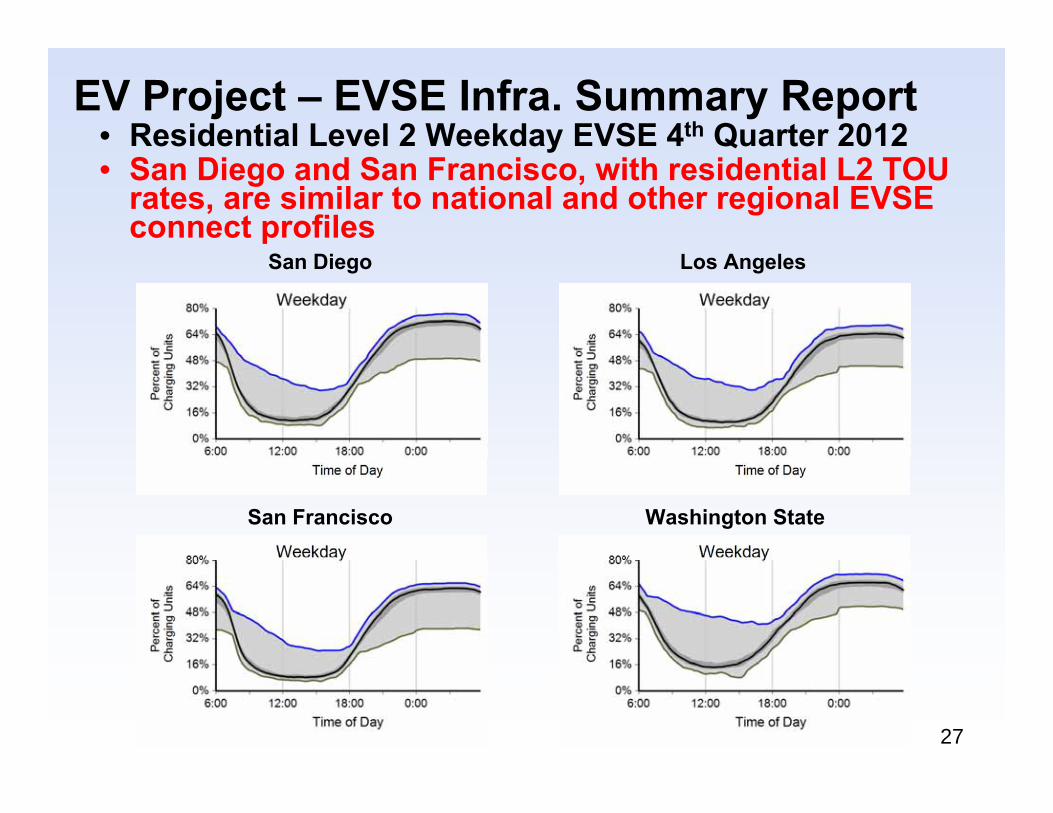
EV Project – EVSE Infra. Summary Report• Residential Level 2 Weekday EVSE 4th Quarter 2012y• San Diego and San Francisco, with residential L2 TOU
rates, are similar to national and other regional EVSE connect profiles
Los AngelesSan Diego
Washington StateSan Francisco
27
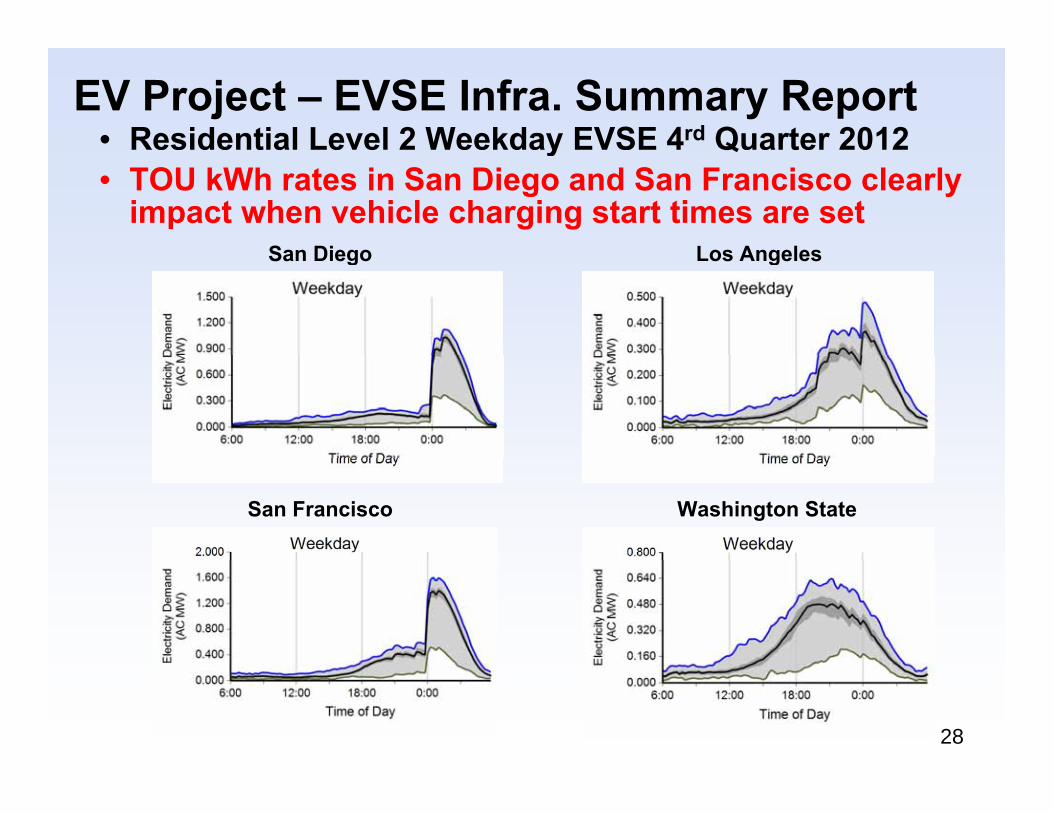
EV Project – EVSE Infra. Summary Report• Residential Level 2 Weekday EVSE 4rd Quarter 2012y Q• TOU kWh rates in San Diego and San Francisco clearly
impact when vehicle charging start times are setLos AngelesSan Diego Los AngelesSan Diego
Washington StateSan Francisco
28
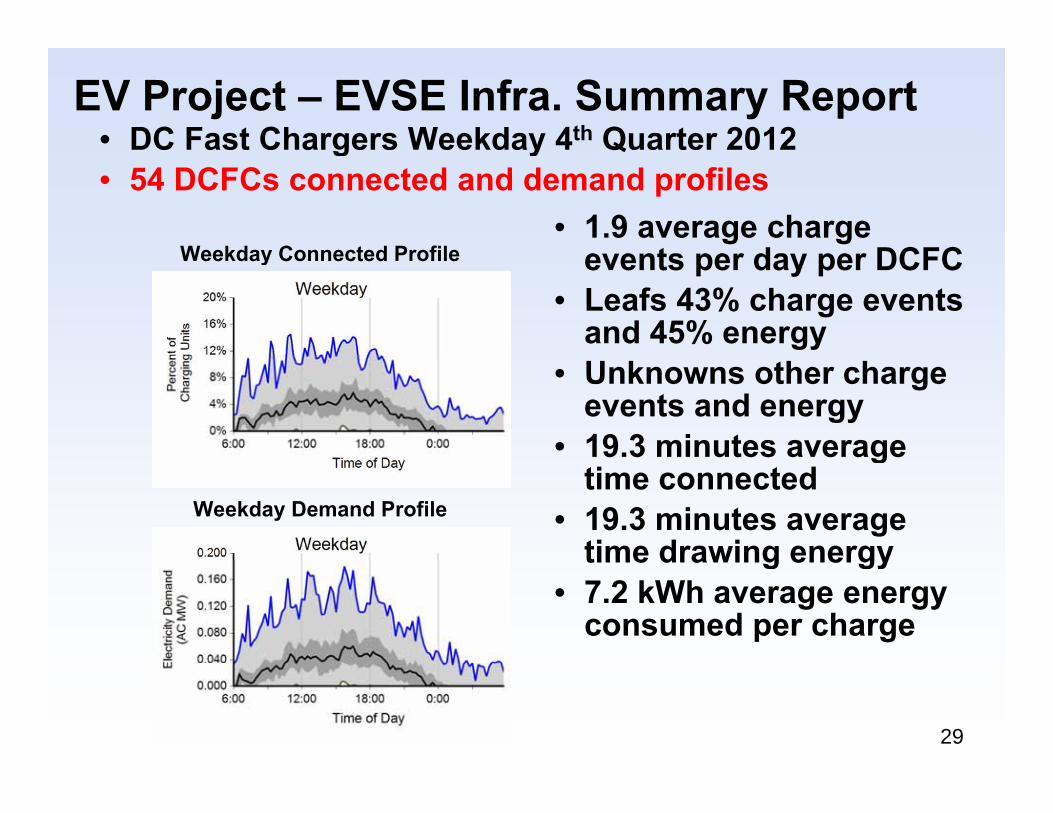
EV Project – EVSE Infra. Summary Report• DC Fast Chargers Weekday 4th Quarter 2012g y Q• 54 DCFCs connected and demand profiles
Weekday Connected Profile• 1.9 average charge
t d DCFCWeekday Connected Profile events per day per DCFC• Leafs 43% charge events
and 45% energy• Unknowns other charge
events and energy• 19.3 minutes average
Weekday Demand Profile
gtime connected
• 19.3 minutes average time drawing energytime drawing energy
• 7.2 kWh average energy consumed per charge
29
L2 Access Fees Structure4th Q t i fi t id d i l t ti f i l• 4th Quarter is first widespread implementation of simple and low cost access fees
• Blink member– Affiliate credit card with free Blink RFID “In Card”– Level 2 access fee of $1.00 per hour of connect time
• Guest No Blink RFID “In Card” required• Guest - No Blink RFID In Card required– Guest Code using quick reservation code or website– Level 2 access feel of $2.00 per hour of connect time
• Future pricing – Pricing to reflect regional electricity rates– Cover electricity costs in all cases– Cover electricity costs in all cases
30
DC Fast Charge (DCFC) Fees StructureE DCFC ith i iti l f h i• Encourage DCFC use with initial free charging
• Implement DCFC access fees by region in 1st Quarter 2013 with beta testing currently underway
• Initial fee structure simple and low cost– Accommodate varying vehicle charge rates
Accommodate select limitation of charging output– Accommodate select limitation of charging output power
• Blink member$2 h li i d $ 00 i– $25 per month unlimited use or $5.00 per session
• Guest – $8.00 per session$8.00 per session
31
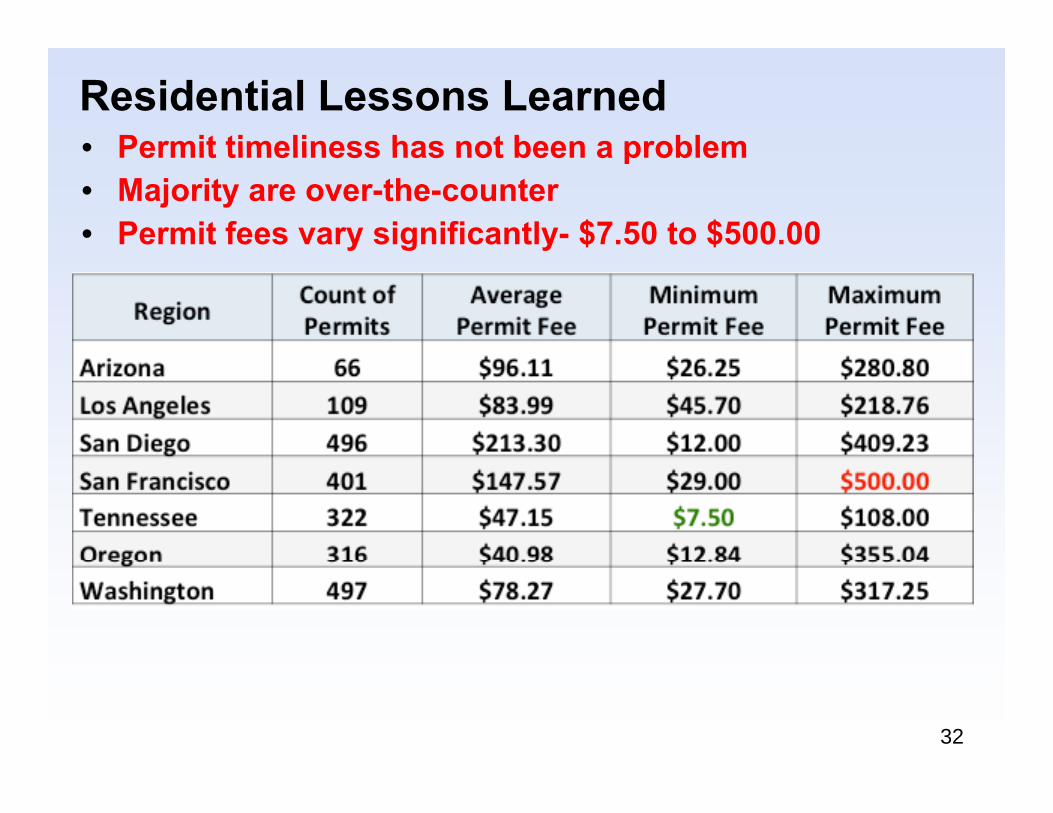
• Permit timeliness has not been a problemResidential Lessons Learned• Permit timeliness has not been a problem• Majority are over-the-counter• Permit fees vary significantly- $7.50 to $500.00
32
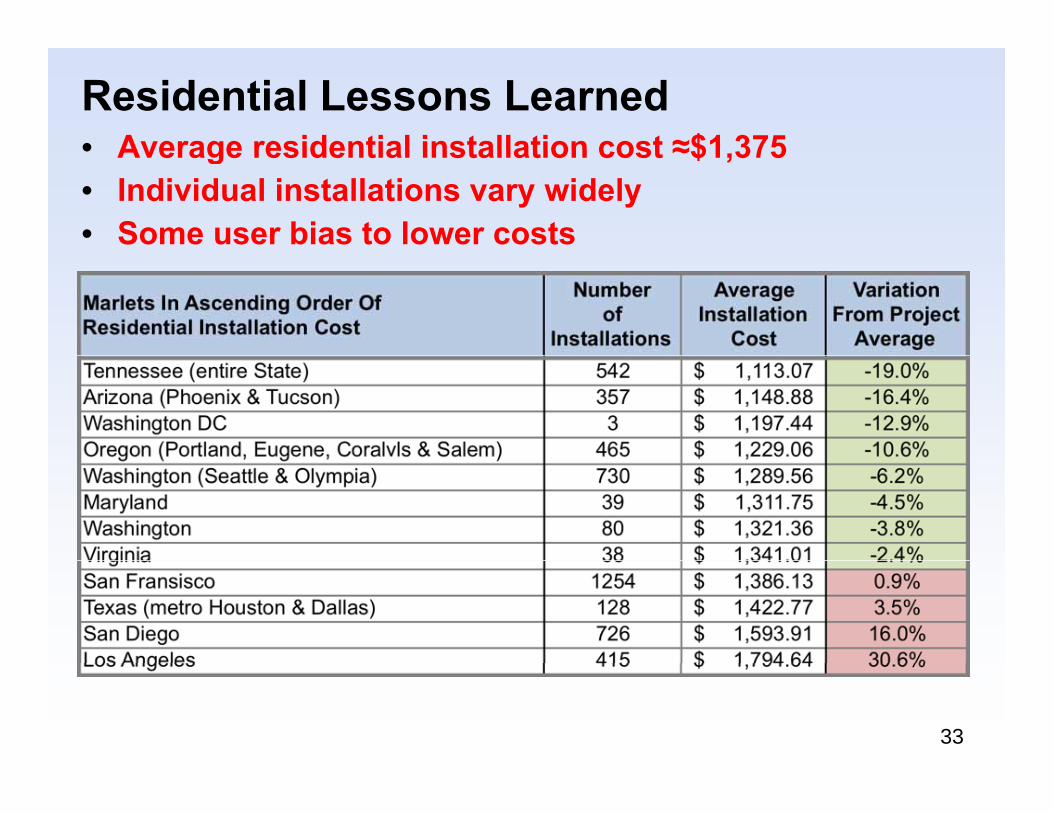
• Average residential installation cost ≈$1 375Residential Lessons Learned• Average residential installation cost ≈$1,375• Individual installations vary widely• Some user bias to lower costs
33
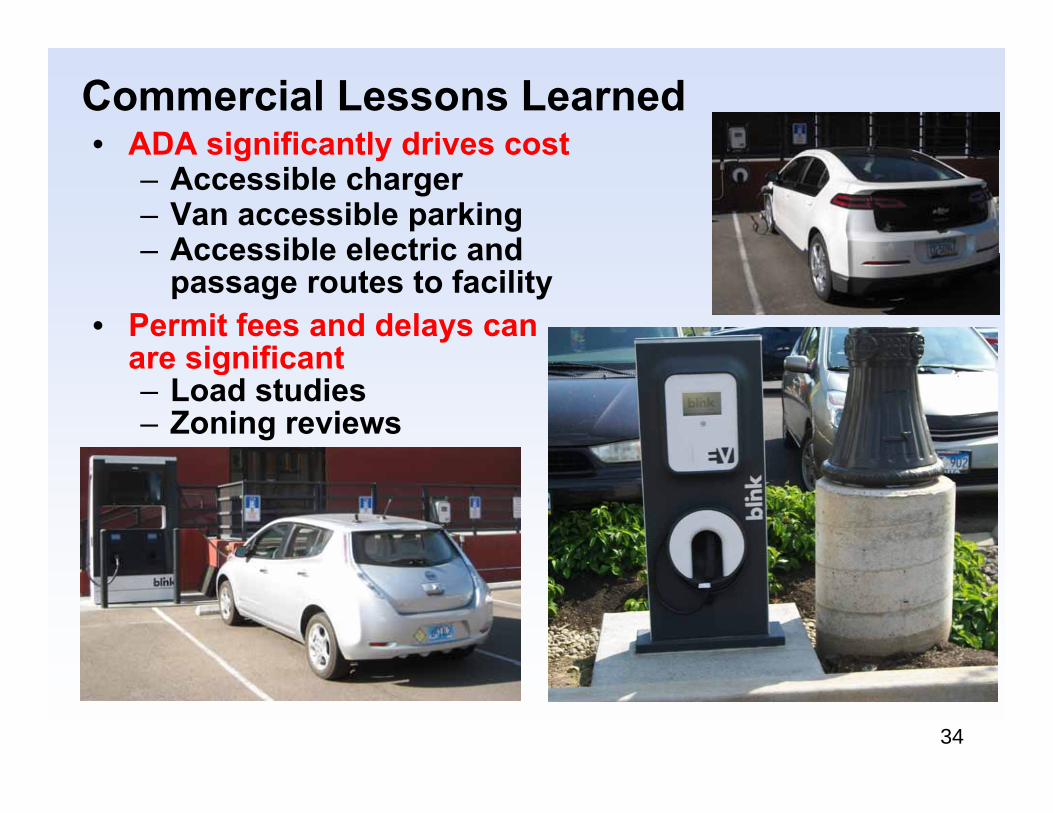
• ADA significantly drives costCommercial Lessons Learned
ADA significantly drives cost– Accessible charger– Van accessible parking– Accessible electric and– Accessible electric and
passage routes to facility• Permit fees and delays can
are significantare significant– Load studies– Zoning reviews
34
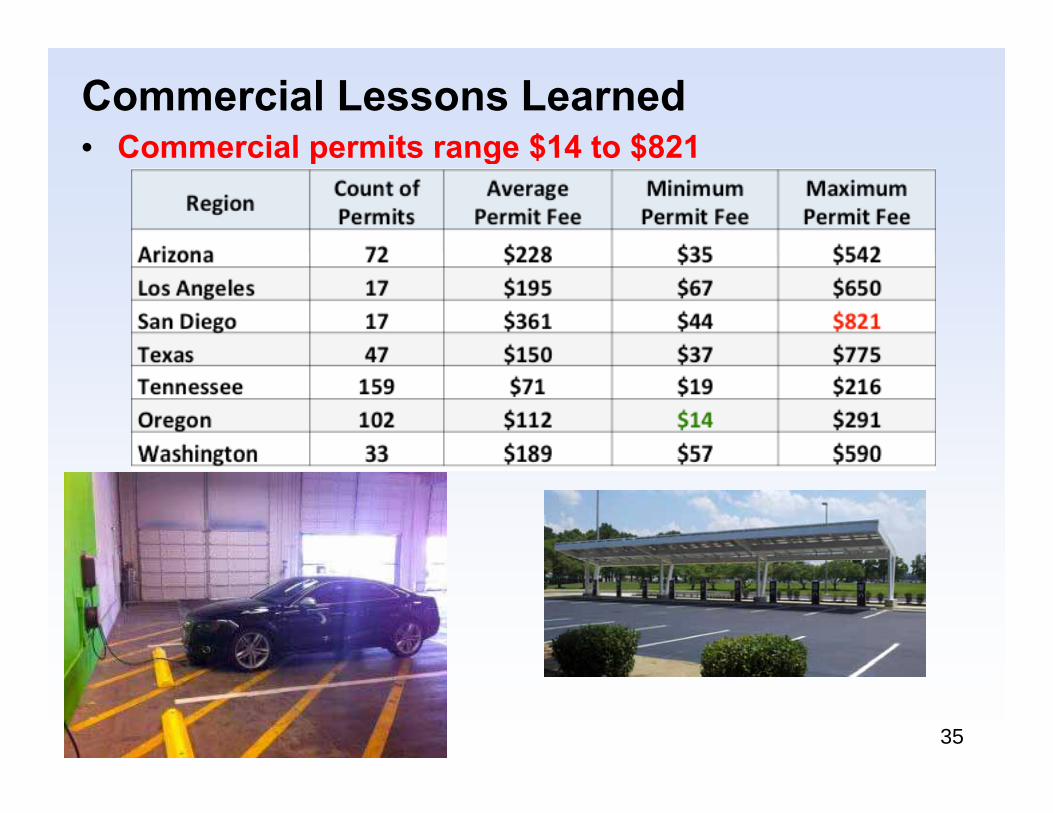
Commercial Lessons Learned• Commercial permits range $14 to $821• Commercial permits range $14 to $821
35
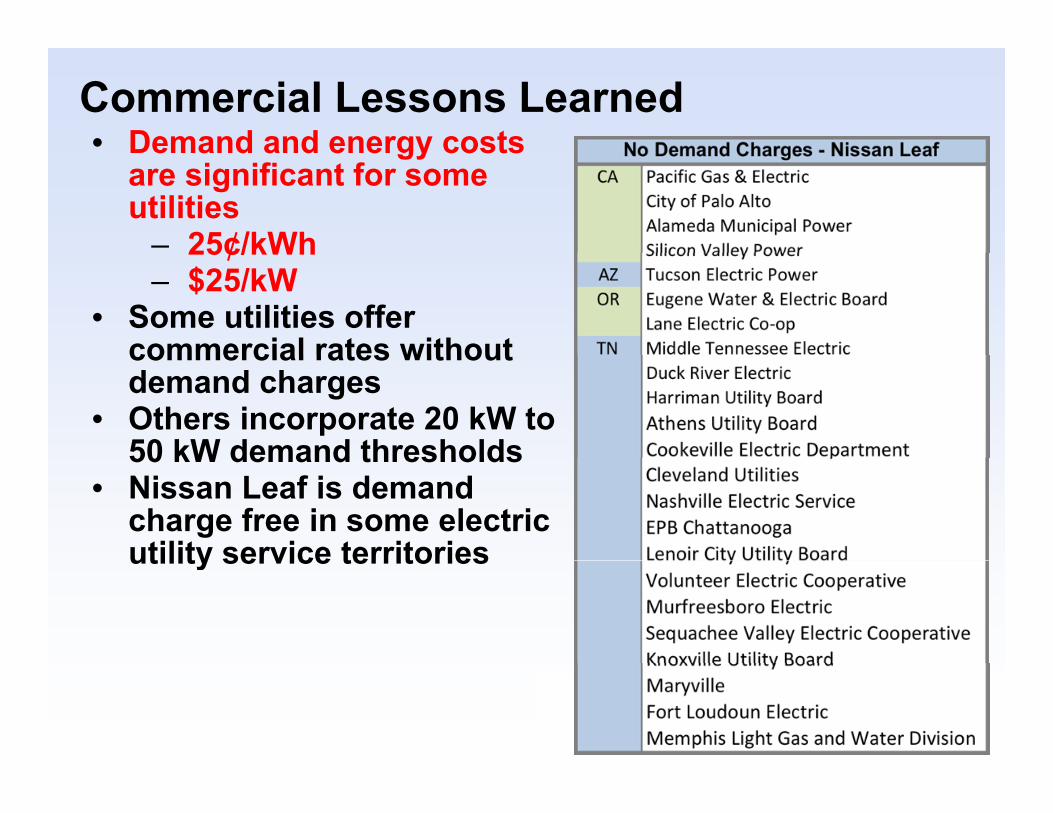
• Demand and energy costsCommercial Lessons Learned
Demand and energy costs are significant for some utilities
– 25¢/kWh25¢/kWh– $25/kW
• Some utilities offer commercial rates withoutcommercial rates without demand charges
• Others incorporate 20 kW to 50 kW demand thresholds50 kW demand thresholds
• Nissan Leaf is demand charge free in some electric utility service territoriesutility service territories
36
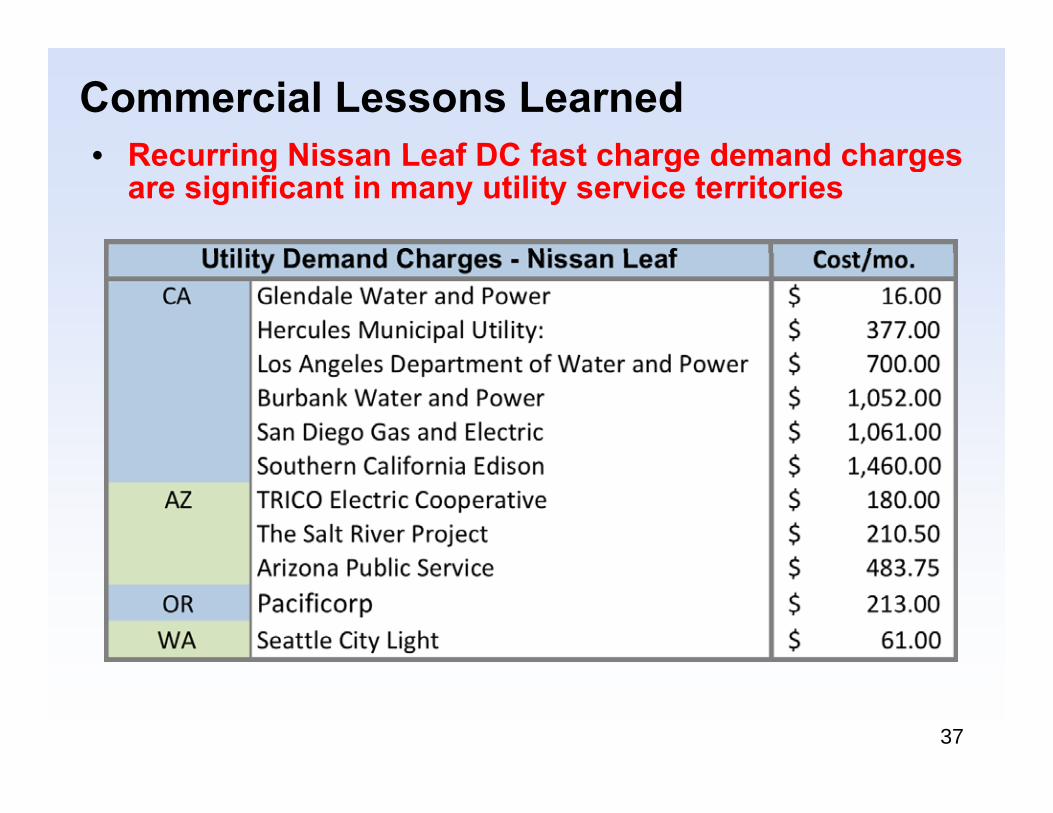
Recurring Nissan Leaf DC fast charge demand chargesCommercial Lessons Learned• Recurring Nissan Leaf DC fast charge demand charges
are significant in many utility service territories
37
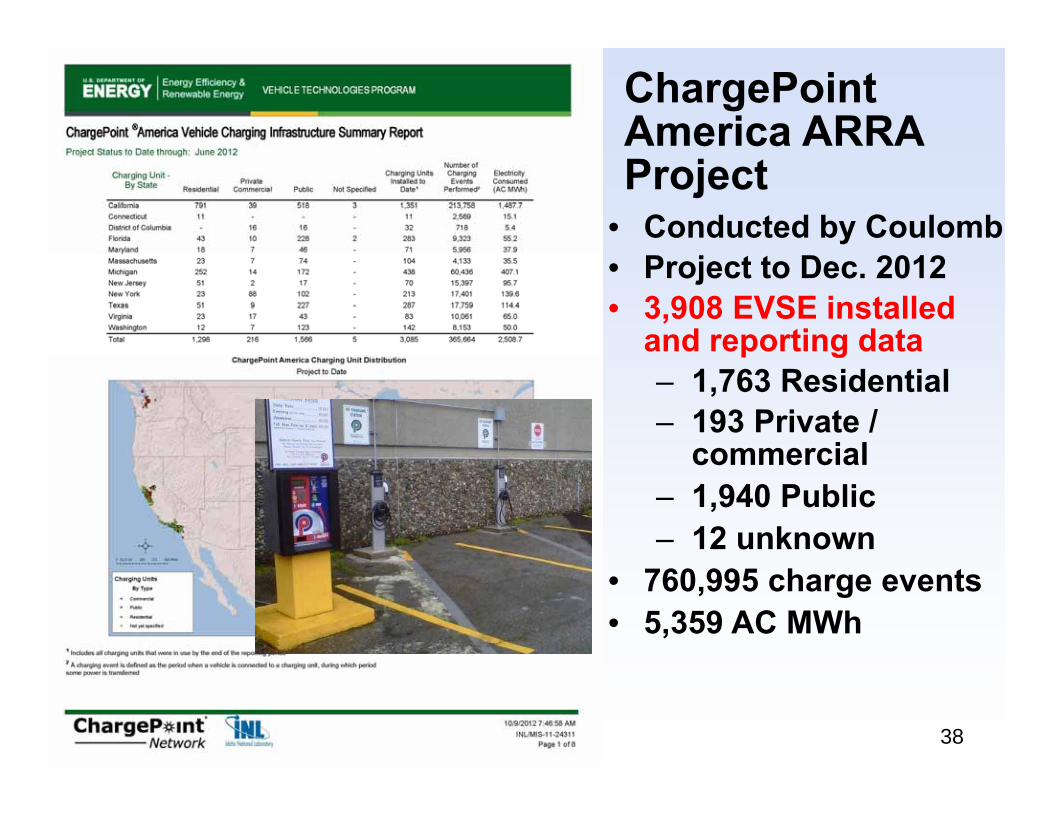
ChargePoint America ARRA Project
• Conducted by Coulomb• Project to Dec. 2012• 3,908 EVSE installed
and reporting datap g– 1,763 Residential– 193 Private /
commercialcommercial– 1,940 Public– 12 unknown
• 760,995 charge events• 5,359 AC MWh
38
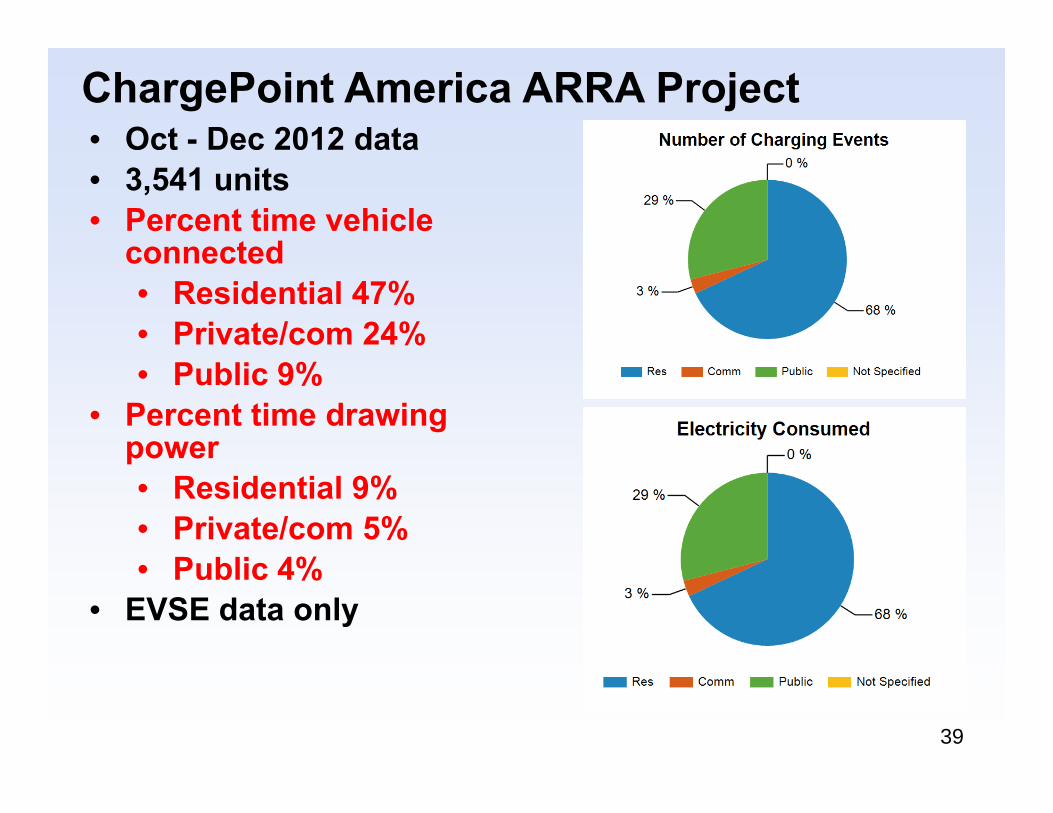
ChargePoint America ARRA Project• Oct - Dec 2012 data• 3,541 units• Percent time vehicle
connectedconnected• Residential 47%• Private/com 24%• Public 9%
• Percent time drawing powerpower• Residential 9%• Private/com 5%
P bli 4%• Public 4%• EVSE data only
39
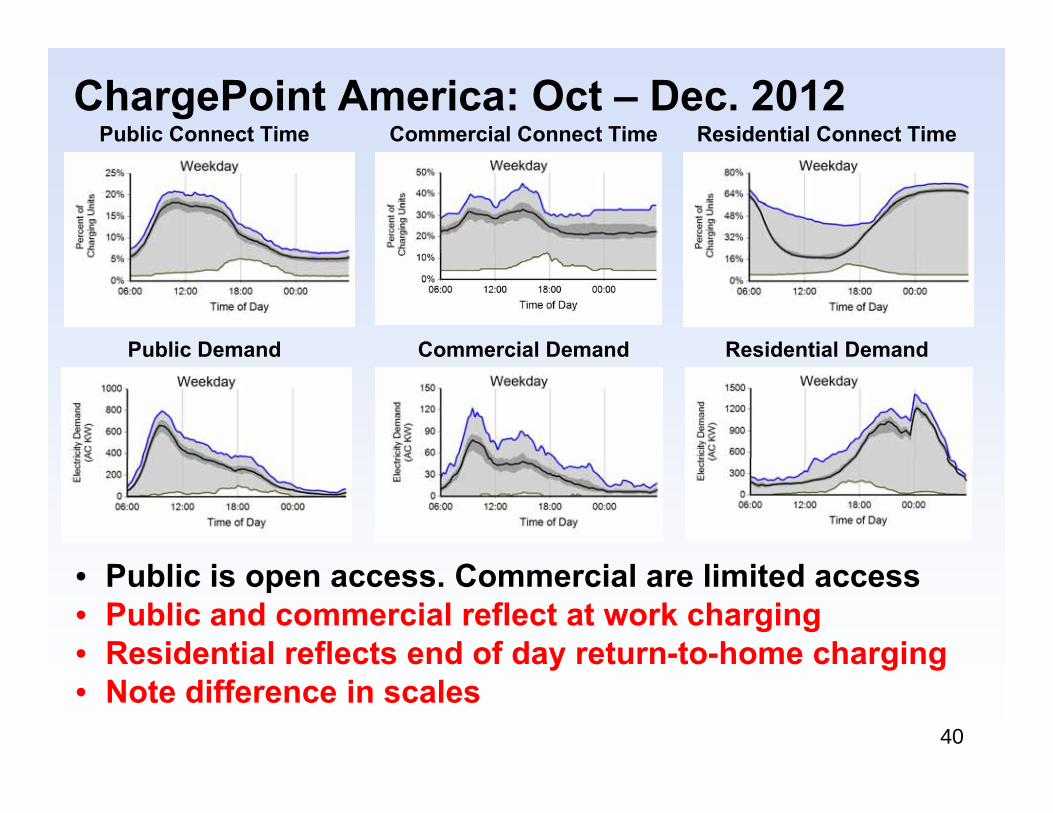
ChargePoint America: Oct – Dec. 2012Public Connect Time Commercial Connect Time Residential Connect Time
Public Demand Commercial Demand Residential DemandPublic Demand Commercial Demand Residential Demand
• Public is open access. Commercial are limited access• Public and commercial reflect at work charging• Residential reflects end of day return-to-home charging
40
Residential reflects end of day return to home charging• Note difference in scales
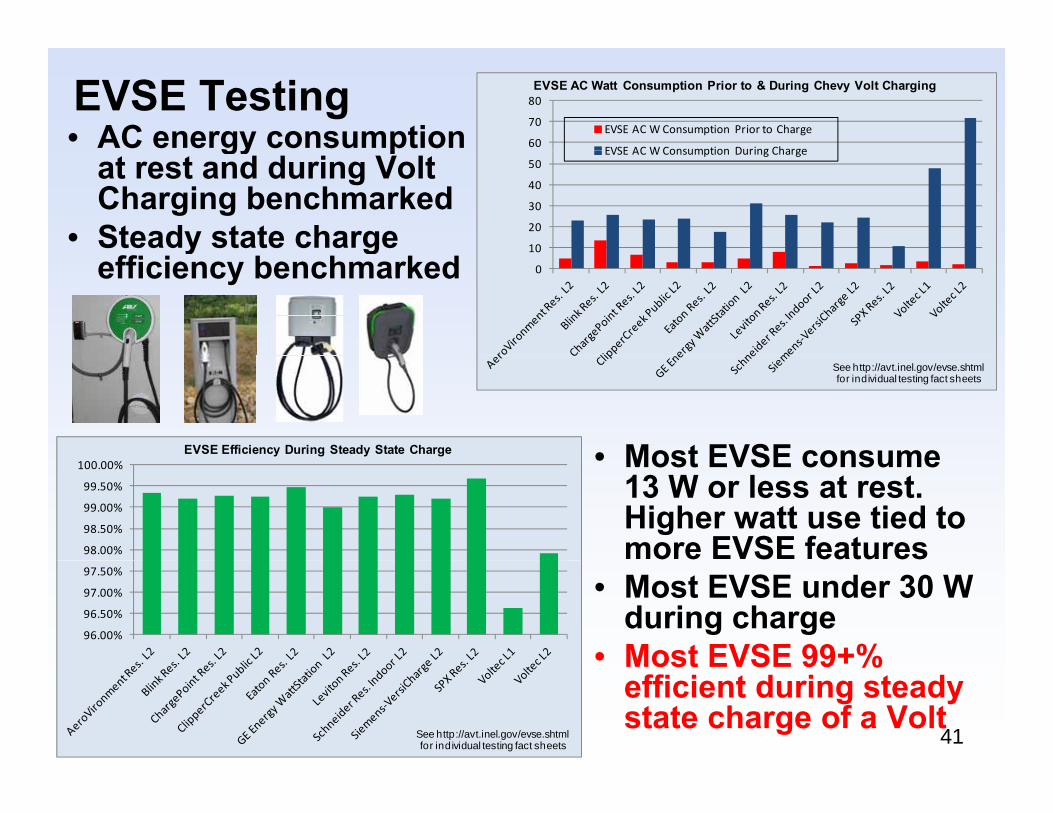
EVSE Testing• AC energy consumption 60
70
80
EVSE AC W Consumption Prior to Charge
EVSE AC WConsumption During Charge
EVSE AC Watt Consumption Prior to & During Chevy Volt Charging
gy pat rest and during Volt Charging benchmarked
• Steady state charge 10
20
30
40
50EVSE AC W Consumption During Charge
y gefficiency benchmarked 0
See http://avt.inel.gov/evse.shtml for individual testing fact sheets
EVSE Efficiency During Steady State Charge • Most EVSE consume
98.00%
98.50%
99.00%
99.50%
100.00% • Most EVSE consume 13 W or less at rest. Higher watt use tied to more EVSE features
96.00%
96.50%
97.00%
97.50%
• Most EVSE under 30 W during charge
• Most EVSE 99+%
41See http://avt.inel.gov/evse.shtml for individual testing fact sheets
Most EVSE 99+% efficient during steady state charge of a Volt
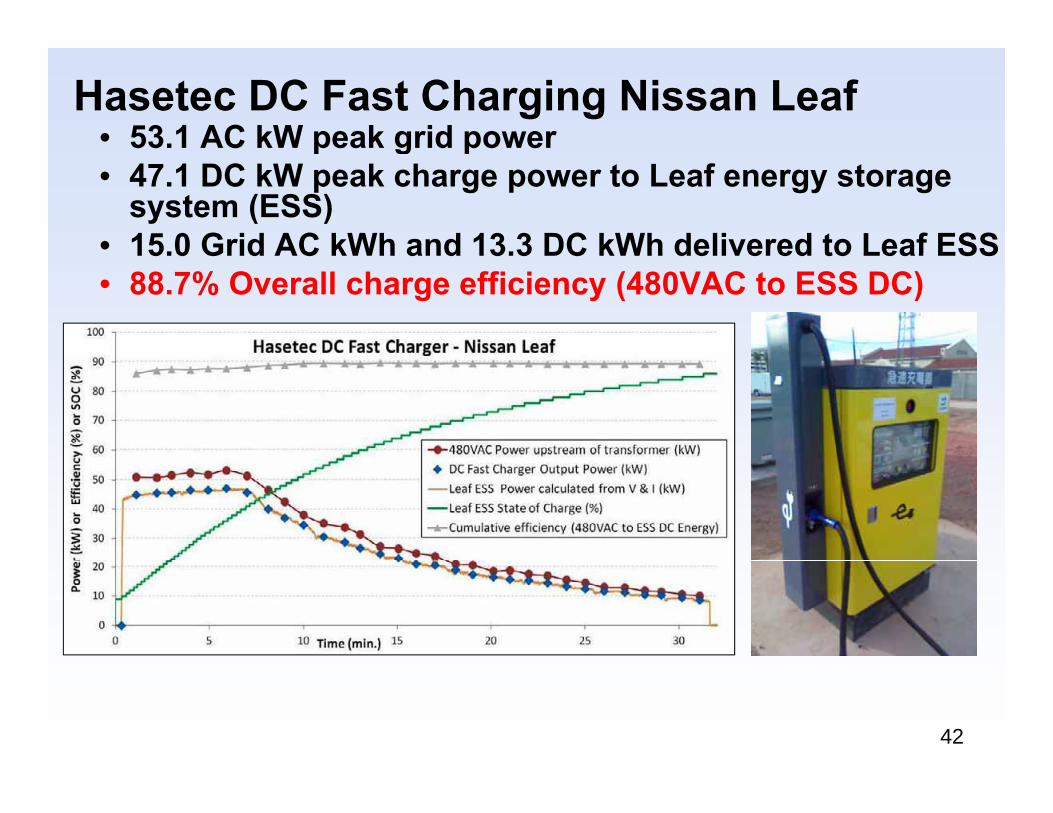
Hasetec DC Fast Charging Nissan Leaf• 53.1 AC kW peak grid powerp g p• 47.1 DC kW peak charge power to Leaf energy storage
system (ESS)• 15.0 Grid AC kWh and 13.3 DC kWh delivered to Leaf ESS15.0 Grid AC kWh and 13.3 DC kWh delivered to Leaf ESS• 88.7% Overall charge efficiency (480VAC to ESS DC)
42
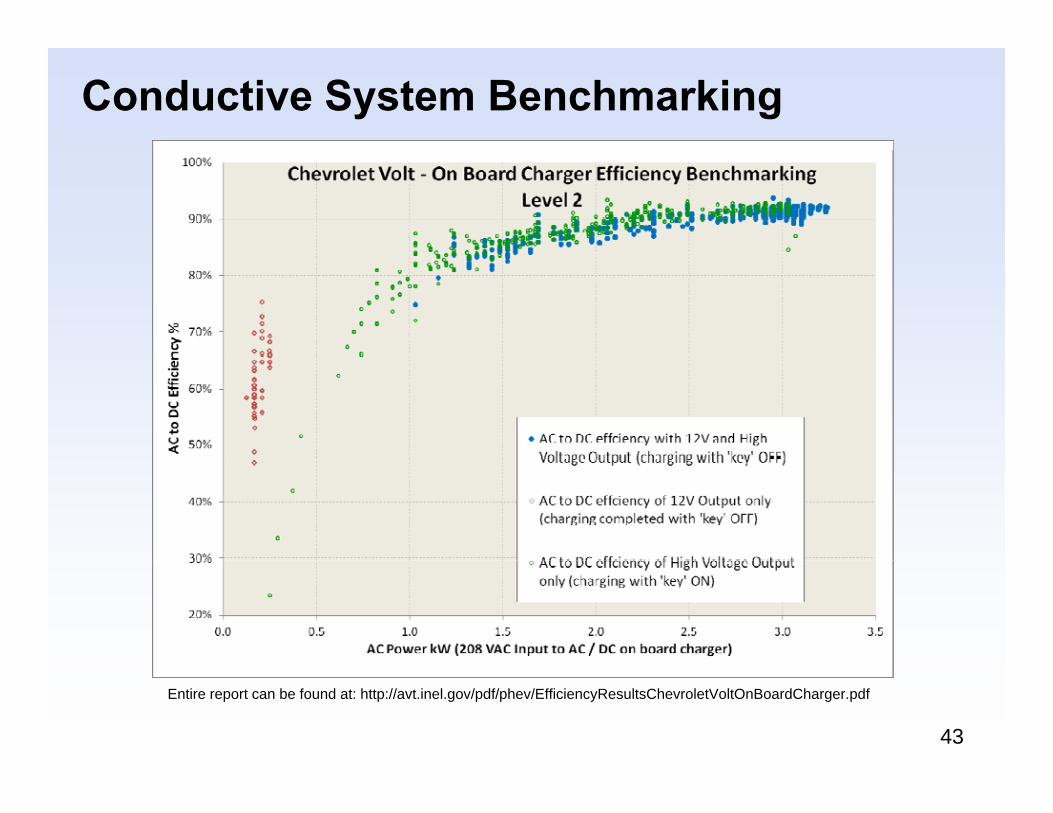
Conductive System Benchmarking
43
Entire report can be found at: http://avt.inel.gov/pdf/phev/EfficiencyResultsChevroletVoltOnBoardCharger.pdf
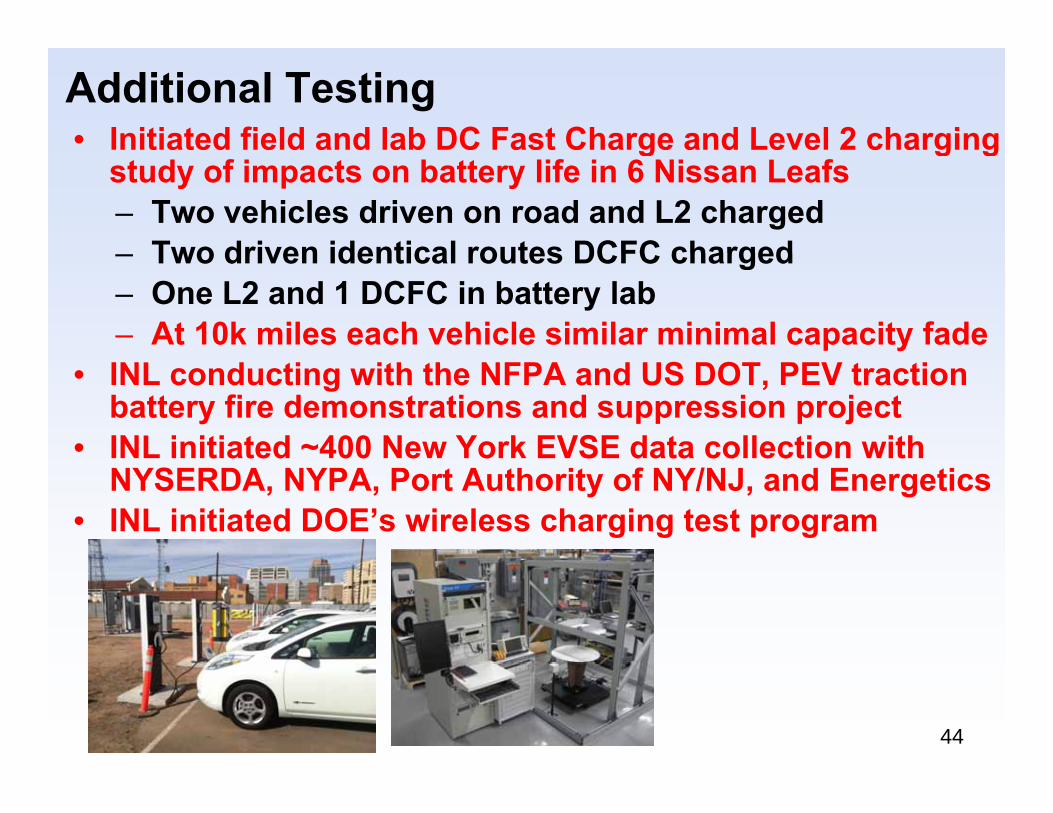
Additional Testing• Initiated field and lab DC Fast Charge and Level 2 charging g g g
study of impacts on battery life in 6 Nissan Leafs– Two vehicles driven on road and L2 charged
Two driven identical routes DCFC charged– Two driven identical routes DCFC charged– One L2 and 1 DCFC in battery lab– At 10k miles each vehicle similar minimal capacity fade
• INL conducting with the NFPA and US DOT, PEV traction battery fire demonstrations and suppression project
• INL initiated ~400 New York EVSE data collection withINL initiated 400 New York EVSE data collection with NYSERDA, NYPA, Port Authority of NY/NJ, and Energetics
• INL initiated DOE’s wireless charging test program
44
Summary• EV Project vehicles connected much longer than needed j g
to recharge - opportunities to shift charging times• Significant residential Level 2 EV Project charging occurs
off-peak with charge-starts at midnight per TOU ratesoff peak with charge starts at midnight per TOU rates indicates consumers are price sensitive
• Revenue models for public charging are currently being introduced – long term impacts?introduced long term impacts?
• Only about 60% of EV Project data collected to date• DCFC charge events have significant demand impacts
b t this is an electric tilit polic decisionbut this is an electric utility policy decision• How, where, when we measure EVSE and vehicle system
charging efficiencies results in significantly different ltresults
45
AcknowledgementThis work is supported by the U.S. Department of
Energy’s EERE Vehicle Technologies Program
g
More Informationhttp://avt.inl.gov
This presentation will be posted in the publications section of the above website
46
INL/MIS-13-28453