Embed Size (px)
Citation preview
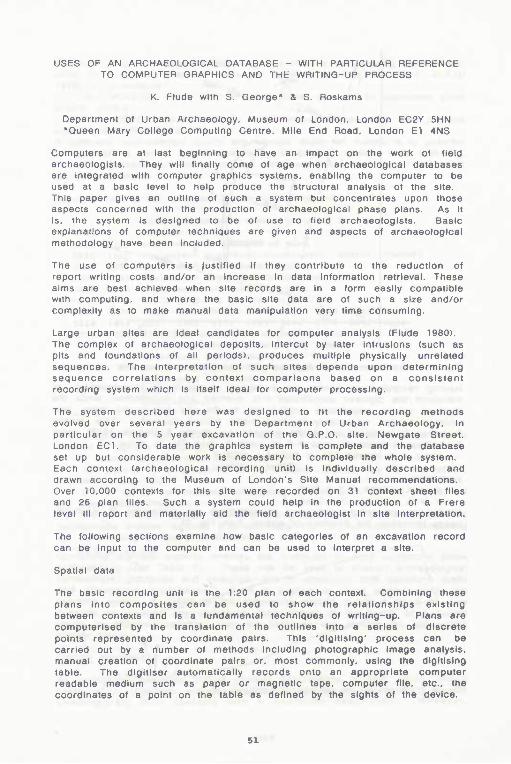
USES OF AN ARCHAEOLOGICAL DATABASE - WITH PARTICULAR REFERENCE TO COMPUTER GRAPHICS AND THE WRITING-UP PROCESS •
K. Flude with S. George* & S. Roskams
Department of Urban Archaeology. Museum of London, London EC2Y 5HN "Queen Mary College Computing Centre. Mile End Road. London El 4NS
Computers are at last beginning to have an Impact on the work of field archaeologists. They will finally come of age when archaeological databases are Integrated with computer graphics systems, enabling the computer to be used at a basic level to help produce the structural analysis of the site. This paper gives an outline of such a system but concentrates upon those aspects concerned with the production of archaeological phase plans. As It Is. the system Is designed to be of use to field archaeologists. Basic explanations of computer techniques are given and aspects of archaeological methodology have been included.
The use of computers is Justified If they contribute to the reduction of report writing costs and/or an increase in data Information retrieval. These aims are best achieved when site records are In a form easily compatible with computing, and where the basic site data are of such a size and/or complexity as to make manual data manipulation very time consuming.
Large urban sites are ideal candidates for computer analysis (Flude 1980). The complex of archaeological deposits. Intercut by later intrusions (such as pits and foundations of ail periods), produces multiple physically unrelated sequences. The interpretation of such sites depends upon determining sequence correlations by context comparisons based on a consistent recording system which is itself ideal for computer processing.
The system described here was designed to fit the recording methods evolved over several years by the Department of Urban Archaeology. In particular on the 5 year excavation of the G.P.O. site, Newgate Street, London ECl. To date the graphics system is complete and the database set up but considerable work is necessary to complete the whole system. Each context (archaeological recording unit) is Individually described and drawn according to the Museum of London's Site Manual recommendations. Over 10.000 contexts for this site were recorded on 31 context sheet files and 26 plan files. Such a system could help In the production of a Frere level Hi report and materially aid the field archaeologist In site interpretation.
The following sections examine how basic categories of an excavation record can be input to the computer and can be used to interpret a site.
Spatial data
The basic recording unit Is the 1:20 plan of each context. Combining these plans Into composites can be used to show the relationships existing between contexts and is a fundamental techniques of wrltlng-up. Plans are computerised by the translation of the outlines into a series of discrete points represented by coordinate pairs. This 'digitising' process can be carried out by a number of methods Including photographic image analysis, manual creation of coordinate pairs or. most commonly, using the digitising table. The dlgltlser automatically records onto an appropriate computer readable medium such as paper or magnetic tape, computer file, etc., the coordinates of a point on the table as defined by the sights of the device.
61
i»i!, • '•3«*-Ç;i;:'-;j
•a»*- " -îC
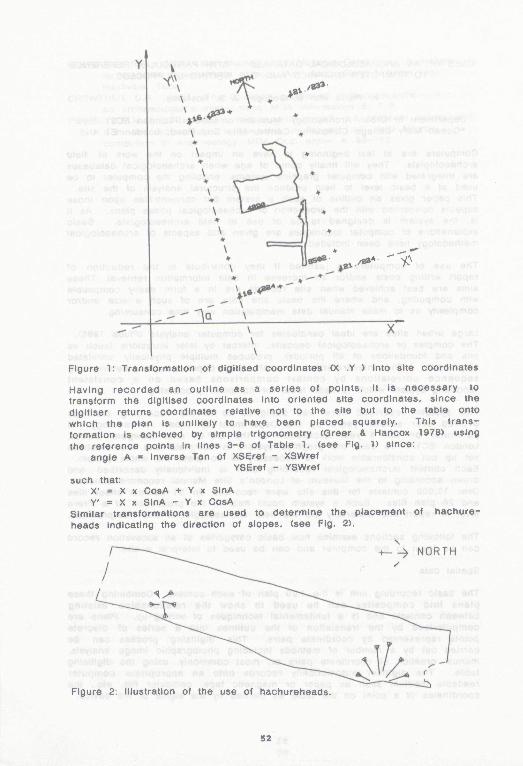
Figure 1: Transformation of digitised coordinates (X ,Y ) into site coordinates
Having recorded an outline as a series of points. It is necessary to transform the digitised coordinates Into oriented site coordinates, since the digitlser returns coordinates relative not to the site but to the table onto vKhlch the plan is unlilteiy to have been placed squarely. This trans- formation is achieved by simple trigonometry (Qreer & Hancox 1978) using the reference points in lines 3-6 of Table 1, (see Fig. 1) since:
angle A = inverse Tan of XSEref - XSWref , YSEref - YSWref such that:
X' = X X CosA + Y X SInA Y' = X X SInA - Y X CosA
Similar transformations are used to determine the placement of hachure- heads indicating the direction of slopes, (see Fig. 2).
t
Figure 2: illustration of the use of hachureheads.
ca
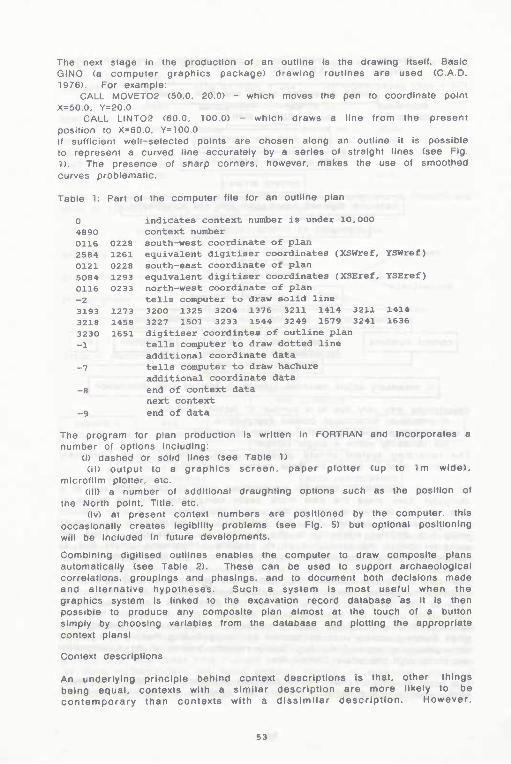
The next stage In the production of an outline Is the drawing Itself. Basic GINO (a computer graphics package) drawing routines are used (CAD. 1976). For example:
CALL M0VET02 (50.0, 20.0) - which moves the pen to coordinate point X=50.0. Y=20.0
CALL LINT02 (60.0, 100.0) - which draws a line from the present position to X=60.0. Y=100.0 If sufficient well-selected points are chosen along an outline It is possible to represent a curved line accurately by a series of straight lines (see Fig. 1). The presence of sharp corners, however, makes the use of smoothed curves problematic. f • •"
Table 1: Part of the computer file for an outline plan ''.'«4i>i *•«
o indicates context number is under 10,000 4890 context number 0116 0228 south-west coordinate of plan
s 2584 1261 equivalent digitiser coordinates (XSWref, YSWref) 0121 0228 south-east coordinate of plan
Ï S084 1293 equivalent digitiser coordinates (XSEref, YSEref) 0116 023 3 north-west coordinate of plan iis
;gA —2 tells computer to draw solid line 3193 1273 3200 1325 3204 1376 3211 1414 3211 1414 3218 1458 3227 1501 3233 1544 3249 1579 3241 1636 3230 1651 digitiser coordintes of outline plan -1 tells computer to draw dotted line
additional coordinate data -7 tells computer to draw hachure
additional coordinate data -. -8 end of context data i
next context -9 end of data ->
The program for plan production Is written In FORTRAN and incorporates a number of options Including:
(I) dashed or solid lines (see Table 1) (II) output to a graphics screen, paper plotter (up to 1m wide),
microfilm plotter, etc. (ill) a number of additional draughting options such as the position of
the North point. Title, etc. (Iv) at present context numbers are positioned by the computer, this
occasionally creates legibility problems (see Fig. 5) but optional positioning will be Included in future developments.
Combining digitised outlines enables the computer to draw composite plans automatically (see Table 2). These can be used to support archaeological correlations, groupings and phaslngs, and to document both decisions made and alternative hypotheses. Such a system is most useful when the graphics system Is linked to the excavation record database "as It Is then possible to produce any composite plan almost at the touch of a button simply by choosing variables from the database and plotting the appropriate context piansi
Context descriptions
An underlying principle behind context descriptions Is that, other things being equal, contexts with a similar description are more likely to be contemporary than contexts with a dissimilar description. However,
•w^P|r
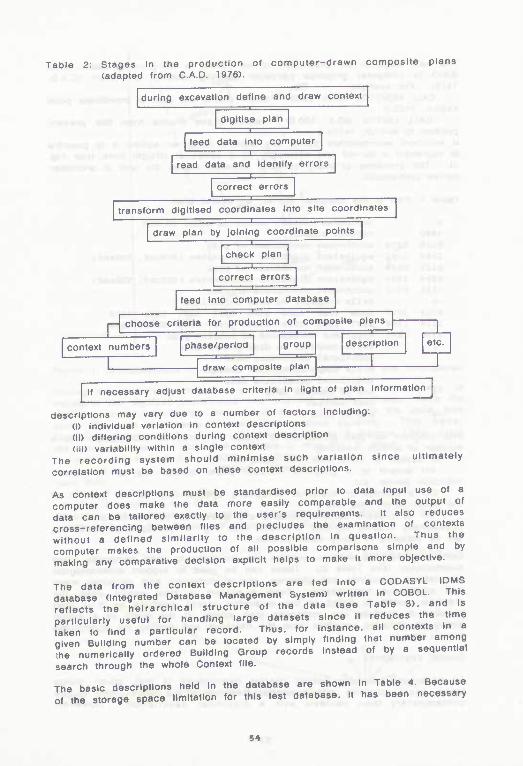
Table 2: Stages in the production of computer-drawn composite plans y .1 , ,, j (adapted from C.A.D. 1976).
during excavation define and draw context
digitise plan •e=x
feed data into computer uz
read data and Identify errors
correct errors
transform digitised coordinates into site coordinates
draw plan by joining coordinate points
check plan zc
correct errors
feed into computer database
n choose criteria for production of composite plans
context numbers phase/period group description etc.
draw composite plan
If necessary adjust database criteria in light of plan Information
descriptions may vary due to a number of factors including: (i) Individual variation in context descriptions (II) differing conditions during context description (ill) variability within a single context
The recording system should minimise such variation since ultimately correlation must be based on these context descriptions.
As context descriptions must be computer does make the data data can be tailored exactly to cross-referencing between files without a defined similarity to computer makes the production making any comparative decision
standardised prior to data Input use of a more easily comparable and the output of the user's requirements. It also reduces
and precludes the examination of contexts the description in question. Thus the
of all possible comparisons simple and by explicit helps to make It more objective.
The data from the context descriptions are fed Into a CODASYL IDMS database (Integrated Database Management System) written in COBOL. Th s reflects the heirarchical structure of the data (see Table 3). and is particularly useful for handling large datasets since It reduces the time taken to find a particular record. Thus, for Instance, all contexts In a given Building number can be located by simply finding that number among the numerically ordered Building Group records Instead of by a sequential search through the whole Context file.
The basic descriptions held In the database are shown In Table 4. Because of the storage space limitation for this test database. It has been necessary
54
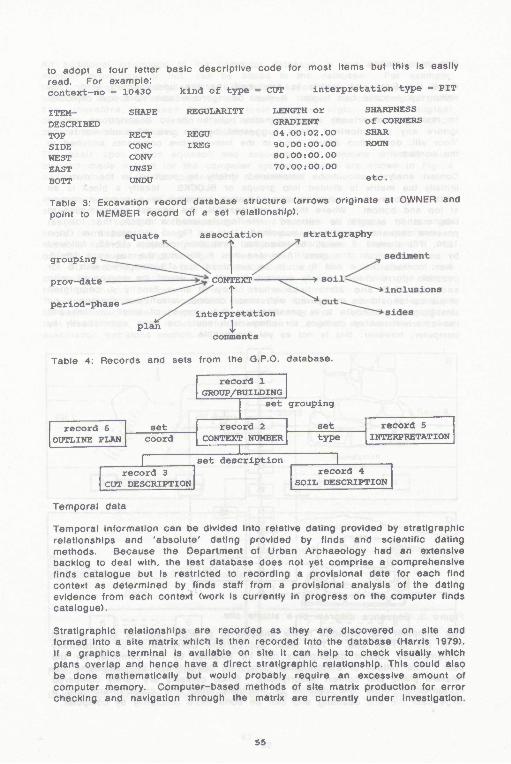
to adopt a four letter basic descriptive code for most items but this is easily read. For example: context-no - 10430 kind of type - COT interpretation type - PIT
ITEM- SHAPE REGULARITY LENGTH or SHARPNESS DESCRIBED GRADIENT of CORNERS •TOP RECT REGU 04.00:02.00 SHAR SIDE CONC IREG 90.00:00.00 ROUN ,reST CONV 80.00:00.00 EAST ONSP 70.00:00.00
BOTT ONDÜ ®*^° •
Table 3: Excavation record database structure (arrows originate at OWNER and point to MEMBER record of a set relationship).
equate
grouping
prov-date
period-phase
association stratigraphy
plan
CONTEXT
interpretation
i comments
Table 4: Records and sets from the Q.P.O. database.
i ''4
set
record 1 GROUP/BUILDING
set grouping
record 6 OUTLINE PLAN
record 2 CONTEXT NUMBER
set record 5 INTERPRETATION coord type
1 set description
record 3 CUT DESCRIPTION
record 4 SOIL DESCRIPTION
Temporal data
Temporal information can be divided into relative dating provided by stratigraphie relationships and 'absolute' dating provided by finds and scientific dating methods. Because the Department of Urban Archaeology had an extensive backlog to deal with, the test database does not yet comprise a comprehensive finds catalogue but Is restricted to recording a provisional date for each find context as determined by finds staff from a provisional analysis of the dating evidence from each context (work Is currently in progress on the computer finds catalogue).
Stratigraphie relationships are recorded as they are discovered on site and formed Into a site matrix which is then recorded Into the database (Harris 1979). if a graphics terminal Is available on site it can help to check visually which plans overlap and hence have a direct stratigraphie relationship. This eouid also be done mathematically but would probably require an excessive amount of computer memory. Computer-based methods of site matrix production for error checking and navigation through the matrix are currently under investigation.
Site interpretation
Once the final site matrix is produced, barring unsuspected error, the writlng-up process can begin. It must be rigorous, consistent and ob)ectlve.
In making comparisons an examination o1 the basic descriptions should ignore any preconceived Ideas suggested by the use of such words as •floor slii. destruction debris, etc.' In the Interpretative comments attached to the context file. 5EïW
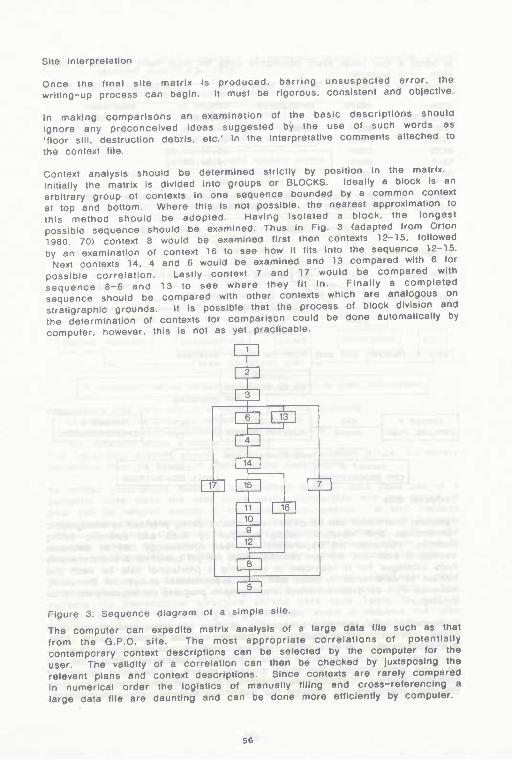
Context analysis should be determined strictly by position In the matrix. initially the matrix is divided into groups or BLOCKS. Ideally a block Is an arbitrary group of contexts In one sequence bounded by a common context at top and bottom. Where this Is not possible, the nearest approximation to this method should be adopted. Having isolated a block, the longest possible sequence should be examined. Thus In Fig. 3 (adapted from Orton 1980 70) context 8 «rould be examined first then contexts 12-15, followed by an examination of context 16 to see how it fits into the sequence 12-15.
Next contexts 14. 4 and 6 would be examined and 13 compared with 6 tor possible correlation. Lastly context 7 and 17 would be compared with sequence 8-6 and 13 to see where they fit In. Finally a completed sequence should be compared with other contexts which are analogous on stratigraphie grounds. It is possible that the process of block division and the determination of contexts for comparison could be done automatically by computer, however, this Is not as yet practicable.
^
^
^^ 0
t h ^
^ d + p 1
11 i ' 1 MeJ
10 9 12
1
^ + Figure 3: Sequence diagram of a simple site.
The computer can expedite matrix analysis of a large data file such as that from the Q.P.O. site. The most appropriate correlations of potentially contemporary context descriptions can be selected by the computer for the user. The validity of a correlation can then be checked by juxtaposing the relevant plans and context descriptions. Since contexts are rarely compared in numerical order the logistics of manually filing and cross-referencing a large data file are daunting and can be done more efficiently by computer.
«Ms-,
An additional advantage of the computer database Is that decisions nrtade. whether provisional or not, can be added to the database. For exannple. the grouping, period-phase, equation or association of contexts. This Important aspect of database system analysis makes decisions explicit and can, therefore, be used to check their Internal logic. If an Illogical decision is detected by the system the user must then make an explicit choice between conflicting Interpretations. ra
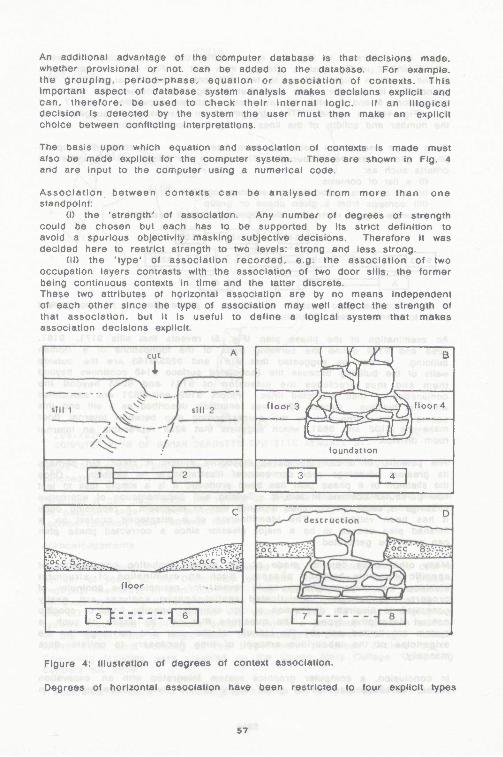
The basis upon which equation and association of contexts Is made must also be made explicit for the computer system. These are shown In Fig. 4 and are input to the computer using a numerical code.
Association between contexts can be analysed from more than one standpoint:
(I) the 'strength' of association. Any number of degrees of strength could be chosen but each has to be supported by Its strict definition to avoid a spurious objectivity masking subjective decisions. Therefore It was decided here to restrict strength to two levels: strong and less strong.
(II) the 'type' of association recorded, e.g. the association of two occupation layers contrasts with the association of two door sills, the former being continuous contexts In time and the latter discrete. These two attributes of horizontal association are by no means independent of each other since the type of association may well affect the strength of that association, but It is useful to define a logical system that makes association decisions explicit.
ï5, • floor 3 *\
^
^^_JV;N^ floor 4
L =-—^-y foundation
1 1 J 3 1 4
î^i: ?r?^?r?:ftr>-,^
c
^.^.yj-çf^occ^ 6 •.;^!:
floor
--cn LE-""
Figure 4: Illustration of degrees of context association.
Degrees of horizontal association have been restricted to four explicit types
m^
which are Illustrated in Fig. 4. It is implicit that the association between slils 1 and 2 in Fig. 4(a) Is stronger than that in Fig. 4(b) between floors 3 and 4 which might belong to two different constructional phases; this association Is stronger again than that in Fig. 4(c) between the debris of occupations 5 and 6, while the association between occupation layers 7 and 8 In Fig. 4(d> Is weal<er. The strength of an association Is suggested by the number and solidity of the lines joining the context numbers.
Once these association decisions have been made and checked complete phase plans can be produced. These can be based on a number of criteria such as:
(I) a list of contexts (ii) all contexts associated or equated together (Hi) contexts from a given phase or group
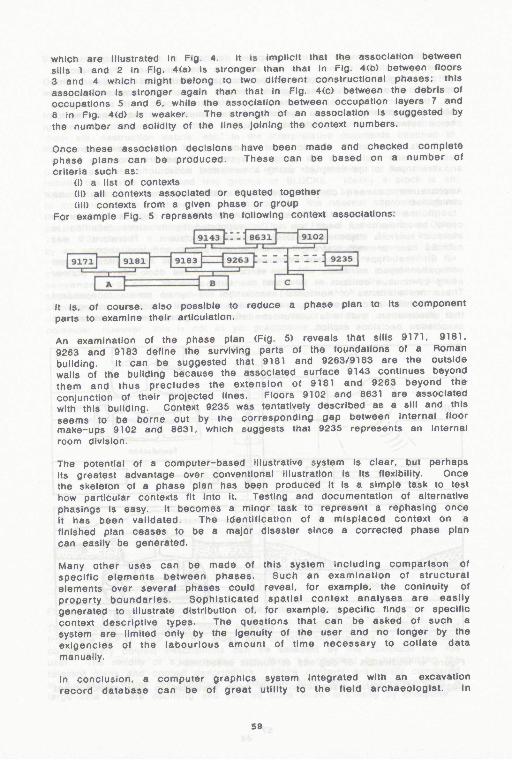
For example Fig. 5 represents the following context associations:
It Is. of course, also possible to reduce a phase plan to Its component parts to examine their articulation.
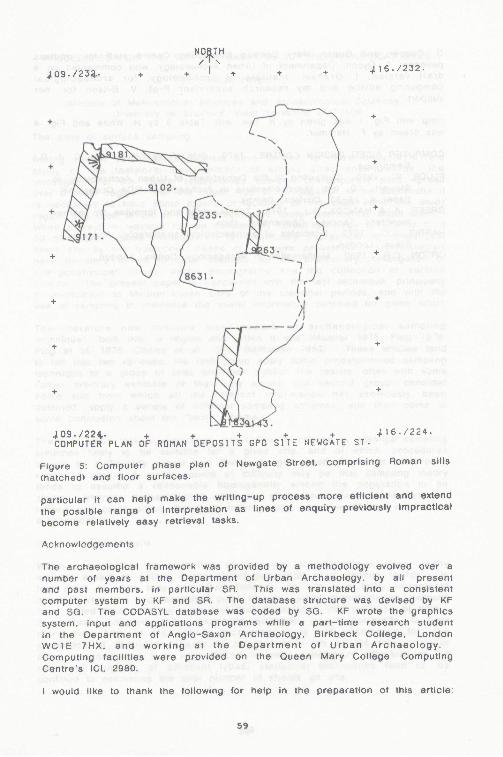
An examination of the phase plan (Fig. 5) reveals that sills 9171. 9181. 9263 and 9183 define the surviving parts of the foundations of a Roman building. It can be suggested that 9181 and 9263/9183 are the outside walls of the building because the associated surface 9143 continues beyond them and thus precludes the extension of 9181 and 9263 beyond the coniunction of their proiected lines. Floors 9102 and 8631 are associated with this building. Context 9235 was tentatively described as a sill and this seems to be borne out by the corresponding gap between internal floor make-ups 9102 and 8631. which suggests that 9235 represents an Internal room division.
The potential of a computer-based Illustrative system is clear, but perhaps Its greatest advantage over conventional illustration is its flexibility. Once the skeleton of a phase plan has been produced It is a simple task to test how particular contexts fit Into it. Testing and documentation of alternative phasings Is easy. It becomes a minor task to represent a rephasing once It has been validated. The identification of a misplaced context on a finished plan ceases to be a major disaster since a corrected phase plan can easily be generated.
Many other uses can be made of this system Including comparison of specific elements between phases. Such an examination of structural elements over several phases could reveal, for example, the coninulty of property boundaries. Sophisticated spatial context analyses are easily generated to Illustrate distribution of. for example, specific finds or specific context descriptive types. The questions that can be asked of such a system are limited only by the igenuity of the user and no longer by the exigencies of the labourious amount of time necessary to collate data manually.
In conclusion, a computer graphics system Integrated with an excavation record database can be of great utility to the field archaeologist. In
J09./233-
NORTH
I H116./232. '
,,v .:.,-,^l:<:
409./22i. + + + + + 416./224. ^ • COMPUTER PLAN OF ROMAN DEPOSITS GPO SITE NEWGATE ST.
Figure 5: Computer phase plan of Newgate Street, comprising Roman sills
(liatched) and floor surfaces.
particular It can help mal<e the writlng-up process more efficient and extend the possible range of Interpretation as lines of enquiry previously Impractical become relatively easy retrieval tasks.
Acknowiodfiements
The archaeological framework was provided by a methodology evolved over a number of years at the Department of Urban Archaeology, by all present and past members. In particular SR. This was translated into a consistent computer system by KF and SR, The database structure was devised by KF and SG. The CODASYL database was coded by SG. KF wrote the graphics system, input and applications programs while a part-time research student In the Department of Anglo-Saxon Archaeology, BIrkbeck College, London WCTE 7HX. and working at the Department of Urban Archaeology. Computing facilities were provided on the Queen l^ary College Computing Centre's ICL 2980.
I would like to thank the following for help In the preparation of this article:
G. Cooper and Queen Mary College Computing Centre staff for endless patience; A. Dyson, Department of Urban Archaeology, who commented on a draft version; I. Graham, Institute of Archaeology, for archaeological computing advice and my research supervisor Prof. V. Evison for her support.
Help with Fig. 1 was given by R. Lee, with Table 3 by H, White and Fig. 4 was drawn by F. Hammer.
COMPUTER AIDED DESIGN CENTRE 1976 GINO-F user's manual. G. A. D., Cambridge.
FLUDE, K. 1980 Computing in the Department of Urban Archaeology, in Stewart, J.D. (ed) Microcomputers in Archaeology, MDA Occasional Paper 4, 25-30, Duxford. Cambs.
GREER, A. & HANCOX, D.J. 1978 Tables, data and formulae for mathe- maticians. Thornes, Cheltenham, Glos.
HARRIS, E.C. 1979 Principles of archaeological stratigraphy. Academic Press, London.
ORTON, C.R. 1980 Mathematics in Archaeology. Collins, London.
•it IS îi> ^"jrftrîSH»« !i-»:H «•
60