Embed Size (px)
Citation preview
Cloud Eye
User Guide
Issue 12
Date 2018-01-30
HUAWEI TECHNOLOGIES CO., LTD.
Issue 12 (2018-01-30) Huawei Proprietary and Confidential
Copyright © Huawei Technologies Co., Ltd.
i
Copyright © Huawei Technologies Co., Ltd. 2018. All rights reserved.
No part of this document may be reproduced or transmitted in any form or by any means without prior
written consent of Huawei Technologies Co., Ltd.
Trademarks and Permissions
and other Huawei trademarks are trademarks of Huawei Technologies Co., Ltd.
All other trademarks and trade names mentioned in this document are the property of their respective
holders.
Notice
The purchased products, services and features are stipulated by the contract made between Huawei and
the customer. All or part of the products, services and features described in this document may not be
within the purchase scope or the usage scope. Unless otherwise specified in the contract, all statements,
information, and recommendations in this document are provided "AS IS" without warranties, guarantees or
representations of any kind, either express or implied.
The information in this document is subject to change without notice. Every effort has been made in the
preparation of this document to ensure accuracy of the contents, but all statements, information, and
recommendations in this document do not constitute a warranty of any kind, express or implied.
Huawei Technologies Co., Ltd.
Address: Huawei Industrial Base
Bantian, Longgang
Shenzhen 518129
People's Republic of China
Website: http://www.huawei.com
Email: [email protected]
Cloud Eye
User Guide Contents
Issue 12 (2018-01-30) Huawei Proprietary and Confidential
Copyright © Huawei Technologies Co., Ltd.
ii
Contents
1 Service Overview .......................................................................................................................... 1
1.1 What Is Cloud Eye? ...................................................................................................................................................... 1
1.2 Functions ...................................................................................................................................................................... 1
1.3 Advantages .................................................................................................................................................................... 2
1.4 Application Scenarios ................................................................................................................................................... 2
1.5 Supported Services ....................................................................................................................................................... 3
1.6 Cloud Eye Concepts ..................................................................................................................................................... 3
1.6.1 Metrics ....................................................................................................................................................................... 3
1.6.2 Rollup ........................................................................................................................................................................ 3
1.6.3 Monitoring Panels ...................................................................................................................................................... 4
1.6.4 Topics ......................................................................................................................................................................... 4
1.6.5 Alarm Rules ............................................................................................................................................................... 4
1.6.6 Alarm Templates ........................................................................................................................................................ 4
1.6.7 User Permissions ....................................................................................................................................................... 4
1.7 User Quota Restrictions ................................................................................................................................................ 4
2 Getting Started............................................................................................................................... 6
2.1 Querying Metrics of Cloud Services ............................................................................................................................. 6
3 Custom Monitoring ...................................................................................................................... 8
4 Using Monitoring Overview and Monitoring Panel on the Dashboard Page .................. 9
4.1 Using Monitoring Overview to Check Overall Running Status of the Cloud Platform ................................................ 9
4.2 Using Monitoring Panel to Get a Cloud Service Running Panorama ......................................................................... 10
4.2.1 Creating Monitoring Panels ..................................................................................................................................... 10
4.2.2 Adding Monitoring Items ......................................................................................................................................... 10
4.2.3 Querying Monitoring Items ..................................................................................................................................... 11
4.2.4 Modifying Monitoring Items ................................................................................................................................... 11
4.2.5 Deleting Monitoring Items ....................................................................................................................................... 12
4.2.6 Deleting Monitoring Panels ..................................................................................................................................... 12
5 Using the Alarm Function ......................................................................................................... 13
5.1 Creating Alarm Notification Topics ............................................................................................................................ 13
5.1.1 Creating a Topic ....................................................................................................................................................... 13
5.1.2 Adding Subscribers .................................................................................................................................................. 14
Cloud Eye
User Guide Contents
Issue 12 (2018-01-30) Huawei Proprietary and Confidential
Copyright © Huawei Technologies Co., Ltd.
iii
5.2 Creating Alarm Rules ................................................................................................................................................. 15
5.2.1 Using Alarm Template to Create Alarm Rules ......................................................................................................... 15
5.2.2 Creating a Custom Alarm Rule for a Specific Metric .............................................................................................. 17
6 Alarm Rule Management .......................................................................................................... 20
6.1 Modifying Alarm Rules .............................................................................................................................................. 20
6.2 Disabling Alarm Rules ................................................................................................................................................ 21
6.3 Enabling Alarm Rules ................................................................................................................................................. 22
6.4 Deleting Alarm Rules ................................................................................................................................................. 22
7 Alarm Template ........................................................................................................................... 23
7.1 Viewing Alarm Templates ........................................................................................................................................... 23
7.2 Creating Custom Alarm Templates ............................................................................................................................. 23
7.3 Modifying Custom Alarm Templates .......................................................................................................................... 25
7.4 Deleting Custom Alarm Templates ............................................................................................................................. 25
8 Services Automatically Supported by Cloud Eye ................................................................. 26
8.1 ECS Metrics ................................................................................................................................................................ 26
8.2 EVS Metrics ............................................................................................................................................................... 28
8.3 VPC Metrics ............................................................................................................................................................... 29
8.4 ELB Metrics ............................................................................................................................................................... 29
8.5 AS Metrics .................................................................................................................................................................. 30
8.6 RDS Metrics ............................................................................................................................................................... 31
8.7 Workspace Metrics...................................................................................................................................................... 34
8.8 MLS Metrics ............................................................................................................................................................... 34
8.9 SFS Metrics ................................................................................................................................................................ 35
9 FAQs .............................................................................................................................................. 36
9.1 Concepts ..................................................................................................................................................................... 36
9.1.1 What Is Cloud Eye? ................................................................................................................................................. 36
9.1.2 What Alarm Status Does Cloud Eye Support? ......................................................................................................... 36
9.1.3 What Is Rollup? ....................................................................................................................................................... 36
9.1.4 How Long Is the Metric Data Retained? ................................................................................................................. 37
9.1.5 How Many Rollup Methods Does Cloud Eye Support? .......................................................................................... 37
9.2 Usages ......................................................................................................................................................................... 38
9.2.1 What Is an Alarm Notification? How Many Types of Alarm Notifications Exist? How Can I Configure Them? ... 38
9.2.2 Why Are the Network Traffic Metrics in Cloud Eye Different from Those Detected in ECS? ............................... 38
9.2.3 What Are the Effects on ECS Metrics If vmtools Is Not Installed on ECSs? .......................................................... 38
9.2.4 How Can I Export Monitoring Data? ....................................................................................................................... 38
A Change History ........................................................................................................................... 40
Cloud Eye
User Guide 1 Service Overview
Issue 12 (2018-01-30) Huawei Proprietary and Confidential
Copyright © Huawei Technologies Co., Ltd.
1
1 Service Overview
1.1 What Is Cloud Eye?
Cloud Eye is a multi-dimensional monitoring platform. With Cloud Eye, you can understand
the resource usage and running status of services running on the cloud platform, receive alarm
notifications in a timely manner, and react to changes to keep your services running smoothly.
1.2 Functions
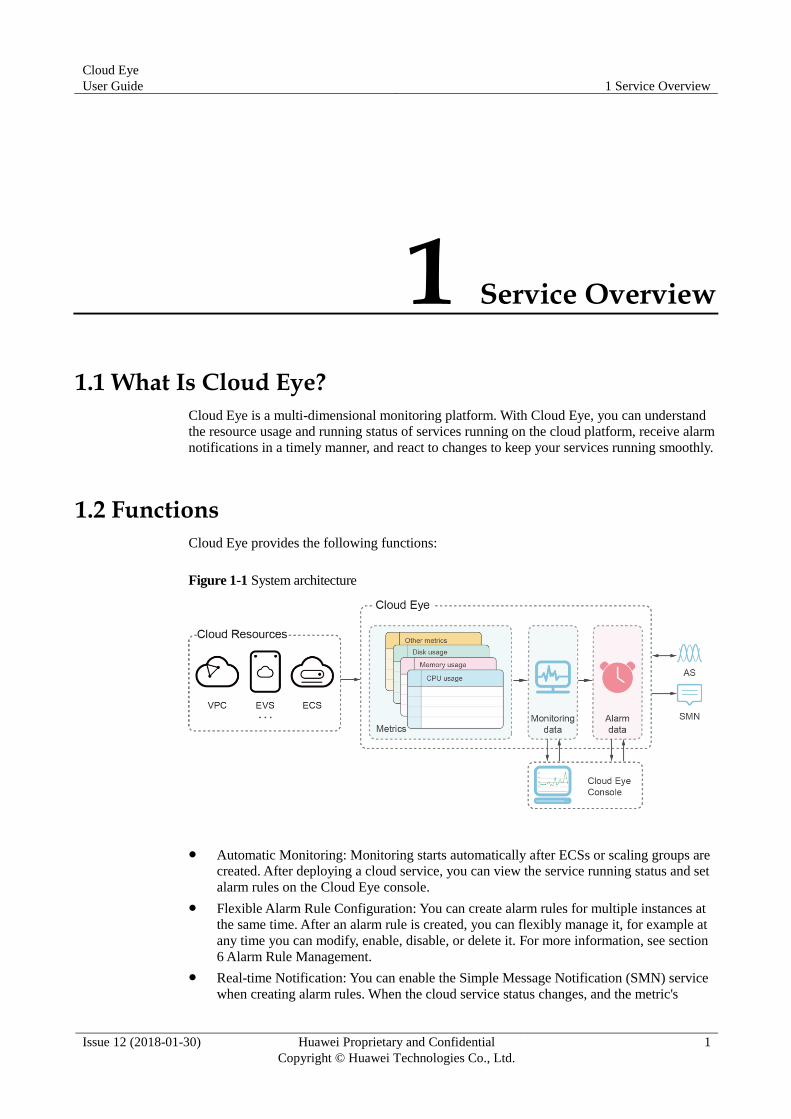
Cloud Eye provides the following functions:
Figure 1-1 System architecture
Automatic Monitoring: Monitoring starts automatically after ECSs or scaling groups are
created. After deploying a cloud service, you can view the service running status and set
alarm rules on the Cloud Eye console.
Flexible Alarm Rule Configuration: You can create alarm rules for multiple instances at
the same time. After an alarm rule is created, you can flexibly manage it, for example at
any time you can modify, enable, disable, or delete it. For more information, see section
6 Alarm Rule Management.
Real-time Notification: You can enable the Simple Message Notification (SMN) service
when creating alarm rules. When the cloud service status changes, and the metric's
Cloud Eye
User Guide 1 Service Overview
Issue 12 (2018-01-30) Huawei Proprietary and Confidential
Copyright © Huawei Technologies Co., Ltd.
2
monitoring data reaches the threshold specified in an alarm rule, Cloud Eye sends a
notification via emails, or messages to HTTP/S server addresses. In this way, you can
monitor the status of the cloud resource and any changes to it in a timely manner.
Monitoring Panel: The panel enables you to view cross-service and cross-dimensional
monitoring data. It displays key service metrics centrally, providing an overview of the
service's operating status and allowing monitoring details to be checked when
troubleshooting. For more information, see section 4.2 Using Monitoring Panel to Get a
Cloud Service Running Panorama.
1.3 Advantages
Automatic Provisioning
After registration on the cloud platform has been completed, Cloud Eye is enabled
automatically. You can view the service running status and set alarm rules on the Cloud Eye
console after deploying a cloud service.
Real-time and Reliable Monitoring
Raw sample data is reported to Cloud Eye in real time to provide real-time monitoring for
cloud services.
Alarms are generated and triggered in real time to provide you with real-time notifications.
Visualized Monitoring
Cloud Eye monitoring panels provide you with rich monitoring graphs, in which data
automatic refresh and multi-metric comparison are supported, meeting your requirement for
monitoring data virtualization.
Various Notification Types
You can enable the SMN service when creating alarm rules. When the cloud service status
changes and the metric's monitoring data reaches the threshold specified in an alarm rule,
Cloud Eye notifies you by sending emails, so that the cloud resource status can be monitored
in a timely manner. Cloud Eye can also send HTTP/HTTPS requests to server addresses,
helping you build smart programs to handle alarms.
Alarm Rule Creation in Batches
The alarm template function helps users to quickly create alarm rules for multiple cloud
services, greatly driving the working efficiency of maintenance personnel.
1.4 Application Scenarios
Web Services
Cloud Eye monitors many metrics, including CPUs, disk I/O, and network traffic, to ensure the reliability of your services.
Cloud Eye
User Guide 1 Service Overview
Issue 12 (2018-01-30) Huawei Proprietary and Confidential
Copyright © Huawei Technologies Co., Ltd.
3
Applications
You can use APIs to report custom metrics to Cloud Eye.
Optimized O&M
Leveraging flexible alarm rules and notification types of Cloud Eye, you can receive Cloud
Eye notifications for resource changes, and integrate these notification messages to the O&M
system to resolve the application availability issue and intelligently respond to resource
changes.
1.5 Supported Services
Once you start to use Cloud Eye, the system automatically identifies cloud services enabled
on the current cloud platform, captures their key metrics, and reports monitoring data of these
metrics to Cloud Eye.
At present, Cloud Eye supports key metric automatic monitoring of the following services:
8.1 ECS Metrics
8.2 EVS Metrics
8.3 VPC Metrics
8.4 ELB Metrics
8.5 AS Metrics
8.6 RDS Metrics
8.7 Workspace Metrics
8.8 MLS Metrics
8.9 SFS Metrics
1.6 Cloud Eye Concepts
1.6.1 Metrics
Metrics are the core concept in Cloud Eye. A metric refers to a quantized value of a resource
dimension on the cloud platform, such as the CPU usage and memory usage of ECS. A metric
is a time-dependent variable that generates a series of monitoring data over time. It helps you
understand the metric changes over a specified period of time.
1.6.2 Rollup
Rollup is the process in which Cloud Eye calculates the average, maximum, minimum, sum,
and variance values based on sample raw data reported by each cloud service in specific
periods.
The calculation period is called a rollup period.
Currently, Cloud Eye supports five types of rollup periods: 5 minutes, 20 minutes, 1 hour, 4
hours, and 24 hours.
Cloud Eye
User Guide 1 Service Overview
Issue 12 (2018-01-30) Huawei Proprietary and Confidential
Copyright © Huawei Technologies Co., Ltd.
4
1.6.3 Monitoring Panels
On the monitoring panel, you can view monitoring data of custom metrics of different
services and dimensions. It displays metrics of key services in a centralized way, so that you
can get an overview of the service running status and check monitoring details when
troubleshooting.
1.6.4 Topics
A topic is a specified event for message publishing or notification subscription in SMN. It
provides users with one-to-many publish subscription and message notification functions. It
also supports one-stop multiple message notification modes. With SMN, Cloud Eye uses
various methods to notify cloud service resource changes, helping you understand running
status of cloud services in a timely manner.
1.6.5 Alarm Rules
In an alarm rule, you can set the threshold for a cloud service metric. When the status (such as
Alarm, OK, Insufficient data, and Disabled) of the alarm rule changes, Cloud Eye notifies
you by sending emails, or by sending HTTP/HTTPS requests, avoiding service loss due to
resource problems.
1.6.6 Alarm Templates
The alarm template is a group of alarm rules based on services. It helps you quickly create
alarm rules for multiple cloud services. This also greatly improves the working efficiency of
the O&M personnel.
1.6.7 User Permissions
The public cloud system provides two types of default user permissions: user management
and resource management. User management refers to the management of users, user groups,
and user group rights. Resource management refers to control operations that performed on
cloud service resources.
For details about Cloud Eye user permissions, see Permissions.
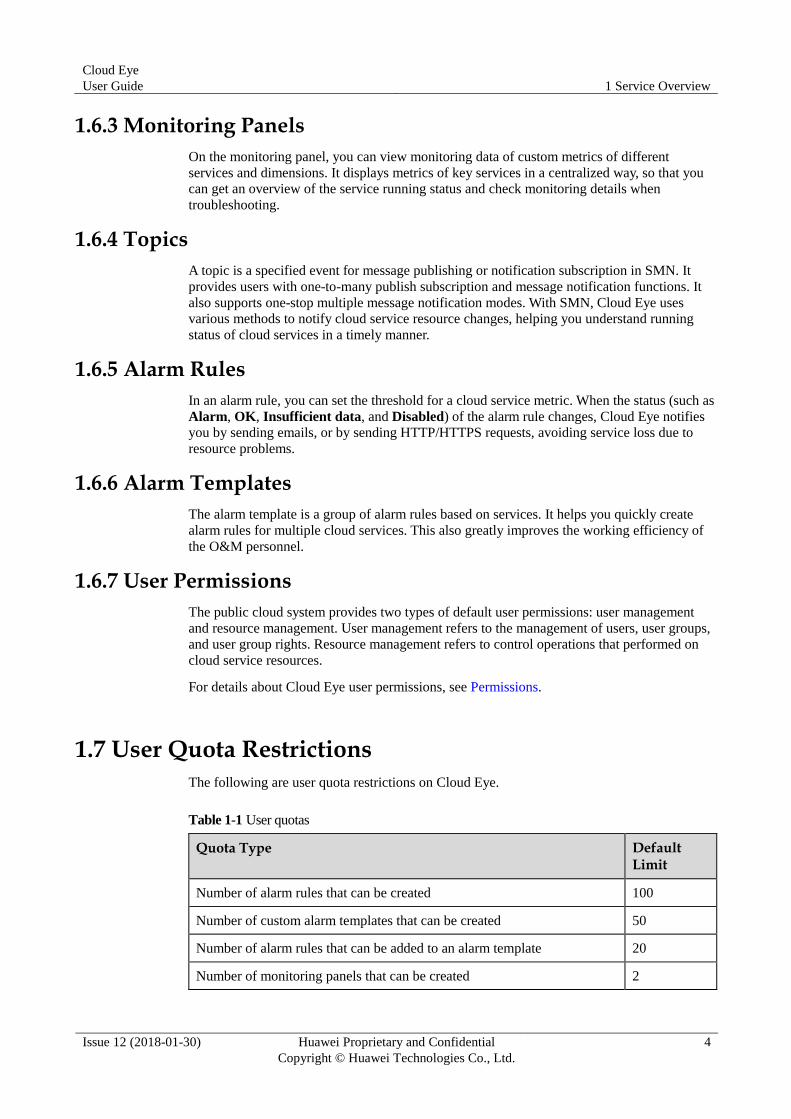
1.7 User Quota Restrictions
The following are user quota restrictions on Cloud Eye.
Table 1-1 User quotas
Quota Type Default Limit
Number of alarm rules that can be created 100
Number of custom alarm templates that can be created 50
Number of alarm rules that can be added to an alarm template 20
Number of monitoring panels that can be created 2
Cloud Eye
User Guide 1 Service Overview
Issue 12 (2018-01-30) Huawei Proprietary and Confidential
Copyright © Huawei Technologies Co., Ltd.
5
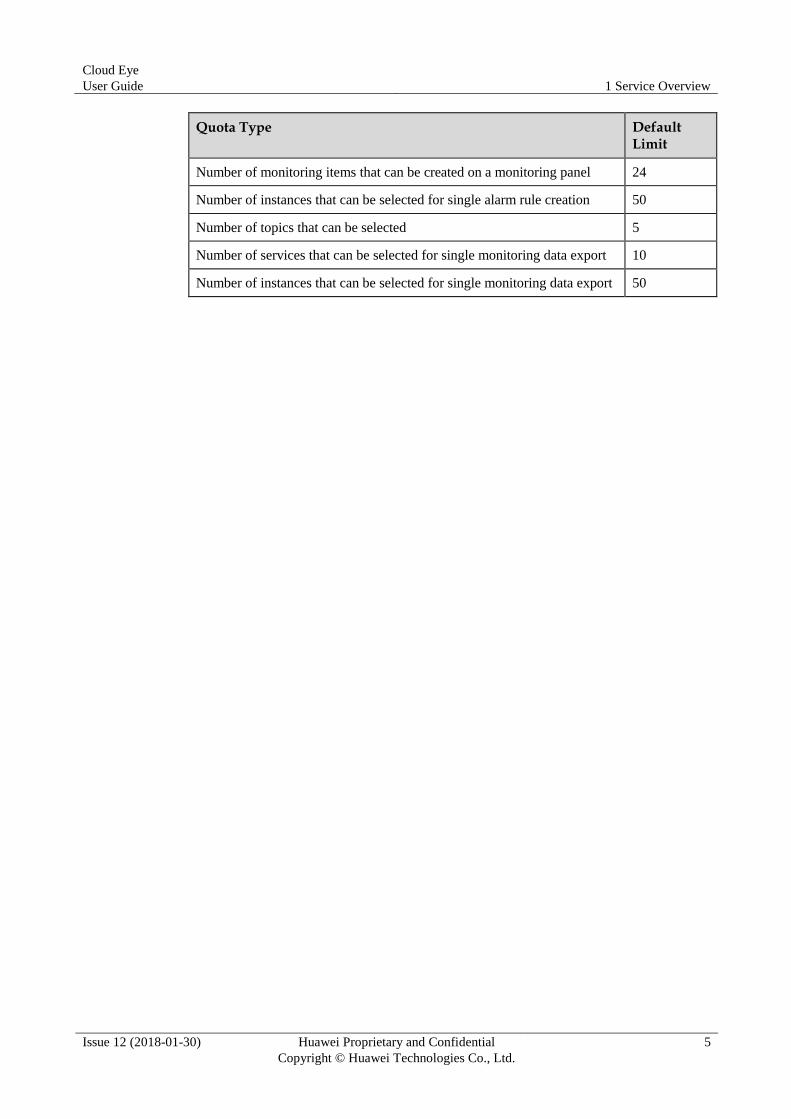
Quota Type Default Limit
Number of monitoring items that can be created on a monitoring panel 24
Number of instances that can be selected for single alarm rule creation 50
Number of topics that can be selected 5
Number of services that can be selected for single monitoring data export 10
Number of instances that can be selected for single monitoring data export 50
Cloud Eye
User Guide 2 Getting Started
Issue 12 (2018-01-30) Huawei Proprietary and Confidential
Copyright © Huawei Technologies Co., Ltd.
6
2 Getting Started
Cloud Eye monitors metrics of services running on the cloud, helping users fully understand
the resource usages on the cloud platform and take measures to deal with possible alarm
problems to avoid service losses.
2.1 Querying Metrics of Cloud Services
Based on the attribute of each service, Cloud Eye provides multiple detailed metrics. After
you enabled one cloud service on the cloud platform, the system automatically associates its
metrics based on the service type. Monitoring of these metrics helps you accurately grasp the
service running status.
This section describes how to view monitoring data of a cloud service instance.
Querying Metrics of Cloud Services
1. Log in to the management console.
2. Under Management & Deployment, click Cloud Eye.
3. In the navigation pane on the left, choose Cloud Service Monitoring. Locate the target
instance and click View Monitoring Graph in the Operation column.
On the displayed page, you can view the monitoring graph of raw data collected in Last
1 hour, Last 3 hours, and Last 12 hours. In the upper right corner of the monitoring
graph, the maximum and minimum values of the metric in the corresponding time
periods are dynamically displayed.
By default, nine monitoring graphs are displayed on one page. If the number of metrics of a service
instance is more than nine, you can click Load more to view more monitoring graphs.
Units of metrics can be changed between byte or byte/s and GB or GB/s on monitoring graphs. When
you are changing the unit, if the maximum value of a metric is smaller than 10^ (-5), both the maximum
value and the minimum value are 0. In addition, all data displayed on monitoring graphs is 0.
4. If you want to view metric details, click in the upper right corner of the monitoring
graph.
In the upper left corner, you can see six default monitoring intervals: Last 1 hour, Last
3 hours, Last 12 hours, Last 24 hours, Last 7 days, and Last 30 days. You can also
view alarm history of last six months by customizing the monitoring interval.
In the upper left of the monitoring graph, you can click Show Settings to configure the
rollup method.
Cloud Eye
User Guide 2 Getting Started
Issue 12 (2018-01-30) Huawei Proprietary and Confidential
Copyright © Huawei Technologies Co., Ltd.
7
If Last 1 hour, Last 3 hours, Last 12 hours, or Last 24 hours is selected, raw metric data is
displayed by default.
If Last 7 days, or Last 30 days is selected, aggregated metric data is displayed by default.
Cloud Eye
User Guide 3 Custom Monitoring
Issue 12 (2018-01-30) Huawei Proprietary and Confidential
Copyright © Huawei Technologies Co., Ltd.
8
3 Custom Monitoring
Custom monitoring displays all user-defined metrics. You can use simple API requests to
report collected monitoring data of those metrics to Cloud Eye for processing and display.
Viewing Custom Monitoring
1. Log in to the management console.
2. Under Management & Deployment, click Cloud Eye.
3. In the navigation pane on the left, choose Custom Monitoring.
4. On the Custom Monitoring page, you can view the data reported by the current user
through API requests, including custom services and metrics.
Only after you add monitoring data through APIs, will the Custom Monitoring page be displayed
on the Cloud Eye console.
For details about how to add monitoring data, see section "Adding Monitoring Data" in the Cloud
Eye API Reference.
5. Locate the row that contains the target cloud service instance and click View
Monitoring Graph in the Operation column.
On the displayed page, you can view the monitoring graph of raw data collected in Last
1 hour, Last 3 hours, and Last 12 hours. In the upper right corner of the monitoring
graph, the maximum and minimum values of the metric in the corresponding time
periods are dynamically displayed.
Creating Alarm Rules
1. Log in to the management console.
2. Under Management & Deployment, click Cloud Eye.
3. In the navigation pane on the left, choose Custom Monitoring.
4. On the Custom Monitoring page, locate the target cloud service instance and click
Create Alarm Rule in the Operation column.
5. On the Create Alarm Rule page, set parameters as prompted. For details, see Table 5-7
and Table 5-8.
6. Click Create.
Cloud Eye
User Guide
4 Using Monitoring Overview and Monitoring Panel on
the Dashboard Page
Issue 12 (2018-01-30) Huawei Proprietary and Confidential
Copyright © Huawei Technologies Co., Ltd.
9
4 Using Monitoring Overview and Monitoring Panel on the Dashboard Page
On the Cloud Eye Dashboard page, two functions Monitoring Overview and Monitoring
Panel are provided.
4.1 Using Monitoring Overview to Check Overall Running Status of the Cloud Platform
On the Monitoring Overview page, you can view information about Monitored Instance
Statistics, Alarm Rule Statistics, and Instances in the Alarm State to quickly understand
the overall running status of the current cloud platform.
Viewing Monitored Instance Statistics
1. Log in to the management console.
2. Under Management & Deployment, click Cloud Eye.
3. In the navigation pane on the left, choose Dashboard > Monitoring Overview, and you
can view the service instance quantity in the Monitored Instance Statistics area.
Instance Monitoring Preview (Metrics in the Alarm State)
Graphs are used to display the metric status of service instances in the Alarm status, helping
you to know the instance running status and handle exceptions in a timely way. Click the
instance name, and you can go to the Basic Info page of this alarm rule.
Alarm Rule Statistics
In the Alarm Rule Statistics area, numbers of alarm rules in the Alarm, OK, Disabled, and
Insufficient data status are displayed one by one. Click the number of one type of alarm rules,
and you can directly go to the Alarm Rule page displaying the alarm rule list of this type of
alarm rules.
Cloud Eye
User Guide
4 Using Monitoring Overview and Monitoring Panel on
the Dashboard Page
Issue 12 (2018-01-30) Huawei Proprietary and Confidential
Copyright © Huawei Technologies Co., Ltd.
10
Alarms from Last 7 Days
In the Alarms from Last 7 Days area, the number of alarms generated in last seven days is
displayed, and you can view the number and details of the alarms generated in a specific day
of last seven days.
4.2 Using Monitoring Panel to Get a Cloud Service Running Panorama
The monitoring panel allows you to customize the function of viewing monitoring data by
focusing on metrics of core services on a monitoring panel, providing you with a custom
monitoring platform. The monitoring panel also supports the comparison of different services
and dimensions within the same monitoring item, meeting your requirements to compare
performance data between different cloud services.
4.2.1 Creating Monitoring Panels
Before adding a monitoring item, you need to create a monitoring panel first. At present,
Cloud Eye supports the creation of 2 monitoring panels.
Creating Monitoring Panels
1. Log in to the management console.
2. Under Management & Deployment, click Cloud Eye.
3. In the navigation pane on the left, choose Dashboard > Monitoring Panel and click
Create Monitoring Panel.
The Create Monitoring Panel page is displayed.
4. Configure Name.
Name indicates the monitoring panel name, which can contain letters, numbers, hyphens
(-), and underscores (_), and cannot exceed 128 characters.
4.2.2 Adding Monitoring Items
After the monitoring panel is created, you can add monitoring items to monitor cloud services.
Currently, each monitoring panel supports a maximum of 24 monitoring items.
In the same monitoring item, you can add five metrics. Comparison among different services,
dimensions, and metrics is supported.
Adding Monitoring Items
1. Log in to the management console.
2. Under Management & Deployment, click Cloud Eye.
3. Choose Dashboard > Monitoring Panel, switch to the desired monitoring panel, and
click . The Add Monitoring Metric window is displayed.
4. Set parameters based on Table 4-1.
When adding the monitoring item, you must specify Service, Dimension, Monitored Instance, and
Metric one by one from left to right.
Cloud Eye
User Guide
4 Using Monitoring Overview and Monitoring Panel on
the Dashboard Page
Issue 12 (2018-01-30) Huawei Proprietary and Confidential
Copyright © Huawei Technologies Co., Ltd.
11
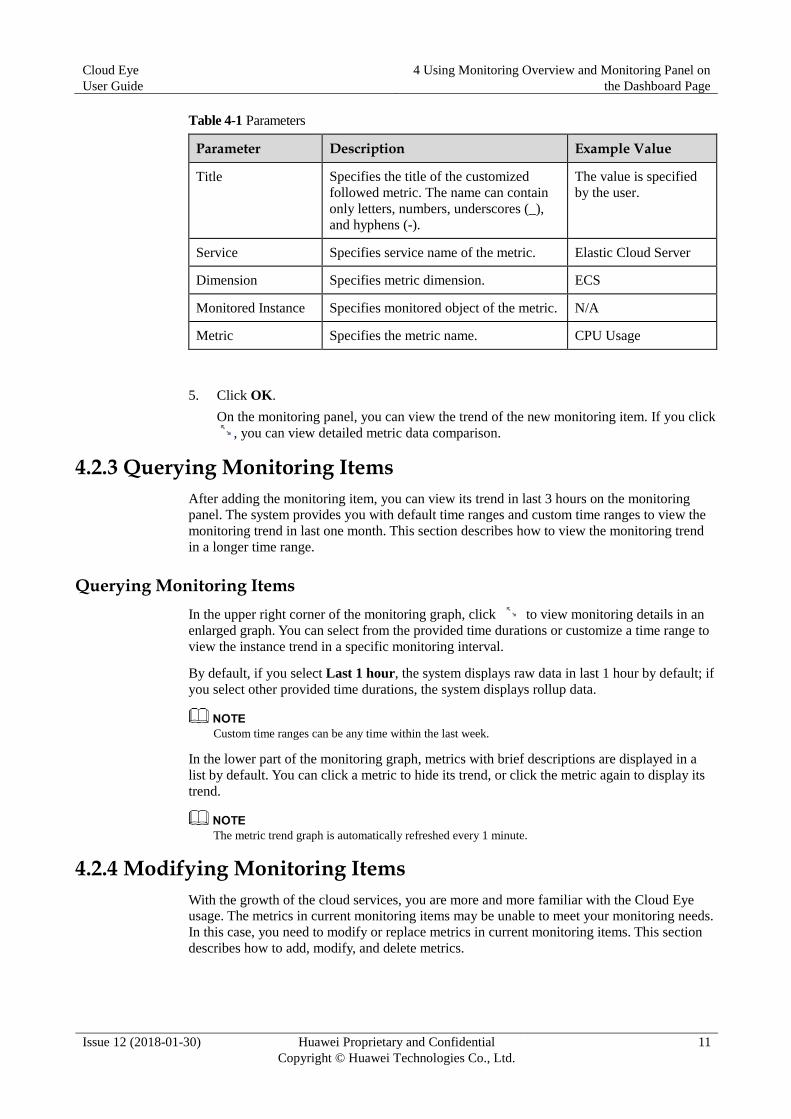
Table 4-1 Parameters
Parameter Description Example Value
Title Specifies the title of the customized
followed metric. The name can contain
only letters, numbers, underscores (_),
and hyphens (-).
The value is specified
by the user.
Service Specifies service name of the metric. Elastic Cloud Server
Dimension Specifies metric dimension. ECS
Monitored Instance Specifies monitored object of the metric. N/A
Metric Specifies the metric name. CPU Usage
5. Click OK.
On the monitoring panel, you can view the trend of the new monitoring item. If you click
, you can view detailed metric data comparison.
4.2.3 Querying Monitoring Items
After adding the monitoring item, you can view its trend in last 3 hours on the monitoring
panel. The system provides you with default time ranges and custom time ranges to view the
monitoring trend in last one month. This section describes how to view the monitoring trend
in a longer time range.
Querying Monitoring Items
In the upper right corner of the monitoring graph, click to view monitoring details in an
enlarged graph. You can select from the provided time durations or customize a time range to
view the instance trend in a specific monitoring interval.
By default, if you select Last 1 hour, the system displays raw data in last 1 hour by default; if
you select other provided time durations, the system displays rollup data.
Custom time ranges can be any time within the last week.
In the lower part of the monitoring graph, metrics with brief descriptions are displayed in a
list by default. You can click a metric to hide its trend, or click the metric again to display its
trend.
The metric trend graph is automatically refreshed every 1 minute.
4.2.4 Modifying Monitoring Items
With the growth of the cloud services, you are more and more familiar with the Cloud Eye
usage. The metrics in current monitoring items may be unable to meet your monitoring needs.
In this case, you need to modify or replace metrics in current monitoring items. This section
describes how to add, modify, and delete metrics.
Cloud Eye
User Guide
4 Using Monitoring Overview and Monitoring Panel on
the Dashboard Page
Issue 12 (2018-01-30) Huawei Proprietary and Confidential
Copyright © Huawei Technologies Co., Ltd.
12
Modifying Monitoring Items
1. Log in to the management console.
2. Under Management & Deployment, click Cloud Eye.
3. In the navigation pane on the left, choose Dashboard > Monitoring Panel, select the
target monitoring panel and the target monitoring item, and click .
On the displayed Configure Metric dialog box, you can edit the title and add new metrics.
You can also delete or modify the current metrics.
A monitoring item supports a maximum of up to 5 metrics.
4.2.5 Deleting Monitoring Items
1. Log in to the management console.
2. Under Management & Deployment, click Cloud Eye.
3. In the navigation pane on the left, choose Dashboard > Monitoring Panel. Select the
target monitoring panel and the target monitoring item, click in the upper right
corner, and click OK.
4.2.6 Deleting Monitoring Panels
When your services change or you need to re-plan monitoring items on the monitoring panel,
you can delete the monitoring panel for new monitoring plan. When you delete a monitoring
panel, all monitoring items associated with it will be deleted.
Deleting Monitoring Panels
1. Log in to the management console.
2. Under Management & Deployment, click Cloud Eye.
3. In the navigation pane on the left, choose Dashboard > Monitoring Panel. Select the
target monitoring panel, click Delete in the upper right corner, and click OK.
Cloud Eye
User Guide 5 Using the Alarm Function
Issue 12 (2018-01-30) Huawei Proprietary and Confidential
Copyright © Huawei Technologies Co., Ltd.
13
5 Using the Alarm Function
The alarm function is for the metric. You can set alarm rules for key metrics of cloud services.
When the metric monitoring data triggers the conditions set in the alarm rule, Cloud Eye
sends emails, or HTTP/HTTPS requests to you. Then you can immediately know the cloud
service exceptions and quickly handle the faults to avoid service losses due to resource
problems.
Cloud Eye uses the SMN service to notify users. And this requires you to create a topic and
add relevant subscribers for this topic on the SMN console first. Then when you create alarm
rules, you can enable the Send Notification function and select the created topic. When cloud
services are abnormal, Cloud Eye can broadcast alarm information to those subscribers in real
time.
5.1 Creating Alarm Notification Topics
Thanks to the SMN real-time notification feature, Cloud Eye is able to notify you of resource
changes by email or by sending HTTP/HTTPS requests.
Therefore, before creating an alarm rule, you need to create a topic on SMN first and add
relevant subscribers for this topic.
If you plan to use the created topic to create an alarm rule, skip this section.
5.1.1 Creating a Topic
Scenario
A topic is a specified event for message publishing or notification subscription. It serves as a
message sending channel, where publishers and subscribers can interact with each other.
Before you can send any messages using SMN, you must create a topic.
To Create a Topic
1. Log in to the management console.
2. In the Application category, click Simple Message Notification.
The SMN console is displayed.
3. In the navigation pane, choose Topic.
Cloud Eye
User Guide 5 Using the Alarm Function
Issue 12 (2018-01-30) Huawei Proprietary and Confidential
Copyright © Huawei Technologies Co., Ltd.
14
The Topic page is displayed.
4. Click Create Topic.
The Create Topic box is displayed.
5. Enter a topic name and display name (topic description).
Table 5-1 Information required for creating a topic
Parameter Description
Topic Name Specifies the topic name, which:
Contains only upper or lower case letters, digits, hyphens (-), and
underscores (_) and must start with a letter or digit.
Must be 1-256 characters long.
Must be unique and cannot be modified once the topic is created.
Display Name Topic description, which cannot exceed 192 bytes.
NOTICE
After you specify a display name, the sender in email messages will be
presented as Display name<[email protected]>. Otherwise, the
sender will be [email protected].
6. Click OK.
The topic you created is displayed in the topic list. The system generates a topic URN,
which is the unique resource identifier of the topic and cannot be changed.
5.1.2 Adding Subscribers
A topic is a channel used by SMN to send broadcasts. Therefore, after the topic is created, you
need to add related subscribers. In this way, when the metric triggers an alarm, Cloud Eye is
able to send the alarm information to subscribers of this topic.
Adding Subscribers
1. Log in to the management console.
2. In the Application category, click Simple Message Notification.
The SMN console is displayed.
3. In the navigation pane, choose Topic.
The Topic page is displayed.
4. Locate the topic to which you want to add a subscription, click More under Operation,
and select Add Subscription.
The Add Subscription box is displayed.
5. Specify the subscription protocol and endpoints.
Table 5-2 Information required for adding a subscription
Parameter Description
Topic Name Name of the topic to subscribe to, which cannot be changed
Cloud Eye
User Guide 5 Using the Alarm Function
Issue 12 (2018-01-30) Huawei Proprietary and Confidential
Copyright © Huawei Technologies Co., Ltd.
15
Parameter Description
Protocol Protocol the subscription endpoints support. The available options include
Email, HTTP, and HTTPS.
Endpoint Subscription endpoint. You can enter up to 10 email, HTTP or HTTPS
endpoints, with every two separated using a line break.
Email: Enter one or more valid email addresses.
For example:
HTTP or HTTPS: Enter one or more public network URLs.
For example:
http://example1.com/notification/action
https://example2.com/notification/action
6. Click OK.
The subscription you added is displayed in the subscription list.
5.2 Creating Alarm Rules
You can flexibly create alarm rules on the Cloud Eye console. You can create an alarm rule
for a specific metric or use the alarm template to create alarm rules in batch for multiple cloud
service instances.
Based on the attribute of each service and years of development and maintenance experience,
Cloud Eye provides you with tailor-made alarm templates for each service by default. In
addition, Cloud Eye provides you with the function of adding custom alarm templates. You
can modify the default recommended metrics, or add metrics as needed to create custom
alarm templates.
5.2.1 Using Alarm Template to Create Alarm Rules
Cloud Eye enables you to use alarm templates to create alarm rules, making it easy and
convenient to add or modify alarm rules for instances or cloud services, especially for a large
number of instances and cloud services.
This section describes how to use the default alarm template to create an alarm rule for an
instance or a cloud service.
Creating Alarm Rules
1. Log in to the management console.
2. Under Management & Deployment, click Cloud Eye.
3. Choose Alarm > Alarm Rule and click Create Alarm Rule.
4. On the Create Alarm Rule page, set parameters as prompted.
a. Select an instance and configure parameters listed in Table 5-3. Click Next.
Cloud Eye
User Guide 5 Using the Alarm Function
Issue 12 (2018-01-30) Huawei Proprietary and Confidential
Copyright © Huawei Technologies Co., Ltd.
16
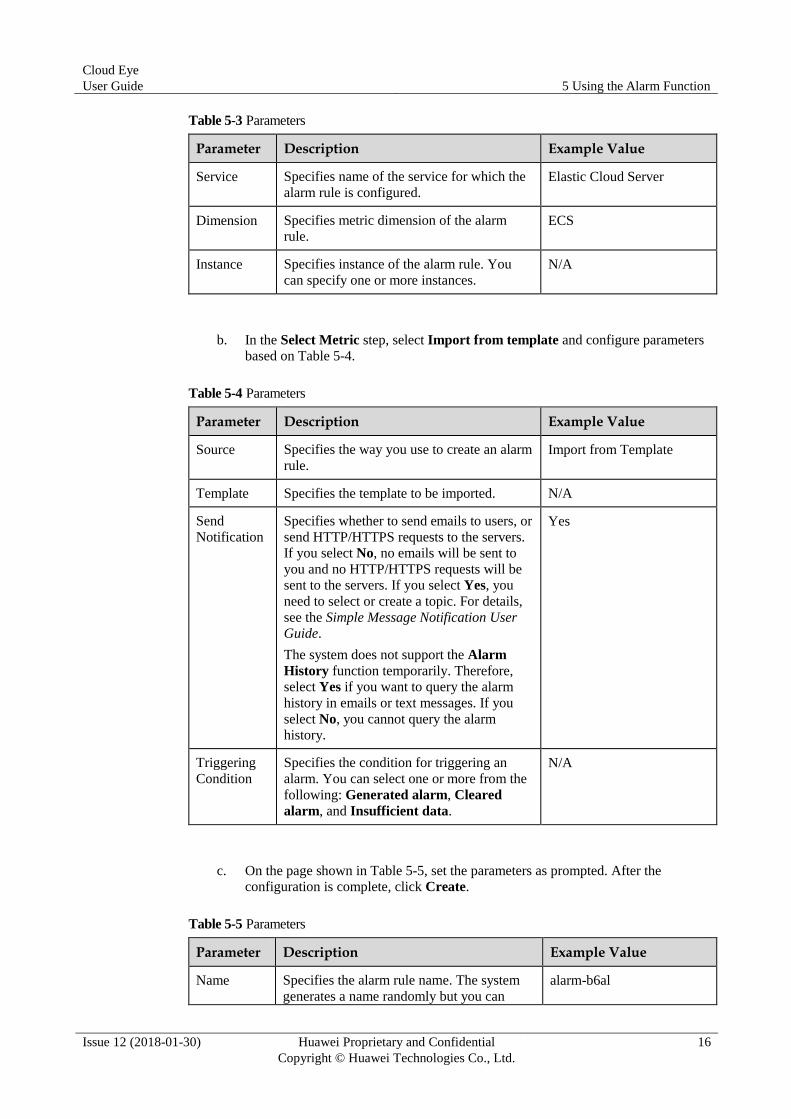
Table 5-3 Parameters
Parameter Description Example Value
Service Specifies name of the service for which the
alarm rule is configured.
Elastic Cloud Server
Dimension Specifies metric dimension of the alarm
rule. ECS
Instance Specifies instance of the alarm rule. You
can specify one or more instances.
N/A
b. In the Select Metric step, select Import from template and configure parameters
based on Table 5-4.
Table 5-4 Parameters
Parameter Description Example Value
Source Specifies the way you use to create an alarm
rule.
Import from Template
Template Specifies the template to be imported. N/A
Send
Notification
Specifies whether to send emails to users, or
send HTTP/HTTPS requests to the servers.
If you select No, no emails will be sent to
you and no HTTP/HTTPS requests will be
sent to the servers. If you select Yes, you
need to select or create a topic. For details,
see the Simple Message Notification User Guide.
The system does not support the Alarm
History function temporarily. Therefore,
select Yes if you want to query the alarm
history in emails or text messages. If you
select No, you cannot query the alarm
history.
Yes
Triggering
Condition
Specifies the condition for triggering an
alarm. You can select one or more from the
following: Generated alarm, Cleared
alarm, and Insufficient data.
N/A
c. On the page shown in Table 5-5, set the parameters as prompted. After the
configuration is complete, click Create.
Table 5-5 Parameters
Parameter Description Example Value
Name Specifies the alarm rule name. The system
generates a name randomly but you can alarm-b6al
Cloud Eye
User Guide 5 Using the Alarm Function
Issue 12 (2018-01-30) Huawei Proprietary and Confidential
Copyright © Huawei Technologies Co., Ltd.
17
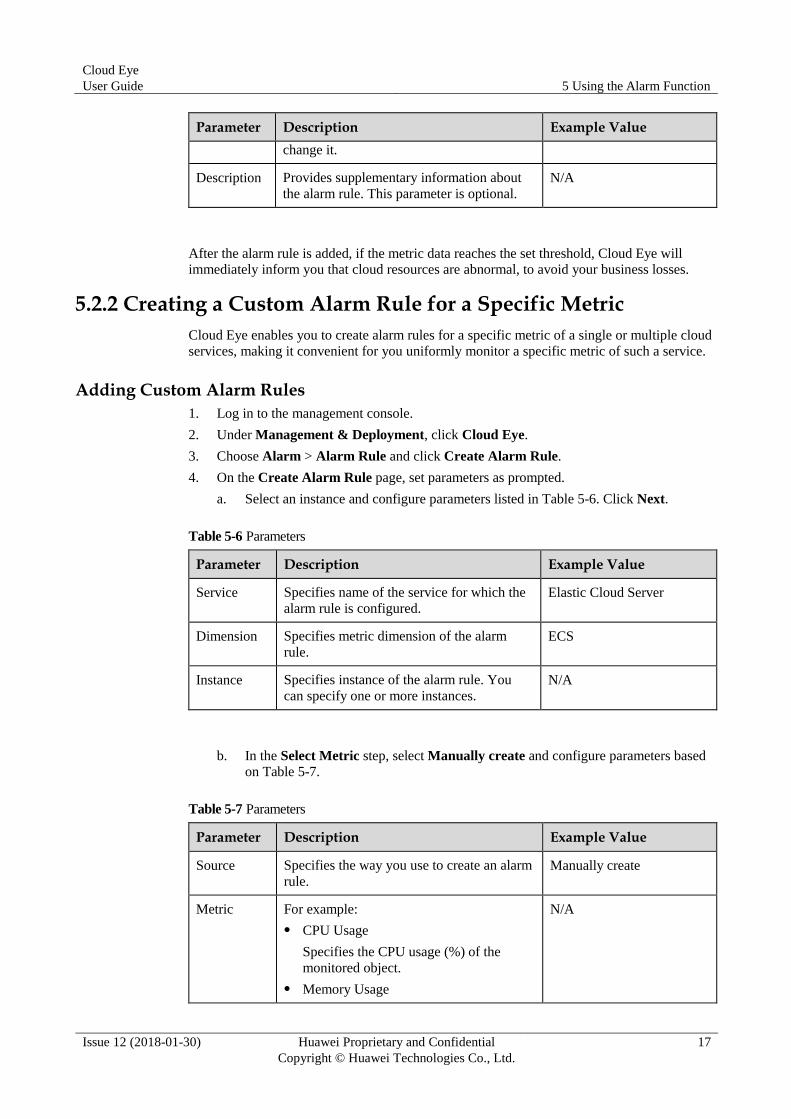
Parameter Description Example Value
change it.
Description Provides supplementary information about
the alarm rule. This parameter is optional.
N/A
After the alarm rule is added, if the metric data reaches the set threshold, Cloud Eye will
immediately inform you that cloud resources are abnormal, to avoid your business losses.
5.2.2 Creating a Custom Alarm Rule for a Specific Metric
Cloud Eye enables you to create alarm rules for a specific metric of a single or multiple cloud
services, making it convenient for you uniformly monitor a specific metric of such a service.
Adding Custom Alarm Rules
1. Log in to the management console.
2. Under Management & Deployment, click Cloud Eye.
3. Choose Alarm > Alarm Rule and click Create Alarm Rule.
4. On the Create Alarm Rule page, set parameters as prompted.
a. Select an instance and configure parameters listed in Table 5-6. Click Next.
Table 5-6 Parameters
Parameter Description Example Value
Service Specifies name of the service for which the
alarm rule is configured.
Elastic Cloud Server
Dimension Specifies metric dimension of the alarm
rule.
ECS
Instance Specifies instance of the alarm rule. You
can specify one or more instances.
N/A
b. In the Select Metric step, select Manually create and configure parameters based
on Table 5-7.
Table 5-7 Parameters
Parameter Description Example Value
Source Specifies the way you use to create an alarm
rule.
Manually create
Metric For example:
CPU Usage
Specifies the CPU usage (%) of the
monitored object.
Memory Usage
N/A
Cloud Eye
User Guide 5 Using the Alarm Function
Issue 12 (2018-01-30) Huawei Proprietary and Confidential
Copyright © Huawei Technologies Co., Ltd.
18
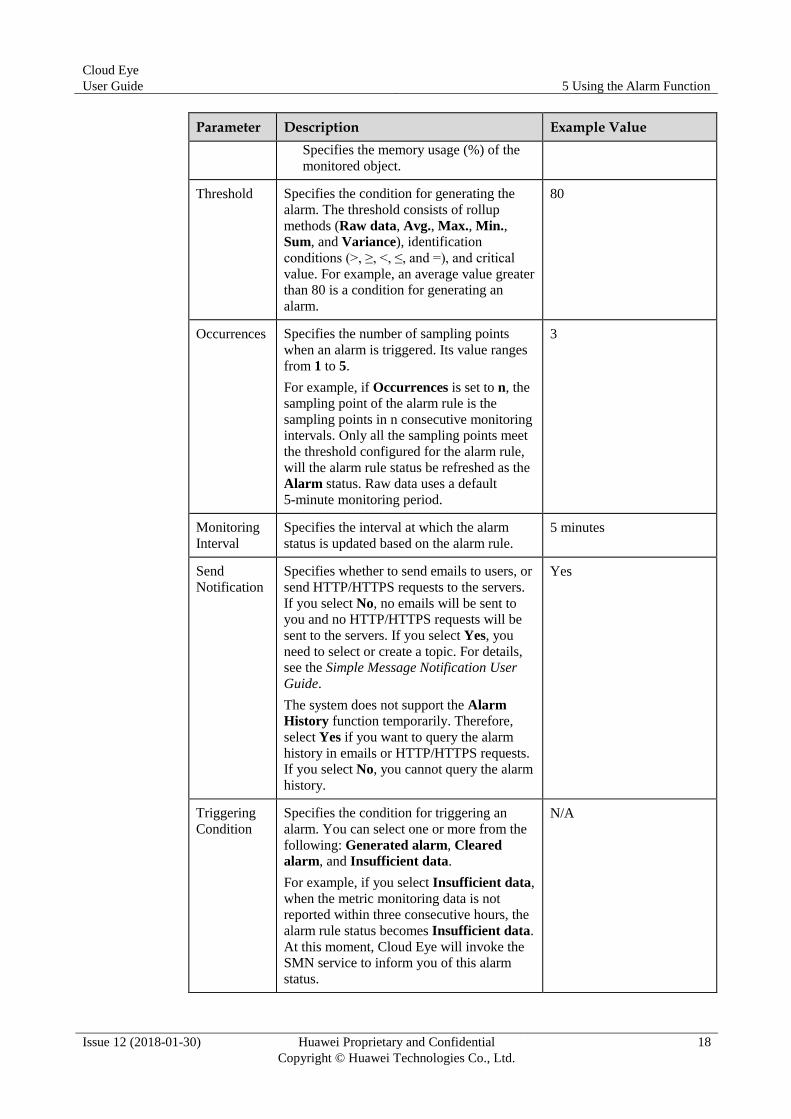
Parameter Description Example Value
Specifies the memory usage (%) of the
monitored object.
Threshold Specifies the condition for generating the
alarm. The threshold consists of rollup
methods (Raw data, Avg., Max., Min.,
Sum, and Variance), identification
conditions (>, ≥, <, ≤, and =), and critical
value. For example, an average value greater
than 80 is a condition for generating an
alarm.
80
Occurrences Specifies the number of sampling points
when an alarm is triggered. Its value ranges
from 1 to 5.
For example, if Occurrences is set to n, the
sampling point of the alarm rule is the
sampling points in n consecutive monitoring
intervals. Only all the sampling points meet
the threshold configured for the alarm rule,
will the alarm rule status be refreshed as the
Alarm status. Raw data uses a default
5-minute monitoring period.
3
Monitoring
Interval
Specifies the interval at which the alarm
status is updated based on the alarm rule.
5 minutes
Send
Notification
Specifies whether to send emails to users, or
send HTTP/HTTPS requests to the servers.
If you select No, no emails will be sent to
you and no HTTP/HTTPS requests will be
sent to the servers. If you select Yes, you
need to select or create a topic. For details,
see the Simple Message Notification User
Guide.
The system does not support the Alarm
History function temporarily. Therefore,
select Yes if you want to query the alarm
history in emails or HTTP/HTTPS requests.
If you select No, you cannot query the alarm
history.
Yes
Triggering
Condition
Specifies the condition for triggering an
alarm. You can select one or more from the
following: Generated alarm, Cleared
alarm, and Insufficient data.
For example, if you select Insufficient data,
when the metric monitoring data is not
reported within three consecutive hours, the
alarm rule status becomes Insufficient data.
At this moment, Cloud Eye will invoke the
SMN service to inform you of this alarm
status.
N/A
Cloud Eye
User Guide 5 Using the Alarm Function
Issue 12 (2018-01-30) Huawei Proprietary and Confidential
Copyright © Huawei Technologies Co., Ltd.
19
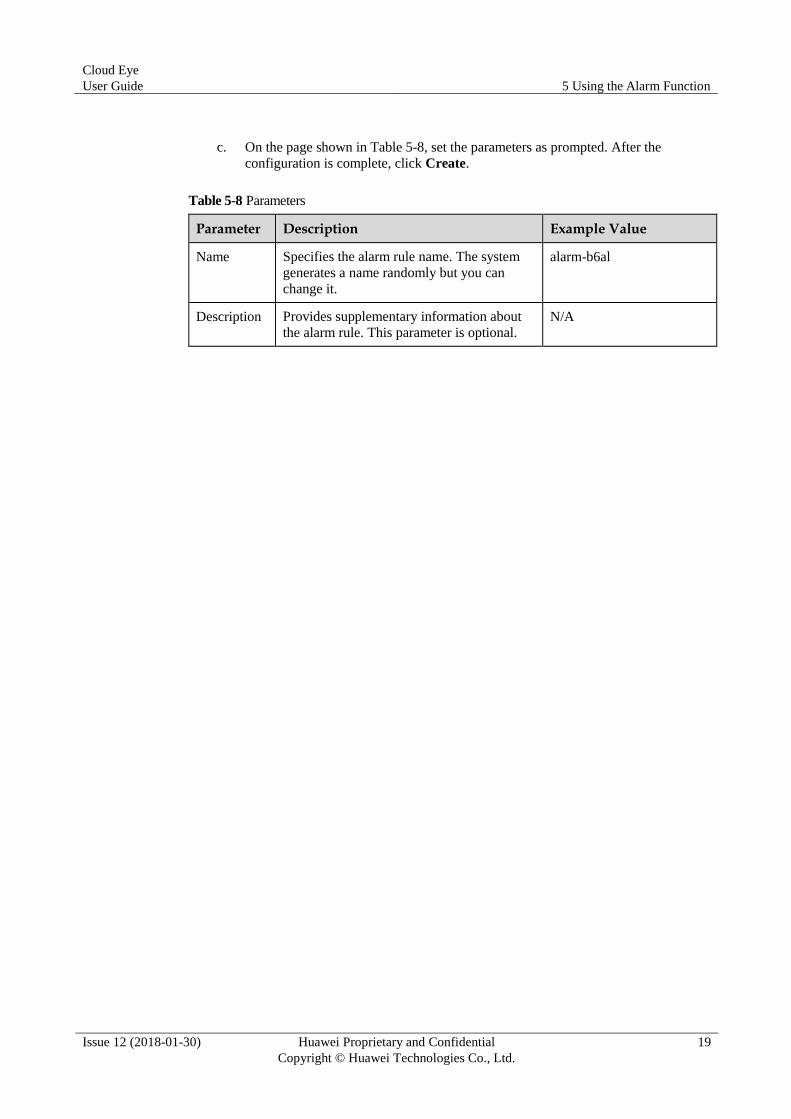
c. On the page shown in Table 5-8, set the parameters as prompted. After the
configuration is complete, click Create.
Table 5-8 Parameters
Parameter Description Example Value
Name Specifies the alarm rule name. The system
generates a name randomly but you can
change it.
alarm-b6al
Description Provides supplementary information about
the alarm rule. This parameter is optional.
N/A
Cloud Eye
User Guide 6 Alarm Rule Management
Issue 12 (2018-01-30) Huawei Proprietary and Confidential
Copyright © Huawei Technologies Co., Ltd.
20
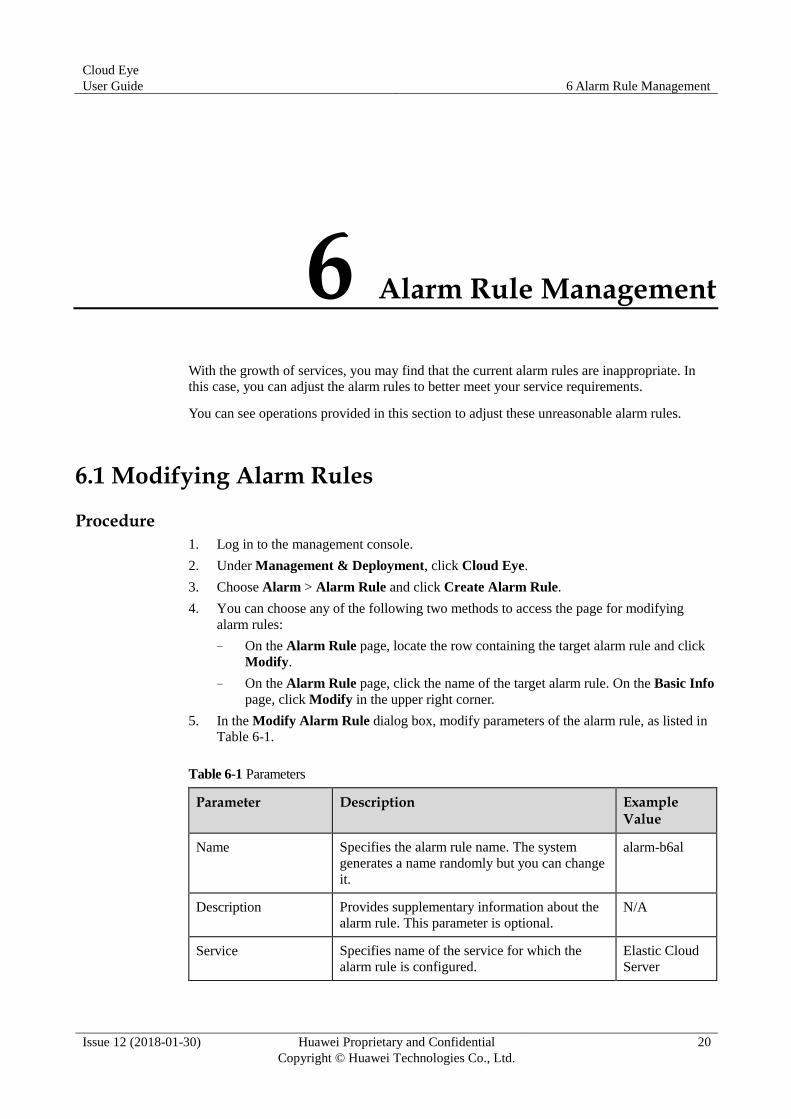
6 Alarm Rule Management
With the growth of services, you may find that the current alarm rules are inappropriate. In
this case, you can adjust the alarm rules to better meet your service requirements.
You can see operations provided in this section to adjust these unreasonable alarm rules.
6.1 Modifying Alarm Rules
Procedure
1. Log in to the management console.
2. Under Management & Deployment, click Cloud Eye.
3. Choose Alarm > Alarm Rule and click Create Alarm Rule.
4. You can choose any of the following two methods to access the page for modifying
alarm rules:
− On the Alarm Rule page, locate the row containing the target alarm rule and click
Modify.
− On the Alarm Rule page, click the name of the target alarm rule. On the Basic Info
page, click Modify in the upper right corner.
5. In the Modify Alarm Rule dialog box, modify parameters of the alarm rule, as listed in
Table 6-1.
Table 6-1 Parameters
Parameter Description Example Value
Name Specifies the alarm rule name. The system
generates a name randomly but you can change
it.
alarm-b6al
Description Provides supplementary information about the
alarm rule. This parameter is optional.
N/A
Service Specifies name of the service for which the
alarm rule is configured.
Elastic Cloud
Server
Cloud Eye
User Guide 6 Alarm Rule Management
Issue 12 (2018-01-30) Huawei Proprietary and Confidential
Copyright © Huawei Technologies Co., Ltd.
21
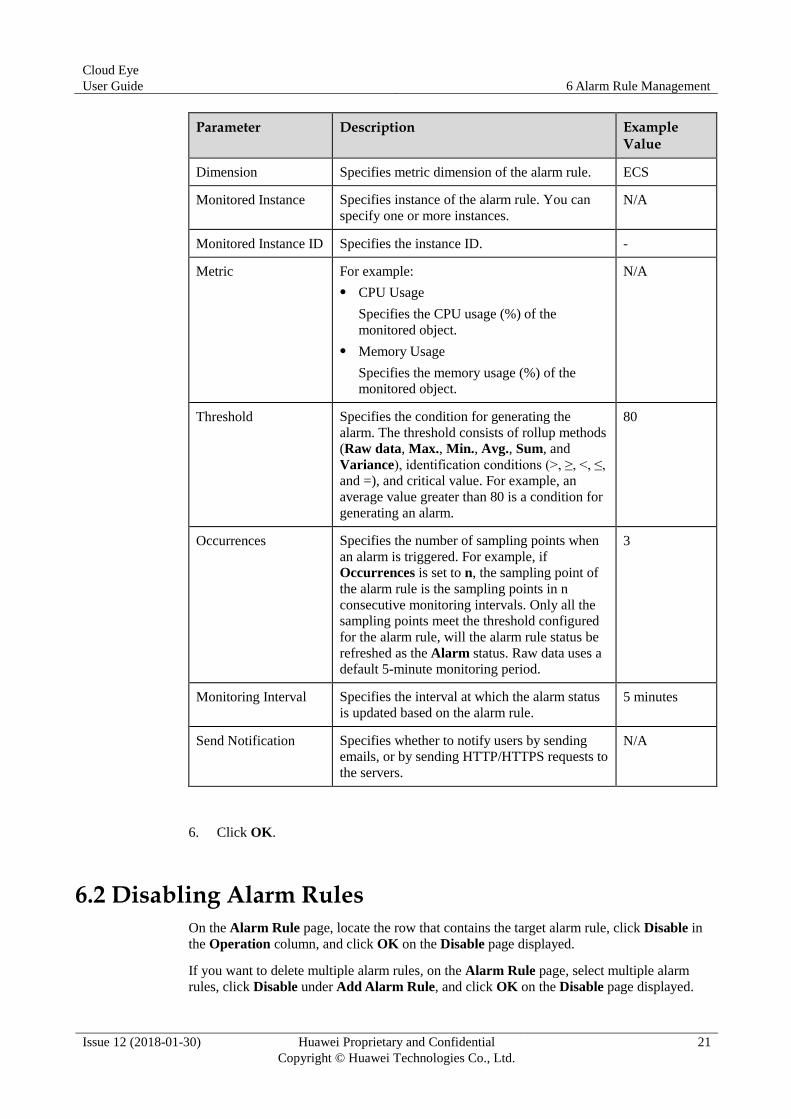
Parameter Description Example Value
Dimension Specifies metric dimension of the alarm rule. ECS
Monitored Instance Specifies instance of the alarm rule. You can
specify one or more instances.
N/A
Monitored Instance ID Specifies the instance ID. -
Metric For example:
CPU Usage
Specifies the CPU usage (%) of the
monitored object.
Memory Usage
Specifies the memory usage (%) of the
monitored object.
N/A
Threshold Specifies the condition for generating the
alarm. The threshold consists of rollup methods
(Raw data, Max., Min., Avg., Sum, and
Variance), identification conditions (>, ≥, <, ≤,
and =), and critical value. For example, an
average value greater than 80 is a condition for
generating an alarm.
80
Occurrences Specifies the number of sampling points when
an alarm is triggered. For example, if
Occurrences is set to n, the sampling point of
the alarm rule is the sampling points in n
consecutive monitoring intervals. Only all the
sampling points meet the threshold configured
for the alarm rule, will the alarm rule status be
refreshed as the Alarm status. Raw data uses a
default 5-minute monitoring period.
3
Monitoring Interval Specifies the interval at which the alarm status
is updated based on the alarm rule.
5 minutes
Send Notification Specifies whether to notify users by sending
emails, or by sending HTTP/HTTPS requests to
the servers.
N/A
6. Click OK.
6.2 Disabling Alarm Rules
On the Alarm Rule page, locate the row that contains the target alarm rule, click Disable in
the Operation column, and click OK on the Disable page displayed.
If you want to delete multiple alarm rules, on the Alarm Rule page, select multiple alarm
rules, click Disable under Add Alarm Rule, and click OK on the Disable page displayed.
Cloud Eye
User Guide 6 Alarm Rule Management
Issue 12 (2018-01-30) Huawei Proprietary and Confidential
Copyright © Huawei Technologies Co., Ltd.
22
6.3 Enabling Alarm Rules
On the Alarm Rule page, locate the row that contains the target alarm rule, click Enable in
the Operation column, and click OK on the Enable page displayed.
If you want to enable multiple alarm rules, on the Alarm Rule page, select multiple alarm
rules, click Enable under Add Alarm Rule, and click OK on the Enable page displayed.
6.4 Deleting Alarm Rules
On the Alarm Rule page, locate the row that contains the target alarm rule, click Delete in the
Operation column, and click OK on the displayed Delete page.
If you want to delete multiple alarm rules, on the Alarm Rule page, select multiple alarm
rules, click Disable under Add Alarm Rule, and click OK on the Delete page displayed.
Cloud Eye
User Guide 7 Alarm Template
Issue 12 (2018-01-30) Huawei Proprietary and Confidential
Copyright © Huawei Technologies Co., Ltd.
23
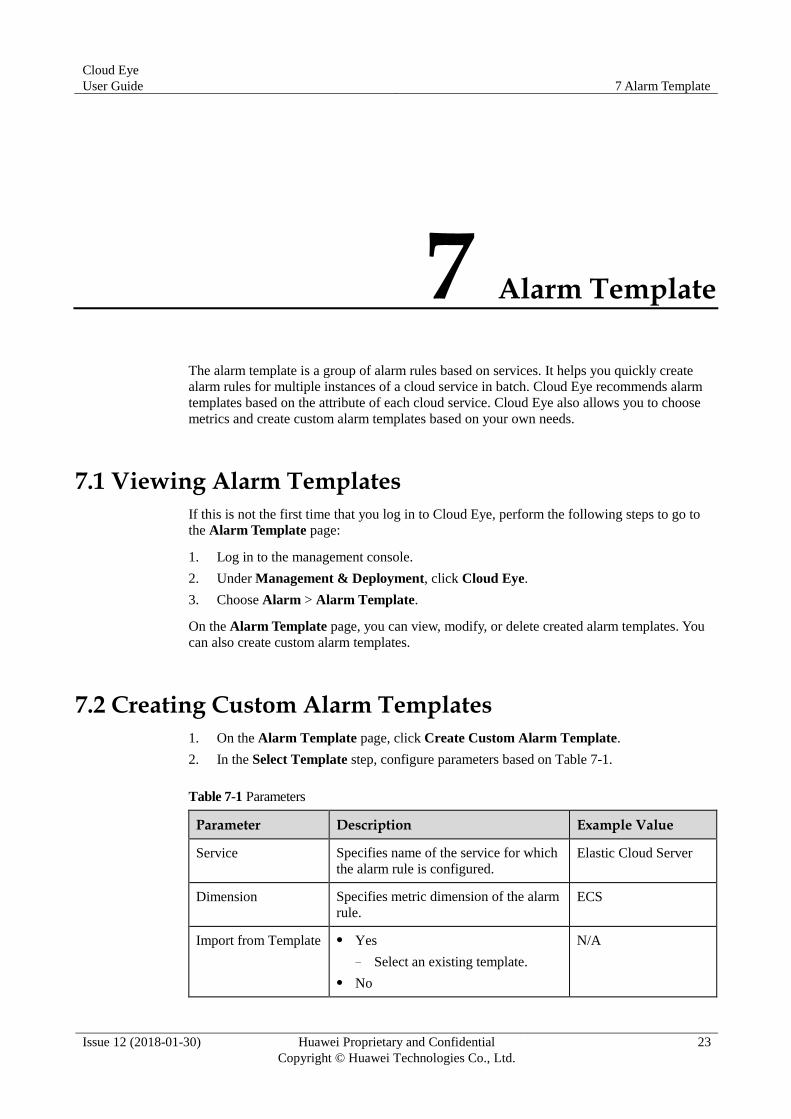
7 Alarm Template
The alarm template is a group of alarm rules based on services. It helps you quickly create
alarm rules for multiple instances of a cloud service in batch. Cloud Eye recommends alarm
templates based on the attribute of each cloud service. Cloud Eye also allows you to choose
metrics and create custom alarm templates based on your own needs.
7.1 Viewing Alarm Templates
If this is not the first time that you log in to Cloud Eye, perform the following steps to go to
the Alarm Template page:
1. Log in to the management console.
2. Under Management & Deployment, click Cloud Eye.
3. Choose Alarm > Alarm Template.
On the Alarm Template page, you can view, modify, or delete created alarm templates. You
can also create custom alarm templates.
7.2 Creating Custom Alarm Templates
1. On the Alarm Template page, click Create Custom Alarm Template.
2. In the Select Template step, configure parameters based on Table 7-1.
Table 7-1 Parameters
Parameter Description Example Value
Service Specifies name of the service for which
the alarm rule is configured.
Elastic Cloud Server
Dimension Specifies metric dimension of the alarm
rule.
ECS
Import from Template Yes
− Select an existing template.
No
N/A
Cloud Eye
User Guide 7 Alarm Template
Issue 12 (2018-01-30) Huawei Proprietary and Confidential
Copyright © Huawei Technologies Co., Ltd.
24
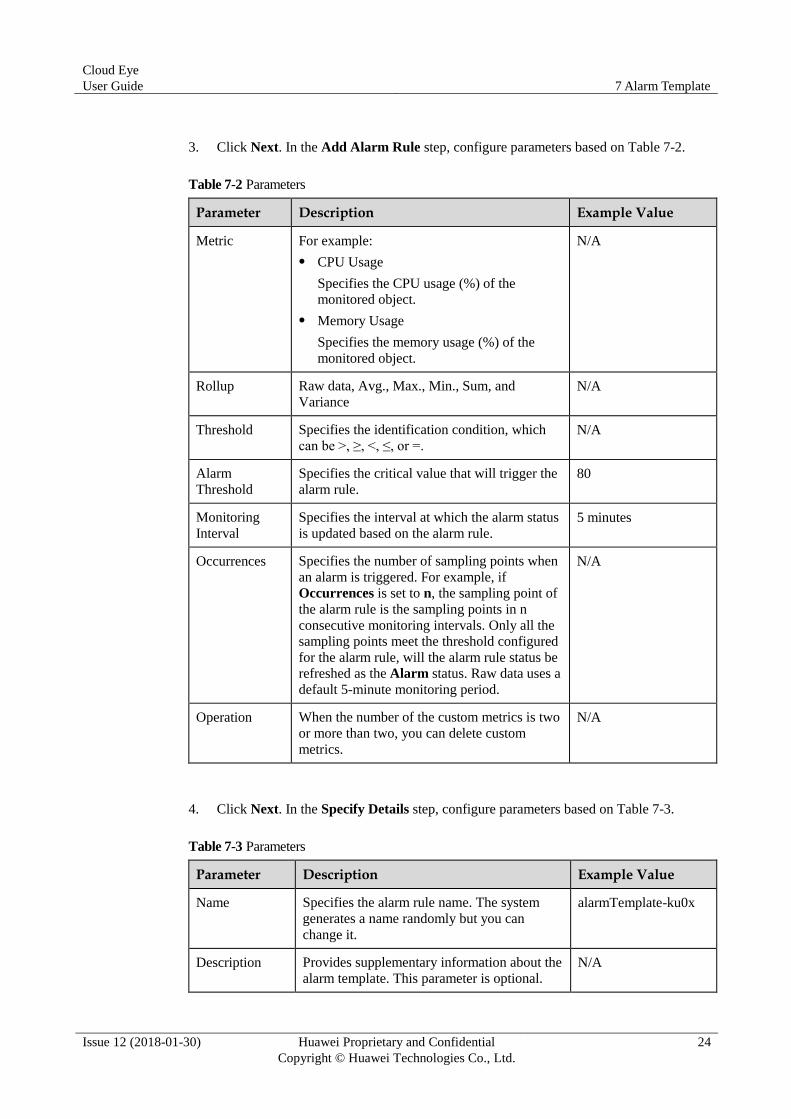
3. Click Next. In the Add Alarm Rule step, configure parameters based on Table 7-2.
Table 7-2 Parameters
Parameter Description Example Value
Metric For example:
CPU Usage
Specifies the CPU usage (%) of the
monitored object.
Memory Usage
Specifies the memory usage (%) of the
monitored object.
N/A
Rollup Raw data, Avg., Max., Min., Sum, and
Variance
N/A
Threshold Specifies the identification condition, which
can be >, ≥, <, ≤, or =.
N/A
Alarm
Threshold
Specifies the critical value that will trigger the
alarm rule.
80
Monitoring
Interval
Specifies the interval at which the alarm status
is updated based on the alarm rule.
5 minutes
Occurrences Specifies the number of sampling points when
an alarm is triggered. For example, if
Occurrences is set to n, the sampling point of
the alarm rule is the sampling points in n
consecutive monitoring intervals. Only all the
sampling points meet the threshold configured
for the alarm rule, will the alarm rule status be
refreshed as the Alarm status. Raw data uses a
default 5-minute monitoring period.
N/A
Operation When the number of the custom metrics is two
or more than two, you can delete custom
metrics.
N/A
4. Click Next. In the Specify Details step, configure parameters based on Table 7-3.
Table 7-3 Parameters
Parameter Description Example Value
Name Specifies the alarm rule name. The system
generates a name randomly but you can
change it.
alarmTemplate-ku0x
Description Provides supplementary information about the
alarm template. This parameter is optional.
N/A
Cloud Eye
User Guide 7 Alarm Template
Issue 12 (2018-01-30) Huawei Proprietary and Confidential
Copyright © Huawei Technologies Co., Ltd.
25
5. Click Create.
7.3 Modifying Custom Alarm Templates
1. In the navigation pane on the left, choose Alarm > Alarm Template and click Custom
Alarm Templates. Locate the target alarm template and click Modify in the Operation
column.
2. In the displayed Modify Custom Alarm Template dialog box, reconfigure parameters
based on Table 7-2.
3. Click Next. In the Specify Details step, configure parameters based on Table 7-3.
7.4 Deleting Custom Alarm Templates
In the navigation pane on the left, choose Alarm > Alarm Template and click Custom
Alarm Templates. Locate the target alarm template and click Delete in the Operation
column.
Cloud Eye
User Guide 8 Services Automatically Supported by Cloud Eye
Issue 12 (2018-01-30) Huawei Proprietary and Confidential
Copyright © Huawei Technologies Co., Ltd.
26
8 Services Automatically Supported by Cloud Eye
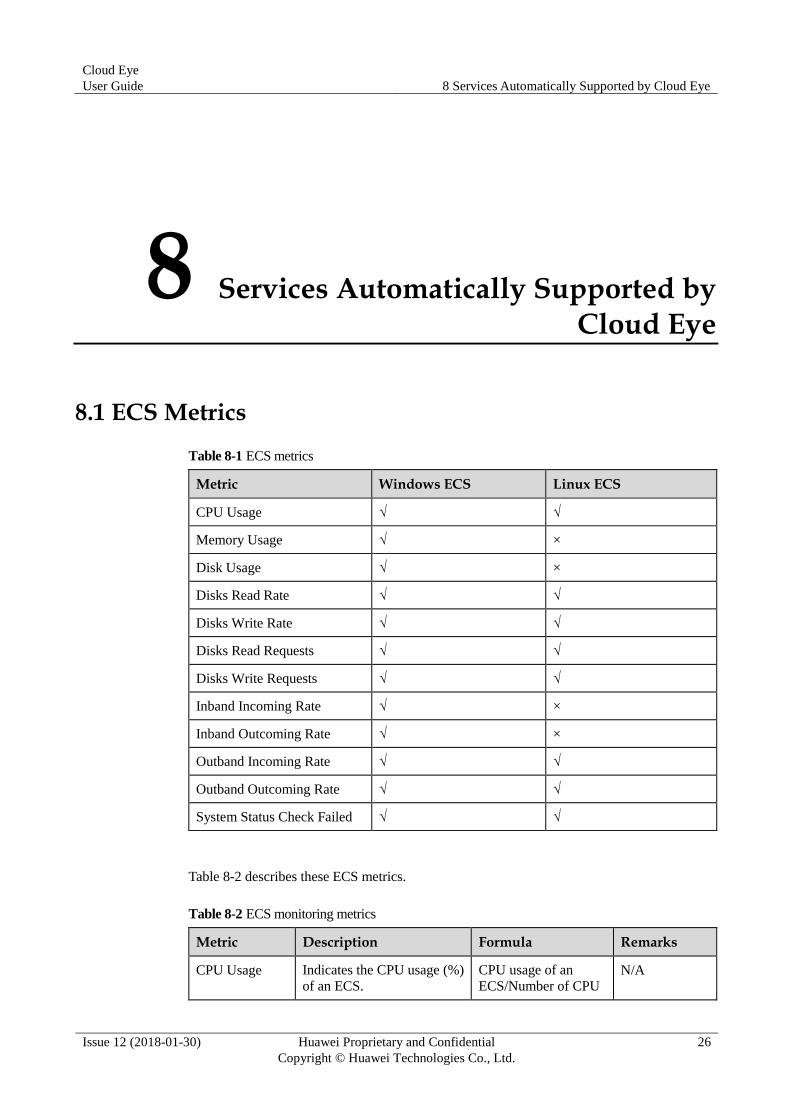
8.1 ECS Metrics
Table 8-1 ECS metrics
Metric Windows ECS Linux ECS
CPU Usage √ √
Memory Usage √ ×
Disk Usage √ ×
Disks Read Rate √ √
Disks Write Rate √ √
Disks Read Requests √ √
Disks Write Requests √ √
Inband Incoming Rate √ ×
Inband Outcoming Rate √ ×
Outband Incoming Rate √ √
Outband Outcoming Rate √ √
System Status Check Failed √ √
Table 8-2 describes these ECS metrics.
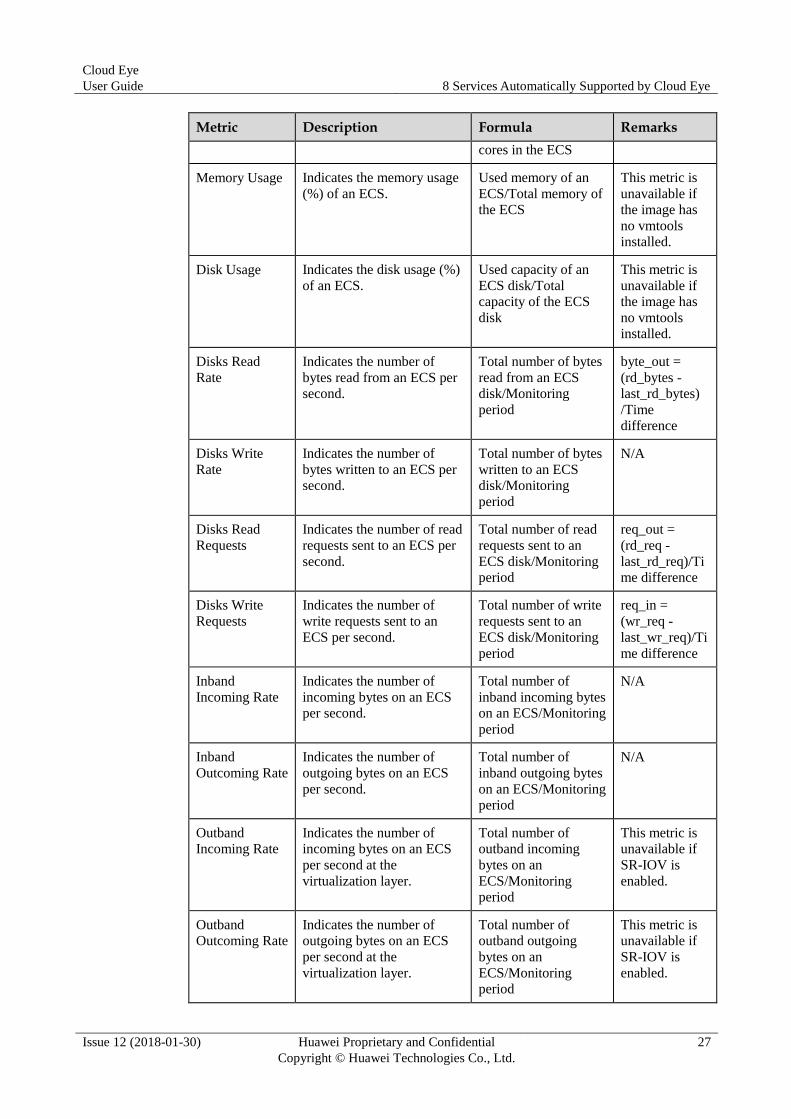
Table 8-2 ECS monitoring metrics
Metric Description Formula Remarks
CPU Usage Indicates the CPU usage (%)
of an ECS.
CPU usage of an
ECS/Number of CPU N/A
Cloud Eye
User Guide 8 Services Automatically Supported by Cloud Eye
Issue 12 (2018-01-30) Huawei Proprietary and Confidential
Copyright © Huawei Technologies Co., Ltd.
27
Metric Description Formula Remarks
cores in the ECS
Memory Usage Indicates the memory usage
(%) of an ECS.
Used memory of an
ECS/Total memory of
the ECS
This metric is
unavailable if
the image has
no vmtools
installed.
Disk Usage Indicates the disk usage (%)
of an ECS.
Used capacity of an
ECS disk/Total
capacity of the ECS
disk
This metric is
unavailable if
the image has
no vmtools
installed.
Disks Read
Rate
Indicates the number of
bytes read from an ECS per
second.
Total number of bytes
read from an ECS
disk/Monitoring
period
byte_out =
(rd_bytes -
last_rd_bytes)
/Time
difference
Disks Write
Rate
Indicates the number of
bytes written to an ECS per
second.
Total number of bytes
written to an ECS
disk/Monitoring
period
N/A
Disks Read
Requests
Indicates the number of read
requests sent to an ECS per
second.
Total number of read
requests sent to an
ECS disk/Monitoring
period
req_out =
(rd_req -
last_rd_req)/Ti
me difference
Disks Write
Requests
Indicates the number of
write requests sent to an
ECS per second.
Total number of write
requests sent to an
ECS disk/Monitoring
period
req_in =
(wr_req -
last_wr_req)/Ti
me difference
Inband
Incoming Rate
Indicates the number of
incoming bytes on an ECS
per second.
Total number of
inband incoming bytes
on an ECS/Monitoring
period
N/A
Inband
Outcoming Rate
Indicates the number of
outgoing bytes on an ECS
per second.
Total number of
inband outgoing bytes
on an ECS/Monitoring
period
N/A
Outband
Incoming Rate
Indicates the number of
incoming bytes on an ECS
per second at the
virtualization layer.
Total number of
outband incoming
bytes on an
ECS/Monitoring
period
This metric is
unavailable if
SR-IOV is
enabled.
Outband
Outcoming Rate
Indicates the number of
outgoing bytes on an ECS
per second at the
virtualization layer.
Total number of
outband outgoing
bytes on an
ECS/Monitoring period
This metric is
unavailable if
SR-IOV is
enabled.
Cloud Eye
User Guide 8 Services Automatically Supported by Cloud Eye
Issue 12 (2018-01-30) Huawei Proprietary and Confidential
Copyright © Huawei Technologies Co., Ltd.
28
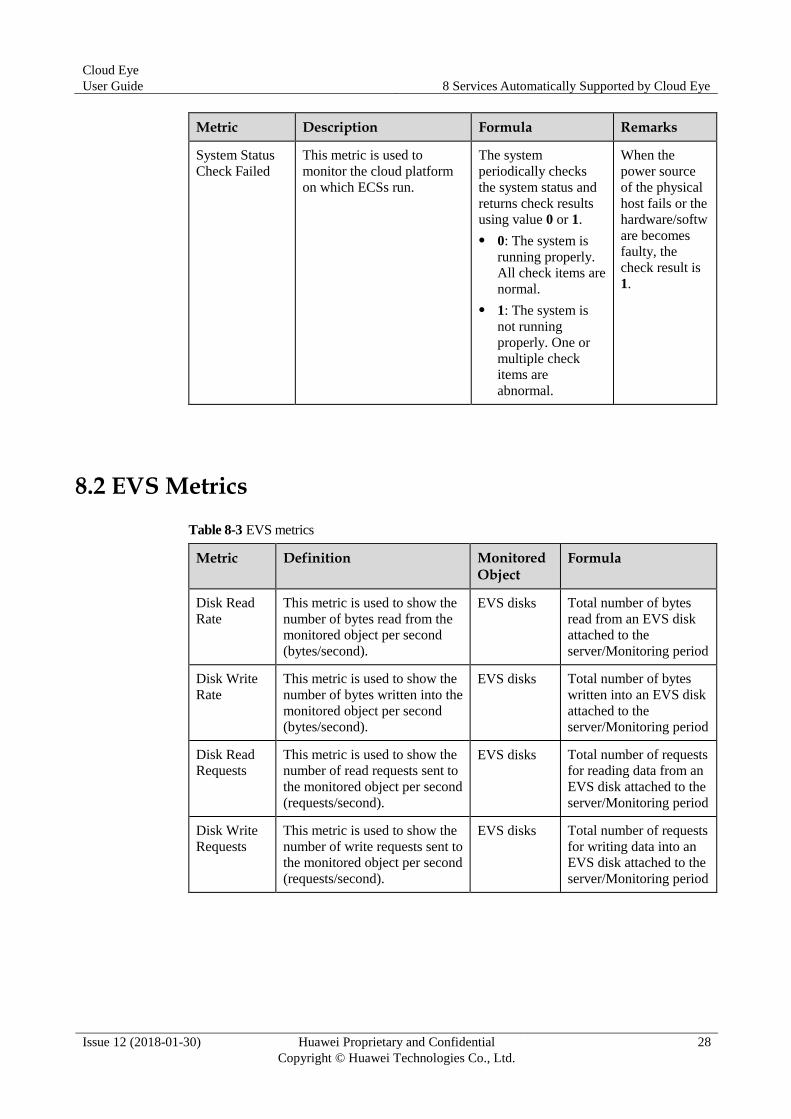
Metric Description Formula Remarks
System Status
Check Failed
This metric is used to
monitor the cloud platform
on which ECSs run.
The system
periodically checks
the system status and
returns check results
using value 0 or 1.
0: The system is
running properly.
All check items are
normal.
1: The system is
not running
properly. One or
multiple check
items are
abnormal.
When the
power source
of the physical
host fails or the
hardware/softw
are becomes
faulty, the
check result is
1.
8.2 EVS Metrics
Table 8-3 EVS metrics
Metric Definition Monitored Object
Formula
Disk Read
Rate
This metric is used to show the
number of bytes read from the
monitored object per second
(bytes/second).
EVS disks Total number of bytes
read from an EVS disk
attached to the
server/Monitoring period
Disk Write
Rate
This metric is used to show the
number of bytes written into the
monitored object per second
(bytes/second).
EVS disks Total number of bytes
written into an EVS disk
attached to the
server/Monitoring period
Disk Read
Requests
This metric is used to show the
number of read requests sent to
the monitored object per second
(requests/second).
EVS disks Total number of requests
for reading data from an
EVS disk attached to the
server/Monitoring period
Disk Write
Requests
This metric is used to show the
number of write requests sent to
the monitored object per second
(requests/second).
EVS disks Total number of requests
for writing data into an
EVS disk attached to the
server/Monitoring period
Cloud Eye
User Guide 8 Services Automatically Supported by Cloud Eye
Issue 12 (2018-01-30) Huawei Proprietary and Confidential
Copyright © Huawei Technologies Co., Ltd.
29
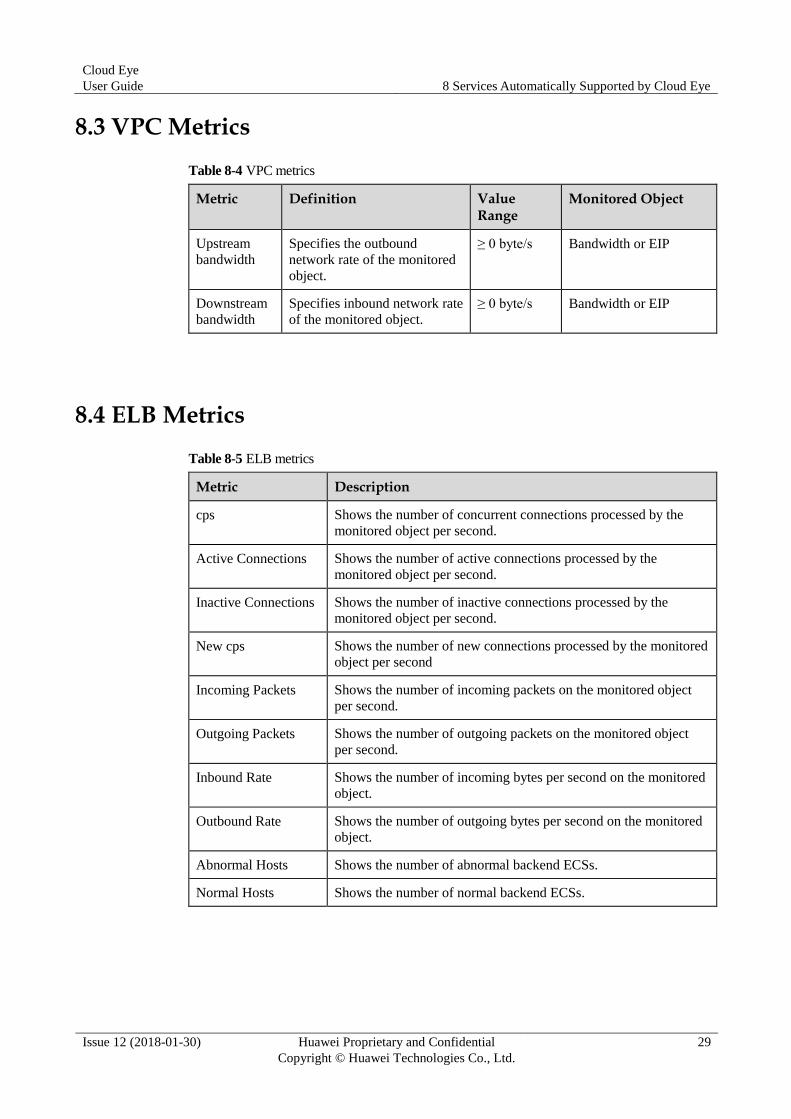
8.3 VPC Metrics
Table 8-4 VPC metrics
Metric Definition Value Range
Monitored Object
Upstream
bandwidth
Specifies the outbound
network rate of the monitored
object.
≥ 0 byte/s Bandwidth or EIP
Downstream
bandwidth
Specifies inbound network rate
of the monitored object.
≥ 0 byte/s Bandwidth or EIP
8.4 ELB Metrics
Table 8-5 ELB metrics
Metric Description
cps Shows the number of concurrent connections processed by the
monitored object per second.
Active Connections Shows the number of active connections processed by the
monitored object per second.
Inactive Connections Shows the number of inactive connections processed by the
monitored object per second.
New cps Shows the number of new connections processed by the monitored
object per second
Incoming Packets Shows the number of incoming packets on the monitored object
per second.
Outgoing Packets Shows the number of outgoing packets on the monitored object
per second.
Inbound Rate Shows the number of incoming bytes per second on the monitored
object.
Outbound Rate Shows the number of outgoing bytes per second on the monitored
object.
Abnormal Hosts Shows the number of abnormal backend ECSs.
Normal Hosts Shows the number of normal backend ECSs.
Cloud Eye
User Guide 8 Services Automatically Supported by Cloud Eye
Issue 12 (2018-01-30) Huawei Proprietary and Confidential
Copyright © Huawei Technologies Co., Ltd.
30
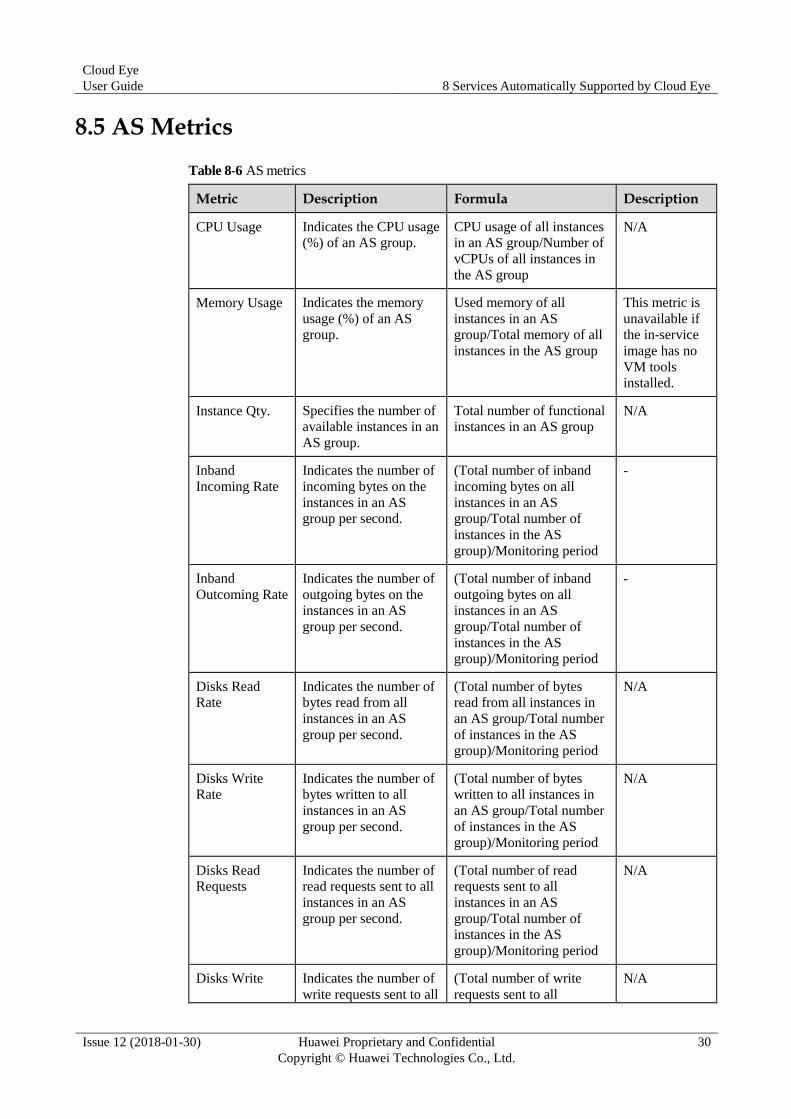
8.5 AS Metrics
Table 8-6 AS metrics
Metric Description Formula Description
CPU Usage Indicates the CPU usage
(%) of an AS group.
CPU usage of all instances
in an AS group/Number of
vCPUs of all instances in
the AS group
N/A
Memory Usage Indicates the memory
usage (%) of an AS
group.
Used memory of all
instances in an AS
group/Total memory of all
instances in the AS group
This metric is
unavailable if
the in-service
image has no
VM tools
installed.
Instance Qty. Specifies the number of
available instances in an
AS group.
Total number of functional
instances in an AS group N/A
Inband
Incoming Rate
Indicates the number of
incoming bytes on the
instances in an AS
group per second.
(Total number of inband
incoming bytes on all
instances in an AS
group/Total number of
instances in the AS
group)/Monitoring period
-
Inband
Outcoming Rate
Indicates the number of
outgoing bytes on the
instances in an AS
group per second.
(Total number of inband
outgoing bytes on all
instances in an AS
group/Total number of
instances in the AS
group)/Monitoring period
-
Disks Read
Rate
Indicates the number of
bytes read from all
instances in an AS
group per second.
(Total number of bytes
read from all instances in
an AS group/Total number
of instances in the AS
group)/Monitoring period
N/A
Disks Write
Rate
Indicates the number of
bytes written to all
instances in an AS
group per second.
(Total number of bytes
written to all instances in
an AS group/Total number
of instances in the AS
group)/Monitoring period
N/A
Disks Read
Requests
Indicates the number of
read requests sent to all
instances in an AS
group per second.
(Total number of read
requests sent to all
instances in an AS
group/Total number of
instances in the AS
group)/Monitoring period
N/A
Disks Write Indicates the number of
write requests sent to all
(Total number of write
requests sent to all N/A
Cloud Eye
User Guide 8 Services Automatically Supported by Cloud Eye
Issue 12 (2018-01-30) Huawei Proprietary and Confidential
Copyright © Huawei Technologies Co., Ltd.
31
Metric Description Formula Description
Requests instances in an AS
group per second.
instances in an AS
group/Total number of
instances in the AS
group)/Monitoring period
For details about whether your OS supports the Memory Usage, Inband Outgoing Rate, and Inband
Incoming Rate metrics, see the Elastic Cloud Server User Guide.
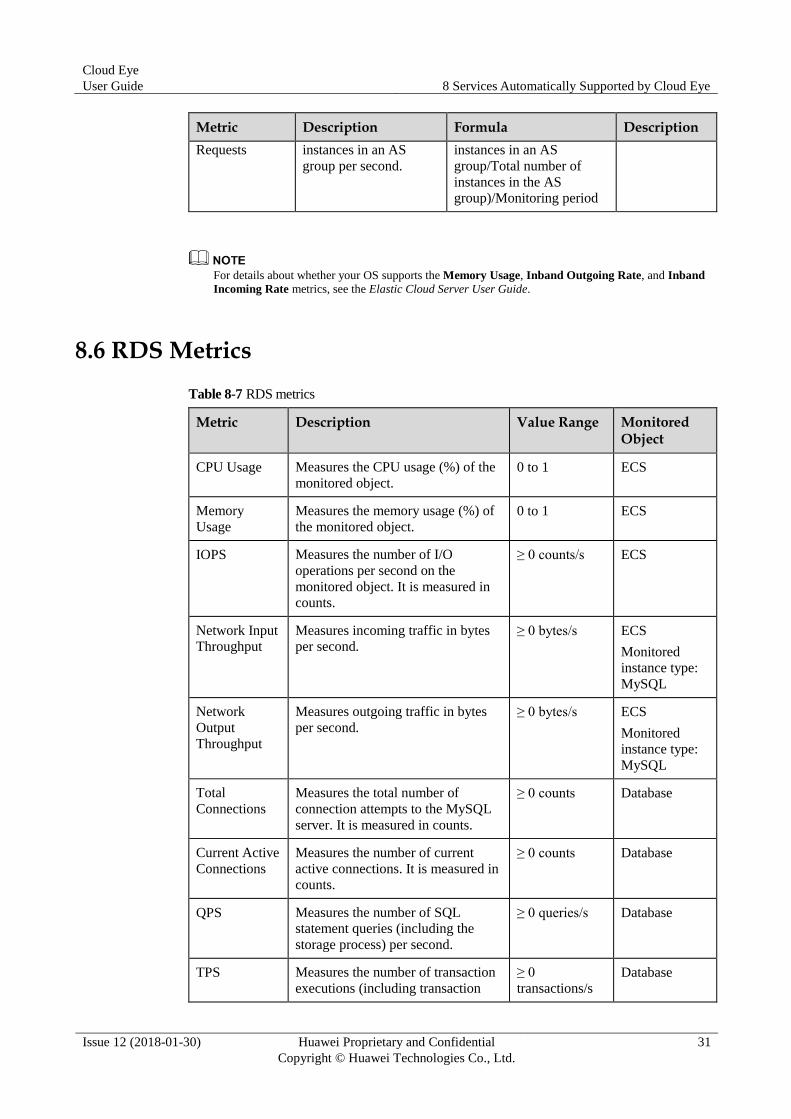
8.6 RDS Metrics
Table 8-7 RDS metrics
Metric Description Value Range Monitored Object
CPU Usage Measures the CPU usage (%) of the
monitored object.
0 to 1 ECS
Memory
Usage
Measures the memory usage (%) of
the monitored object.
0 to 1 ECS
IOPS Measures the number of I/O
operations per second on the
monitored object. It is measured in
counts.
≥ 0 counts/s ECS
Network Input
Throughput
Measures incoming traffic in bytes
per second. ≥ 0 bytes/s ECS
Monitored
instance type:
MySQL
Network
Output
Throughput
Measures outgoing traffic in bytes
per second.
≥ 0 bytes/s ECS
Monitored
instance type:
MySQL
Total
Connections
Measures the total number of
connection attempts to the MySQL
server. It is measured in counts.
≥ 0 counts Database
Current Active
Connections
Measures the number of current
active connections. It is measured in
counts.
≥ 0 counts Database
QPS Measures the number of SQL
statement queries (including the
storage process) per second.
≥ 0 queries/s Database
TPS Measures the number of transaction
executions (including transaction
≥ 0
transactions/s Database
Cloud Eye
User Guide 8 Services Automatically Supported by Cloud Eye
Issue 12 (2018-01-30) Huawei Proprietary and Confidential
Copyright © Huawei Technologies Co., Ltd.
32
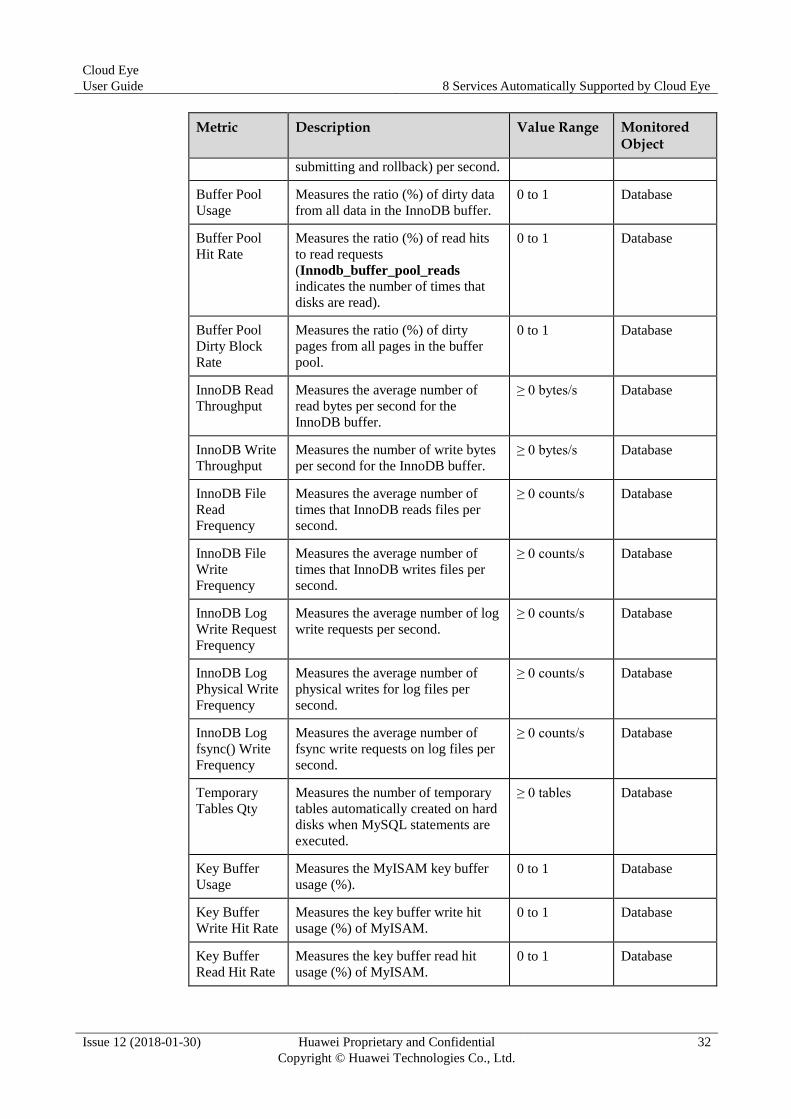
Metric Description Value Range Monitored Object
submitting and rollback) per second.
Buffer Pool
Usage
Measures the ratio (%) of dirty data
from all data in the InnoDB buffer.
0 to 1 Database
Buffer Pool
Hit Rate
Measures the ratio (%) of read hits
to read requests
(Innodb_buffer_pool_reads
indicates the number of times that
disks are read).
0 to 1 Database
Buffer Pool
Dirty Block
Rate
Measures the ratio (%) of dirty
pages from all pages in the buffer
pool.
0 to 1 Database
InnoDB Read
Throughput
Measures the average number of
read bytes per second for the
InnoDB buffer.
≥ 0 bytes/s Database
InnoDB Write
Throughput
Measures the number of write bytes
per second for the InnoDB buffer.
≥ 0 bytes/s Database
InnoDB File
Read
Frequency
Measures the average number of
times that InnoDB reads files per
second.
≥ 0 counts/s Database
InnoDB File
Write
Frequency
Measures the average number of
times that InnoDB writes files per
second.
≥ 0 counts/s Database
InnoDB Log
Write Request
Frequency
Measures the average number of log
write requests per second.
≥ 0 counts/s Database
InnoDB Log
Physical Write
Frequency
Measures the average number of
physical writes for log files per
second.
≥ 0 counts/s Database
InnoDB Log
fsync() Write
Frequency
Measures the average number of
fsync write requests on log files per
second.
≥ 0 counts/s Database
Temporary
Tables Qty
Measures the number of temporary
tables automatically created on hard
disks when MySQL statements are
executed.
≥ 0 tables Database
Key Buffer
Usage
Measures the MyISAM key buffer
usage (%).
0 to 1 Database
Key Buffer
Write Hit Rate
Measures the key buffer write hit
usage (%) of MyISAM.
0 to 1 Database
Key Buffer
Read Hit Rate
Measures the key buffer read hit
usage (%) of MyISAM.
0 to 1 Database
Cloud Eye
User Guide 8 Services Automatically Supported by Cloud Eye
Issue 12 (2018-01-30) Huawei Proprietary and Confidential
Copyright © Huawei Technologies Co., Ltd.
33
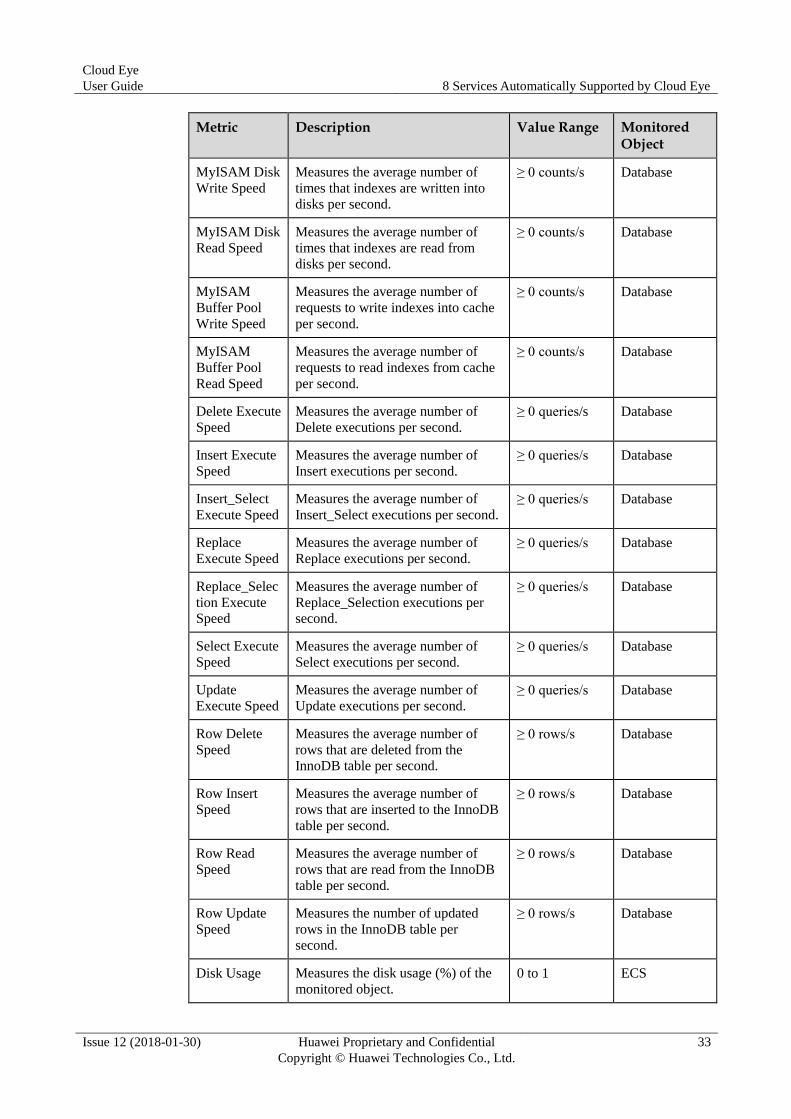
Metric Description Value Range Monitored Object
MyISAM Disk
Write Speed
Measures the average number of
times that indexes are written into
disks per second.
≥ 0 counts/s Database
MyISAM Disk
Read Speed
Measures the average number of
times that indexes are read from
disks per second.
≥ 0 counts/s Database
MyISAM
Buffer Pool
Write Speed
Measures the average number of
requests to write indexes into cache
per second.
≥ 0 counts/s Database
MyISAM
Buffer Pool
Read Speed
Measures the average number of
requests to read indexes from cache
per second.
≥ 0 counts/s Database
Delete Execute
Speed
Measures the average number of
Delete executions per second.
≥ 0 queries/s Database
Insert Execute
Speed
Measures the average number of
Insert executions per second.
≥ 0 queries/s Database
Insert_Select
Execute Speed
Measures the average number of
Insert_Select executions per second.
≥ 0 queries/s Database
Replace
Execute Speed
Measures the average number of
Replace executions per second.
≥ 0 queries/s Database
Replace_Selec
tion Execute
Speed
Measures the average number of
Replace_Selection executions per
second.
≥ 0 queries/s Database
Select Execute
Speed
Measures the average number of
Select executions per second.
≥ 0 queries/s Database
Update
Execute Speed
Measures the average number of
Update executions per second.
≥ 0 queries/s Database
Row Delete
Speed
Measures the average number of
rows that are deleted from the
InnoDB table per second.
≥ 0 rows/s Database
Row Insert
Speed
Measures the average number of
rows that are inserted to the InnoDB
table per second.
≥ 0 rows/s Database
Row Read
Speed
Measures the average number of
rows that are read from the InnoDB
table per second.
≥ 0 rows/s Database
Row Update
Speed
Measures the number of updated
rows in the InnoDB table per
second.
≥ 0 rows/s Database
Disk Usage Measures the disk usage (%) of the
monitored object. 0 to 1 ECS
Cloud Eye
User Guide 8 Services Automatically Supported by Cloud Eye
Issue 12 (2018-01-30) Huawei Proprietary and Confidential
Copyright © Huawei Technologies Co., Ltd.
34
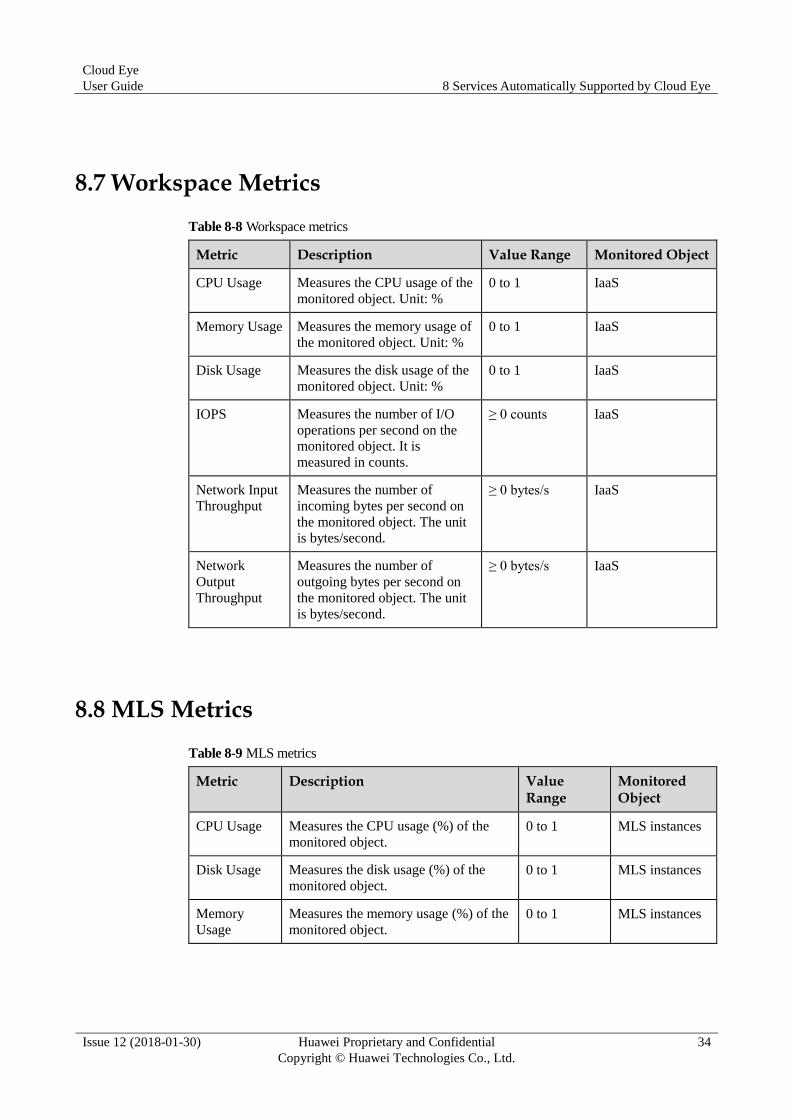
8.7 Workspace Metrics
Table 8-8 Workspace metrics
Metric Description Value Range Monitored Object
CPU Usage Measures the CPU usage of the
monitored object. Unit: %
0 to 1 IaaS
Memory Usage Measures the memory usage of
the monitored object. Unit: %
0 to 1 IaaS
Disk Usage Measures the disk usage of the
monitored object. Unit: %
0 to 1 IaaS
IOPS Measures the number of I/O
operations per second on the
monitored object. It is
measured in counts.
≥ 0 counts IaaS
Network Input
Throughput
Measures the number of
incoming bytes per second on
the monitored object. The unit
is bytes/second.
≥ 0 bytes/s IaaS
Network
Output
Throughput
Measures the number of
outgoing bytes per second on
the monitored object. The unit
is bytes/second.
≥ 0 bytes/s IaaS
8.8 MLS Metrics
Table 8-9 MLS metrics
Metric Description Value Range
Monitored Object
CPU Usage Measures the CPU usage (%) of the
monitored object.
0 to 1 MLS instances
Disk Usage Measures the disk usage (%) of the
monitored object.
0 to 1 MLS instances
Memory
Usage
Measures the memory usage (%) of the
monitored object.
0 to 1 MLS instances
Cloud Eye
User Guide 8 Services Automatically Supported by Cloud Eye
Issue 12 (2018-01-30) Huawei Proprietary and Confidential
Copyright © Huawei Technologies Co., Ltd.
35
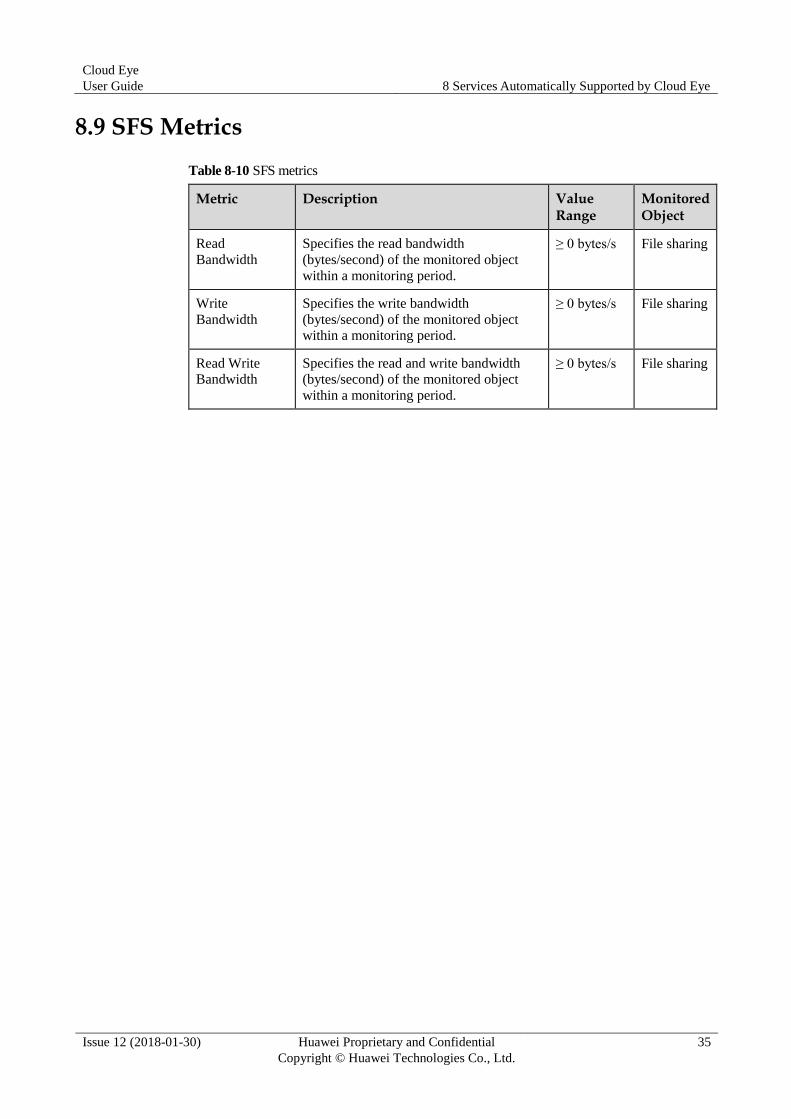
8.9 SFS Metrics
Table 8-10 SFS metrics
Metric Description Value Range
Monitored Object
Read
Bandwidth
Specifies the read bandwidth
(bytes/second) of the monitored object
within a monitoring period.
≥ 0 bytes/s File sharing
Write
Bandwidth
Specifies the write bandwidth
(bytes/second) of the monitored object
within a monitoring period.
≥ 0 bytes/s File sharing
Read Write
Bandwidth
Specifies the read and write bandwidth
(bytes/second) of the monitored object
within a monitoring period.
≥ 0 bytes/s File sharing
Cloud Eye
User Guide 9 FAQs
Issue 12 (2018-01-30) Huawei Proprietary and Confidential
Copyright © Huawei Technologies Co., Ltd.
36
9 FAQs
9.1 Concepts
9.1.1 What Is Cloud Eye?
Cloud Eye is a multi-dimensional monitoring platform. With Cloud Eye, you can understand
the resource usage and running status of services running on the cloud platform, receive alarm
notifications in a timely manner, and react to changes to keep your services running smoothly.
9.1.2 What Alarm Status Does Cloud Eye Support?
Cloud Eye supports three states of alarm status: Alarm, OK, and Insufficient data.
If an alarm rule is disabled, its alarm status is considered as invalid, and Disabled is
displayed.
Insufficient data indicates that no data has been generated within the latest monitoring
period. Usually, it is caused by the deletion or abnormal status of service instances.
9.1.3 What Is Rollup?
Rollup is the process in which Cloud Eye calculates sample raw data collected in different
periods by using different rollup methods, including Avg., Max., Min., Sum, and Variance.
The calculation period is called a rollup period.
Rollup is a smooth calculation process. The longer the rollup interval, the more smoothly
processing will be implemented, and the more accurate these generated data will reflect the
real situation. However, the shorter the rollup interval is, the more effective alarm reporting
will be.
The rollup period can be 5 minutes, 20 minutes, 1 hour, 4 hours, or 1 day.
The methods Cloud Eye uses to process collected data vary depending on data type:
If the data is an integer, the data will be rounded.
If the data is a decimal fraction, two decimal places will be retained. Any further decimal
places will be rounded.
For example, the instance quantity in AS is an integer. If the rollup period is 5 minutes, the
values of collected metric data are 1 and 4, while the average value is 2 instead of 2.5.
Cloud Eye
User Guide 9 FAQs
Issue 12 (2018-01-30) Huawei Proprietary and Confidential
Copyright © Huawei Technologies Co., Ltd.
37
You can choose the Cloud Eye mode based on the characteristics of the rollup to meet your
service requirements.
9.1.4 How Long Is the Metric Data Retained?
Metric data includes original and rollup metric data.
Original metric data is sampled raw data and are retained for two days.
Rollup metric data is data aggregated based on original metric data. Retention durations
for rollup metric data depend on the rollup period.
− Metric data whose rollup period is 5 minutes are retained for 10 days.
− Metric data whose rollup period is 20 minutes are retained for 20 days.
− Metric data whose rollup period is 1 hour are retained for 155 days.
− Metric data whose rollup period is 4 hours are retained for 300 days.
− Metric data whose rollup period is 1 day are retained for 5 years.
If a resource instance is stopped, closed, or deleted, an original metric will be deleted one
hour after its original data is not reported. After the metric data report resumes, the historical
data of that metric is available.
9.1.5 How Many Rollup Methods Does Cloud Eye Support?
Cloud Eye supports the following rollup methods:
Average
If Avg is selected for Statistic, Cloud Eye calculates the average value of metric data
within a rollup period.
Maximum
If Max is selected for Statistic, Cloud Eye calculates the maximum value of metric data
within a rollup period.
Minimum
If Max is selected for Statistic, Cloud Eye calculates the maximum value of metric data
within a rollup period.
Sum
If Sum is selected for Statistic, Cloud Eye calculates the sum of metric data within a
rollup period.
Variance
If Variance is selected for Statistic, Cloud Eye calculates the variance value of metric
data within a rollup period.
Rollup uses a rollup method to aggregate raw data generated within a specific period. Take the 5-minute
period as an example. If it is 10:35 now, the raw data generated between 10:30 and 10:35 will be
aggregated to 10:30.
Cloud Eye
User Guide 9 FAQs
Issue 12 (2018-01-30) Huawei Proprietary and Confidential
Copyright © Huawei Technologies Co., Ltd.
38
9.2 Usages
9.2.1 What Is an Alarm Notification? How Many Types of Alarm Notifications Exist? How Can I Configure Them?
Alarm notifications are actions that the system takes when the alarm status of an alarm rule is
changed.
You can configure alarm notifications when creating or modifying an alarm rule. You can also
disable alarm notifications.
Cloud Eye supports the following alarm notification types:
Sends emails to users, or sends HTTP/HTTPS requests to servers.
Triggers automatic capacity expansion and reduction by working with AS.
9.2.2 Why Are the Network Traffic Metrics in Cloud Eye Different from Those Detected in ECS?
The sample data collection interval in Cloud Eye is different from that used by the metric
monitoring tool in the ECS.
Cloud Eye collects ECS and EVS data at four-minute intervals. The data collection interval
for ECS second generation is 5 minutes. However, the metric monitoring tool in the ECS
collects data at one-second intervals.
As the data collection cycle gets longer, the distortion of short time data increases. Therefore,
Cloud Eye is suitable for monitoring long-term websites and applications running on ECSs.
Furthermore, you can configure alarm thresholds to generate alarms in the event of resource
exceptions or insufficiency, improving resource reliability.
9.2.3 What Are the Effects on ECS Metrics If vmtools Is Not Installed on ECSs?
If vmtools is not installed on ECSs, Cloud Eye can still monitor the outband incoming rate
and outband outgoing rate. However, it cannot monitor memory usage, disk usage, inband
incoming rate, or inband outgoing rate, which reduces data accuracy of the CPU usage.
For details about ECS metrics supported by Cloud Eye, see ECS monitoring metrics.
9.2.4 How Can I Export Monitoring Data?
On the Cloud Eye management console, select an instance from Instance Monitoring and
click Export Monitoring Data. On the Export Monitoring Data page, select a service,
monitored object, and metric, and click Export.
The first row of the report indicates the time of data collection expressed in Unix
timestamp, the second row indicates the time of data collection expressed in the format
that complies with ISO standards, and the third row indicates the metric data.
If you need to convert the time in Unix timestamp to the time of the target time zone,
perform the following steps:
a. Use Excel to open a .csv file.
b. Use the following formula to convert the time:
Cloud Eye
User Guide 9 FAQs
Issue 12 (2018-01-30) Huawei Proprietary and Confidential
Copyright © Huawei Technologies Co., Ltd.
39
Target time = (Unix timestamp/1000 + (Target time zone) x 3600)/86400 + 70 x 365
+ 19
c. Set cell format to Date.
For example, the Unix timestamp is 1475918112000 and the target time is Beijing
time. Beijing is located in the UTC+8 time zone. Therefore, the target time is
calculated as follows:
Target time = (1475918112000/1000 + (+8) x 3600)/86400 + 70 x 365 + 19
Set the cell format to date and select a presentation format such as 2016/3/14 13:30.
Then, the final time is obtained and presented as 2016/10/8 17:15.
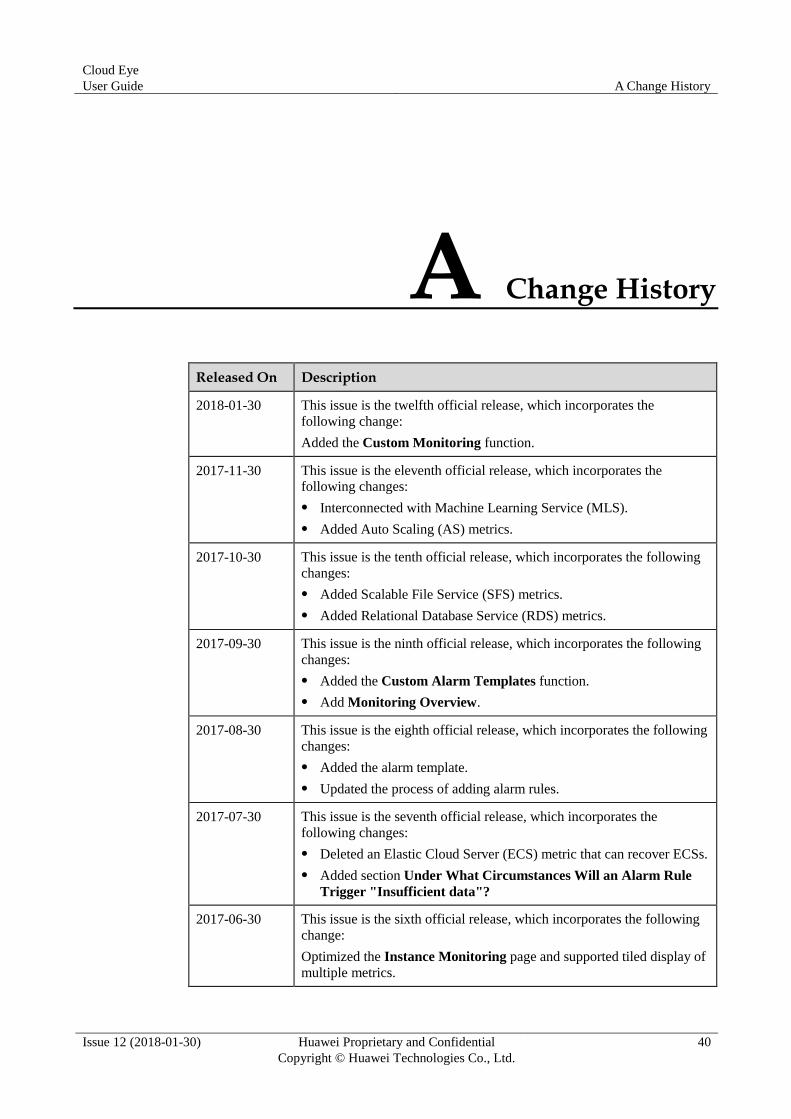
Cloud Eye
User Guide A Change History
Issue 12 (2018-01-30) Huawei Proprietary and Confidential
Copyright © Huawei Technologies Co., Ltd.
40
A Change History
Released On Description
2018-01-30 This issue is the twelfth official release, which incorporates the
following change:
Added the Custom Monitoring function.
2017-11-30 This issue is the eleventh official release, which incorporates the
following changes:
Interconnected with Machine Learning Service (MLS).
Added Auto Scaling (AS) metrics.
2017-10-30 This issue is the tenth official release, which incorporates the following
changes:
Added Scalable File Service (SFS) metrics.
Added Relational Database Service (RDS) metrics.
2017-09-30 This issue is the ninth official release, which incorporates the following
changes:
Added the Custom Alarm Templates function.
Add Monitoring Overview.
2017-08-30 This issue is the eighth official release, which incorporates the following
changes:
Added the alarm template.
Updated the process of adding alarm rules.
2017-07-30 This issue is the seventh official release, which incorporates the
following changes:
Deleted an Elastic Cloud Server (ECS) metric that can recover ECSs.
Added section Under What Circumstances Will an Alarm Rule
Trigger "Insufficient data"?
2017-06-30 This issue is the sixth official release, which incorporates the following
change:
Optimized the Instance Monitoring page and supported tiled display of
multiple metrics.
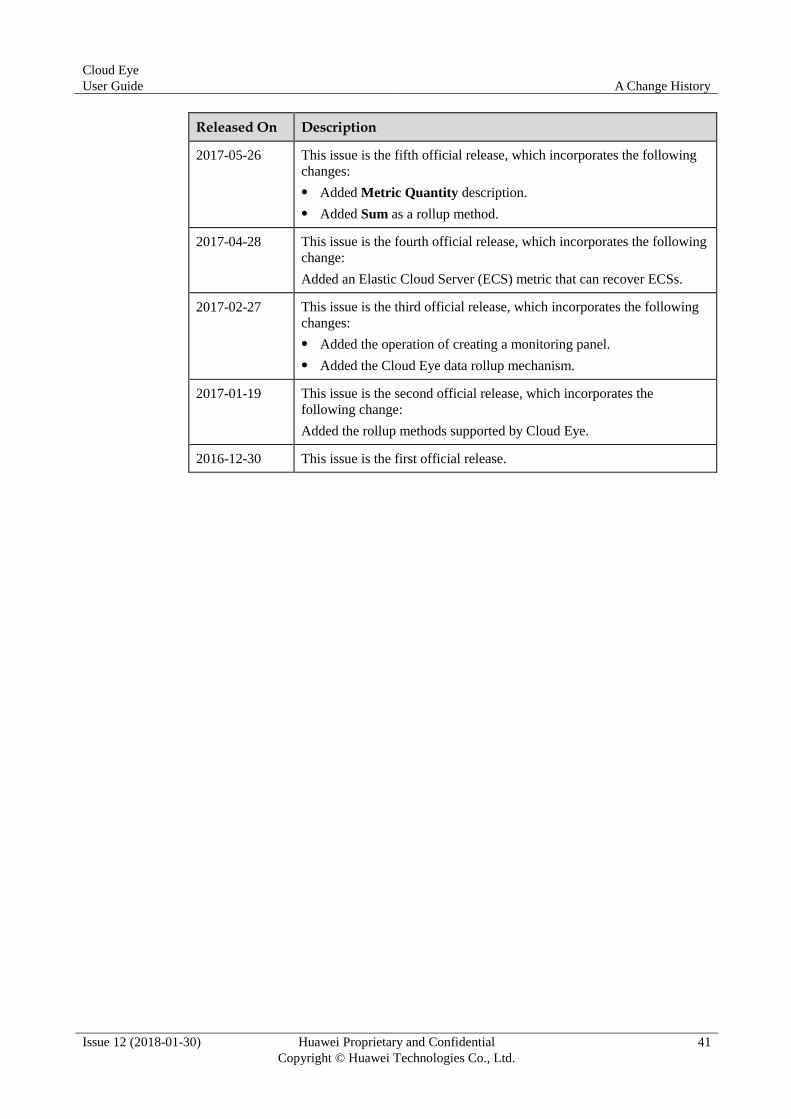
Cloud Eye
User Guide A Change History
Issue 12 (2018-01-30) Huawei Proprietary and Confidential
Copyright © Huawei Technologies Co., Ltd.
41
Released On Description
2017-05-26 This issue is the fifth official release, which incorporates the following
changes:
Added Metric Quantity description.
Added Sum as a rollup method.
2017-04-28 This issue is the fourth official release, which incorporates the following
change:
Added an Elastic Cloud Server (ECS) metric that can recover ECSs.
2017-02-27 This issue is the third official release, which incorporates the following
changes:
Added the operation of creating a monitoring panel.
Added the Cloud Eye data rollup mechanism.
2017-01-19 This issue is the second official release, which incorporates the
following change:
Added the rollup methods supported by Cloud Eye.
2016-12-30 This issue is the first official release.