Embed Size (px)
Citation preview

Forthcoming in The Economic Journal
Used-Clothing Donations
and Apparel Production in Africa†
Garth Frazer
University of Toronto
Abstract
What accounts for the failure of African countries to step onto the bottom rung of the
manufacturing sophistication ladder, that is to produce textiles and apparel? This paper
examines the importance of one possible explanation. Specifically, it explores the impact of
used-clothing donations on apparel production in these countries. Used-clothing donations to
thrift shops and other organizations in industrialized countries typically end up being sold to
consumers in Africa. Given that used clothing is initially provided as a donation, it shares
characteristics with food aid, which in all cases assists consumers, but at times clearly harms
African food producers. In order to test for a causal link between the influx of used clothing
into African countries and apparel production there, an instrumental variables strategy is
adopted. The interaction between the geographic and historical proximity of OECD
countries to a given African country and the supply of used-clothing donations in the OECD
countries considered to be geographically ‘near’ to the African country is used to instrument
for the used-clothing imports. Following this methodology, used-clothing imports are found
to have a negative impact on apparel and textile production in Africa, explaining roughly
40% of the decline in African apparel production and roughly 50% of the decline in apparel
employment.
† I would like to thank seminar participants at the National Bureau of Economic Research Summer Institute, the American Economics Association, the University of British Columbia, as well as Matt Slaughter and Jo Van Biesebroeck, but in particular, three anonymous referees, and Steve Pischke, the editor of this paper, for very helpful comments on this paper. Remaining errors are my own. Funding for this research from the Connaught Fund is gratefully acknowledged. Corresponding Address: Rotman School of Management, University of Toronto, 105 St. George Street, Toronto, Ontario M5S 3E6 Canada, Ph: (416)978-5692, Fax: (416)978-5433, e-mail: [email protected]

If East Asia has been the international success story over the last 30 years in terms of eco-
nomic growth, trade and human development, Africa has been a story of failure. Taiwan, Korea,
Singapore, Hong Kong, and now China began with production and exports of textiles and apparel
and moved to increasingly sophisticated electronic and industrial goods as their economies grew.
In contrast over this period, the economies of Africa have in general stagnated. In particular,
onlookers have been puzzled by the overall inability of Africa to step onto even the bottom rung of
the manufacturing sophistication ladder, to produce and export textiles and apparel, particularly
given Africa’s low unskilled wage levels and strong supplies of cotton.
The development path taken by the East Asian tigers highlights the important role of apparel
production in the early stages of their development. Romalis (2004) has decomposed the growth of
the East Asian tigers, documenting how these countries began with production in the most unskilled
labour-intensive industries, including textiles and apparel, and shifted to more skill-intensive and
capital-intensive industries, as the countries accumulated both physical and human capital. This
is consistent with other models of skill and capital accumulation, including Ventura (1997). The
important role that apparel production has played in the early stages of most of the now developed
countries is also highlighted in Figure 1.1 This figure involves a nonparametric regression of the
size of the apparel sector as share of employment as a function of per capita income. We see an
inverted U-shaped pattern, demonstrating that as countries have grown in the past, on average
the apparel sector has at first grown, and then later shrunk. Three countries with occasionally
extremely large apparel sectors, Hong Kong, Mauritius, and Macao, have been omitted. As we can
1The nonparametric regression method is a Nadaraya-Watson kernel estimator, with a normal kernel, and anoptimal bandwidth, as defined by Silverman (1986). There are 2367 observations over the years 1963 through 2000.The confidence interval in Figure 1 is calculated using bootstrap methods, assuming independence of observationsbetween countries, but not within a given country. Therefore, the bootstrap samples countries, with all of theobservations per selected country included in the bootstrap sample.
1

see from the figure, we can state with 95% confidence that countries that have grown to income
levels above $11 000 have had at least 1% of their workforce involved in apparel production at
some point. This is consistent with the role of apparel as an initial stage of manufacturing, one
that uses low-income countries’ relatively abundant factor, unskilled labour. As capital and skill
have accumulated, resources have shifted from apparel to other more sophisticated manufacturing
sectors. To put African countries in context on this graph, over the period of our study, 1981 to
2000, their average level of GDP per capita was $2200 (0.2 × 10⁴ on Figure 1). Moreover, over
this period, the average per capita growth across African countries was -0.14%. African countries
were stagnant.
In African countries, the apparel sector has been declining both in an absolute and a relative
sense. The apparel share of manufacturing declined an average of 5.3% per year in African countries
over the period from 1981 to 2000. While several explanations have been offered for the overall
poor performance of African countries, including poor government policies, poor institutions, high
transactions costs, poor infrastructure, uncertainty and poor social capital (Collier and Gunning,
1999; Easterly and Levine, 1997; Fafchamps, 2004), it is not immediately apparent that these
reasons explain why apparel production has been declining in a relative sense within these countries.
However, a visit to a typical African market does offer a potential explanation that is worth testing.
Here, one sees large volumes of used clothing that have been sourced as cast-off donations in
industrialized countries, and then sent to Africa. In fact, there was a dramatic increase in the
donations of used clothing to charities in developed countries over the past 20 years. Unable to
sell even the majority of this clothing domestically, charities typically sell the used clothing to
exporters who send it at a very low cost to developing countries, particularly in Africa (Hansen,
2000). The importance of this trade is seen by example. For the U.S., used clothing is consistently
2

one of the top ten exports to African countries (U.S. Dept. of Comm, 2003; USTR, 2001; USITC,
1999). About 16 % of the containers in container ships with U.S. exports bound for Africa in
1995 were filled with used clothing (Hansen, 2000, p. 120). This large influx of used clothing has
been criticized by African policymakers as harming their domestic garment industries. The used
clothing clearly provides benefits to African consumers, and as such the used-clothing imports have
been compared to food aid, which, if improperly applied, can considerably harm the farmers whose
crop price is dampened, at times severely, by the free food imports (while, of course, obviously
helping the consumers of the food). This negative impact of food aid was raised as early as Schultz
(1960) and formalized in Fisher (1963). Used-clothing imports are not formal government aid,
but they originate as aid (donations), and are provided basically at the cost of transportation, and
therefore share key characteristics with aid. Just as the reduced food prices from food aid can hurt
the agricultural sector of these countries, the reduced clothing price from used-clothing imports
have the potential to hurt the apparel sectors of poor countries. This paper will not comment on
the benefits to African consumers, but will evaluate the causal impact of the used-clothing imports
on apparel producers.
The methodology will proceed in stages. As a first step, I will use regression analysis to
examine the correlation between used-clothing imports (either the inflow or the stock) and apparel
production within the country. As a second step, I will also identify the impact of used-clothing
imports on garment production causally. This will be done using an identification technique that
builds on Frankel and Romer’s (1999) use of geographic characteristics to determine the level of
trade between countries. For the causal analysis, the total level of used-clothing exports from a
country in a given year will be assumed to be exogenously determined by the level of used-clothing
donations in the country in that year. Given the available studies of the charitable used-clothing
3

industry (e.g. Hansen, 2000), this seems a very reasonable assumption. Typically, whatever used
clothing could not be sold locally in thrift shops was exported. Those donating used clothing have
until recently been largely unaware that the bulk of this clothing is exported, and so were certainly
not donating with conditions in Africa on their mind. The geographically-determined fraction of
these total exports going to each African country will be used to create the instrumental variable
for identification.
Specifically, the exogenous variation in used-clothing imports coming into an African country
will be identified by the interaction between the supply of used-clothing donations in an exporting
OECD country, and the "distance" of that country from the African country, as determined by
geographical and historical factors. For example, since for geographic reasons, Germany exports
more to Ghana than to Mozambique (the Atlantic coast is closer than the Pacific coast), when the
supply of used-clothing exports increases in Germany, more of this supply will be predicted to go to
Ghana than to Mozambique. The difference between the geographically-predicted increase in used-
clothing imports in Ghana, and the geographically predicted increase in used-clothing imports in
Mozambique will identify the impact of used-clothing imports on apparel production. As italicized
in the previous sentence, it is the increases in the used-clothing imports that matter since a full set
of country-specific fixed effects is included in the second stage. As also italicized in that sentence,
it is the difference betweeen these increases that matters since year-specific fixed effects are also
included in the second-stage.
In brief, the effect of used-clothing imports on apparel production, as measured using the
instrumental variables technique, is found to be significant both statistically and in size in a wide
variety of specifications, including controls for country-level fixed effects, year fixed-effects, as well
as income levels, and the overall size of the manufacturing sector. In terms of magnitude, the
4

imported used-clothing imports are estimated to be responsible for roughly 40% of the decline in
apparel production and roughly 50% of the decline in apparel employment in an average African
country over the period 1981 to 2000.
While no other paper of which I am aware has explored analytically the relationship between
used-clothing donations and textile and apparel production, the impact of used-clothing imports on
textile production was raised anecdotally by McCormick et. al. (1997), based on surveys of textile
producers in Kenya. They cite the importation of used clothing as the main cause of weak demand
in the sector, which along with credit constraints, and "lack of suitable secure premises" form the
key barriers to growth for these firms, based on the firm survey responses. Studies that have
focused more directly on the importation of donated used-clothing have been limited in number,
and descriptive in nature, and include Hansen (2000) and Haggblade (1990).
To place the apparel sectors in these countries in context, overall, the contribution of the apparel
sector to employment in Africa is greater than its contribution to manufacturing. While apparel
production in selected African countries comprises roughly 3.1% [2.1%, 1.6%] of manufacturing in
the 1970s [1980s, 1990s]2 in value-added terms, apparel employment comprises roughly 5.1% [4.2%,
4.1%] of manufacturing employment. In comparison, manufacturing comprises 10.9% [12.3%,
10.3%] of GDP in these countries.
The theory required to analyze the impact of used-clothing donations is very simple indeed (just
as the theory on the impact of food aid is equally simple), and parallels the early work on food
2This is calculated from the main UNIDO dataset used in this paper, described more fully in the appendix. Toensure that the data reported in this paragraph is comparable over time, it is calculated in the following way. For allcountries that have at least some data available in each of the three decades, averages are taken across all observationsin the decade, and then the averages of these averages are reported. The countries for which such data is availableincludes: Burundi, Cameroon, Ghana, Côte d’Ivoire, Kenya, Malawi, Mozambique, Nigeria, Senegal, South Africa,Zimbabwe, Tanzania, Burkina Faso, Zambia. Mauritius is an extreme outlier in terms of African production, as willbe discussed in the Results section, and is not included in these averages.
5
aid (Fisher, 1963), as well as work on immigrant labour (Johnson, 1980; Altonji and Card, 1991).3
In a closed economy, used clothing is a close substitute for domestically-produced apparel. Note
that an economy may be be effectively ‘closed’ for any of the variety of reasons outlined above:
poor institutions, high transactions costs, poor infrastructure, uncertainty and poor social capital.
Such a ‘closed’ economy is wholly consistent with the importation of used-clothing donations, which
are sourced for free, as donations, and therefore can be sold domestically for a profit even after
overcoming international transaction costs. If an influx of used clothing has any impact on the
domestic industry, we would expect it to result in a downward shift in the demand curve in the new
apparel industry. The key question, therefore, is whether this used clothing does have an impact
and what the magnitude of this impact is. On the other hand, in an open economy (with zero
trade costs), the donated used-clothing imports will not affect domestic production, as domestic
production is based on comparative advantage (e.g. factor endowments, technology, or historic
experience), and worldwide, rather than domestic, demand. Any single African economy is small
by world standards, including in the clothing industry, and therefore will not independently affect
worldwide demand. Overall, the question of the impact of used-clothing donations on apparel
production in Africa is fundamentally an empirical one, and specifically a test of whether the effect
is negligible or negative, and if negative, how large. Since the impact of these donations on African
apparel production has not previously been explored, even this simple question is an important
one.4
3The working paper version of this manuscript outlined the general theory, and demonstrated the mechanism forsuch an effect for a Cournot model of heterogenous firms. Available from the author upon request.
4Note that it is theoretically possible to construct a model, including income, where the positive income effect froman increase in the amount of used-clothing available (and resulting decrease in its price) overwhelms the substitutioneffect into used clothing, so that the demand for new clothing actually increases with the supply of used clothing.However, such a model would require a large decrease in the price of used-clothing (since at all points it is cheaperthan the price of new clothing), and incomes are generally low in African countries. The lack of a significant perceivedquality difference between new and used clothing in African countries (unlike OECD countries) suggests this is notthe case. Moreover, such a model would not apply on the extensive margin for the introduction of used-clothingimports, as it requires a significant quantity of used clothing already being purchased in one’s consumption bundle
6

In this paper, Section 1 discusses the specification used to analyze the impact of used clothing
imports, as well as the data. Section 2 provides the results. Finally, Section 3 concludes.
1 Specification and Data
While the static analysis outlined above is sufficient to analyze the impact on new clothing pro-
duction resulting from the increase in availability of a close substitute (used clothing), this paper
also relates to a dynamic literature on structural change that seeks to examine the relative size of
various sectors (such as the apparel sector) over the course of development. Exploring the shifts be-
tween agriculture, manufacturing, and services industries (as well as their sub-components) was an
empirical interest of a number of early development economists (including Chenery(1960), Kuznets
(1971), Chenery and Syrquin(1975), Chenery and Syrquin (1988)). These papers saw structural
change (defined here as the change in the shares associated with different industries) as part of the
process of growth and development, and sought to empirically examine what these changes were
without a single, formal theoretical model, with per capita income as the explanatory variable.
These papers also explored the change in the relative size of the apparel sector as countries devel-
oped, and found that the apparel sector’s size at first increased and then later decreased over the
course of development, as already noted in Figure 1. More recent papers have used formal models
to explain the structural change, but with a smaller number of sectors—typically just agriculture
and industry (Murphy, Shleifer and Vishny (1989), Matsuyama (1992), Laitner (2000), Caselli and
Coleman (2001), and Gollin, Parente and Rogerson (2002)). The formalized structural change
models typically predict a one-to-one relationship between the sectoral share and income level.
Therefore, for consistency with the more recent theoretical work, and the older empirical work on
(for the income effect to apply).
7

structural change, per capita GDP will be included as a right-hand side variable to control for the
potential of structural change. While the nonparametric work of Figure 1 would suggest inclusion
of a quadratic in income, since all of the African countries have incomes low enough to remain on
the increasing portion of the curve, a linear term should suffice.
Therefore, consider the following econometric specification, including the income variable:
logAit = α+ β logUit + γ logMit + λYit + δi + νt + ξit (1)
where Ait is a measure of production in the apparel sector in country i at time t, δi is a country
fixed-effect to control for time-invariant factors that will affect a country’s textile production, νt
is a year fixed-effect to control for universal influences to apparel production in a given year, Uit
reflects the used-clothing imports, Mit is the overall level of manufacturing (not including apparel
and textile production), Yit is a country’s per capita income, and ξit reflects other influences on a
country’s level of apparel production. The overall level of (non-apparel) manufacturing is included
in order to capture trends in, and idiosyncratic shocks to, the overall level of manufacturing within
a country that would affect the level of apparel production. As noted in the previous section,
the used-clothing imports would depress the price that apparel producers face by increasing the
supply of a close substitute, used clothing, whose price only reflects the cost of transportation from
industrialized countries to Africa, and not the cost of production. As noted in the previous section,
the effect of these used-clothing imports should be negligible in an open economy, and may decrease
production in a closed economy. Therefore, we would hypothesize that either β is zero or β is
negative.
The problem with simple least-squares estimation of equation (1) is that the used-clothing im-
ports, Uit may be correlated with ξit, the other influences on a country’s level of apparel production.
8

The solution lies in an instrumental variable (IV) approach, that is in finding variable(s) that are
correlated with Uit, but uncorrelated with the residual, ξit. The instrument used in this case
expands on the technique of Frankel and Romer (1999). Note that the used-clothing imports into
country i in year t is related to the used-clothing exports from country j in year t by the following
identity:
Uit =Xj
Uijt (2)
=Xj
Uijt
Ujt· Ujt
The first line is just an adding-up condition; imports into country i is the sum of the exports
from all countries j into country i. This can then be broken down (in line 2) into the share of
country j’s used clothing that goes to country i , UijtUjt, times country j’s overall exports of used
clothing Ujt. The basic idea behind the instrument is straightforward. Provided that we can
obtain exogenous variation in each of these factors (UijtUjt
and Ujt) whose product constructs used-
clothing imports, we can construct an exogenous instrument for used-clothing imports into country
i in period t.
First, we assume that the total level of used-clothing exports from a country in a given year
(Ujt) is exogenously determined by the level of used-clothing donations in the country in that
year. The primary scholarly research into the used clothing industry is Hansen (2000). She
performed primary research on the sourcing of used clothing in Netherlands, Belgium, Canada
and the United States, as well as secondary research of articles and reports to document that the
majority of used clothing that is donated to the charitable shops and organisations is destined for
export. Generally, whatever cannot be sold in the local thrift shops is sent for export. Moreover,
those donating the used clothing have been largely unaware that the bulk of this clothing has been
9

headed for developing countries over the past 20 years. For most of the 1980s and 1990s (and even
today), "most people who donate garments to charitable organisations are not aware of how their
donations are disposed of." (Hansen, 2000, p. 103) In fact, most people assume that the bulk of
the donations are sold in thrift shops. While this perception may have changed slightly in the past
few years (and it is not clear that it has),5 this perception certainly held for the period under study.
People were not donating used clothing with conditions in Africa on their mind.6 ,7
The share of used-clothing from a given OECD country to a given African country UijtUjt
cannot
be assumed to be exogenous. Typically, the distribution happens in the following way. While
the mechanism varies somewhat from country to country, in Europe and North America, the basic
setup is the same (Hansen, 2000). The thrift stores, who, particularly until recently, have been the
dominant collectors of used clothing, sort it. Some of it is sold locally in thrift shops, and the rest
is packed (and possibly sorted by type) before sale to exporters. Exporters then transport the used
clothing to an African country where they sell the used clothing to wholesalers, who in turn, sell
it to retailers who distribute it to the final consumers. At times, the used clothing is distributed
for free in the African country, but this is not the norm. Usually, it is sold. However, while the
5While formal surveys have not been done of a random sample of the overall population regarding where the usedclothing goes, my conversations with many well-informed, well-educated individuals (including economists) has madeit abundantly clear that, at least until recently, most have been unaware of the final destination of used clothing.
6 If used-clothing donors had conditions in Africa on their mind, then we might expect an increase in used-clothingdonations and exports during times when African economies were suffering. If the overall economies were performingpoorly, we might expect that the apparel sectors are also performing poorly, and therefore used-clothing exports wouldbe correlated with poor apparel production independently of the used-clothing trade itself. Again, fortunately, peoplewere not donating with African conditions on their mind. Still, even if they were, it would be heroic to argue thatused-clothing donors were cognizant of the relative share of the apparel sector as a fraction of GDP or of manufacturingin these countries.
7While people were clearly not donating with conditions in Africa on their mind, their used-clothing donationsmight be spuriously correlated with African apparel production under the following conditions. Suppose that theavailability of cheap clothing from a third source (e.g. China) increases over this period, and this (e.g. Chinese)competition both reduces apparel production in Africa, and induces citizens of OECD countries to donate moreclothing to charities. Then used-clothing donations become indirectly correlated with the average level of apparelproduction in African countries. To handle this possibility, year fixed-effects are included in equation (1) to controlfor any time-varying influences affecting all African countries, including for example, the level of Chinese exports toAfrica and to the OECD in a given year.
10
price does reflect markups for the thrift shop collector, the exporter, and the African wholesaler
and retailer, the final price is still free of the cost of producing the article of used clothing, and
this fact continues to keep its price very low. Now, while it is reasonable to assume that those
donating the used clothing were not donating with the relative health of the apparel sectors in
these countries on their mind, the same cannot be said for the exporters. Conditional on the
overall supply of used clothing, they may have been sending a larger share of the used clothing
to countries where domestic apparel production had failed for any number of reasons relative to
other sectors. Therefore, the instrumental variables technique is designed explicitly to handle this
kind of potential endogeneity, as well as less obvious sources of endogeneity, related for example
to changes in African government policy. For a given industrialized country in a given year, the
share of used clothing going from that country to each of the African countries will be predicted on
the basis of geographic and historical characteristics alone. These geographically-predicted shares
of the used-clothing trade will be used to construct the instrument for used-clothing imports into
African countries.
Specifically, the geographic and historical factors used to predicted the used-clothing trade
include the following. While the great-circle distance between capital cities has been found to
be a significant (negative) predictor of trade between countries, in our case, the trade involves
exports from OECD countries to the single region, Africa. Since the bulk of OECD countries are
in Europe, great-circle distance is not as significant a determinant of trade. On the other hand, we
might expect European countries and the U.S. to be more likely to export to countries on Africa’s
Atlantic coast, and Japan and Australia to be more likely to export to countries on Africa’s Indian
Ocean coast. For this reason, I include a dummy for country-pairs that share the Atlantic ocean
(AOij), and another for country-pairs that share the Pacific/Indian Ocean (POij). In addition,
11

I include a dummy variable for whether the country is landlocked (Li), as well as the country’s
population (Ni) and area (Ai). Finally, dummy variables are included for whether two countries
shared a colonial relationship (Cij). Together then, the level of used-clothing exports Uijt, from
country j into country i in year t, as a fraction of the total level of used-clothing exports, Ujt from
country j in year t is expressed in the trade equation as:
Uijt
Ujt
= β0 + β1t(AOij) + β2t (POij) + β3t(Cij) (3)
+β4t(Li) + β5t log(Nit) + β6t log(Ai) + εijt
Note that only the characteristics of importing countries are included in the trade equation,
since the dependent variable is the share of exports from a given OECD country. Note also
that we will not restrict the effects of any of these variables to be constant over time, but rather
allow the coefficients to vary by year. This allows the effect of geographic variables to vary over
time, allowing, for example, for distances to shrink over time. Other variables that are sometimes
included in gravity-type equations for predicting trade are the income levels of the two countries,
but these factors are more difficult to argue as being exogenous or pre-determined, and so are not
included in the above regression.
Overall, then, the trade shares,dUijtUjt, predicted by the variables in equation (3) are combined
with the used-clothing export supplies, Ujt , to obtain the geographically-predicted supply of used
clothing into country i using the equation:
cUit =Xj
dUijt
Ujt
· Ujt (4)
These geographically-predicted used-clothing imports are used to instrument for the used-
clothing imports in equation (1). Note that in the second stage estimation, since both year-effects
12

and country fixed-effects are included in the estimation, the identification is entirely coming from
the interaction between the export supply from each OECD country and its "geographic proxim-
ity" to each African country. While the geographic proximity is allowed to vary over time, this is
constrained to occur in a common way across all countries, and therefore this time-varying effect
will be "purged" by the year effects in the second stage.
It should be noted that many other things will also be affecting the levels of used-clothing
imports and the levels of apparel production aside from our instruments. For example, some African
countries have restricted the importation of used-clothing over the period under examination (1981-
2000). As a result, these countries will have even lower levels of used-clothing imports than would
be predicted by the trade equation. Such policies reduce the correlation between the constructed
used-clothing trade variable and the actual used-clothing trade, but do not affect the validity of
the instrument.
The data on trade in used clothing comes from the United Nations COMTRADE trade statistics.
Specifically, used clothing is defined at the SITC 5-digit level (in Revision 1 as 26701, and in
Revisions 2 and 3 as 26901). In the COMTRADE data, for each export-import country pair,
both the exporter and the importer provide a report of the trade. Given that we expect the
industrialized country reports should be more accurate (and they are also more complete) than
African country reports, the industrialized country reports of the used-clothing exports are used.
The data covers the period from 1981 to 2000. Specifically, the used-clothing exporting countries
are taken to be the OECD countries that are members over the entire period. Fortunately, these
countries reported their exports throughout the period, and so the used-clothing exporters are a
stable group. The used-clothing export trends for selected countries are reported in Figure 2.
The data on manufacturing production and apparel production is taken from the UNIDO In-
13

dustrial Statistics Database 2002. Per capita GDP is measured using the purchasing power parity
method, and taken from the Penn World Tables, version 6.1. The data on population and area is
from the World Bank World Development Indicators database. The data on colonial relationships
comes from information in The World Guide 1999/2000.
2 Results
As this is the first paper to explore the relationship between used-clothing imports and apparel
production, the first step is clearly to establish the existence of a correlation between these variables,
before exploring the causation through instrumental variables techniques. To do this, standard
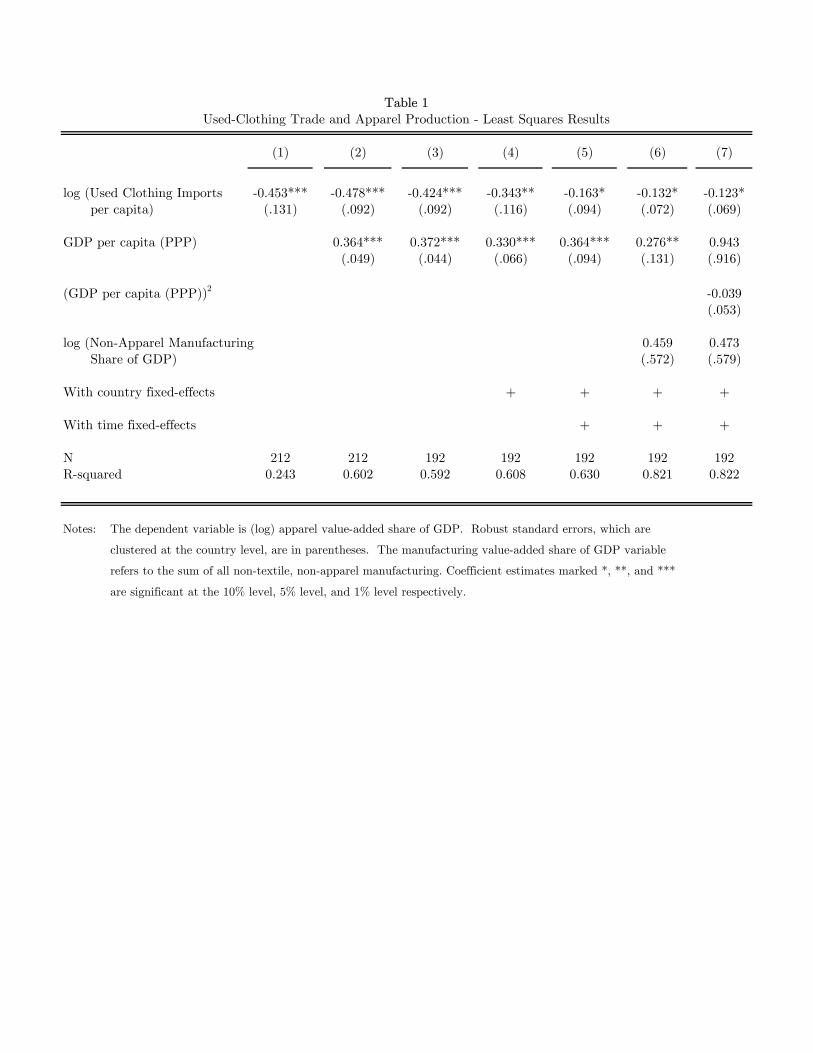
least-squares regressions of apparel production on used-clothing imports are performed in Table
1. In column (1), we see a negative correlation between the apparel production and used-clothing
imports, with a significant elasticity of roughly -0.45. In column (2) we include a GDP variable
to control for structural change, as outlined earlier, with little change in the results. Inclusion of
country fixed-effects in column (4) decreases the magnitude of the effect to roughly -0.34. Once
the time-effects are included in column (5), the magnitude of the coefficient drops considerably.
Inclusion of a full set of year and country fixed-effects reduces considerably the degrees of freedom
available in the estimation, and may also exacerbate any measurement error present, as is typically
the case in fixed-effects models. Inclusion of the manufacturing variable reduces the coefficient a
bit further to -0.132. Note that the manufacturing variable used is exclusive of the textile and
apparel share of manufacturing, in order to remove any mechanical correlation between this variable
and the dependent variable. A quadratic in GDP is included in the final column, but this is not
found to be significant. This is consistent with the relationship between apparel share of GDP and
income in Figure 1, combined with the fact that the African countries’ income levels correspond to
14

the increasing portion of this curve. While these specifications establish a significant correlation
between used-clothing imports and apparel production, to more firmly establish causation, we will
also use the instrumental variable (IV) techniques outlined in the previous section.
To construct the instrument, equation (3) is estimated with the results given in Table 2. The
coefficients are generally in line with expectations. The most significant determinant of used-
clothing trade is the existence of a historic colonial relationship between the countries. In addition,
sharing an ocean, particularly the Atlantic, also increases trade, while landlocked African countries
get less used-clothing trade.
In order to obtain a total predicted level of used-clothing imports into a given country i in a
given year, we use these predicted trade shares from equation (3) as weights in a sum of all of the
total exports of all exporting countries, as directed in (4). These predicted used-clothing trade
values can then be used as an instrument for used-clothing imports in the regression of equation
(1).
The IV results are presented in Table 3. Note that the instrument has been constructed as
the left-hand side of equation (4), but normalized to the importer’s per capita level, and measured
in logarithms. The coefficient on the used-clothing variable remains significant, and precisely
estimated. Once all of the controls are included in the final column, the impact of used-clothing
imports is estimated at approximately -0.61. Therefore, a 1% increase in used-clothing imports
results in a 0.61% decrease in apparel production. While the manufacturing coefficient is not
significant, for completeness it is retained in all future specifications.
The estimation is repeated under different conditions, with the results on the variable of interest
provided in Table 4.8 In the first row of Table 4, the result with the apparel value-added share of
8A variety of other specifications and robustness checks were employed in the working paper version of this paper.In addition, the trade equation can be estimated using import and export-country fixed-effects. For second stage
15

GDP as the dependent variable, from Table 3, is repeated. The second row examines the impact of
used-clothing imports on the overall level of apparel production (not measured as a share of GDP
or a per capita basis). In this case, the independent variable is the log of the total used-clothing
imports (not normalized by population or GDP), and therefore the instrument used is also not
normalized by population or GDP. Rather, it is taken directly as the logarithm of the left-hand
side of equation (4). Here, again, we see that the result is significant, with a magnitude of roughly
-0.68, suggesting the elasticity of the absolute magnitude of apparel production with regards to
the absolute magnitude of used-clothing imports is comparable to the normalized impact (-0.61).
Then, in the third row of Table 4, we examine the impact on apparel employment (normalized by
population size), and find a significant although slightly smaller elasticity.
Since textiles are a significant input into apparel production, we might wonder whether used-
clothing imports also resulted in a reduction in textile production. This is tested in rows (4) and
(5), which are symmetric to rows (1) and (2) for apparel. The results do not provide any evidence
for an impact on textile production, which is not surprising, given the second-order impact of a
backward linkage. Naturally, since both apparel output (row (1)) and apparel employment (row(3))
are reduced, workers and other productive resources are freed from the apparel sector, and may be
used elsewhere in the economy. In rows (6) through (8), we explore whether these resources shift
to other sectors of manufacturing, by using non-apparel manufacturing as a dependent variable.
While we do not find evidence of such a shift, this may partly reflect the relatively small share
that apparel holds in manufacturing, and the difficulty in finding statistical significance of these
specifications that do not include country fixed-effects, this requires the additional assumption that these fixed-effectsare exogenous to apparel production. However, for the base specification, this assumption is not required. Theresults are provided in Appendix Table A. Since the results in this case are larger for the base specification, but lessrobust overall, we continue to use the less restrictive assumptions of equation (3), as opposed to a trade equationspecification that includes country fixed-effects. Thanks are due to an anonymous referee for suggesting this approach.
16

relatively small shifts. For example, since on average roughly 5% of manufacturing employment
is in apparel, if all of the apparel workers found work in other manufacturing, we would expect
that the coefficient on non-apparel employment in row (8) to be slightly below +0.05. Although
the coefficient estimated is negative, a coefficient of +0.05 is well within the confidence interval.
Therefore, unfortunately, the data do not allow us to discern whether labour and other resources
shift to other manufacturing sectors. For a similar reason, we do not discern an impact on
manufacturing overall, as demonstrated in rows (9) through (11). This could either reflect a re-
allocation of resources within manufacturing, or simply the fact that apparel is not a large enough
sector to capture an effect in the aggregate.
To this point, the flow of used clothing in a given period has been seen to affect apparel
production in that period. However, if used clothing is a durable good, then what might affect the
demand for domestic apparel in a given period is not the flow of used clothing into a country in the
current period, but rather the imported used-clothing stock currently present in a country. In this
way, used clothing that had been imported in previous periods might still have an effect on apparel
production in the current period. Naturally, considerable work has been done in economics on
estimating stock values using flows, particularly constructing capital stock series from investment
flows. Using a similar methodology, I construct used-clothing stocks from the used-clothing flows
over the period (details are in the data appendix). The results for the stock specification are in
the final two rows of Table 4. While the coefficients are sizeable in the stock specification, they
are also not statistically significant. Therefore, the flow specification is used for the remainder of
the analysis.
The major outlier in Africa regarding apparel production is Mauritius, by far the most successful
apparel producer. To explore the possibility that Mauritius might be driving the results, these
17

apparel production regressions are repeated, dropping Mauritius from the estimation, with the
results given in Appendix Table B. Since the results change little from Table 4, we can conclude
that the inclusion of Mauritius neither drives nor moderates the results we obtain.
To this point, we have measured the average elasticity of apparel production/employment with
respect to used-clothing imports. However, we might expect that this effect is not constant across
different levels of used-clothing imports. To explore this possibility, a nonparametric regression of
apparel value-added share of GDP against per capita used-clothing imports is performed in Figure 3,
using essentially the same methodology as Figure 1. This is the unconditional relationship, without
any additional controls, and without attempting to identify causation. Still, it appears that used-
clothing imports are uncorrelated with apparel production at import levels below 0.1kg/capita. At
import levels above that, apparel production declines significantly. To put this number in context,
while t-shirts come in a variety of weights, a premium t-shirt weighs approximately 0.2 kg, while a
light t-shirt can weigh considerably less than 0.1 kg. A standard dress shirt weighs something near
0.4 kg, while a pair of blue jeans weighs closer to 1 kg. Unfortunately, since we know the total mass
of used clothing imported, and not the mass by categories of clothing, we cannot measure distinct
elasticities for the impact of different used-clothing categories on apparel production. Still, the
results here suggest that in the countries and time periods where the imports of used-clothing were
kept below roughly 1 light t-shirt per person in terms of weight, the apparel sector did not decline.
Of course, the relationship in Figure 3 must be understood as a correlation, and in this paper,
we have worked hard to construct an instrument to handle the endogeneity of used-clothing with
respect to apparel production. As is well known, the standard linear IV estimator is essentially a
two-stage estimator, where the first stage includes a linear regression of the endogenous regressor
on all of the exogenous regressors (including the instrument). The analog technique does not work
18

in the nonparametric context, as discussed, for example, in Blundell and Powell (2003). However,
another method to handling the endogeneity has been used by Newey, Powell, and Vella (1999),
and is analogous to the control function approaches to two-stage least squares estimation to handle
endogeneity.9 To see specifically how it applies to the current set-up, consider the following form
of our base specification:
logA = g(U) + βX+ ξ (5)
where the effect of the control variables of equation (1) (including the GDP and manufacturing
controls, as well as the time and country effects) is now summarized in the vector X and the
coefficient vector β, and the subscripts are omitted for the moment. Our challenge is to address the
endogeneity of the used-clothing regressor, U . A key assumption implicit in the above specification
is the standard assumption that the error term, ξ, is additively separable from the nonparametric
function. Re-label our instrument for used-clothing imports as Z, so that:
U = r(Z) + β2X+ ν (6)
, where r is a nonparametric function. The additional assumptions required on the error terms
for the Newey, Powell and Vella (1999) procedure are that E[ξ|ν,Z] = E[ξ|ν], and E[ν|Z] = 0.
The first stage in the estimation procedure involves the semiparametric regression of equation (6)
to obtain the fitted residuals, bν. The second step involves the following semiparametric regression:logA = g(U) + βX+ h(bν) + η (7)
that is the regression of logA on the nonparametric functions, g(U), h(bν), as well as X. As in
Newey, Powell, and Vella (1999), we use series estimators to estimate the g and h functions. In
our case, a seventh-degree polynomial for each appears to suffice.9An early reference for the parametric control function approach is Dhrymes (1970).
19

The resulting estimate of g(U) is given in Figure 4. The confidence intervals are calculated
pointwise, using block bootstrap methods, sampling by country. The non-linearity present in the
simple nonparametric results again appears to be present, and appears to begin at a similar point,
around 0.1 kg per person. While there is also some evidence of a negative impact of used-clothing
imports on apparel production at extremely low levels of these imports, the confidence intervals
are much too wide at this level to make this assertion. On the other hand, the decrease in apparel
production beyond the 0.1 kg/capita point is statistically significant. That is, while a horizontal
line can be drawn within the confidence interval up to the 0.1kg/capita point, shortly beyond that
point, such a line would lie outside the confidence intervals. Since this specification controls for the
endogeneity of used-clothing imports, based on this figure, we can make the causal conclusion that
levels of used-clothing imports beyond 0.1kg per capita result in a decrease in apparel production.
While the appropriate test for significance of this relationship comes from the confidence intervals,
the magnitude of the relationship is given by the average slope along the region of the support above
0.1kg/capita point. This slope is -1.05. This is very similar in magnitude to the comparable slope
calculated for the simple nonparametric regression of Figure 3, which was -1.10. That is, beyond
0.1 kg/capita of used-clothing imports, there appears to be a roughly unitary elasticity between
used-clothing imports and apparel production. This is naturally larger than the results of Table
3, which capture the average magnitude of the overall impact of used-clothing donations across all
the points of the support of the distribution.
To this point, we have estimated the average elasticities of apparel production and employment
regarding used-clothing imports, and examined the levels at which these imports had the greatest
effect with the non-parametric regressions. In order to be more precise on the overall impact
of used-clothing imports, these results should be placed in the context of the decline in apparel
20

production over the sample period, which is done in Table 5. In the average African country,
apparel production declined on average 13% per year, with used-clothing imports responsible for
roughly 40% of the decline (using the linear-IV estimate of the causal impact, weighting each
country equally). Used-clothing imports had a greater relative impact on apparel employment. In
the average African country, apparel employment declined 9.6% per year during this period, with
roughly half of the decline a result of used-clothing imports.
Therefore, the impact is certainly sizeable. To find that a single cause is responsible for roughly
40% of the decline in production in one industry, and roughly 50% of the decline in employment
in that industry suggests that one has found a major source of decline in the apparel industry in
Africa over the period 1981-2000. However, I am certain that the a priori expectations of some
readers (and African apparel producers) placed the impact of used-clothing donations even higher
than this. For example, the impact was not constrained to be less than 100%. We can imagine
a context where other factors were having a positive impact on the apparel industry and were
causing it to grow. In such a context, the impact of used-clothing on apparel production could
have been even larger than the decline actually observed (resulting in an elasticity larger than -1),
since other factors were supporting apparel production. If this was one’s prior, then the impact we
find is not as considerable. On the other hand, while the apparel industry is a single industry, the
theoretical and historical importance of this industry has already been noted in the papers cited in
the Introduction, as well as Figures 1 and 2 referenced there. While the theoretical models and
historical experience for Africa may differ from those for other regions, other regions have certainly
found the apparel sector to play an important role in the early stages of development.
21

3 Conclusion
Initially, the collective wisdom held that sending free food to developing countries could do nothing
but help these countries, by increasing their incomes. The discovery that food aid could harm
food producers in poor countries was as much a discovery as it was important. Furthermore,
just as food aid clearly benefits the consumers of food, used-clothing imports clearly benefit the
consumers of used clothing, by making available lower cost apparel. Examining the impact of
used-clothing imports on textile and apparel production has been the purpose of this paper. Any
overall conclusions regarding national welfare would need to combine the impact on consumption
with the impact found here. To this point, the impact on consumption has been unmeasurable as
household surveys have not separated the purchases of used clothing from that of new clothing.
The first step of the paper was to establish the presence of a (negative) correlation between
used-clothing imports and apparel production in Africa. This correlation had not been established
previously, and so is interesting in its own right. Then, in order to identify the causal impact of used-
clothing imports on apparel and textile production, instrumental variables were used. Specifically,
the interaction between the proximity of OECD countries to a given African country and the
supply of used-clothing donations in the OECD countries considered to be geographically ‘near’ to
the African country was used to instrument for the used-clothing imports.
Using this instrument, the paper established that used-clothing imports had a significant nega-
tive impact on the textile and apparel production sectors in sub-Saharan African countries, being
responsible for roughly 39% of the annual decline in apparel production, and roughly half of the
annual decline in apparel employment. While this magnitude is considerable, it is also less than
100%, suggesting that other factors also hampered African apparel production. Another important
22

finding was that the impact of used-clothing imports was significantly non-linear. Imports of less
than 0.1kg per capita had virtually no impact on apparel production, but above the 0.1 kg per
capita threshold, the impact became substantial and significant, suggesting that if one limits the
importation of used clothing to the weight of one light t-shirt per person (or one-quarter of an
Oxford shirt or one-tenth of a pair of blue jeans), it is possible to have limited imports of used
clothing without a significant impact on the domestic apparel industry.
23

References
Altonji, J. and Card, D. E. (1991). ‘The Effects of Immigration on the Labor Market Outcomesof Less-Skilled Natives’, in (J. M. Abowd and R. B. Freeman, eds.), Immigration, Trade and theLabor Market, Chicago: University of Chicago Press.
Blundell, R. and Powell, J. L. (2003). ‘Endogeneity in Nonparametric and Semiparametric Regres-sion Models’, in (M. Dewatripont, et.al.), eds., Advances in Economics and Econometrics: Theoryand Publications, Eighth World Congress, Vol. II, Cambridge: Cambridge University Press.
Caselli, F. and Coleman, II, W. J. (2001). ‘The U.S. Structural Transformation and RegionalConvergence: A Reinterpretation’, Journal of Political Economy, vol. 109(3), pp. 584-616.
Chenery, H.B. (1960). ‘Patterns of Industrial Growth’, American Economic Review, vol. 50(4), pp.624-654.
Chenery, H.B. and Syrquin, M. (1975). Patterns of Development, 1950-1970, London: OxfordUniversity Press.
Chenery, H.B. and Syrquin, M. (1988). ‘Patterns of Development, 1950 to 1983’, World BankDiscussion Papers no. 41.
Collier, P. and Gunning, J.W. (1999). ‘Explaining African Economic Performance’, Journal ofEconomic Literature, vol. 37 (March), pp. 64-111.
Dhrymes, P. J. (1970). Econometrics: Statistical Foundations and Applications, New York:Springer-Verlag.
Easterly, W. and Levine, R. (1997). ‘Africa’s Growth Tragedy: Policies and Ethnic Divisions’,Quarterly Journal of Economics, vol. 112(4), pp. 1203-1250.
Fisher, F.M. (1963). ‘A Theoretical Analysis of the Impact of Food Surplus Disposal on AgriculturalProduction in Recipient Countries’, Journal of Farm Economics, vol. 45, pp. 863-75.
Frankel, J.A. and Romer, D. (1999). ‘Does Trade Cause Growth?’ American Economic Review,vol. 89(3) (June), pp. 379-399.
Gollin, D., Parente, S. and Rogerson, R. (2002). ‘The Role of Agriculture in Development’, Amer-ican Economic Review, vol. 92(2), pp. 160-164.
Haggblade, S. (1990). ‘The Flip Side of Fashion: Used Clothing Exports to the Third World’,Journal of Development Studies, vol. 26(3), pp. 505-521.
Hansen, K.T. (2000). Salaula: The World of Secondhand Clothing and Zambia, Chicago: Universityof Chicago Press.
Heckman, J.J. (1979). ‘Sample Selection Bias as Estimation Error’, Econometrica, vol. 47, pp.153-172.
Instituto del Tercer Mundo. (1999). The World Guide 1999/2000. Oxford: New InternationalistPublications.
24

Johnson, G.E. (1980). ‘The Labor Market Effects of Immigration’, Industrial and Labor RelationsReview, vol. 33(3), pp. 331-341.
Kuznets, S. (1971). Economic Growth of Nations: Total Output and Production Structure, Cam-bridge, MA: Harvard University Press.
Laitner, J. (2000). ‘Structural Change and Economic Growth’, Review of Economic Studies, vol.67(3), pp. 545-561.
Matsuyama, K. (1992). ‘A Simple Model of Sectoral Adjustment’, Review of Economic Studies,vol. 59(2), pp. 375-388.
McCormick, D., Kinyanjui, M.J. and Ongile, G. (1997). ‘Growth and Barriers to Growth AmongNairobi’s Small and Medium-Sized Garment Producers’, World Development, vol. 25(7), pp. 1095-1110.
Murphy, K. M., Shleifer, A. and Vishny, R. ‘Income Distribution, Market Size and Industrialization’,Quarterly Journal of Economics, vol. 104(3), pp.537-564.
Newey, W. K., Powell, J.L. and Vella, F. (1999). ‘Nonparametric Estimation of Triangular Simul-taneous Equations Models’, Econometrica, vol. 67, pp. 565-603.
Romalis, J. (2004). ‘Factor Proportions and the Structure of Commodity Trade’, American Eco-nomic Review, vol. 94(1) (March), pp. 67-97.
Sambanis, N. (2000). ‘Partition as a Solution to Ethnic War: An Empirical Critique of the Theo-retical Literature’, World Politics, vol. 52 (July), pp. 437-483.
Schultz, T.W. (1960). ‘Value of US Farm Surpluses to Underdeveloped Countries’, Journal of FarmEconomics, vol. 42, pp. 1019-30.
Silverman, B.W. (1986). Density Estimation for Statistics and Data Analysis, New York: Chapmanand Hall.
U.S. Department of Commerce (USDOC), International Trade Administration. (2003). U.S. AfricanTrade Profile, Washington, D.C.
U.S. International Trade Commission (USITC). (1999) U.S.-Africa Trade Flows and Effects of theUruguay Round Agreements and U.S. Trade and Development Policy. Washington, D.C.
U.S. Trade Representative (USTR). (2001). U.S. Trade and Investment Policy Toward Sub-SaharanAfrica and Implementation of the African Growth and Opportunity Act. Washington, D.C.
Ventura, J. ‘Growth and Interdependence’, Quarterly Journal of Economics, vol. 112 (February),pp. 57-84.
25


Figure 2 - Used-Clothing Export Trends - Selected Countries
-30.00
-20.00
-10.00
0.00
10.00
20.00
30.00
40.00
1981
1982
1983
1984
1985
1986
1987
1988
1989
1990
1991
1992
1993
1994
1995
1996
1997
1998
1999
2000
Year
Dev
iatio
n fr
om C
ount
ry M
ean
(Meg
aton
nes)
AustraliaBelgiumFranceGermanyUnited KingdomUSA


(1) (2) (3) (4) (5) (6) (7)
log (Used Clothing Imports -0.453*** -0.478*** -0.424*** -0.343** -0.163* -0.132* -0.123*per capita) (.131) (.092) (.092) (.116) (.094) (.072) (.069)
GDP per capita (PPP) 0.364*** 0.372*** 0.330*** 0.364*** 0.276** 0.943(.049) (.044) (.066) (.094) (.131) (.916)
(GDP per capita (PPP))2 -0.039(.053)
log (Non-Apparel Manufacturing 0.459 0.473Share of GDP) (.572) (.579)
With country fixed-effects + + + +
With time fixed-effects + + +
N 212 212 192 192 192 192 192R-squared 0.243 0.602 0.592 0.608 0.630 0.821 0.822
Notes:
Table 1Used-Clothing Trade and Apparel Production - Least Squares Results
The dependent variable is (log) apparel value-added share of GDP. Robust standard errors, which are
clustered at the country level, are in parentheses. The manufacturing value-added share of GDP variable
refers to the sum of all non-textile, non-apparel manufacturing. Coefficient estimates marked *, **, and ***
are significant at the 10% level, 5% level, and 1% level respectively.

colony 0.024**(.000)
Share Atlantic Ocean 0.003**(.001)
Share Pacific/Indian Ocean 0.0004*(.002)
log(population) 0.001*(.010)
log(area) 0.0002*(.001)
Landlocked -0.003**(.000)
Sample Size 16439R-squared 0.0733
Notes:
Table 2The Used-Clothing Trade Equation
The above regression is a least-squres regression of the used-clothing
exports to country i as a share of total used-clothing exports from
country j as the dependent variable. The impact of each of the
regressors above is allowed to vary over time. Therefore, the coefficient
shown above is the average impact of the variable measured across the
years of the dataset. Below each coefficient is the p-value for an F-test
that the variable has no impact in any of the years of the data. Based
on the p-values of the F-test, coefficient estimates are marked * and **
for significance at the 5% and 1% levels, respectively.

(1) (2) (3) (4) (5)
log (Used Clothing Imports -0.551** -0.650** -0.613** -0.619* -0.606**per capita) (.234) (.257) (.259) (.334) (.287)
GDP per capita (PPP) 0.367*** 0.394*** 0.387*** 0.382*** 0.367**(.043) (.113) (.104) (.108) (.167)
log (Non-Apparel Manufacturing -0.057Share of GDP) (.731)
Country fixed-effects + + + +
Time fixed-effects + +
N 212 212 192 212 192R-squared 0.596 0.622 0.782 0.843 0.794
First Stage:
log(Constructed Per Capita 0.493*** 1.766*** 1.812*** 4.208*** 4.323***Used-Clothing imports) (.113) (.177) (.185) (.957) (.974)
F-stat 19.21 99.54 96.39 19.35 19.72
Notes:
Used-Clothing Trade and Apparel Production - IV ResultsTable 3
The dependent variable is (log) apparel value-added share of GDP. Robust standard errors, which are clustered at the country level, are in parentheses. All columns are IV regressions. The coefficient on the instrument in the first-stage regression is given in the relevant column in the lower half of the table, as well as the relevant F-statistic. The manufacturing value-added share of GDP variable refers to the sum of all non-textile, non-apparel manufacturing. * Significant at the 10% level, ** 5%, *** 1%.
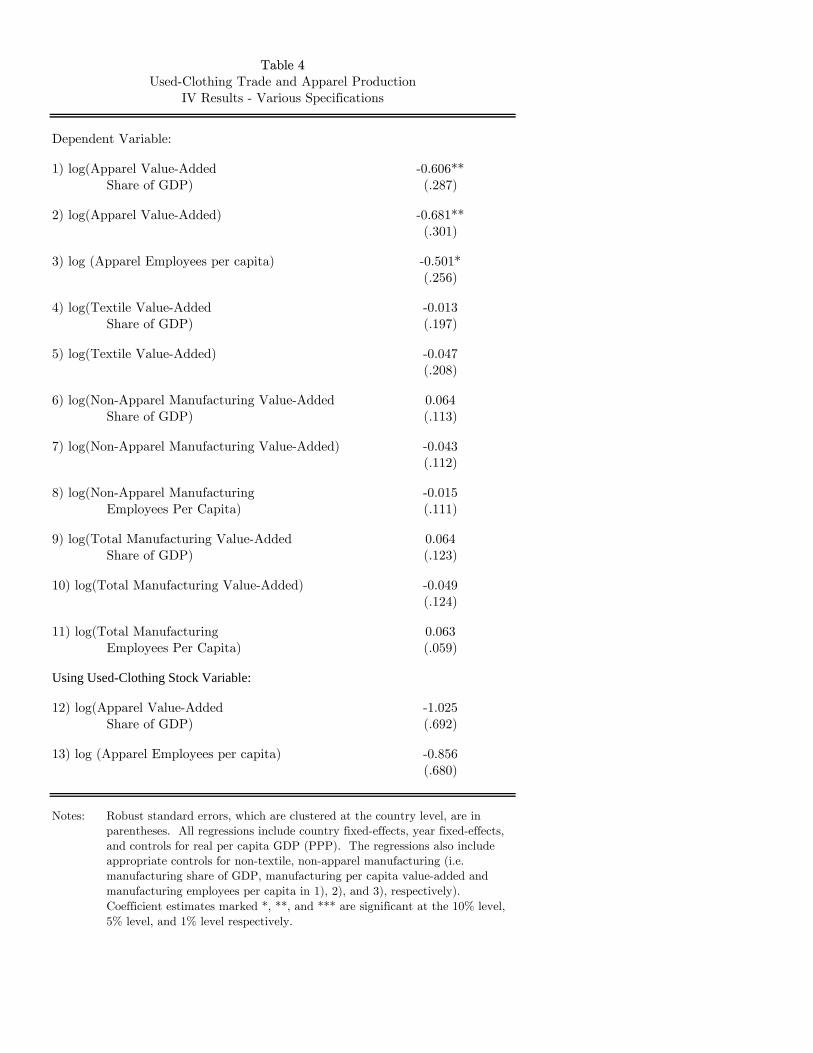
Table 4Used-Clothing Trade and Apparel Production
IV Results - Various Specifications
Dependent Variable:
1) log(Apparel Value-Added -0.606**Share of GDP) (.287)
2) log(Apparel Value-Added) -0.681**(.301)
3) log (Apparel Employees per capita) -0.501*(.256)
4) log(Textile Value-Added -0.013Share of GDP) (.197)
5) log(Textile Value-Added) -0.047(.208)
6) log(Non-Apparel Manufacturing Value-Added 0.064Share of GDP) (.113)
7) log(Non-Apparel Manufacturing Value-Added) -0.043(.112)
8) log(Non-Apparel Manufacturing -0.015 Employees Per Capita) (.111)
9) log(Total Manufacturing Value-Added 0.064Share of GDP) (.123)
10) log(Total Manufacturing Value-Added) -0.049(.124)
11) log(Total Manufacturing 0.063 Employees Per Capita) (.059)
Using Used-Clothing Stock Variable:
12) log(Apparel Value-Added -1.025Share of GDP) (.692)
13) log (Apparel Employees per capita) -0.856(.680)
Notes: Robust standard errors, which are clustered at the country level, are in parentheses. All regressions include country fixed-effects, year fixed-effects, and controls for real per capita GDP (PPP). The regressions also include appropriate controls for non-textile, non-apparel manufacturing (i.e. manufacturing share of GDP, manufacturing per capita value-added and manufacturing employees per capita in 1), 2), and 3), respectively). Coefficient estimates marked *, **, and *** are significant at the 10% level, 5% level, and 1% level respectively.

Table 5Measuring the Impact of Used-Clothing Imports
on Apparel Production
Average OverallChange in Production Average
Resulting from Change inUsed-Clothing Imports Production
Dependent Variable:
1) log(Apparel Value-Added -0.052 -0.133Share of GDP) (38.8%)
2) log(Apparel Employees -0.047 -0.096per capita) (49.4%)