Embed Size (px)
Citation preview
6
Explain about alloy formation
Interpret a phase diagram
Describe phases in a phase diagram
Use phase rule, tie line and lever rule to predict and
calculate the composition and weight fraction of phases
Distinguish different isothermal reactions in phase
diagrams
3-2
Phases and the Phase Diagram
Solubility and Solid Solutions
Determination of Phase Diagrams
Isomorphous Binary Phase Diagram
Binary Eutectic Phase Diagram
3-3
A material can exist in many forms depending on: temperature, pressure and composition
The properties of a material also depend on the microstructure, which in turn depends on the type, number and form of phases present
In order to understand phase transformations, a means of representing which phases are stable at what temperatures is required
This information is easily understood graphically in what is known as a “phase diagram”. A phase diagram is simply a chart which shows which phase(s) are stable under which conditions.
3-4
3-5
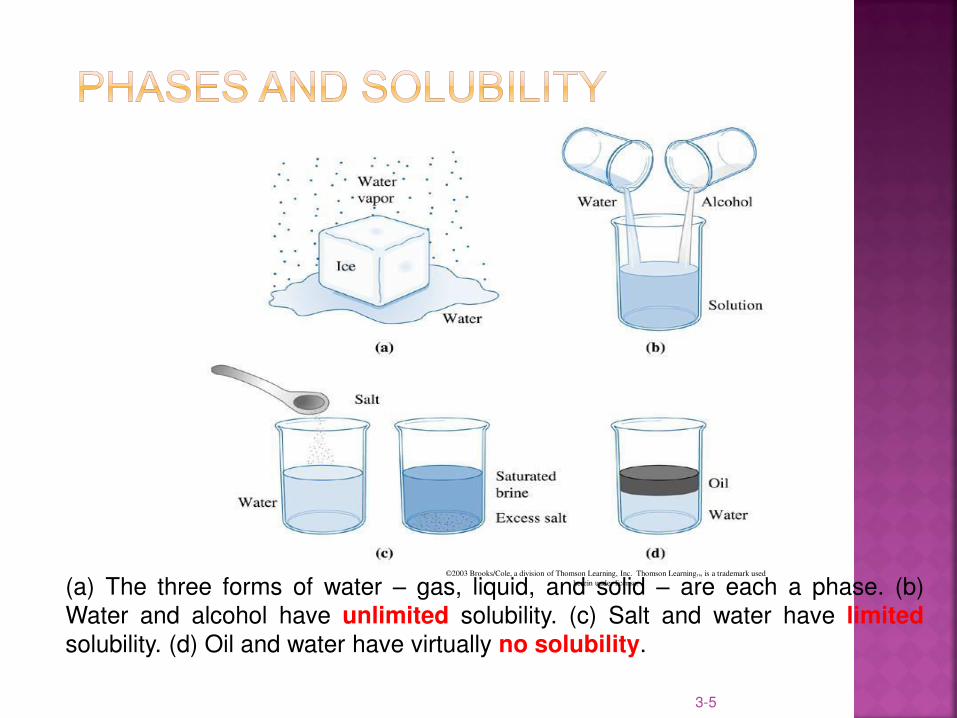
©2003 Brooks/Cole, a division of Thomson Learning, Inc. Thomson Learning™ is a trademark used
herein under license. (a) The three forms of water – gas, liquid, and solid – are each a phase. (b)
Water and alcohol have unlimited solubility. (c) Salt and water have limited
solubility. (d) Oil and water have virtually no solubility.
Three variables need to be specified in order to specify that a system is in equilibrium
Temperature
Pressure
Composition
Equilibrium conditions
The system is at a minimum free energy
Characteristics of the system will not change with time
3-6
If the temperature, pressure or composition change, the
free energy will change
With pressure assumed constant at atmospheric value:
hence phase diagrams indicate any structural change
due to variations in temperature & composition
If the type, form and number of these phases are
changed, then the properties are changed.
3-7
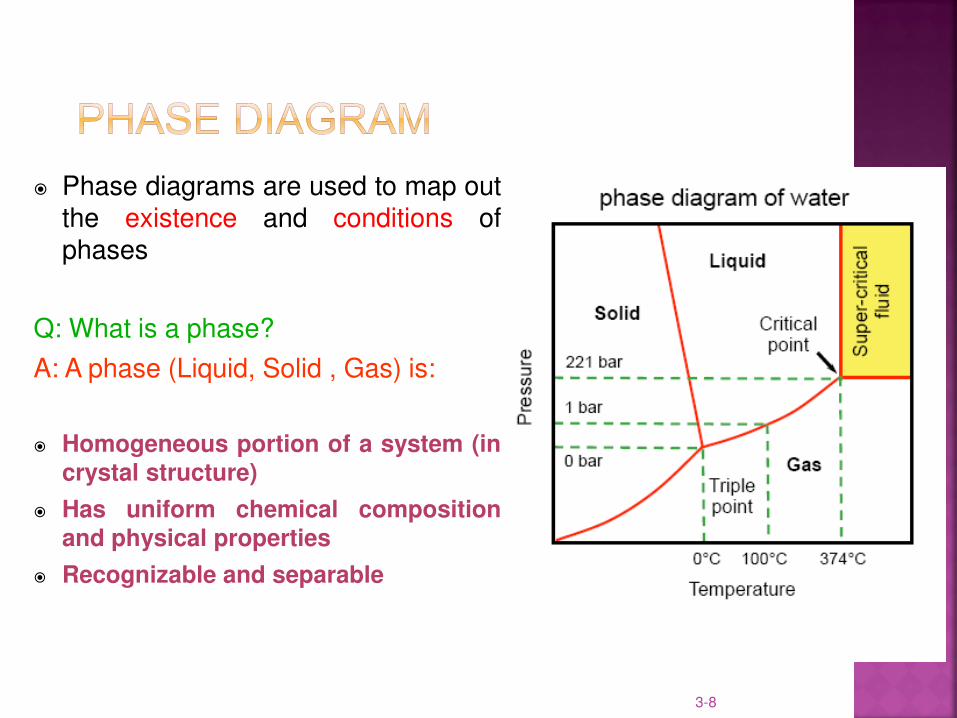
Phase diagrams are used to map out the existence and conditions of phases
Q: What is a phase?
A: A phase (Liquid, Solid , Gas) is:
Homogeneous portion of a system (in
crystal structure)
Has uniform chemical composition
and physical properties
Recognizable and separable
3-8
There are 3 types of phase diagrams based on the number of independent chemical components into:
Single component systems (unary phase diagram)
Two component systems (binary phase diagrams)
Three component systems (ternary phase diagrams)
Q: What is a component?
A: A component which can be a pure metal or a compound (in
ceramics) is a pure substance required to express composition of phases in the system
3-9
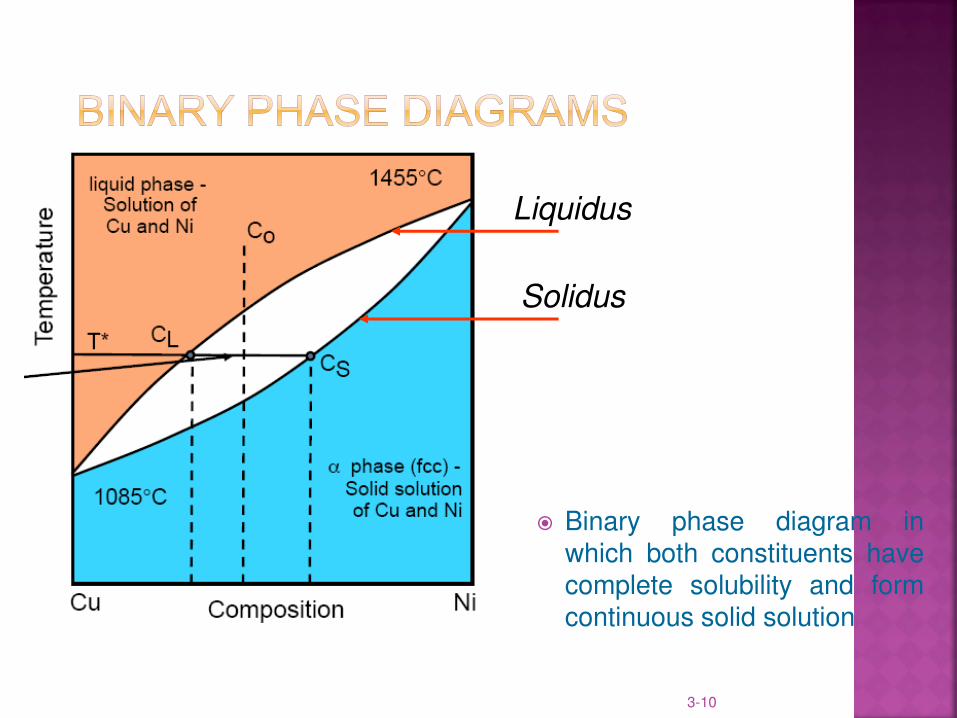
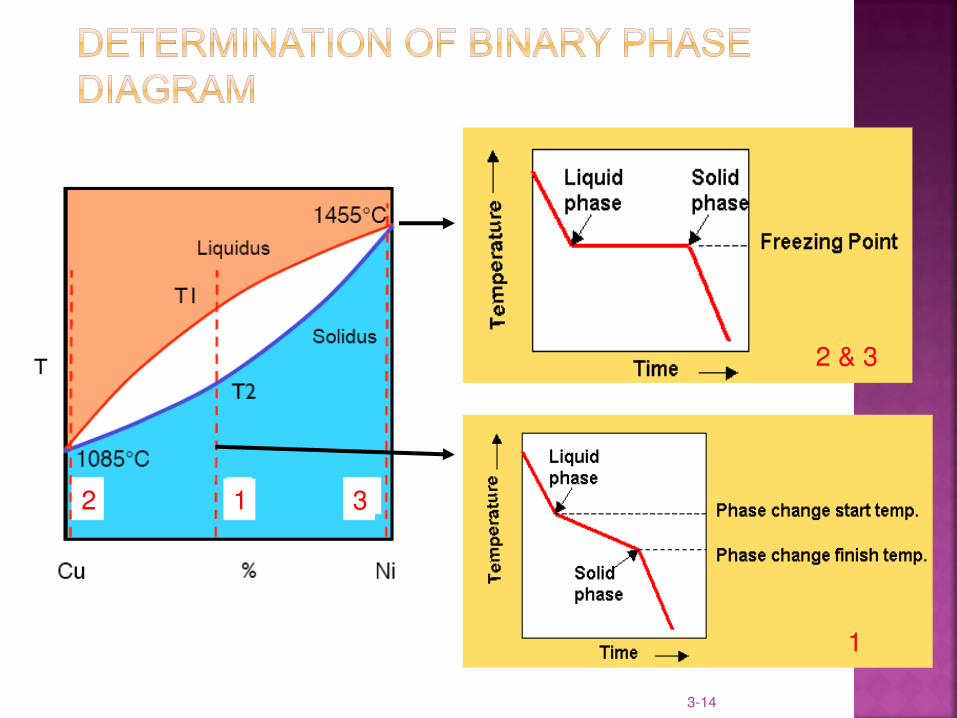
Binary phase diagram in which both constituents have complete solubility and form continuous solid solution
3-10
Liquidus
Solidus
Solid solution is made of two parts:
Solvent (matrix) or major part which dissolves the solute
Solute is the minor part of the solution which is dissolved (impurity)
There is a difference between solution and mixture
A solution is a single homogeneous phase of variable composition
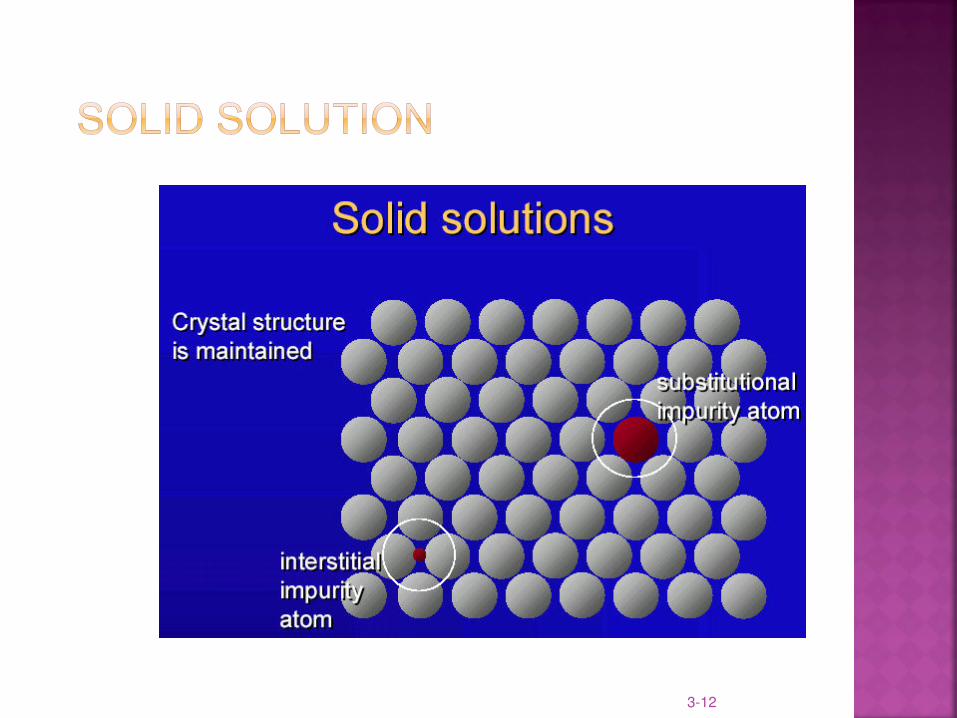
A solution maintains the original crystal structure
A solution contains randomly dispersed impurities (substitutional or interstitial)
A mixture is heterogeneous (more than one phase present)
3-11
3-12
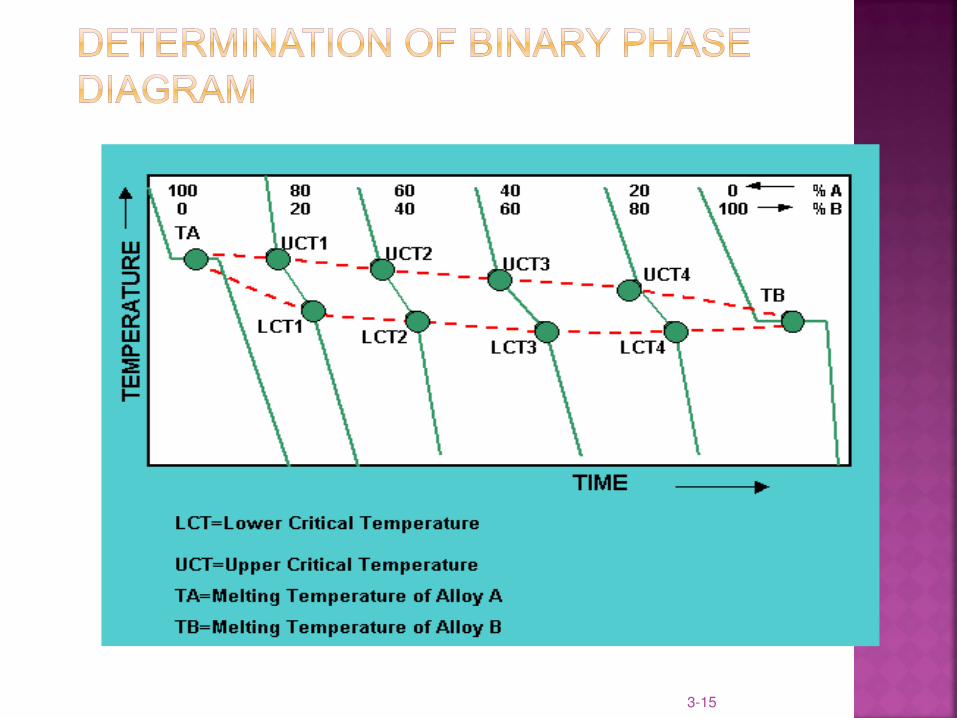
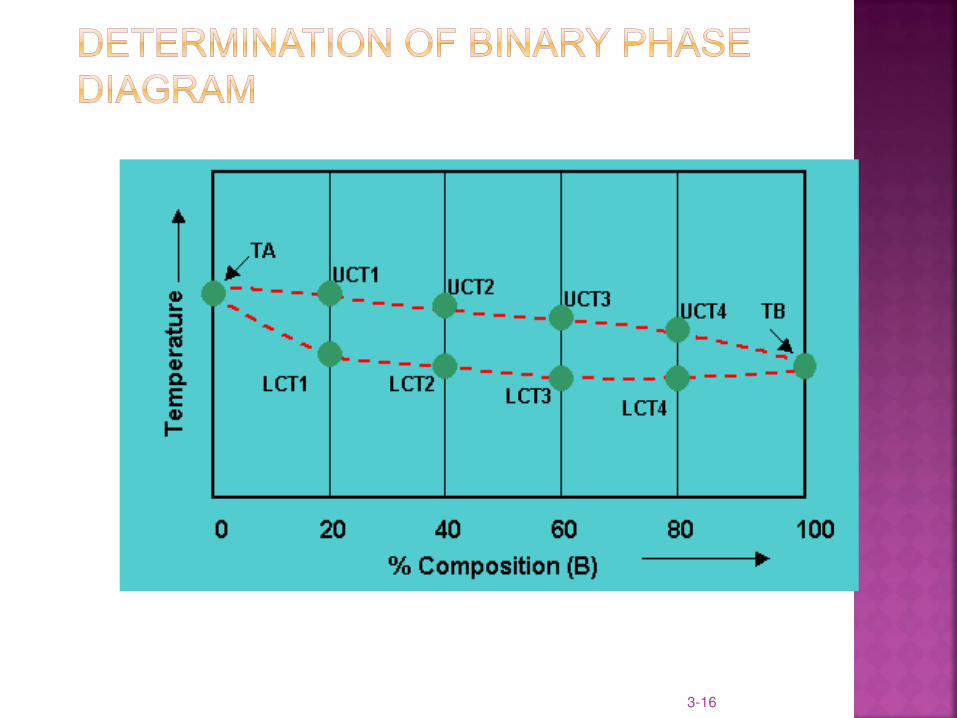
Several methods are used to determine the data for constructing phase diagrams:
Metallographic methods
X-ray diffraction (XRD)
Thermal Analysis (the most widely used)
Thermal Analysis
Information is obtained from cooling curves
This is achieved by melting mixtures of known compositions and then measure the temperature of these mixtures while cooling to room temperature
3-13
3-14
2 & 3
1
2 1 3
3-15
3-16
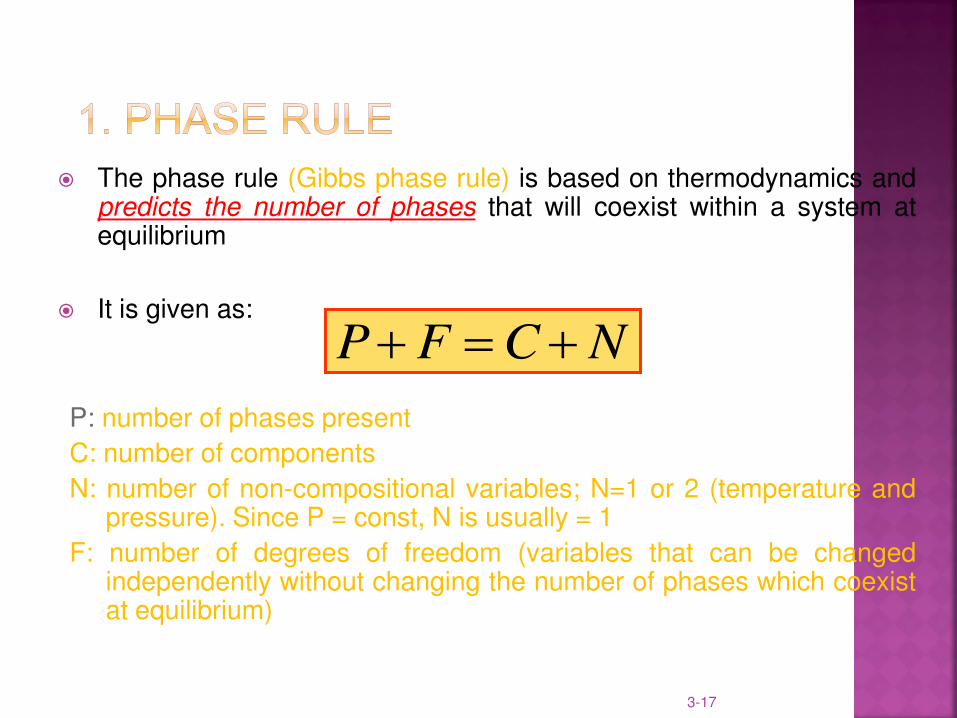
The phase rule (Gibbs phase rule) is based on thermodynamics and predicts the number of phases that will coexist within a system at equilibrium
It is given as:
P: number of phases present
C: number of components
N: number of non-compositional variables; N=1 or 2 (temperature and pressure). Since P = const, N is usually = 1
F: number of degrees of freedom (variables that can be changed independently without changing the number of phases which coexist at equilibrium)
NCFP
3-17
3-18
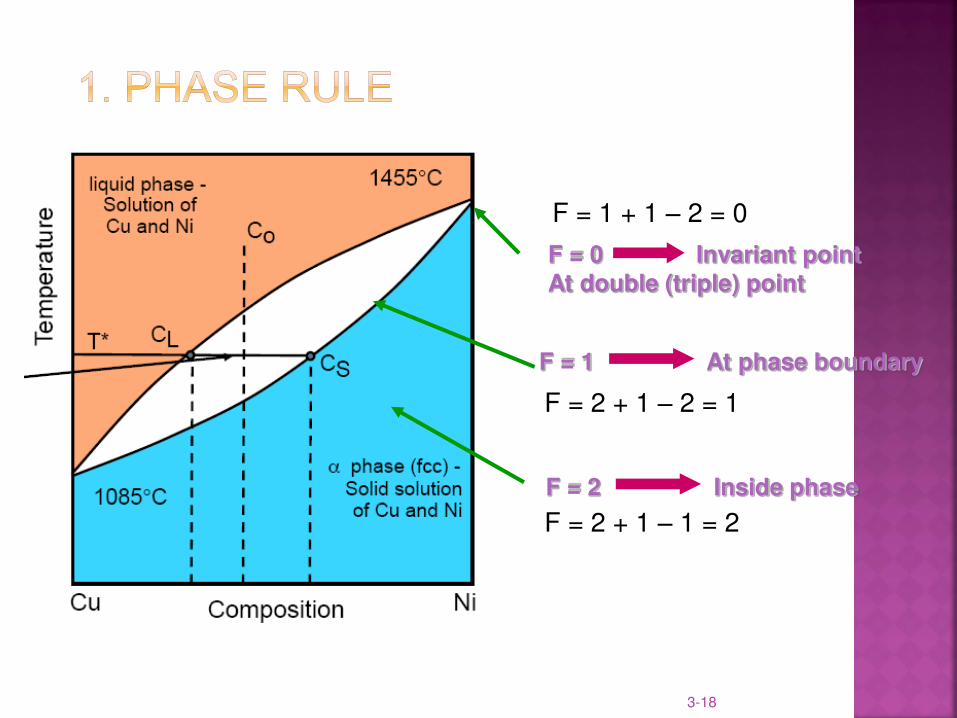
F = 0 Invariant point
At double (triple) point
F = 1 At phase boundary
F = 2 Inside phase
F = 1 + 1 – 2 = 0
F = 2 + 1 – 2 = 1
F = 2 + 1 – 1 = 2
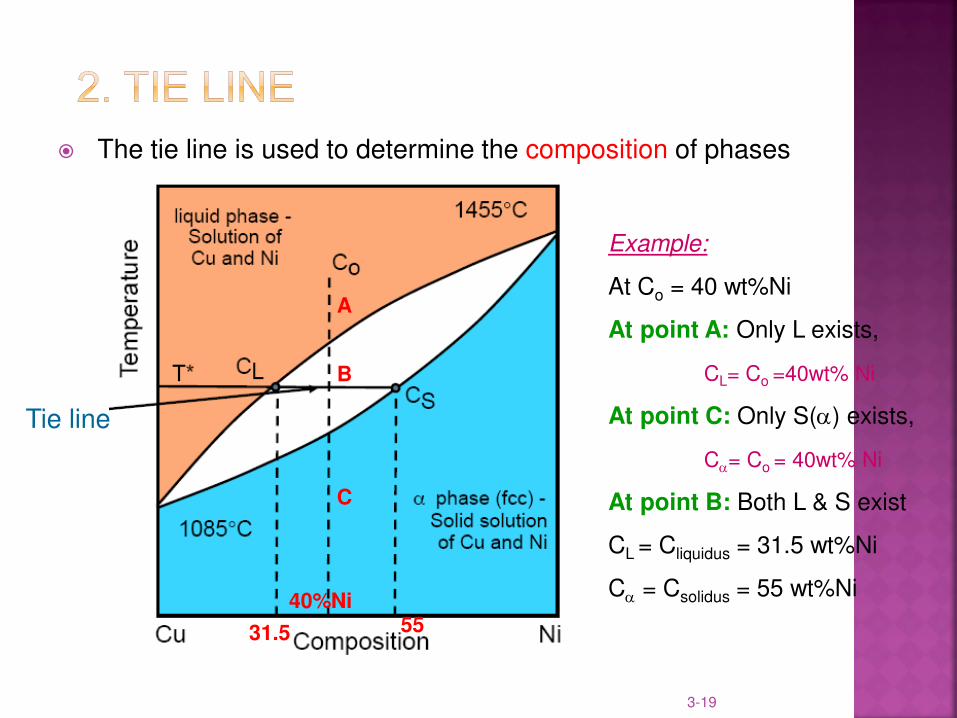
The tie line is used to determine the composition of phases
3-19
Tie line
Example:
At Co = 40 wt%Ni
At point A: Only L exists,
CL= Co =40wt% Ni
At point C: Only S() exists,
C= Co = 40wt% Ni
At point B: Both L & S exist
CL = Cliquidus = 31.5 wt%Ni
C = Csolidus = 55 wt%Ni 40%Ni
A
B
C
31.5 55
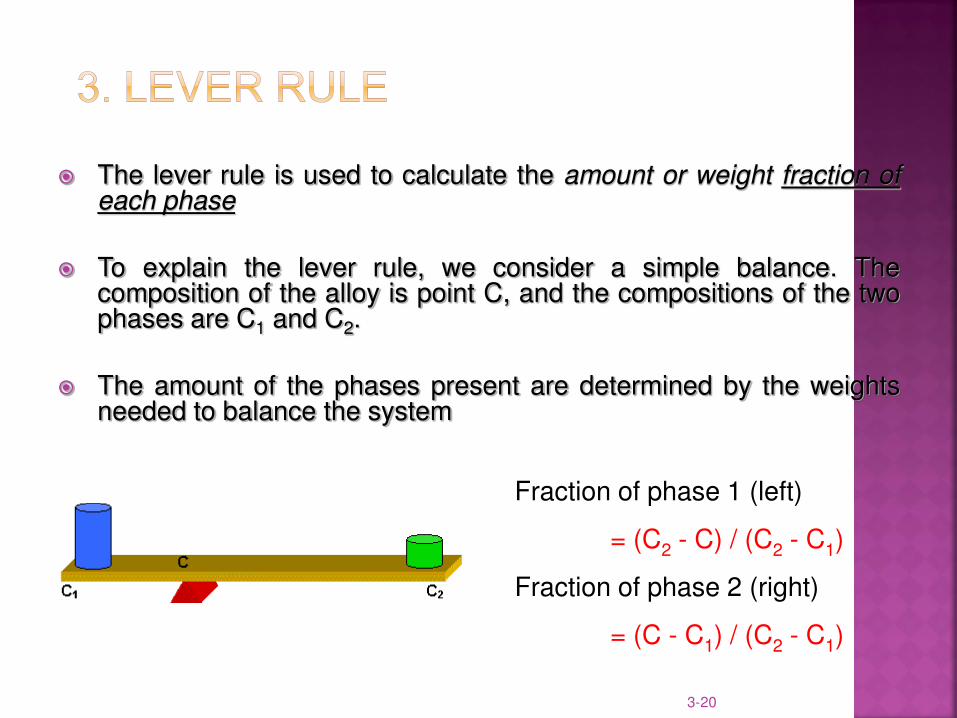
The lever rule is used to calculate the amount or weight fraction of each phase
To explain the lever rule, we consider a simple balance. The composition of the alloy is point C, and the compositions of the two phases are C1 and C2.
The amount of the phases present are determined by the weights needed to balance the system
3-20
Fraction of phase 1 (left)
= (C2 - C) / (C2 - C1)
Fraction of phase 2 (right)
= (C - C1) / (C2 - C1)
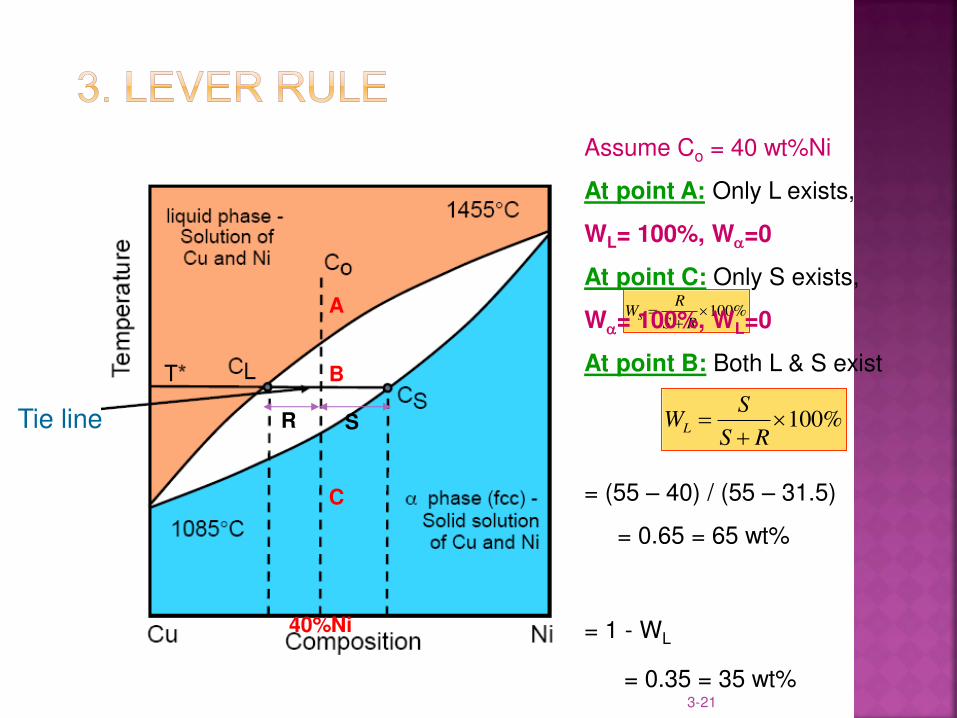
RS
SWL
%100
RS
RWS
%100
RS
SWL
3-21
Tie line
Assume Co = 40 wt%Ni
At point A: Only L exists,
WL= 100%, W=0
At point C: Only S exists,
W= 100%, WL=0
At point B: Both L & S exist
= (55 – 40) / (55 – 31.5)
= 0.65 = 65 wt%
= 1 - WL
= 0.35 = 35 wt%
40%Ni
A
B
C
S R
3-22
Binary phase diagrams are categorized as:
Binary isomorphous (complete liquid and solid
solubility)
Binary eutectic with limited solid solubility
Binary eutectic with no solid solubility
Eutectoid binary diagrams
Peritectic Binary diagrams
Phase diagrams with Intermediate phases
3-23
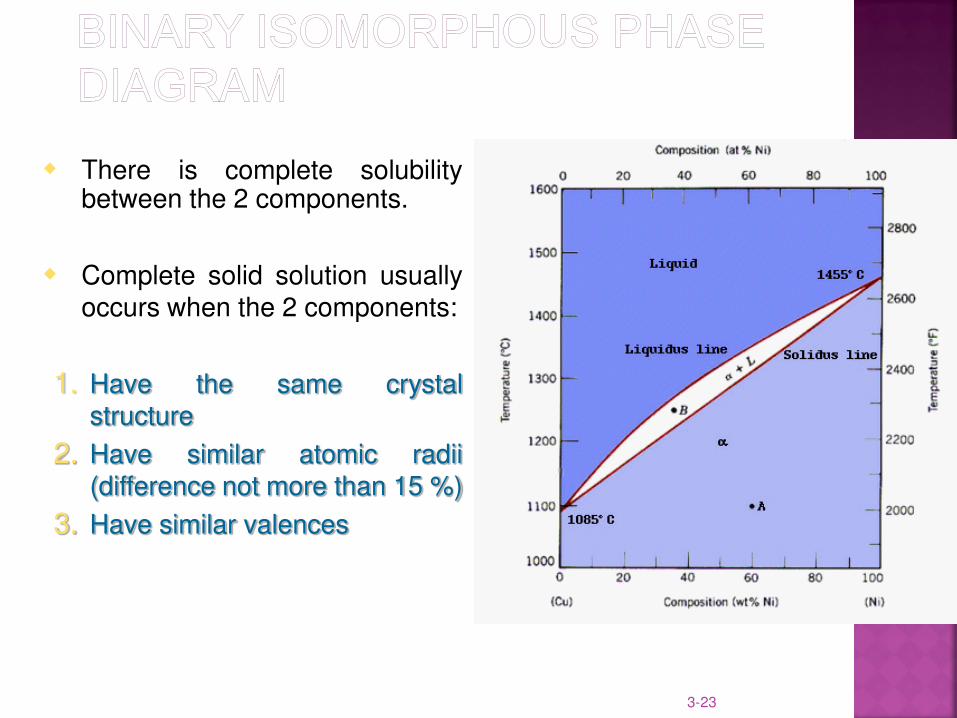
There is complete solubility between the 2 components.
Complete solid solution usually occurs when the 2 components:
1. Have the same crystal structure
2. Have similar atomic radii (difference not more than 15 %)
3. Have similar valences
3-24
L
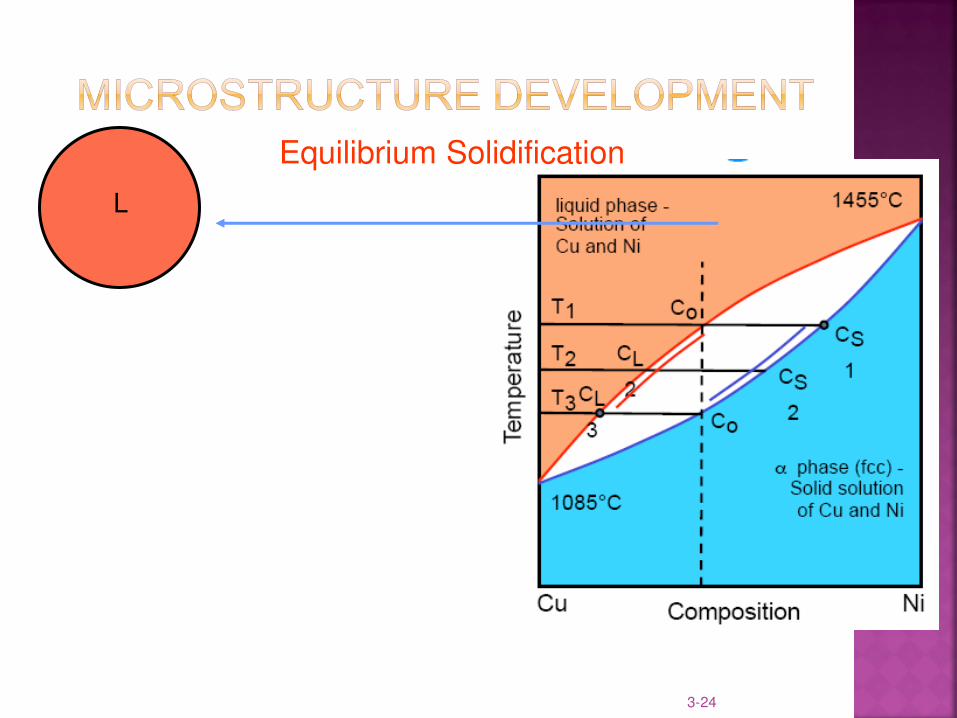
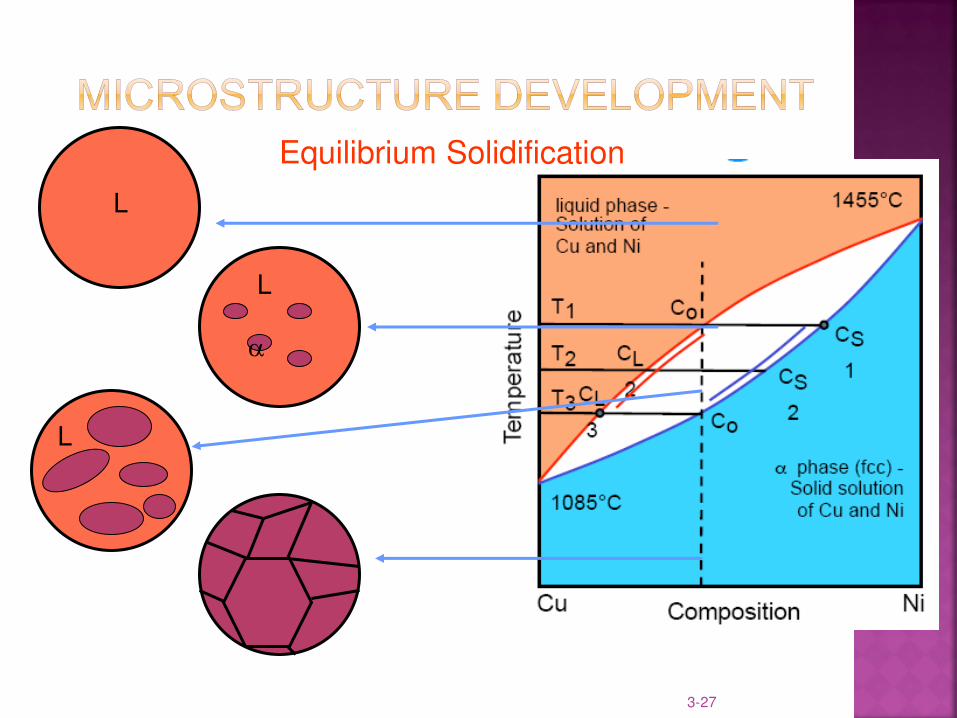
Equilibrium Solidification
3-25
L
L
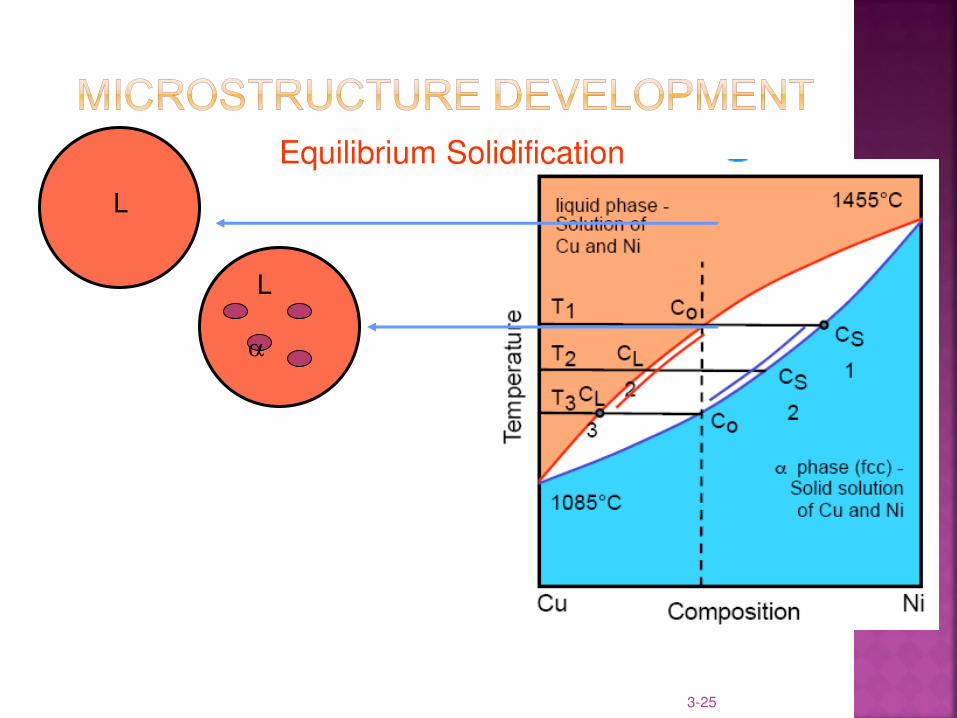
Equilibrium Solidification
3-26
L
L
L
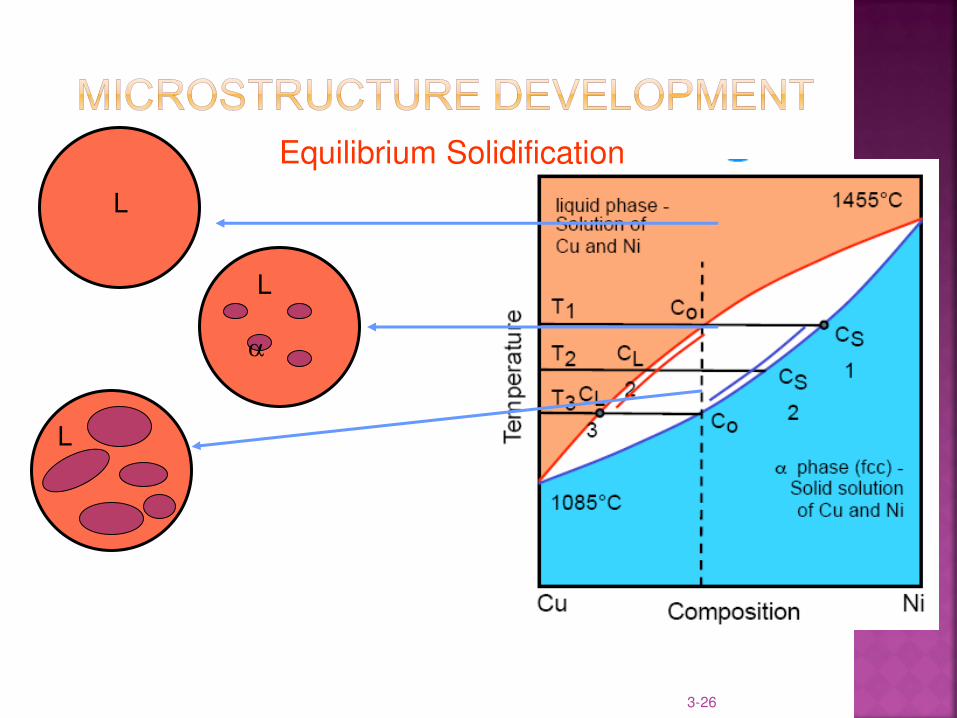
Equilibrium Solidification
3-27
L
L
L
Equilibrium Solidification
3-2
8
©2003 Brooks/Cole, a division of Thomson Learning, Inc. Thomson Learning™ is a trademark used herein under license.
A
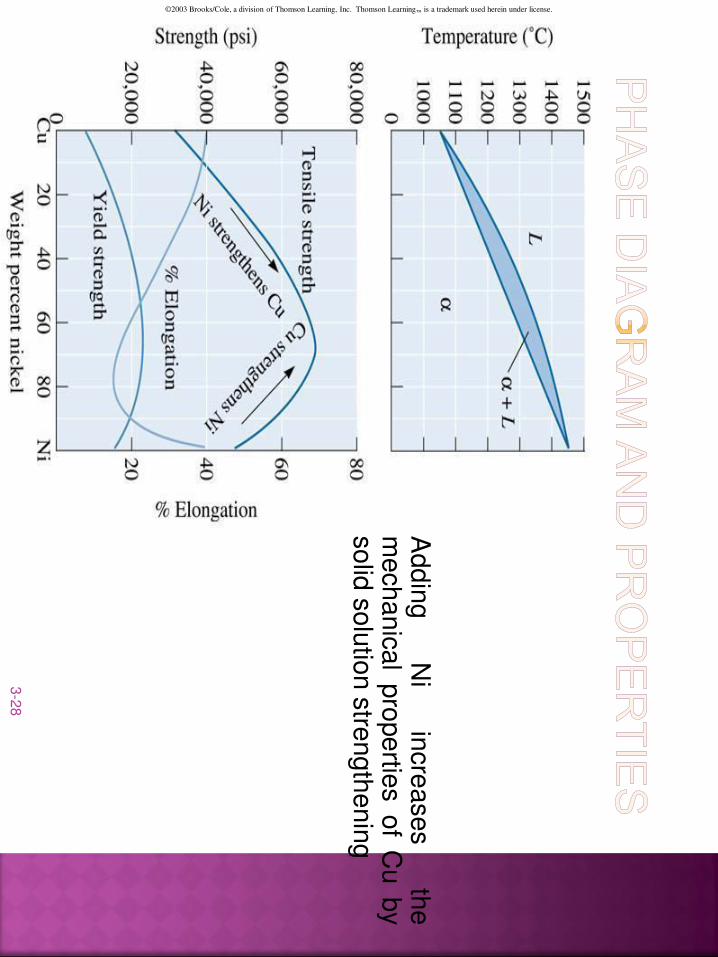
dd
ing
N
i in
cre
ase
s
the
me
ch
an
ica
l pro
pe
rties o
f C
u b
y
solid
solu
tion
stre
ngth
enin
g
3-29
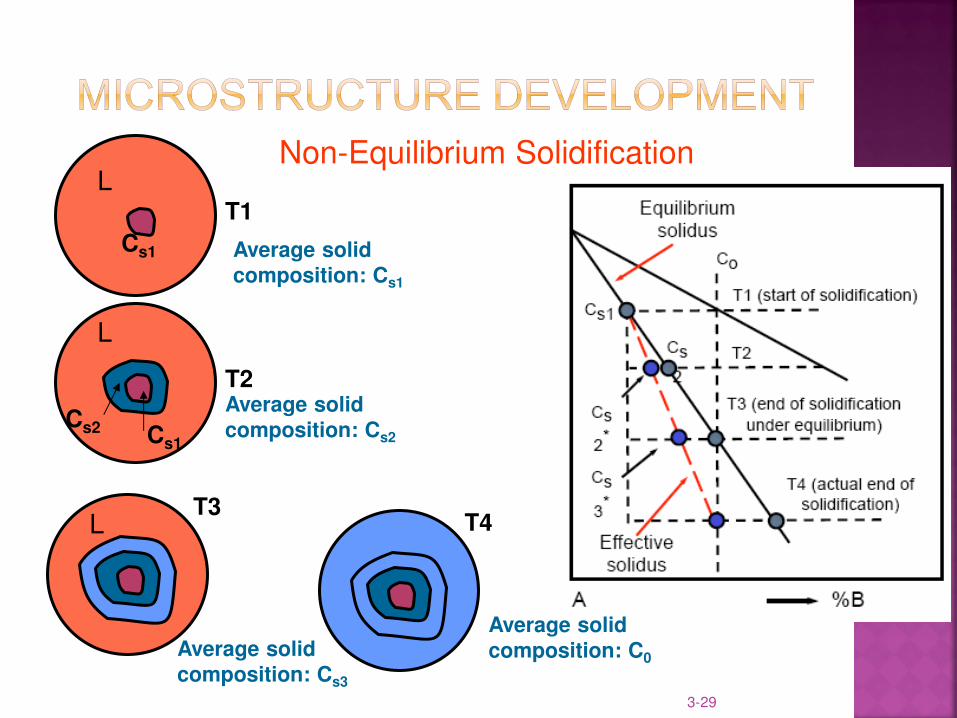
Non-Equilibrium Solidification L
T1
L
T2
L T3
T4
Cs1
Cs2 Cs1
Average solid
composition: Cs1
Average solid
composition: Cs3
Average solid
composition: Cs2
Average solid
composition: C0
3-30
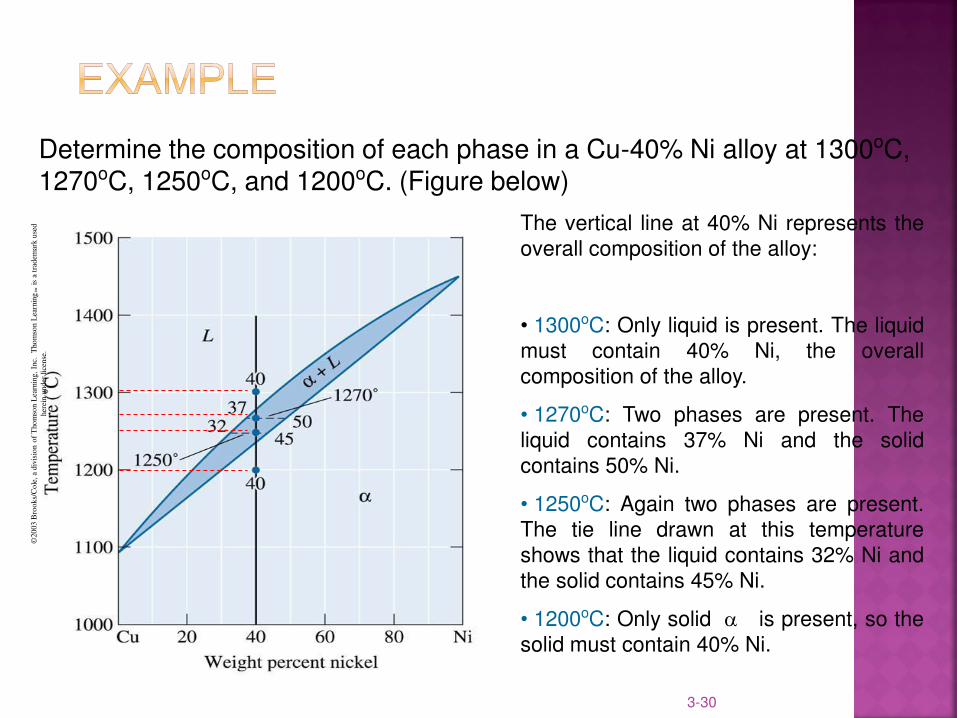
Determine the composition of each phase in a Cu-40% Ni alloy at 1300oC, 1270oC, 1250oC, and 1200oC. (Figure below)
©20
03 B
roo
ks/
Co
le, a
div
isio
n o
f T
ho
mso
n L
earn
ing,
Inc.
T
ho
mso
n L
earn
ing™
is
a tr
adem
ark u
sed
her
ein u
nder
lic
ense
.
The vertical line at 40% Ni represents the
overall composition of the alloy:
• 1300oC: Only liquid is present. The liquid
must contain 40% Ni, the overall
composition of the alloy.
• 1270oC: Two phases are present. The
liquid contains 37% Ni and the solid
contains 50% Ni.
• 1250oC: Again two phases are present.
The tie line drawn at this temperature
shows that the liquid contains 32% Ni and
the solid contains 45% Ni.
• 1200oC: Only solid is present, so the
solid must contain 40% Ni.
3-31
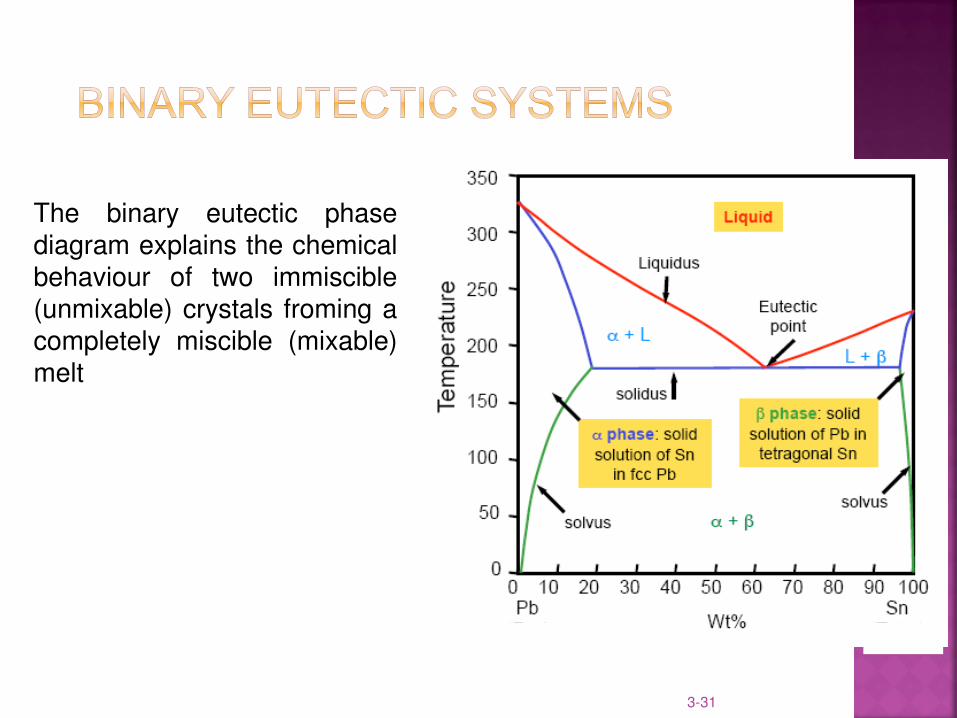
The binary eutectic phase diagram explains the chemical behaviour of two immiscible (unmixable) crystals froming a completely miscible (mixable) melt
3-32
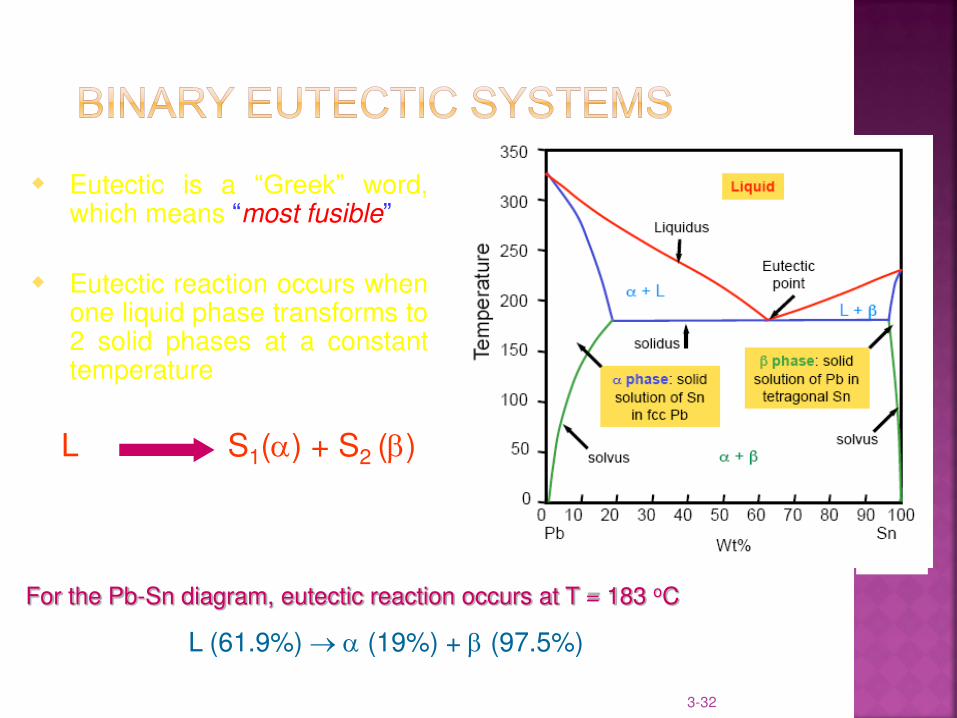
Eutectic is a “Greek” word, which means “most fusible”
Eutectic reaction occurs when one liquid phase transforms to 2 solid phases at a constant temperature
L S1() + S2 ()
For the Pb-Sn diagram, eutectic reaction occurs at T = 183 oC
L (61.9%) (19%) + (97.5%)
3-33
1
L
L
3-34
2
L
L
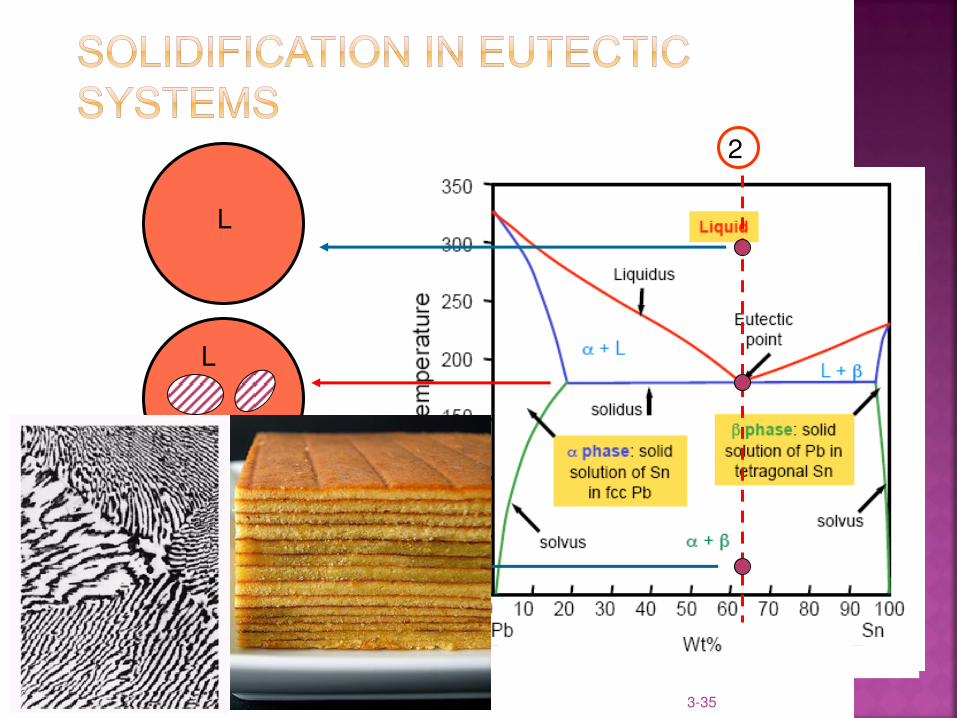
3-35
2
L
L
3-36
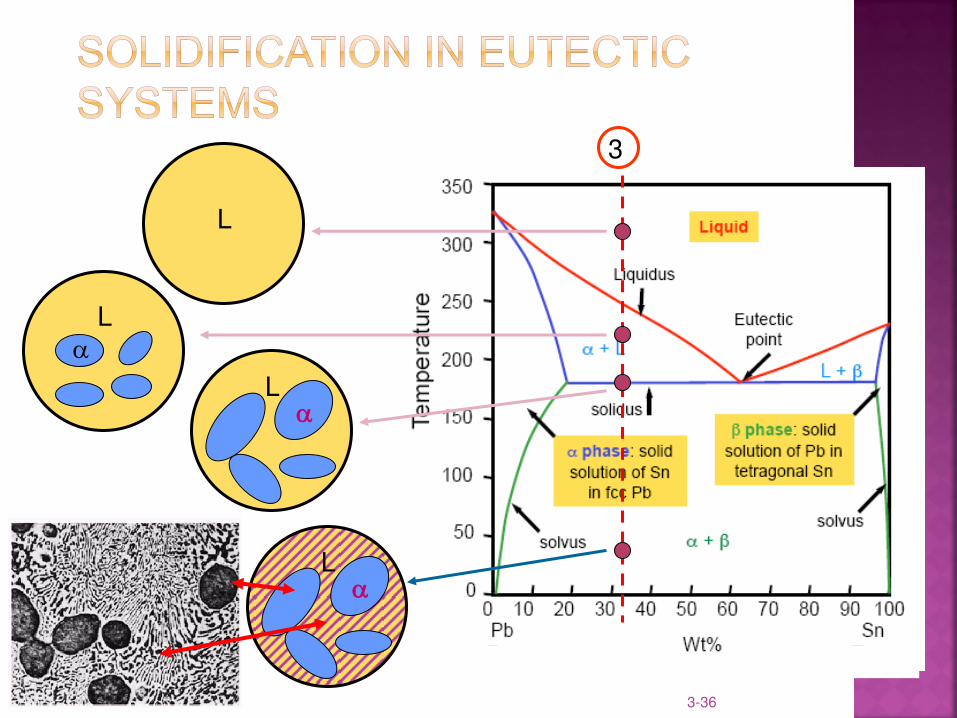
3
L
L
L
L
L
3-37
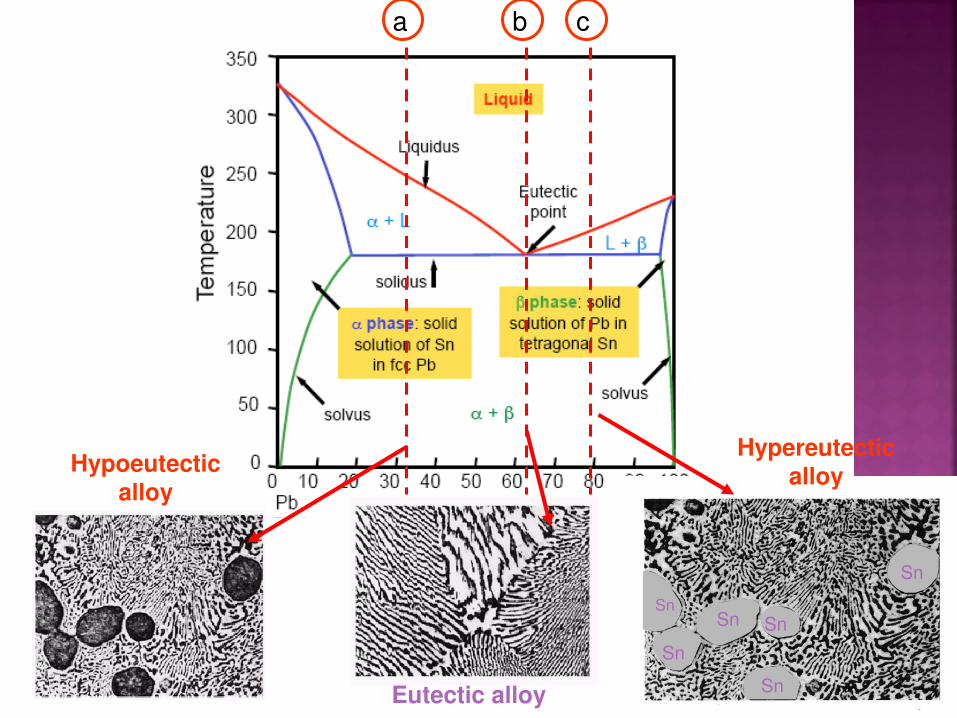
a b c
Sn
Sn
Sn
Sn Sn
Sn
Hypereutectic
alloy Hypoeutectic
alloy
Eutectic alloy
3-38
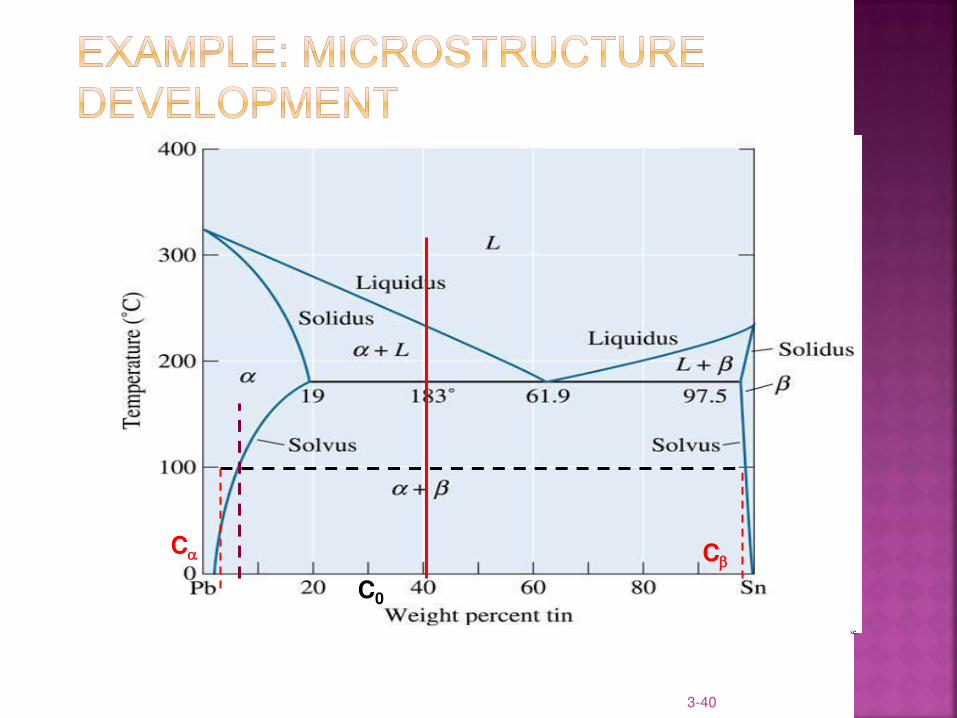
Melting points of Lead (Pb) and tin (Sn) are 327oC and 231oC respectively. The system is completely soluble in LIQUID but partially soluble in SOLID. The maximum solubility of Sn in Pb is 19%Sn, while maximum solubility of Pb in Sn is 2.7%Pb. The eutctic reaction occurs at 183oC of composition 61.9%Sn.
i. Construct the phase diagram of this system
3-39
Determine (a) the solubility of Sn in solid Pb at 100oC, (b)
the maximum solubility of Pb in solid Sn and of Sn in solid
Pb, (c) phases present if a Pb-40% Sn alloy is cooled to
room temperature, (d) compositions of these phases, (e)
the amount of β that forms if a Pb-40% Sn alloy is cooled to
room temperature.
3-40
(c)2003 Brooks/Cole, a division of Thomson Learning, Inc. Thomson Learning™ is a trademark used herein under license.
C0
C C
3-41
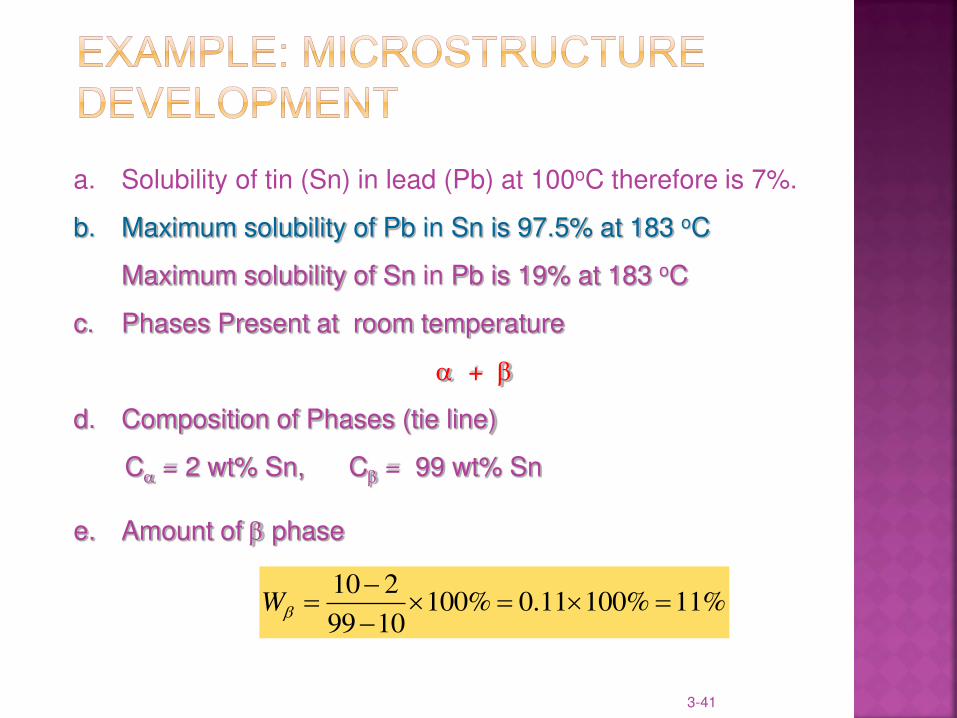
%11%10011.0%1001099
210
W
a. Solubility of tin (Sn) in lead (Pb) at 100oC therefore is 7%.
b. Maximum solubility of Pb in Sn is 97.5% at 183 oC
Maximum solubility of Sn in Pb is 19% at 183 oC
c. Phases Present at room temperature
+
d. Composition of Phases (tie line)
C = 2 wt% Sn, C = 99 wt% Sn e. Amount of phase
3-42
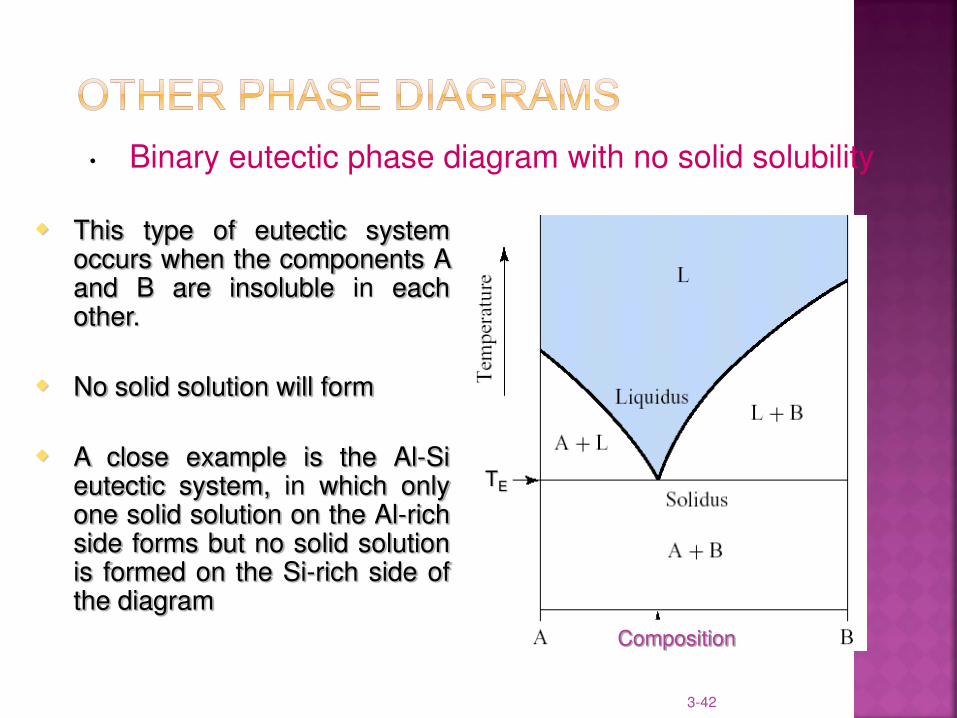
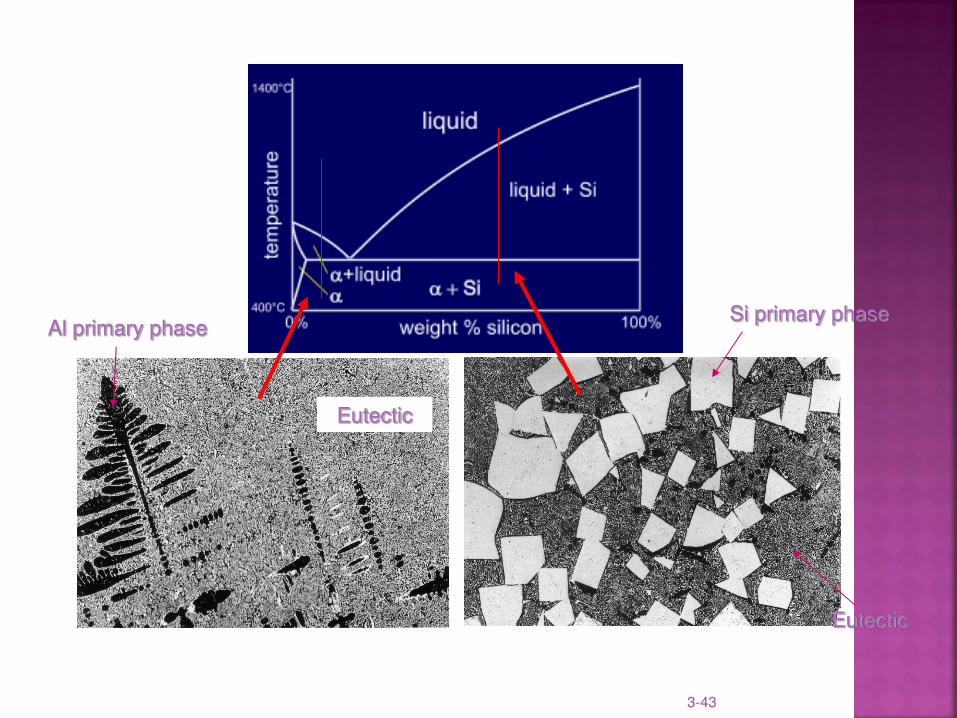
• Binary eutectic phase diagram with no solid solubility
Composition
TE
This type of eutectic system occurs when the components A and B are insoluble in each other.
No solid solution will form
A close example is the Al-Si eutectic system, in which only one solid solution on the Al-rich side forms but no solid solution is formed on the Si-rich side of the diagram
3-43
Si primary phase
Eutectic
Al primary phase
Eutectic
3-44
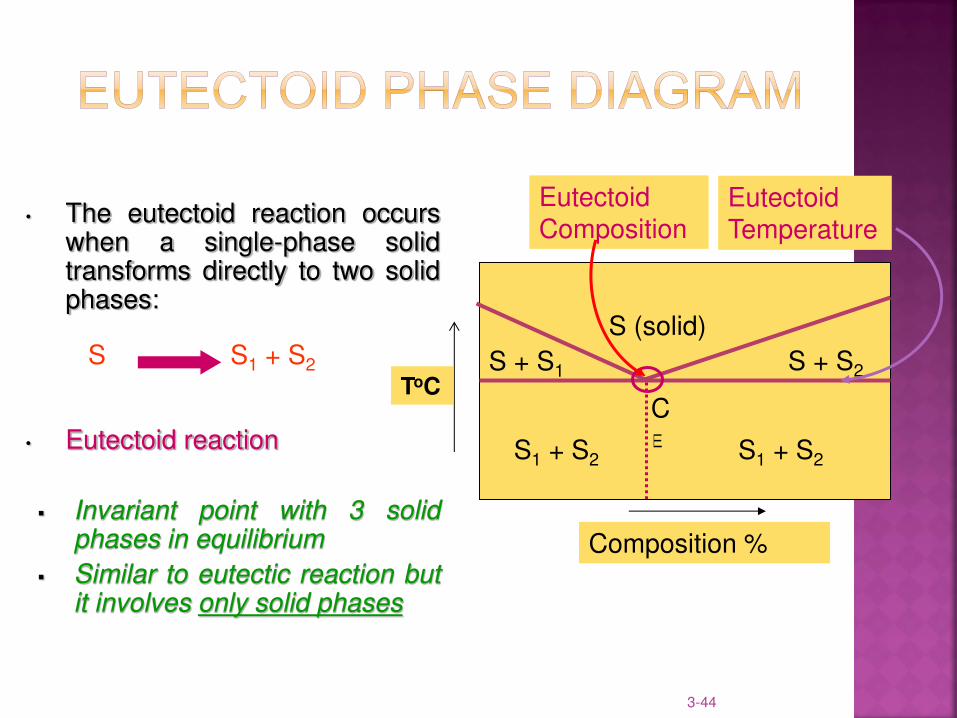
• The eutectoid reaction occurs when a single-phase solid transforms directly to two solid phases:
• Eutectoid reaction
Invariant point with 3 solid phases in equilibrium
Similar to eutectic reaction but it involves only solid phases
S S1 + S2
Eutectoid
Composition Eutectoid Temperature
CE
S (solid)
S + S1 S + S2
S1 + S2 S1 + S2
Composition %
ToC
3-45
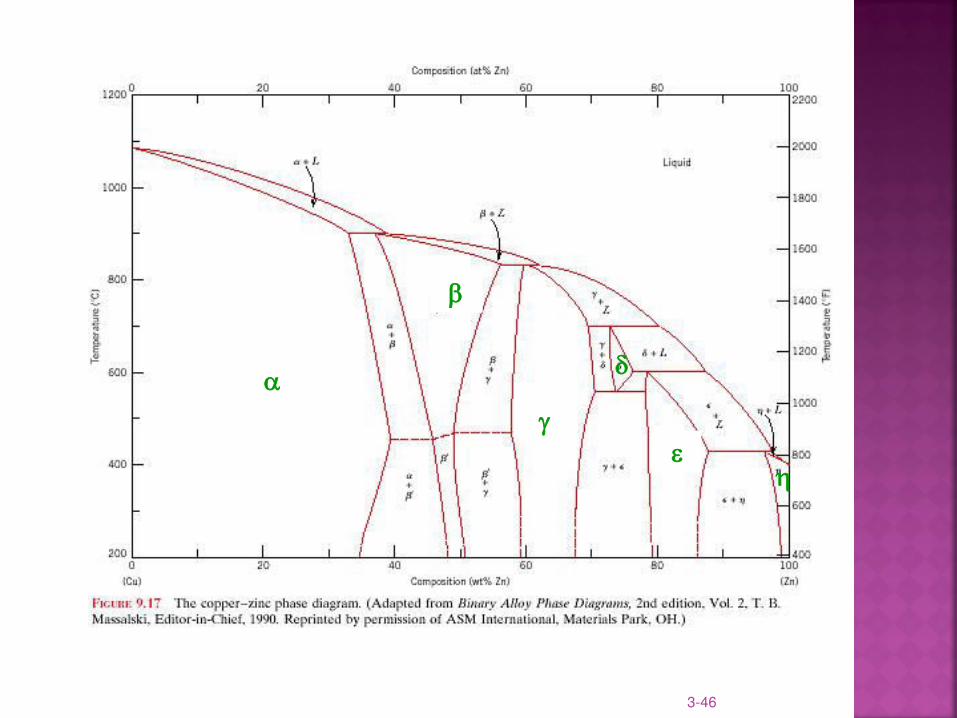
In the eutectic system described above, the two solid phases ( and ) which are in equilibrium with liquid are called terminal solid solutions.
Some binary systems, however, have intermediate solid solutions and which are separated from the composition extremes (0% and 100%)
Example: in the Cu-Zn phase diagram shown below
• and are terminal solid solutions.
• , ’, , and are intermediate solid solutions
3-46
3-47
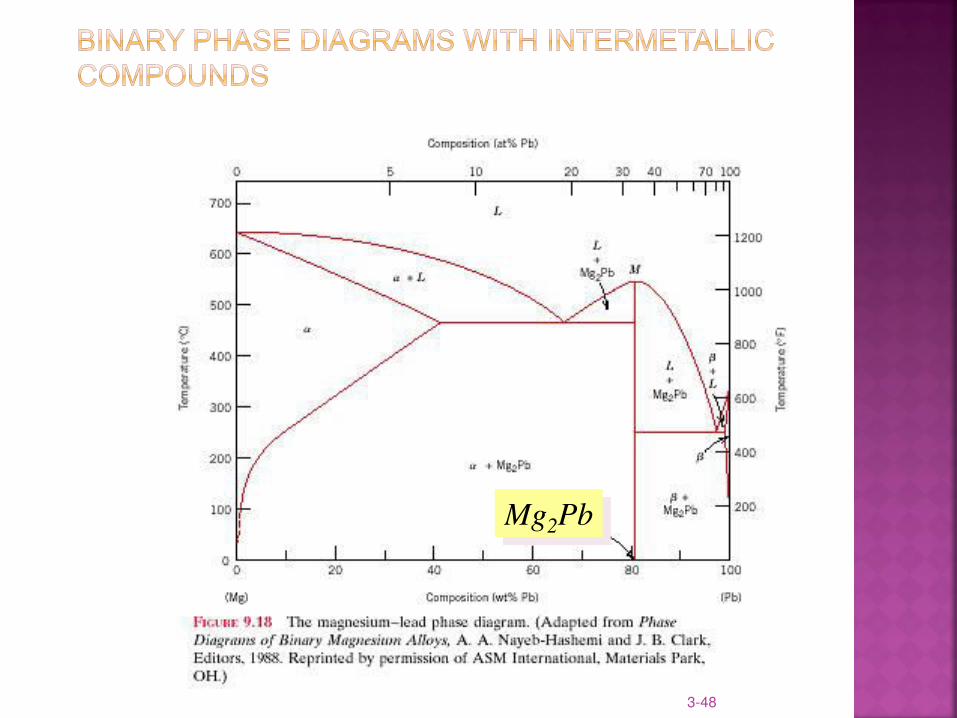
In binary systems, intermetallic compounds with precise composition form, instead of intermediate phases.
An intermetallic compound is represented on the phase diagram as a vertical line (specific composition)
Example:
Mg-Pb phase diagram shown below
3-48
Mg2Pb