Embed Size (px)
Citation preview
Introduction to Engineering Materials
ENGR2000
Chapter 9: Phase Diagrams IChapter 9: Phase Diagrams I
Dr. Coates
Definitions and Basic Concepts
• A component is a chemically distinct and
essentially indivisible substance.
– Fe, Si, C are single component systems
– H2O is a single component system
– window glass (SiO2, Na2O & CaO) is a three-– window glass (SiO2, Na2O & CaO) is a three-
component system
9.3 Phases
• A phase is a homogeneous portion of a system
that has uniform physical and/or chemical
characteristics.
– Liquid– Liquid
– Solid
– Gaseous
– Crystal structure
– Pure metal
Phase and Component
• Pure FCC Al is a
– single component, single phase system
• A mixture of pure ice and pure water is
– a single component, two phase system– a single component, two phase system
• A mixture of BCC Fe and FCC Fe is a
– single component, two phase system.
• A solid solution of Cu and Ni is a
– two component, single phase system
• A solid solution of NiO and MgO is a
– two component, single phase system
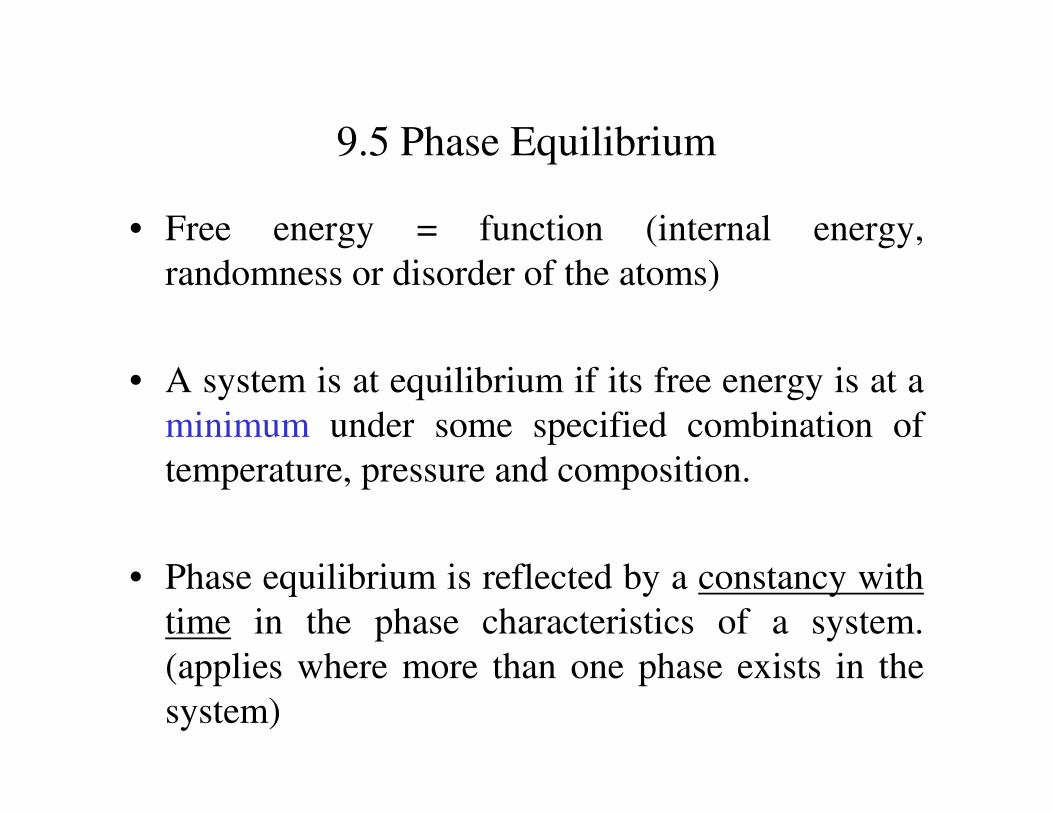
9.2 Solubility Limit
• Maximum concentration of solute atoms that may
dissolve in the solvent to form a solid solution
– At a specific temperature– At a specific temperature
– For a specific alloy system
• How would temp. affect solubility limit?
• Why?
– Atoms in solvent are able to vibrate with greater
amplitude and frequency, allowing more spaces per unit
time for solute atoms to occupy
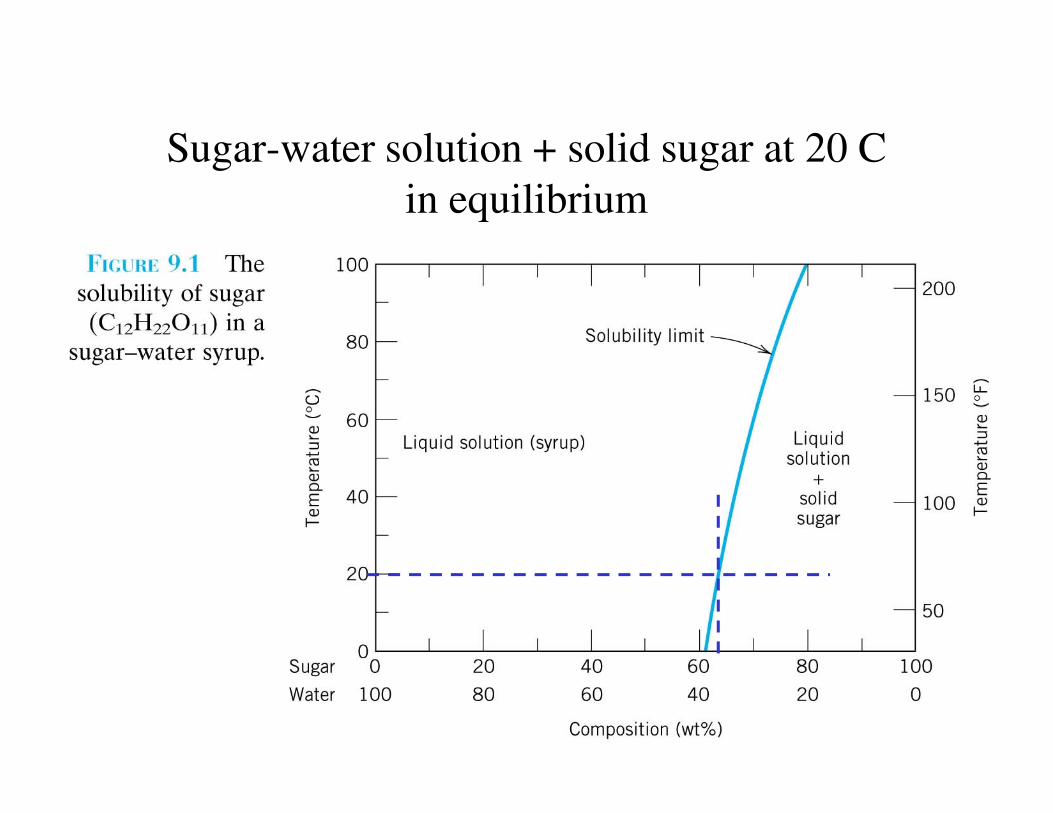
Sugar-water solution + solid sugar at 20 C
in equilibrium
9.4 Microstructure
(Review 4.10 polishing and etching)
• Microstructure
– subject to direct observation using optical or electron
microscopes
• Metal alloys characterized by
– # of phases present– # of phases present
– Proportions of phases
– Distribution or arrangement of phases
• Microstructure depends on
– Alloying elements
– Concentrations
– Heat treatment
9.5 Phase Equilibrium
• Free energy = function (internal energy,
randomness or disorder of the atoms)
• A system is at equilibrium if its free energy is at a
minimum under some specified combination ofminimum under some specified combination of
temperature, pressure and composition.
• Phase equilibrium is reflected by a constancy with
time in the phase characteristics of a system.
(applies where more than one phase exists in the
system)
Sugar-water solution + solid sugar at 20 C
in equilibrium
If suddenly
increase temp
from 200 C to
800 C, what
happens?
9.5 Phase Equilibria
• Free energy considerations provide information
about the equilibrium characteristics of a
particular system– No indication of time periods needed for attainment of new– No indication of time periods needed for attainment of new
equilibrium state
• Often equilibrium never achieved because rate of
approach to equilibrium is extremely slow-System
state is said to be in non-equilibrium or metastable
9.8 Binary Isomorphous Systems
• Binary
– 2 components
• Isomorphous• Isomorphous
– Complete liquid and solid solubility
Phase diagrams are maps that present the relationship between
temperature and composition and the quantities of phases at
equilibrium
•presented here are for a constant pressure of 1 atm
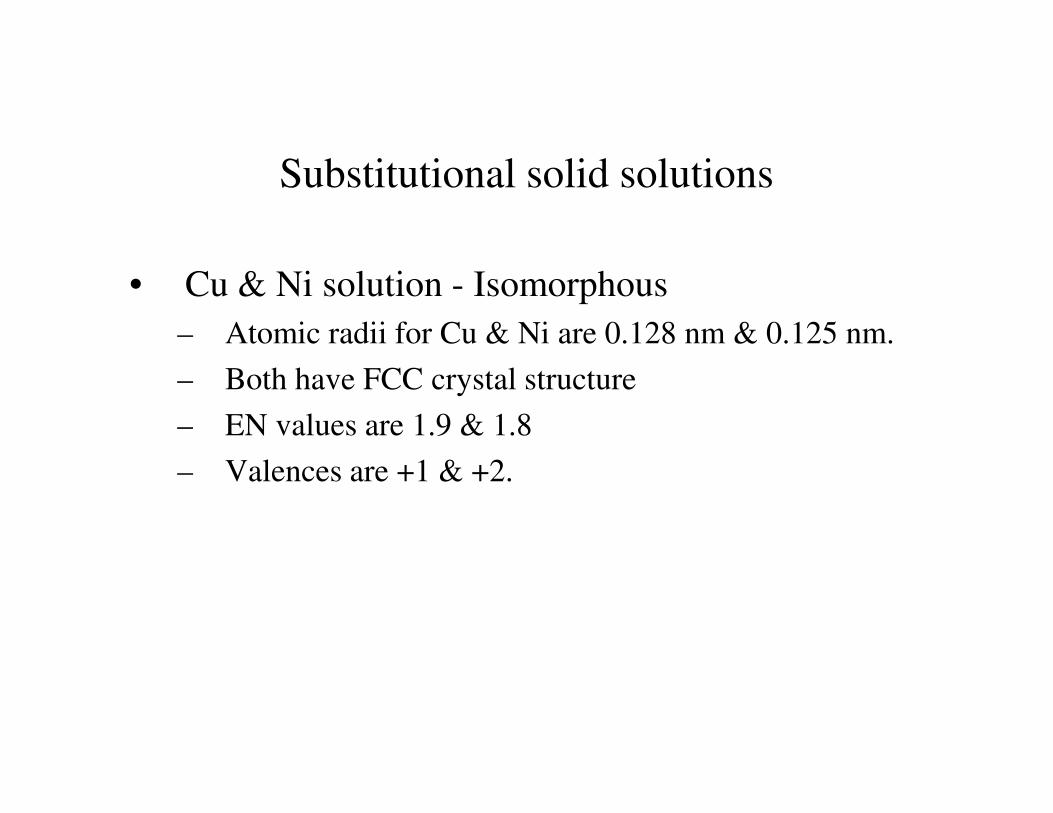
Substitutional solid solutions
• Cu & Ni solution - Isomorphous
– Atomic radii for Cu & Ni are 0.128 nm & 0.125 nm.
– Both have FCC crystal structure
– EN values are 1.9 & 1.8– EN values are 1.9 & 1.8
– Valences are +1 & +2.
• The liquid L is a homogenous liquid solution
composed of both copper and nickel
• The α phase is a substitutional solid solution
consisting of both Cu and Ni atoms, having an
FCC crsytal structure.FCC crsytal structure.
• At temp. below 10800 C, Cu and Ni are mutually
soluble in each other in the solid state for all
compositions. Why? (See section 4.3)
pure
com
ponen
tC
u
pure
com
ponen
tN
i
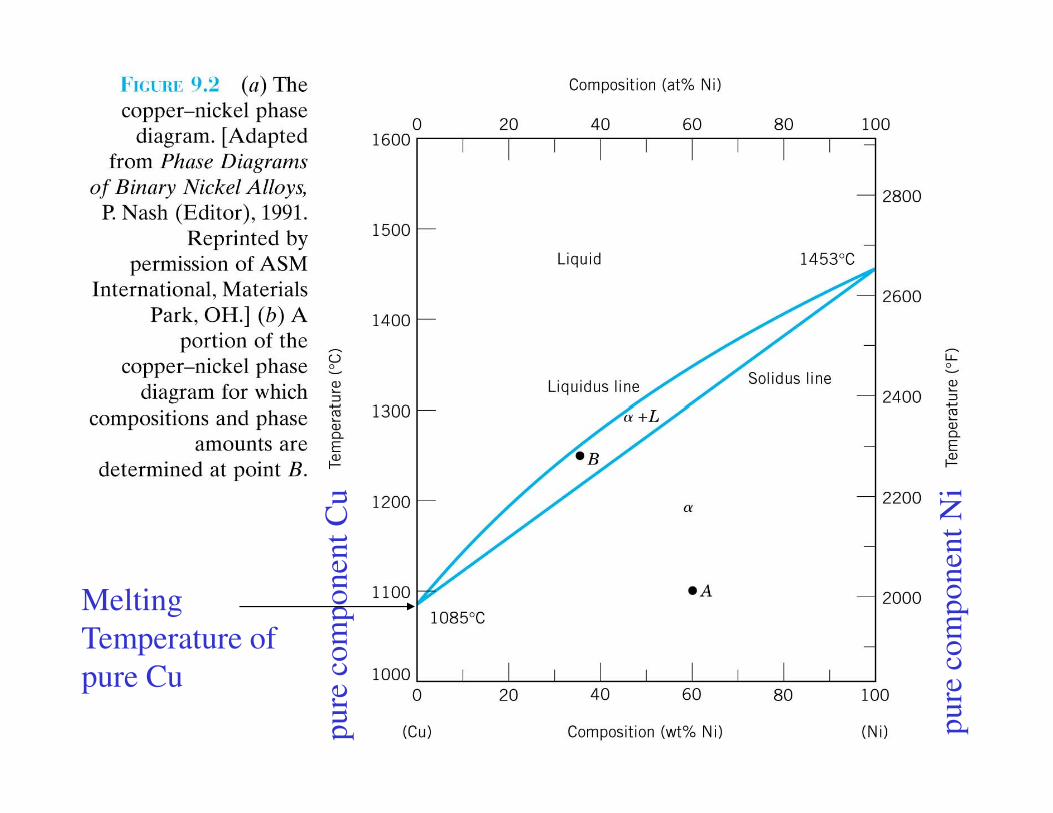
Melting
Temperature of
pure Cu
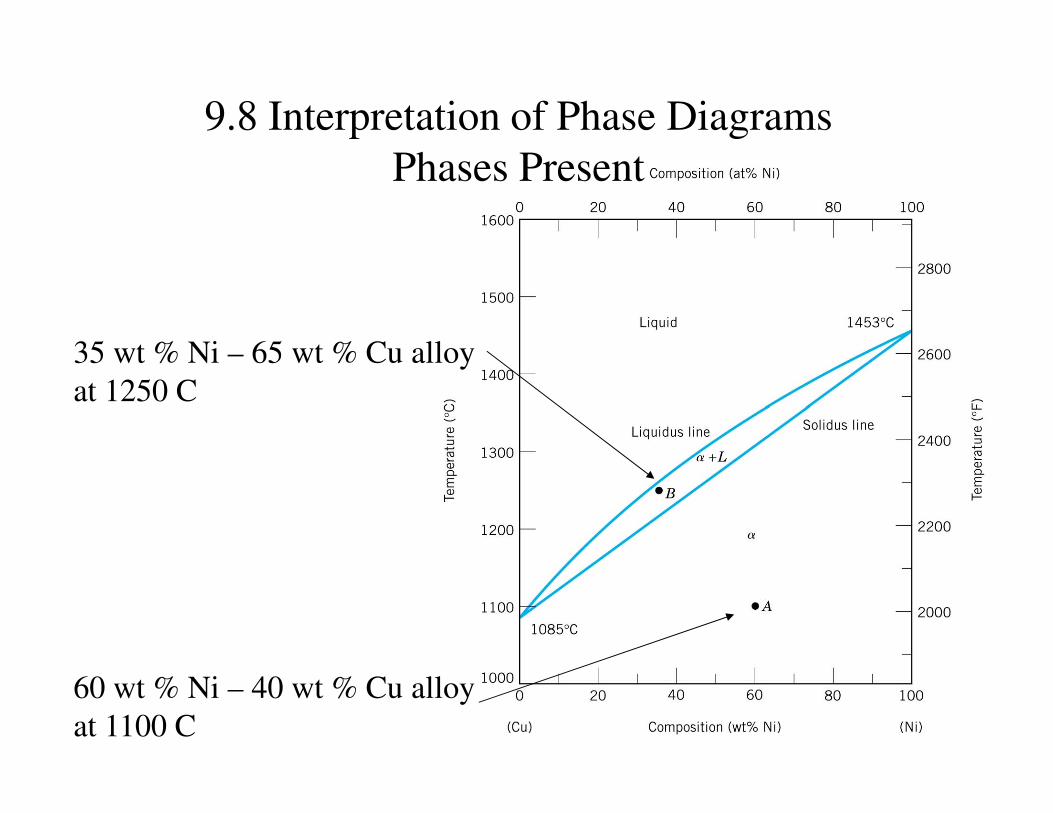
9.8 Interpretation of Phase Diagrams
Phases Present
35 wt % Ni – 65 wt % Cu alloy
at 1250 C
60 wt % Ni – 40 wt % Cu alloy
at 1100 C
at 1250 C
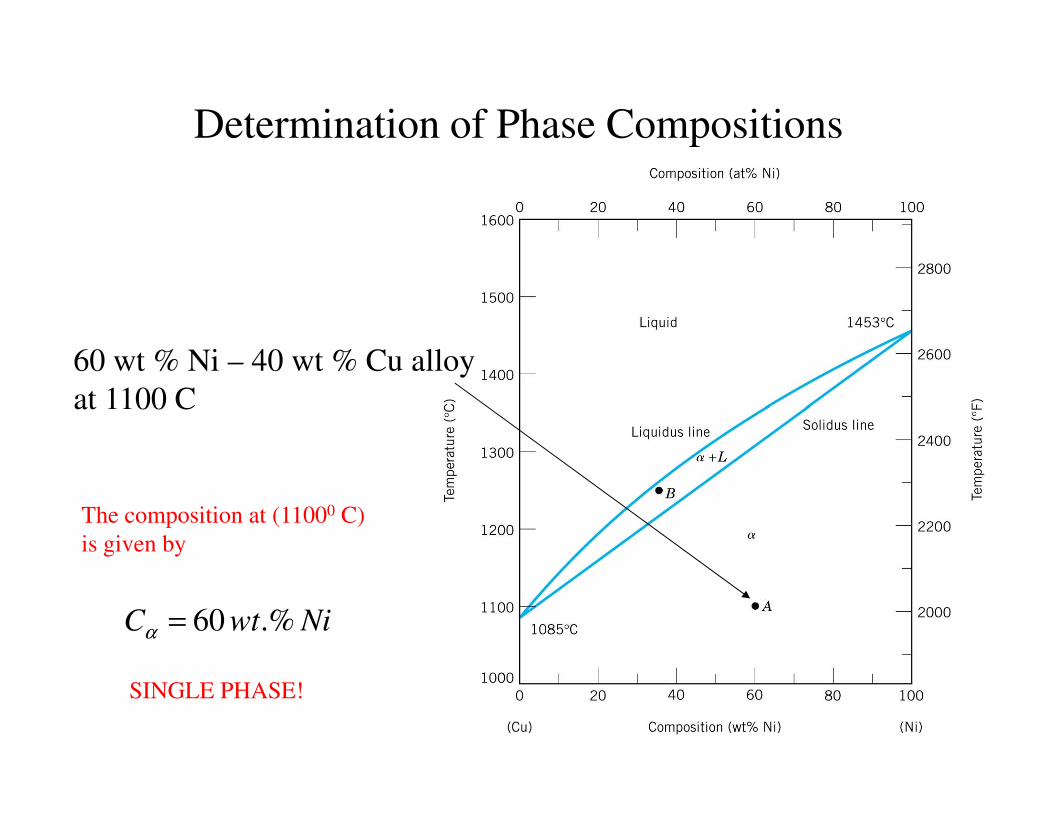
Determination of Phase Compositions
60 wt % Ni – 40 wt % Cu alloy
at 1100 Cat 1100 C
NiwtC .%60=α
The composition at (11000 C)
is given by
SINGLE PHASE!
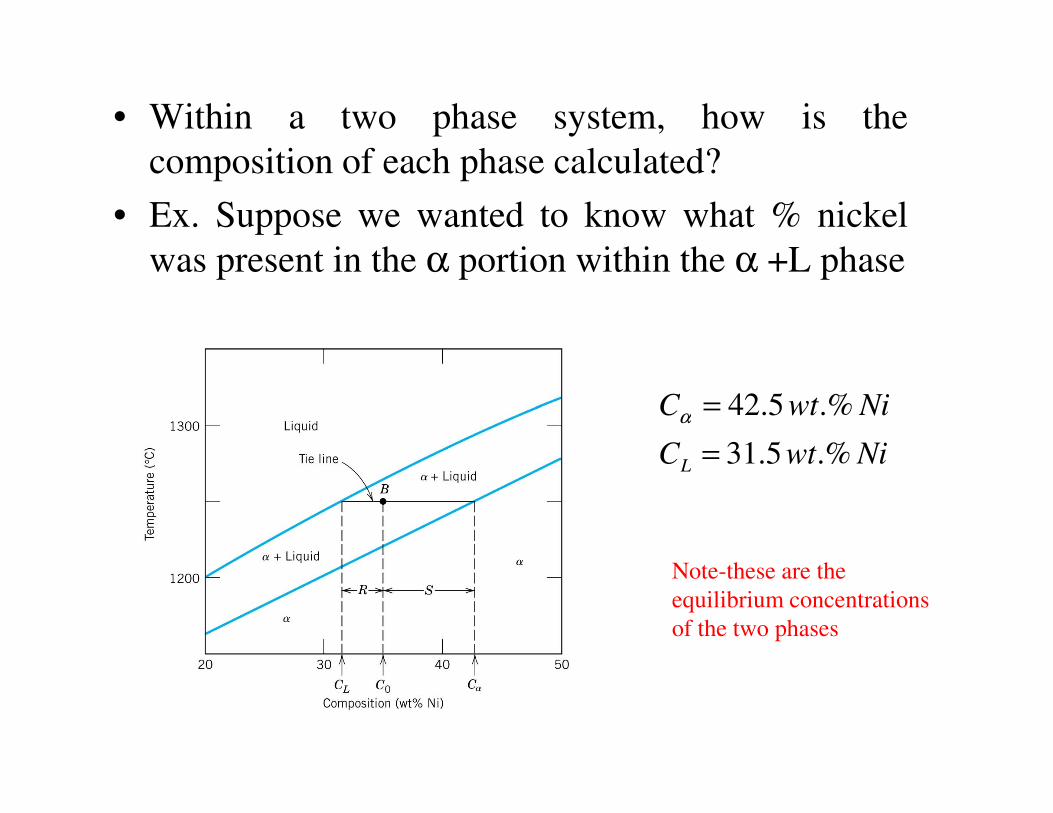
• Within a two phase system, how is the
composition of each phase calculated?
• Ex. Suppose we wanted to know what % nickel
was present in the α portion within the α +L phase
NiwtC .%5.42=α
NiwtC
NiwtC
L .%5.31
.%5.42
=
=α
Note-these are the
equilibrium concentrations
of the two phases
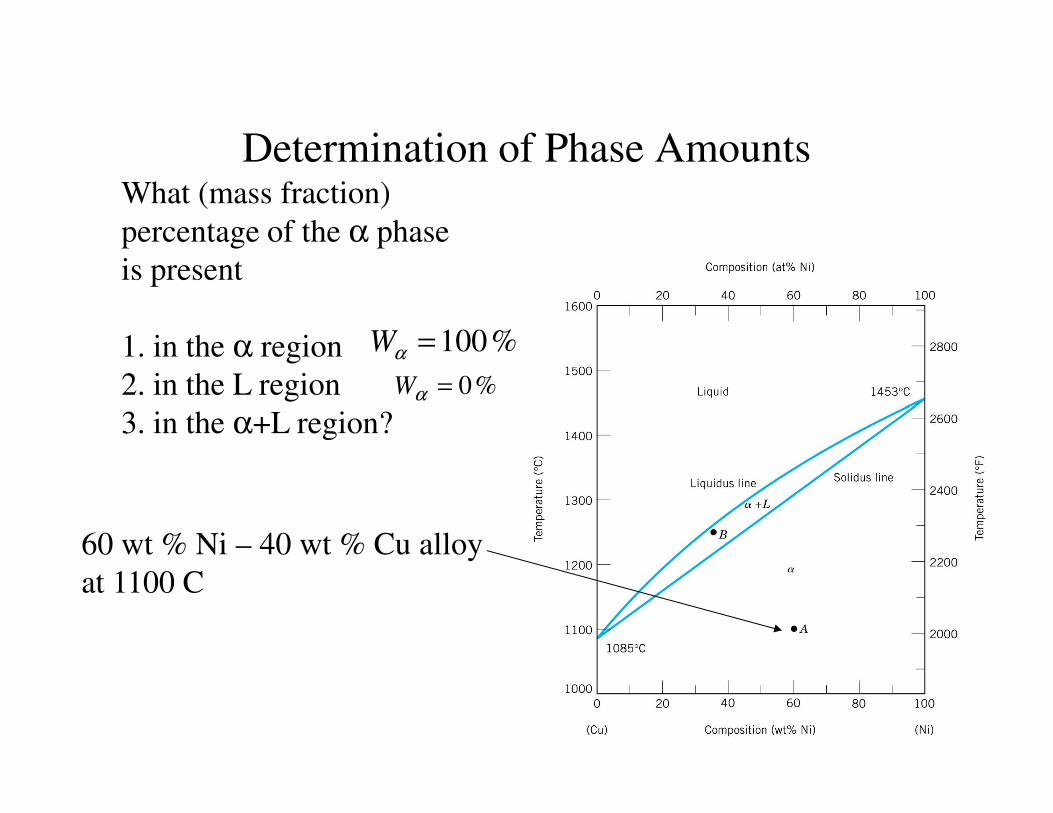
Determination of Phase Amounts
%100=αW
What (mass fraction)
percentage of the α phase
is present
1. in the α region
2. in the L region
3. in the α+L region?
%0=αW
60 wt % Ni – 40 wt % Cu alloy
at 1100 C
3. in the α+L region?
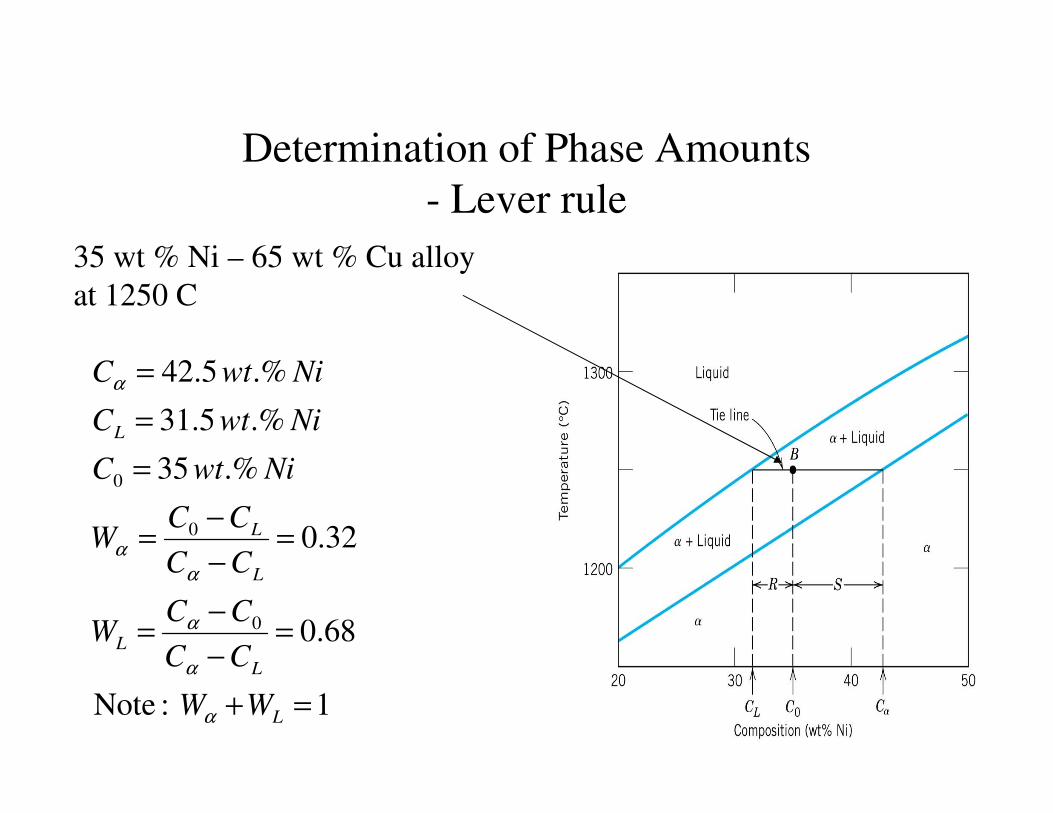
Determination of Phase Amounts
- Lever rule
35 wt % Ni – 65 wt % Cu alloy
at 1250 C
.%5.31
.%5.42
=
=
NiwtC
NiwtCα
1 :Note
68.0
32.0
.%35
.%5.31
0
0
0
=+
=−
−=
=−
−=
=
=
L
L
L
L
L
L
WW
CC
CCW
CC
CCW
NiwtC
NiwtC
α
α
α
α
α
Reading Assignments
• Section 9.8
– Tie line
– Lever rule
– Example 9.1– Example 9.1
– Volume fractions & mass fractions
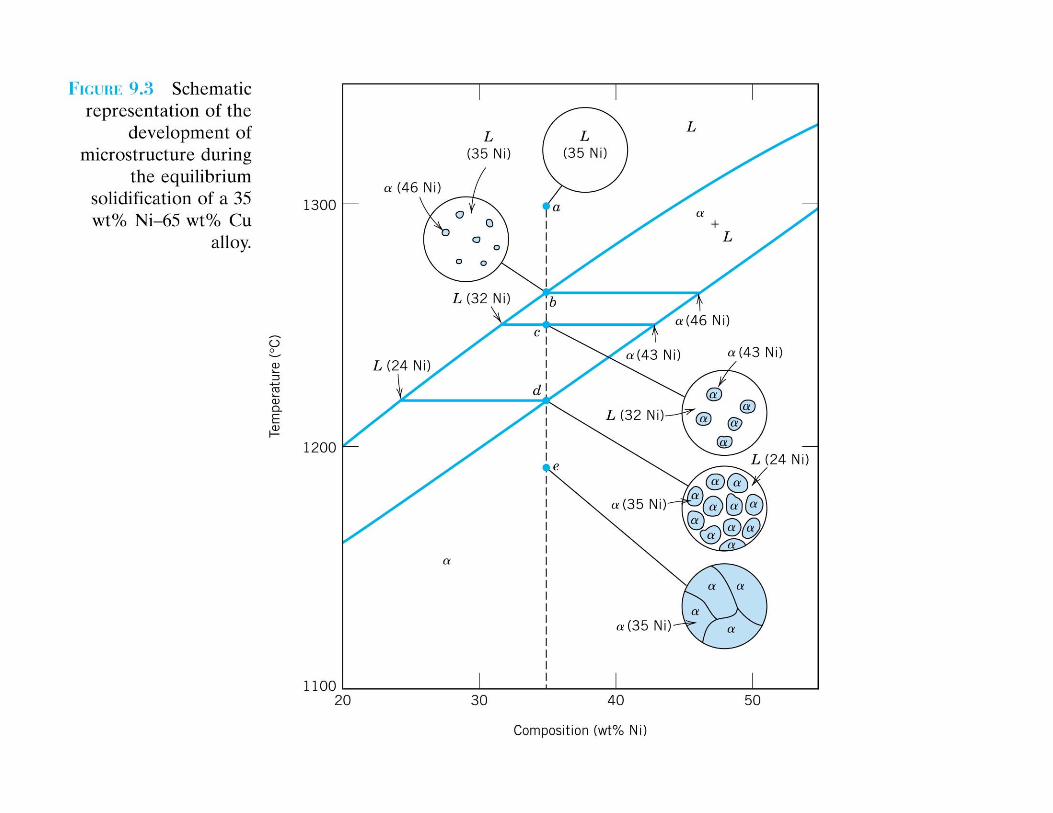
9.9 Development of Microstructure in
Isomorphous Alloys
• Equilibrium cooling
– Cooling occurs very slowly
– Phase equilibrium is continuously maintained
9.8 Development of Microstructure in
Isomorphous Alloys
• Non-equilibrium cooling
– Rapid cooling rates (in most practical situations)
– Sufficient time must be allowed at each temperature for
compositional readjustment, otherwisecompositional readjustment, otherwise
– Equilibrium is not always maintained
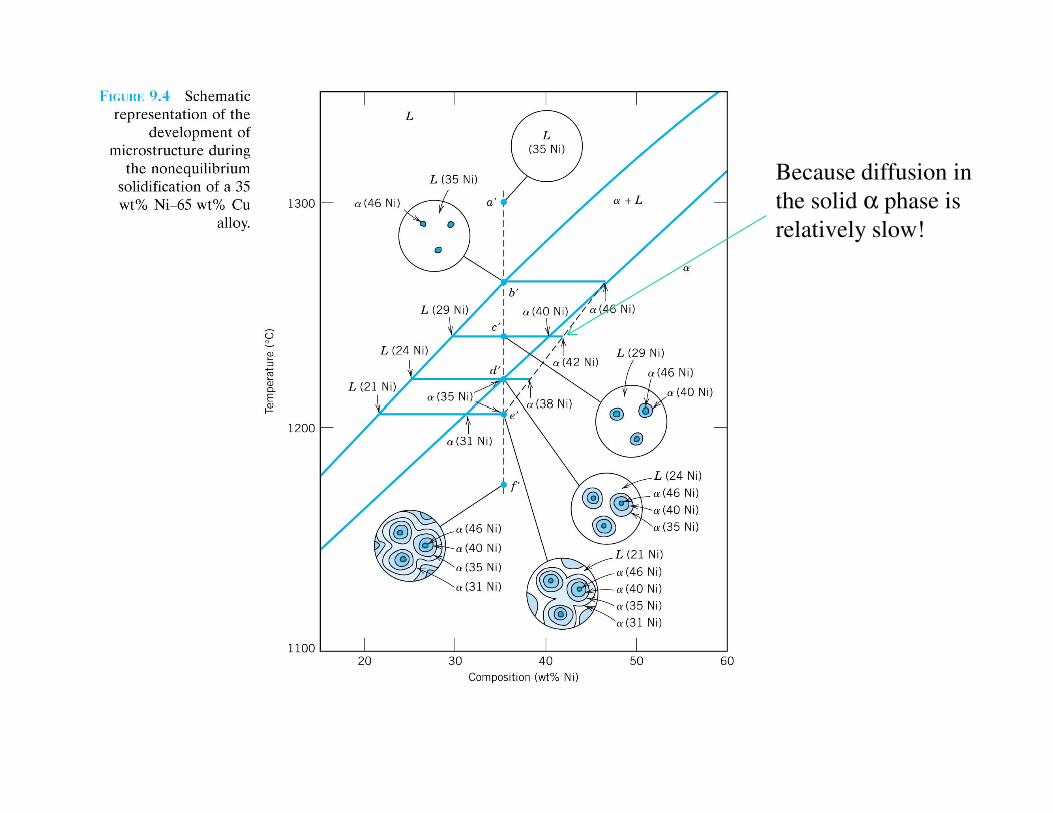
Because diffusion in
the solid α phase is
relatively slow!
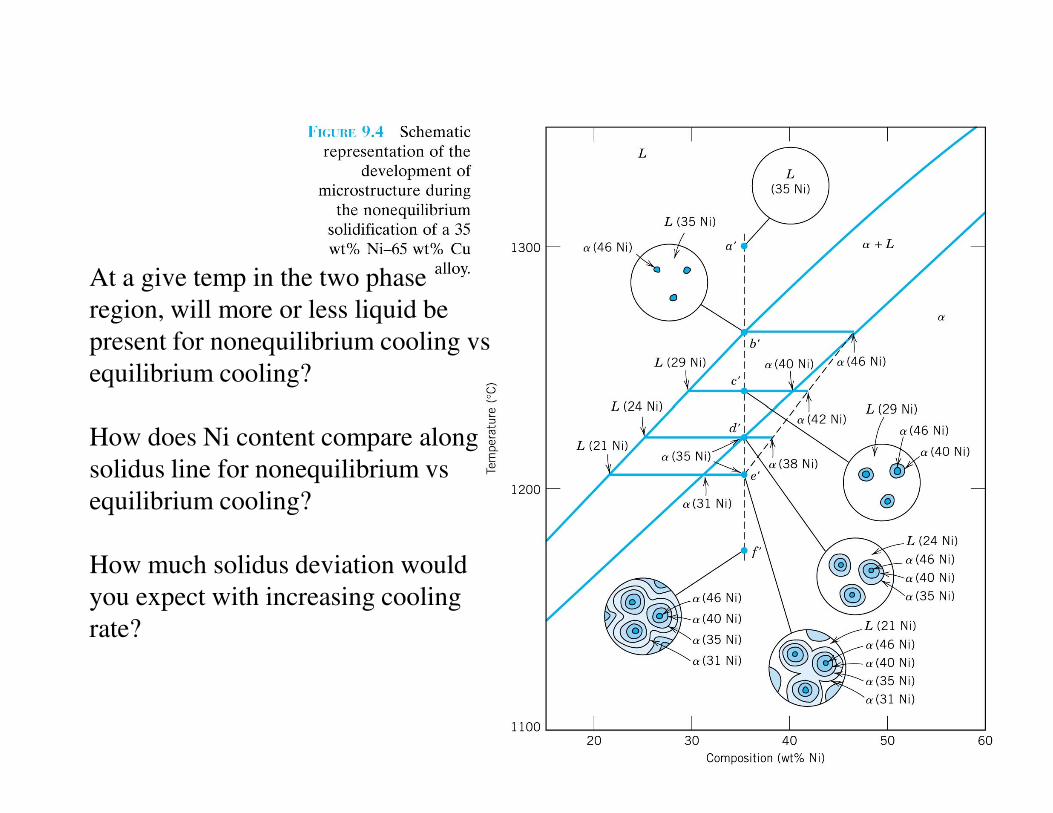
At a give temp in the two phase
region, will more or less liquid be
present for nonequilibrium cooling vs
equilibrium cooling?
How does Ni content compare along
solidus line for nonequilibrium vs
equilibrium cooling?
How much solidus deviation would
you expect with increasing cooling
rate?
• Distribution of grains will be non-uniform
(segregation)
• Center of each grain is rich in high melting
element/concentration, the concentration of low
melting element increases from this region
towards grain boundary-coring
• CORING will affect temperature response/sudden• CORING will affect temperature response/sudden
loss of mechanical integrity as structure is
reheated
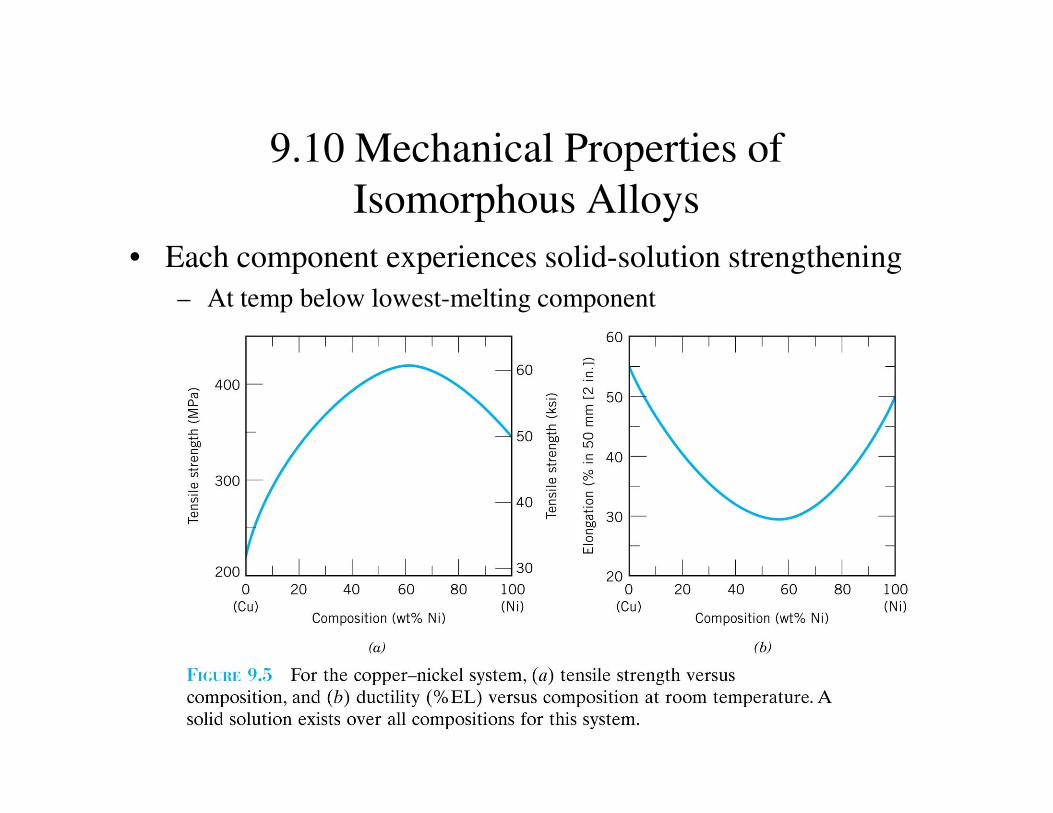
9.10 Mechanical Properties of
Isomorphous Alloys
• Each component experiences solid-solution strengthening
– At temp below lowest-melting component
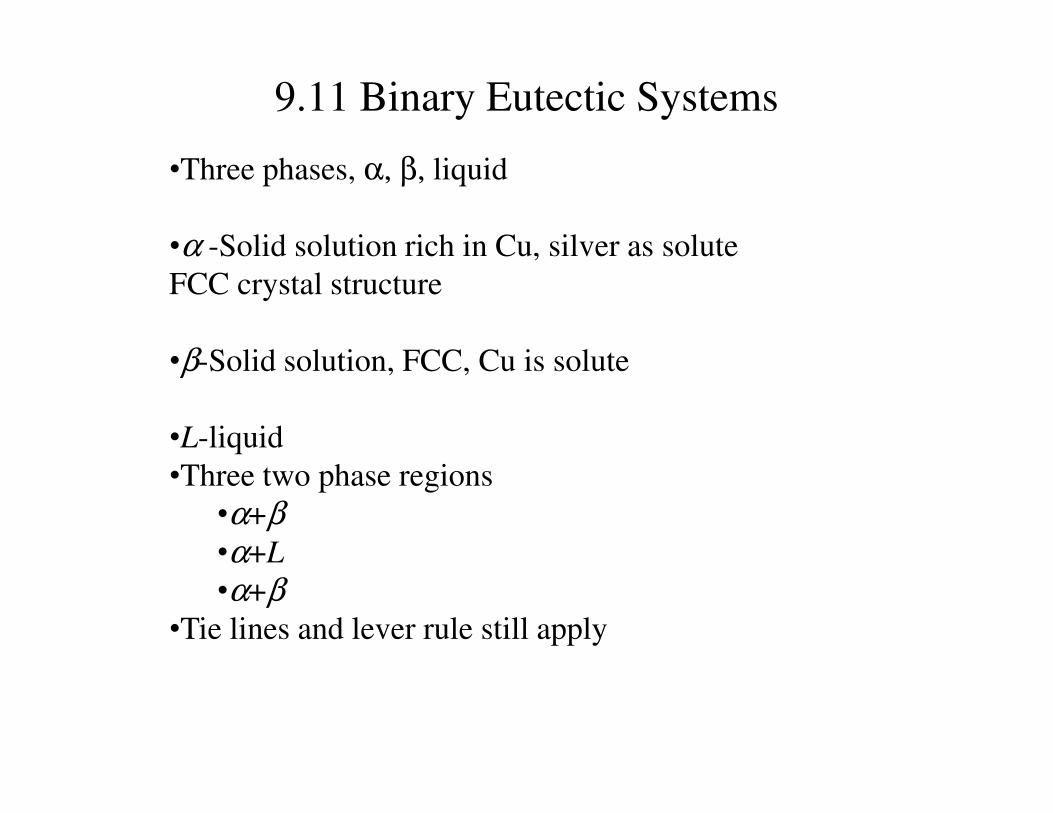
•Three phases, α, β, liquid
•α -Solid solution rich in Cu, silver as solute
FCC crystal structure
•β-Solid solution, FCC, Cu is solute
9.11 Binary Eutectic Systems
•L-liquid
•Three two phase regions
•α+β•α+L
•α+β•Tie lines and lever rule still apply
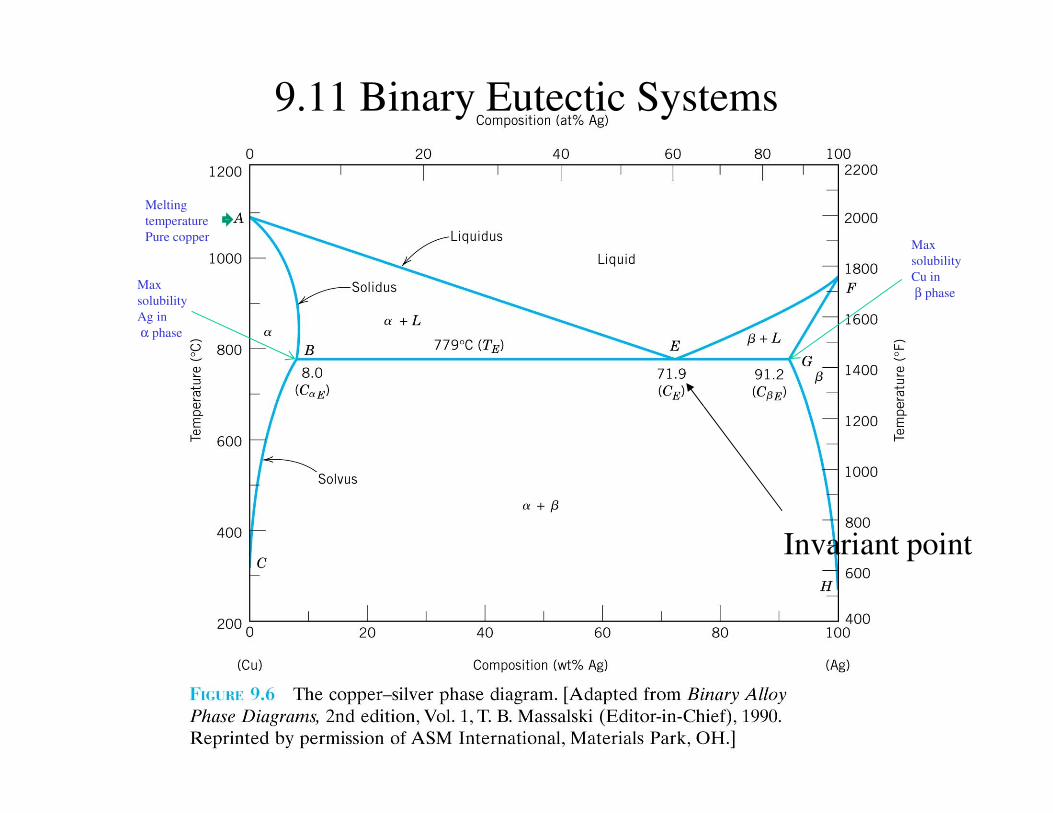
9.11 Binary Eutectic Systems
Melting
temperature
Pure copper
Max
solubility
Ag in
α phase
Max
solubility
Cu in
β phase
Invariant point
• Which line represents lowest temperature at which
a liquid phase may exist for any Cu-Ag alloy at
equilibrium?
• What happens to temp at which alloys become
totally liquid (melting temp)as Ag is added to Cu?
Vice versa?
BEG
AE EF
• What is special about point E?Eutectic Reaction-upon
cooling, liquid is
transformed to two solid αand β phases
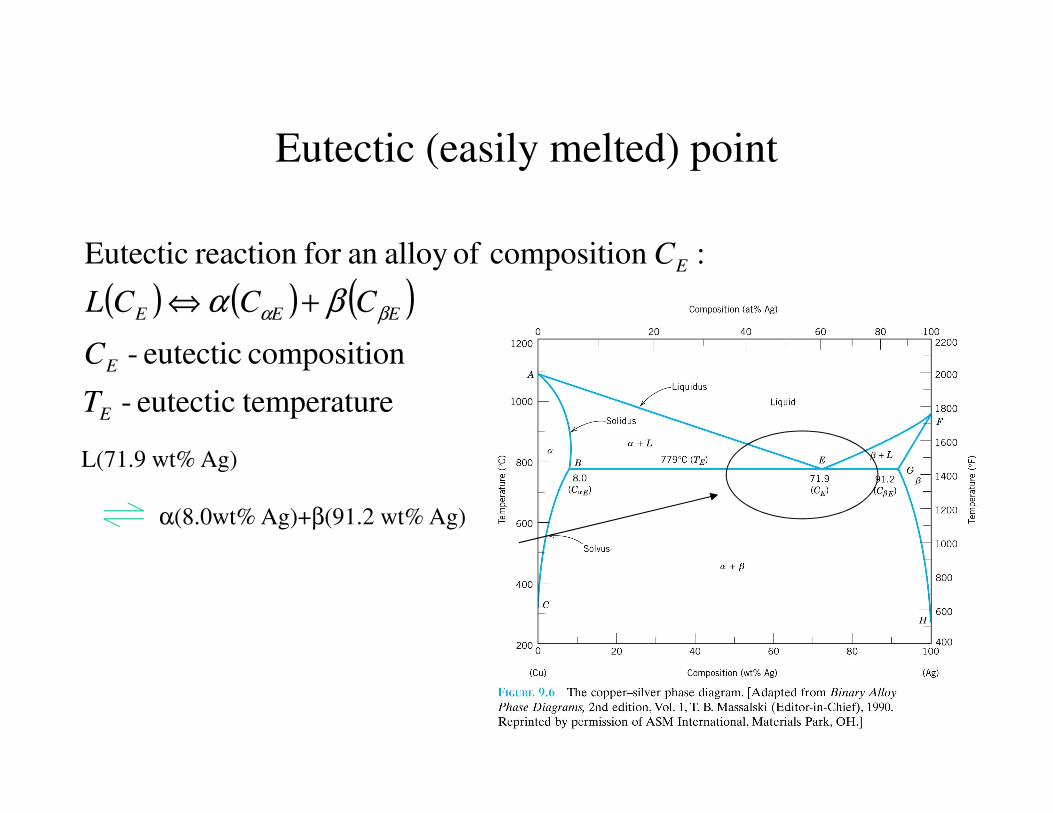
Eutectic (easily melted) point
( ) ( ) ( )
re temperatueutectic -
ncompositio eutectic -
:n compositio ofalloy an for reaction Eutectic
E
E
EEE
E
T
C
CCCL
C
βα βα +⇔
re temperatueutectic - ET
L(71.9 wt% Ag)
α(8.0wt% Ag)+β(91.2 wt% Ag)
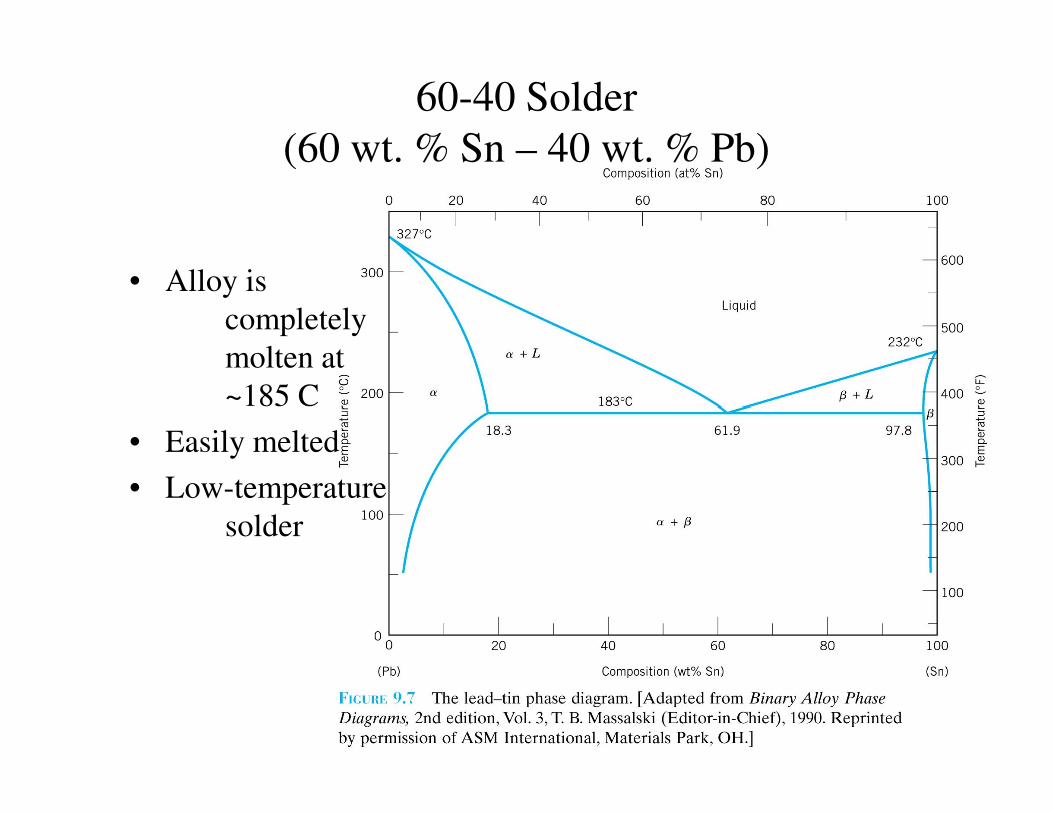
60-40 Solder
(60 wt. % Sn – 40 wt. % Pb)
• Alloy is
completely
molten at
~185 C~185 C
• Easily melted
• Low-temperature
solder
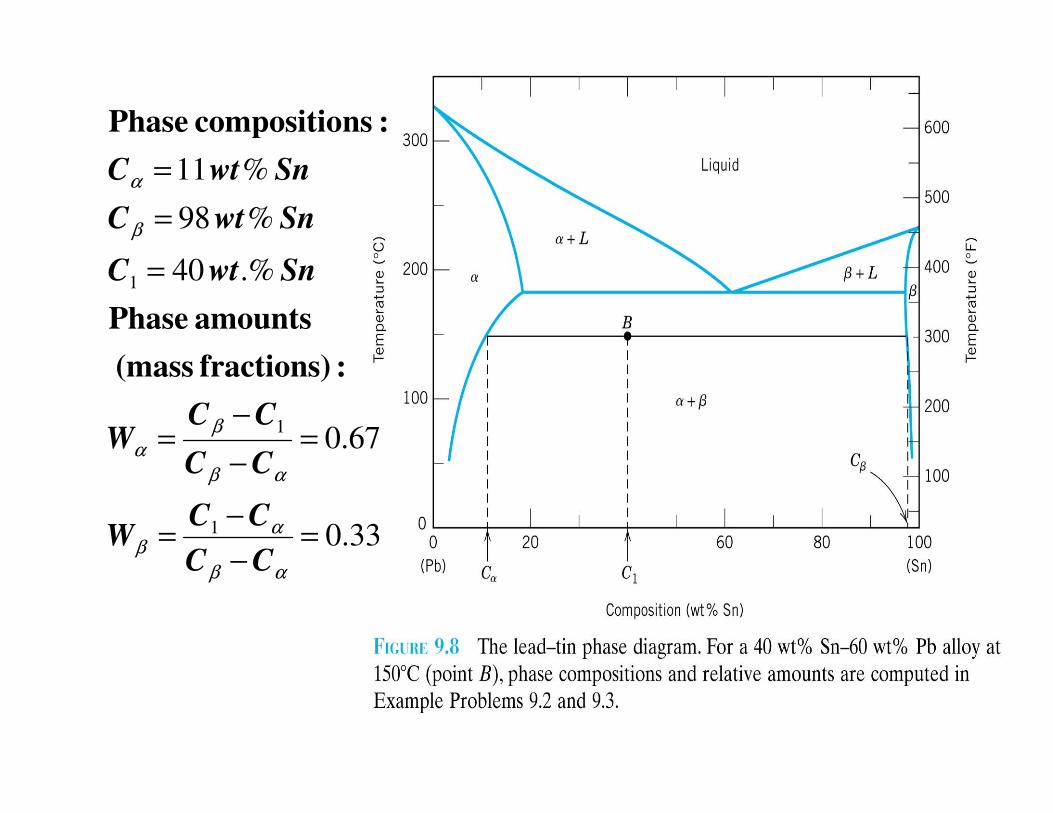
Example 9.2
• For a 40 wt % Sn – 60 wt % Pb alloy at 150 C
– What phases are present?
– What are the compositions of the phases?
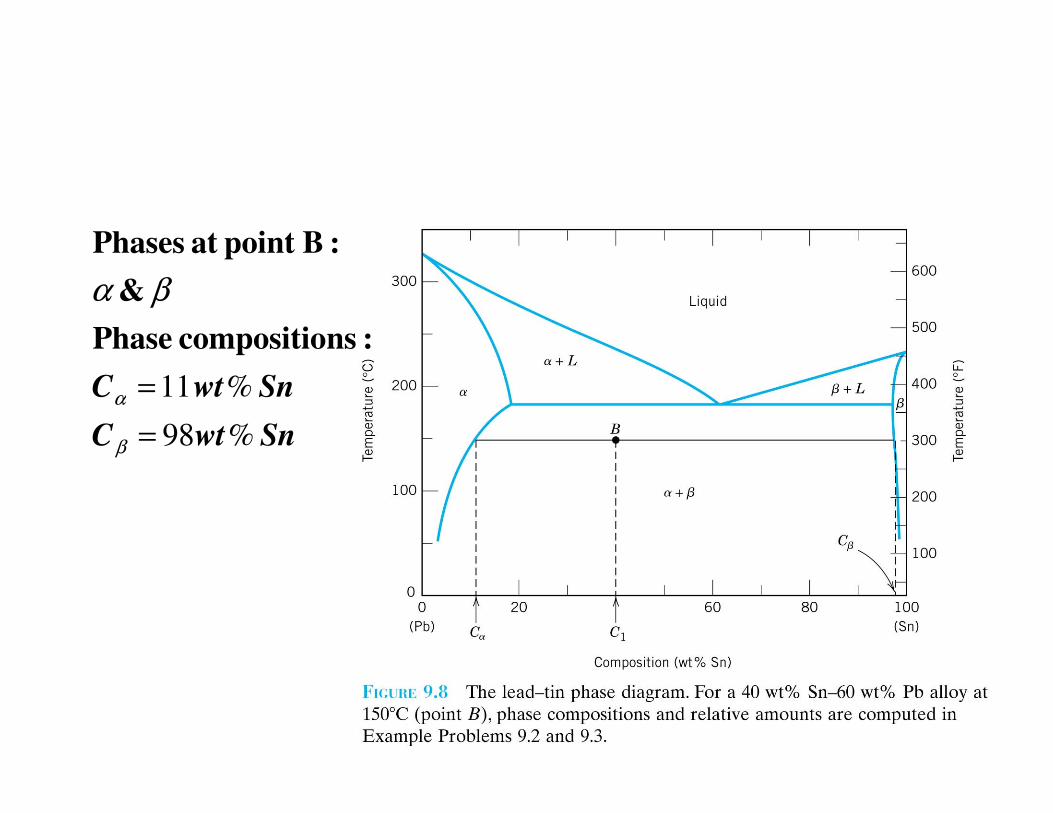
SnwtC %11=α
βα
:nscompositio Phase
&
:Bpoint at Phases
SnwtC %98=β
α
Example 9.3
• For a 40 wt % Sn – 60 wt % Pb alloy at 1500 C,
calculate the relative amount of each phase present
in terms of
– mass fraction and– mass fraction and
– volume fraction.
At 1500 C take the densities of Pb and Sn to be
11.23g/cm3 and 7.24 g/cm3 respectively.
.%40
%98
%11
1
−
=
=
=
β
α
CC
SnwtC
SnwtC
SnwtC
:fractions) (mass
amounts Phase
:nscompositio Phase
33.0
67.0
1
1
=−
−=
=−
−=
αβ
αβ
αβ
β
α
CC
CCW
CC
CCW
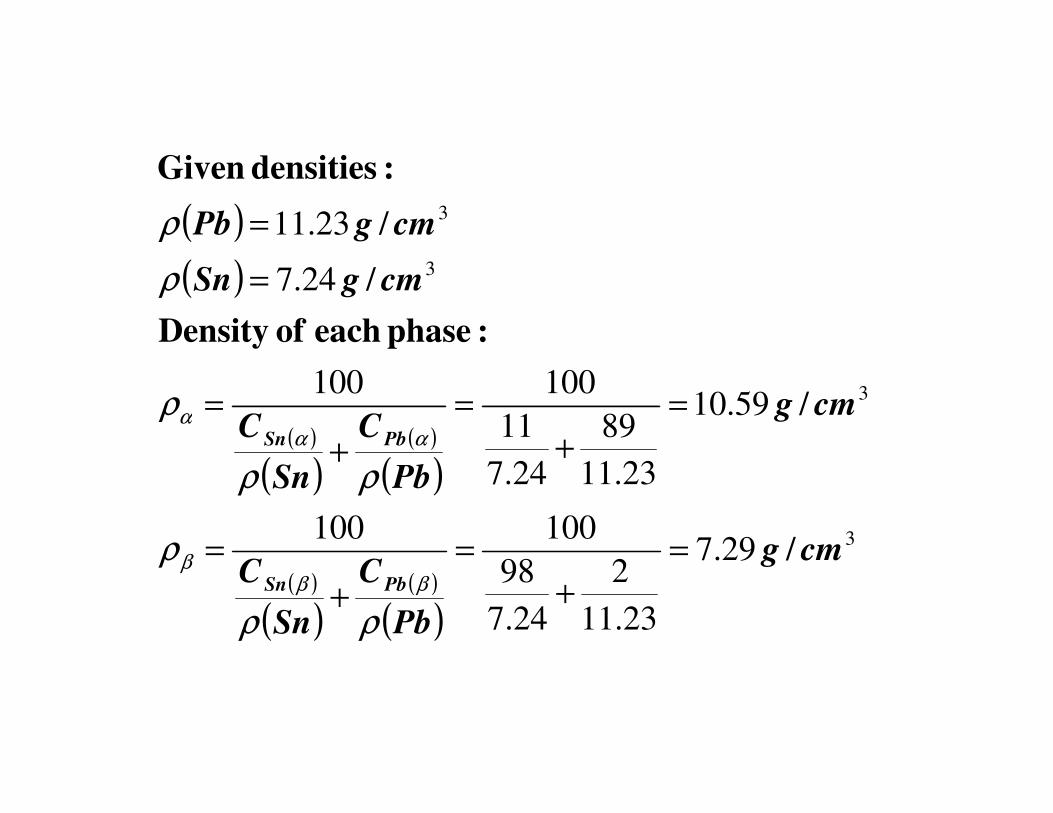
( )
( )
3
3
3
/59.108911
100100
/24.7
/23.11
cmgCC
cmgSn
cmgPb
===
=
=
ρ
ρ
ρ
α
:phase each of Density
:densities Given
( )
( )( )
( )
( )
( )( )
( )
3/29.7
23.11
2
24.7
98
100100
/59.10
23.11
89
24.7
11
cmg
Pb
C
Sn
C
cmg
Pb
C
Sn
C
PbSn
PbSn
=
+
=
+
=
=
+
=
+
=
ρρ
ρ
ρρ
ρ
βββ
ααα
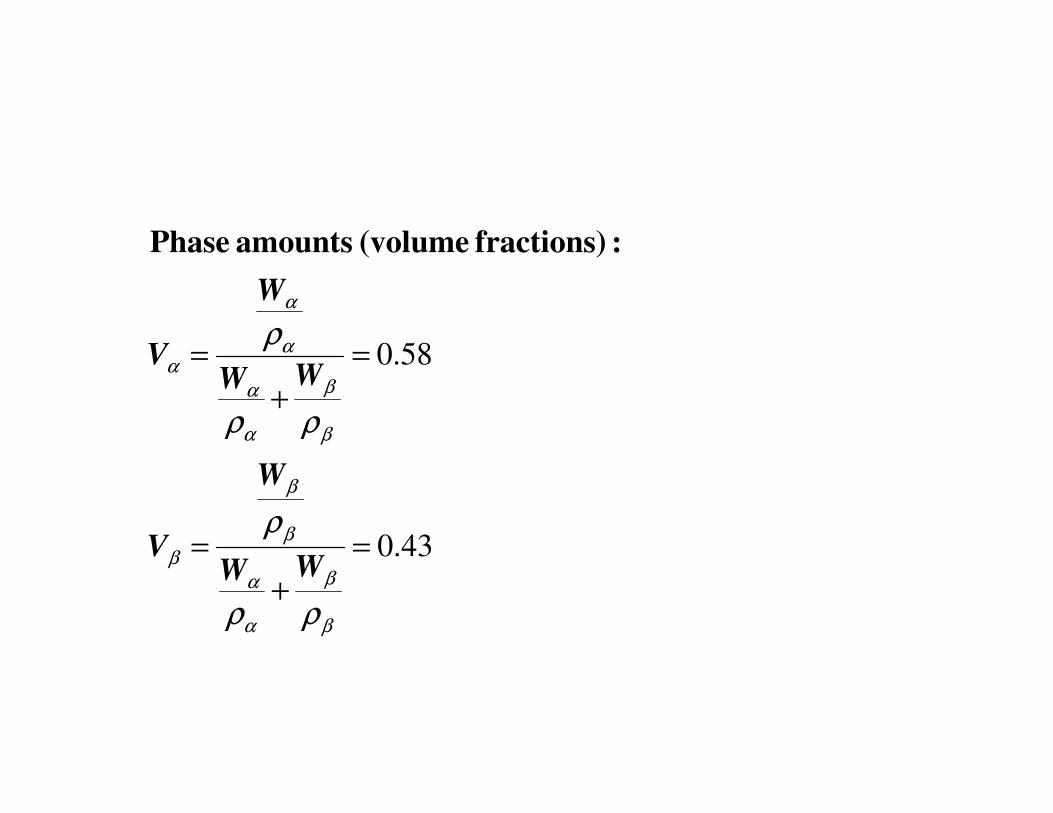
58.0=
+
=βα
α
α
α
ρρ
ρ
WW
W
V
:fractions) (volume amounts Phase
43.0=
+
=
+
β
β
α
α
β
β
β
βα
ρρ
ρ
ρρ
WW
W
V
9.11 Development of Microstructure in
Eutectic Alloys
• Eutectic alloys
– Eutectic composition
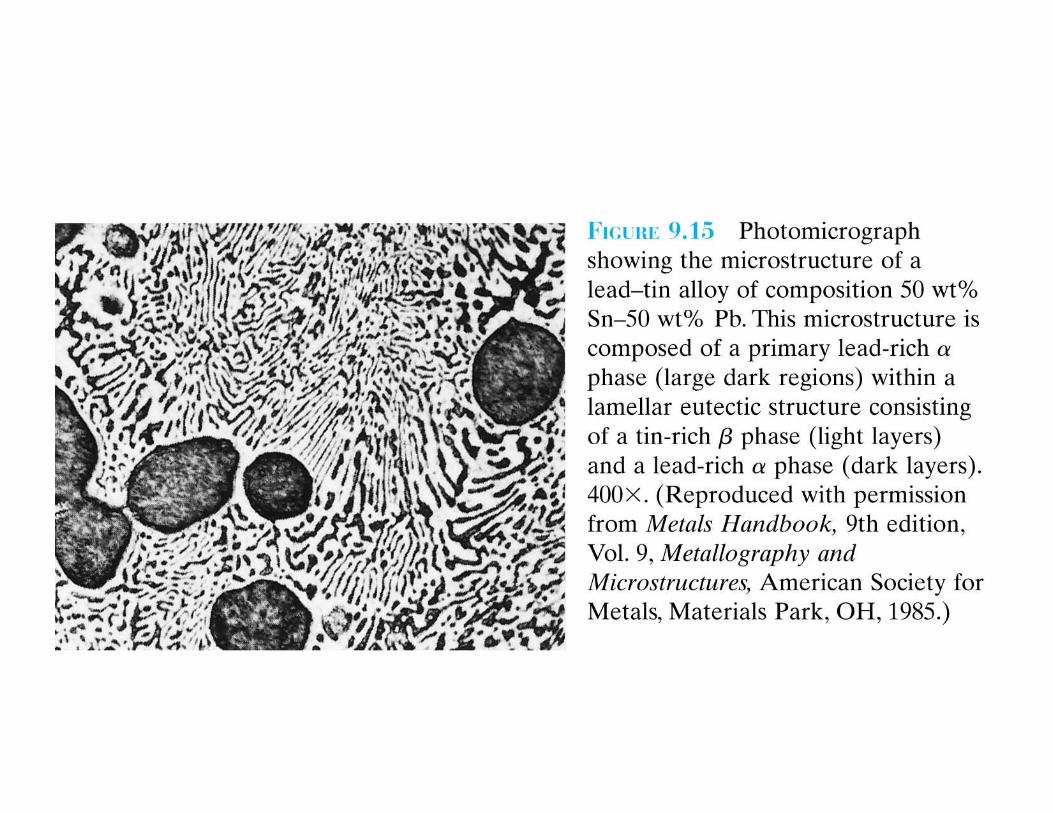
• Hypoeutectic alloys
– Alloy composition < eutectic composition
• Hypereutectic alloys
– Eutectic composition < alloy composition
Several different types of microstructures are possible
for the slow cooling of eutectic alloys!
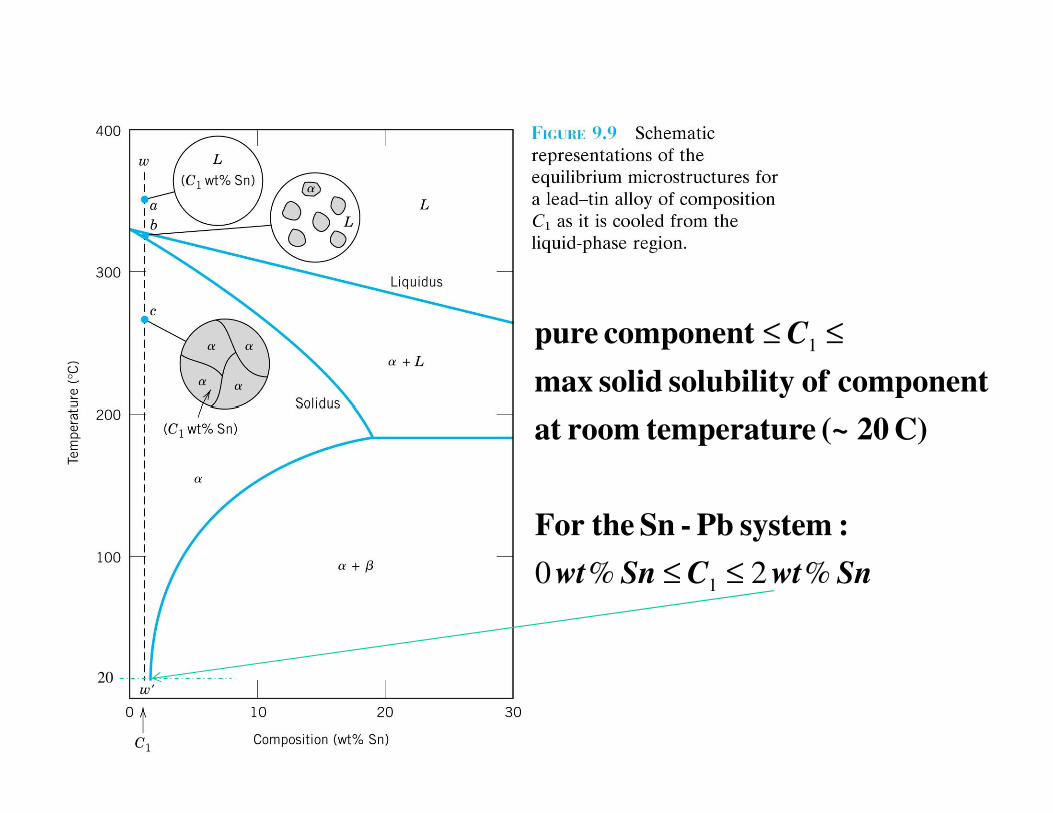
C1 ≤≤
component of solubility solidmax
component pure
SnwtCSnwt %2%0 1 ≤≤
:system Pb-Sn theFor
C) 20(~ etemperatur roomat
20
C
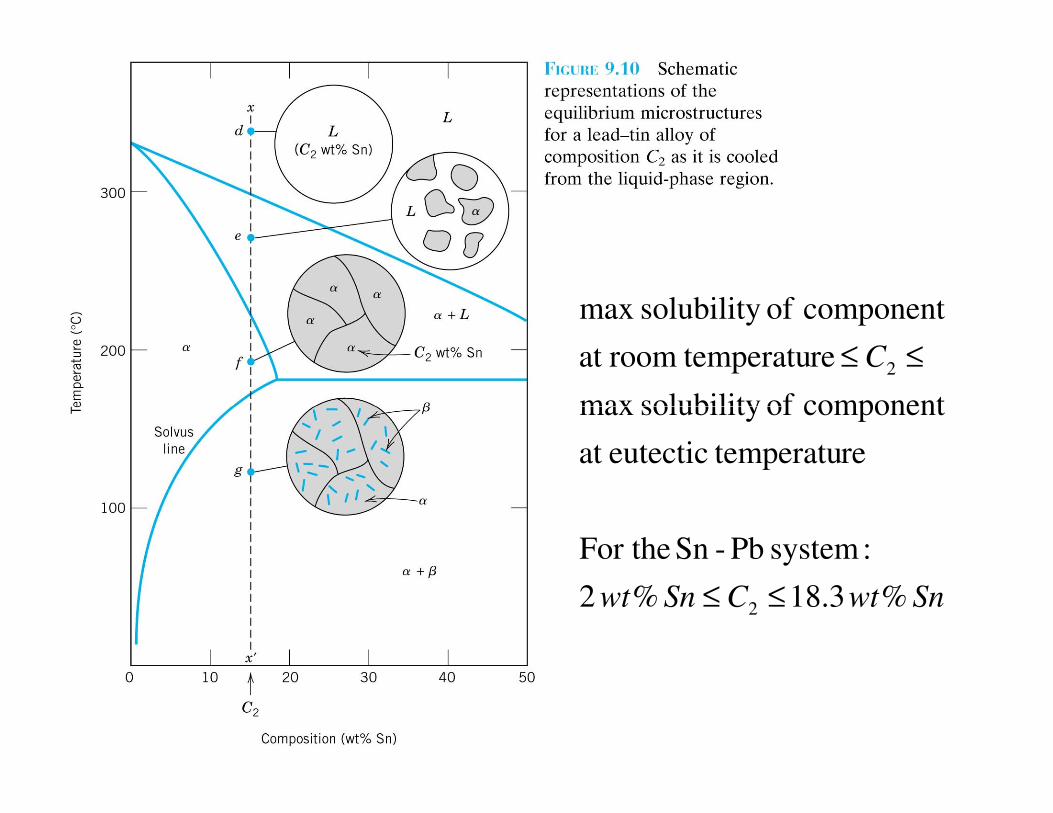
component of solubilitymax
re temperaturoomat
component of solubilitymax
2 ≤≤
SnwtCSnwt %3.18%2
:system Pb-Sn For the
re temperatueutecticat
component of solubilitymax
2 ≤≤
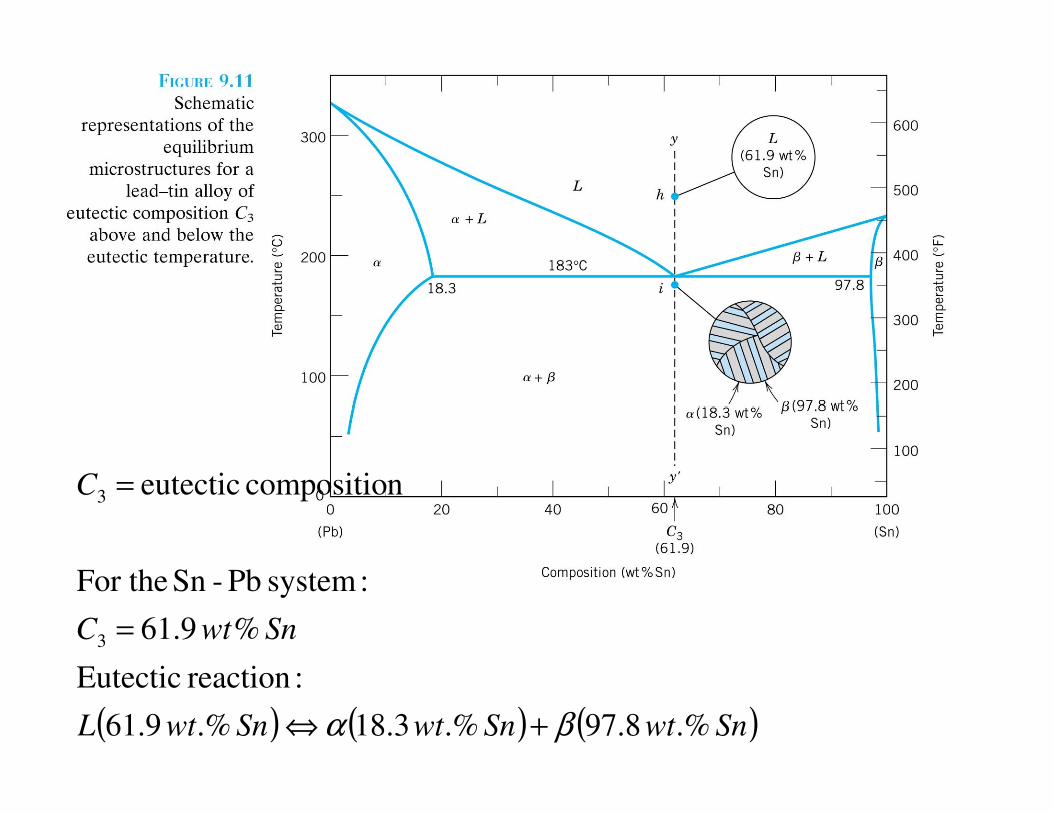
( ) ( ) ( )SnwtSnwtSnwtL
SnwtC
C
.%8.97.%3.18.%9.61
:reaction Eutectic
%9.61
:system Pb-Sn For the
ncompositio eutectic
3
3
βα +⇔
=
=
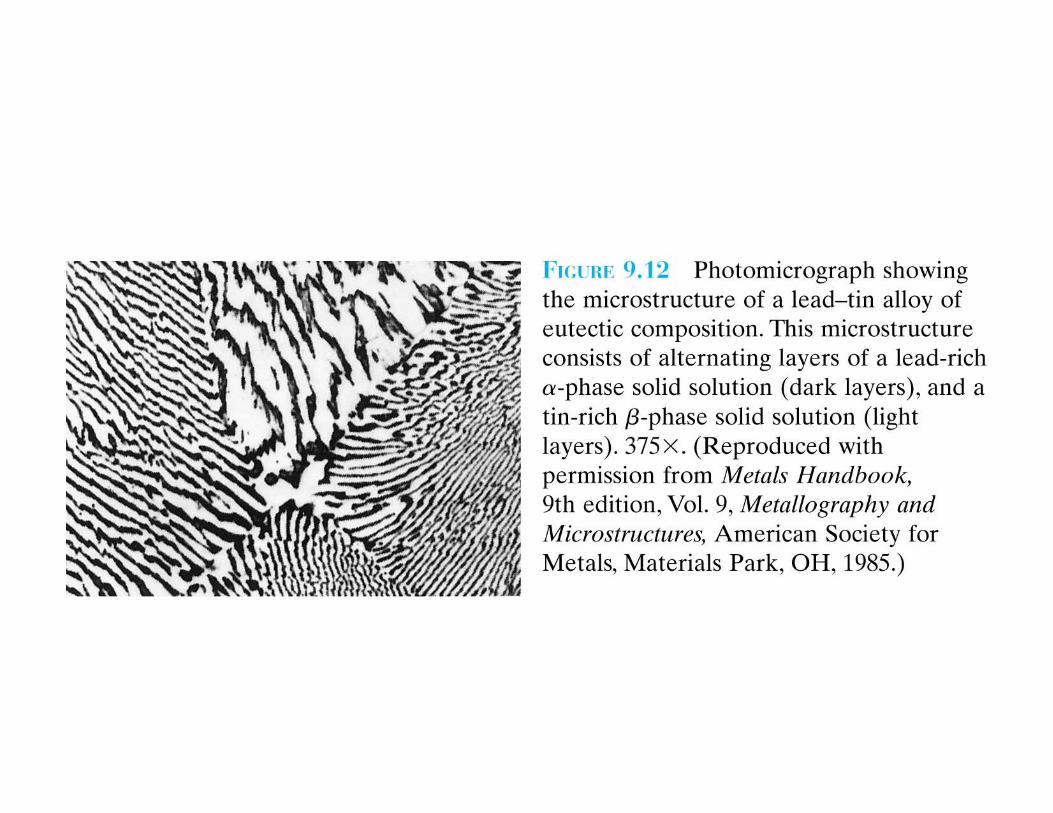
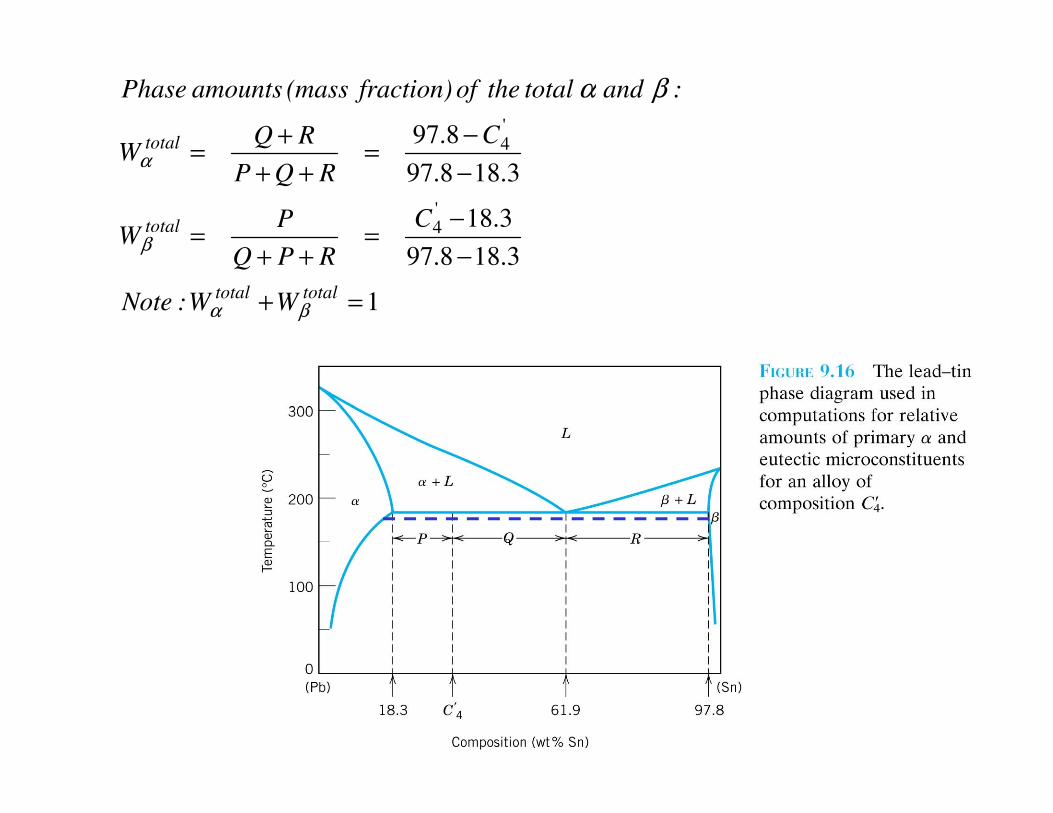
Eutectic structure
• Microstructure of solid that results from the
eutectic reaction
• Alternating layers (lamellae) of α and β phases
that form simultaneouslythat form simultaneously
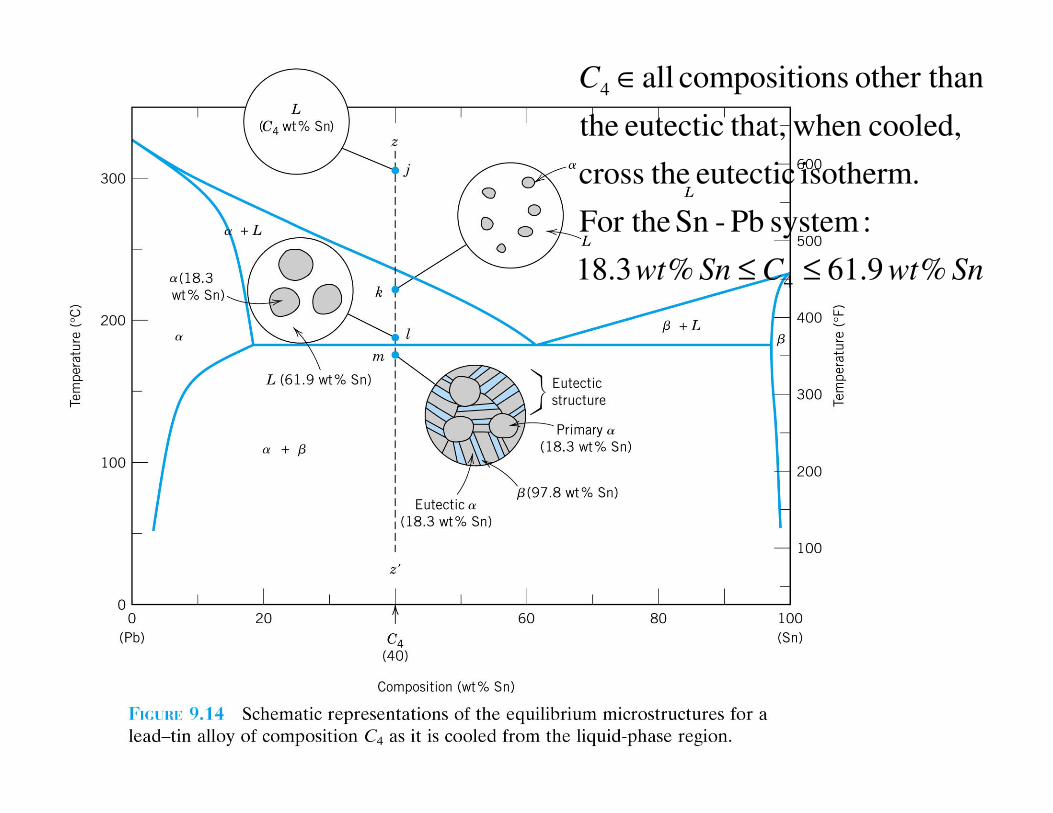
SnwtCSnwt
C
%9.61%3.18
:system Pb-Sn For the
isotherm. eutectic thecross
cooled, when that,eutectic the
other than nscompositio all
4
4
≤≤
∈
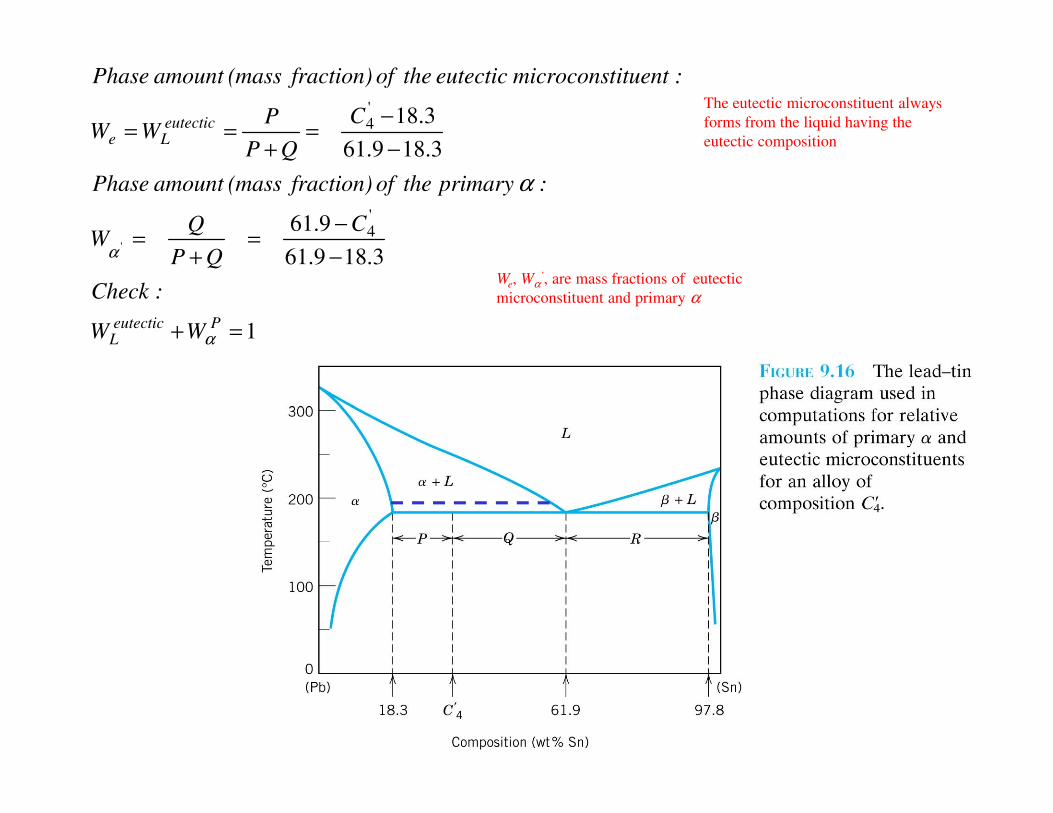
1
3.189.61
9.61
3.189.61
3.18
'4
'4
'
=+
−
−=
+=
−
−=
+==
PeutecticL
eutecticLe
WW
:Check
C
QP
QW
:primary the of fraction) (mass amount Phase
C
QP
PWW
:ituentmicroconst eutectic the of fraction) (mass amount Phase
α
α
α
The eutectic microconstituent always
forms from the liquid having the
eutectic composition
We, Wα’, are mass fractions of eutectic
microconstituent and primary α
1
3.188.97
3.18
3.188.97
8.97
'4
'4
=+
−
−=
++=
−
−=
++
+=
totaltotal
total
total
WW :Note
C
RPQ
PW
C
RQP
RQW
: and total the of fraction) (mass amounts Phase
βα
β
α
βα
Intermediate Phases or Compounds
• Terminal Solid Solution
– The two solid phases exist over composition ranges
near the concentration extremes
• Intermediate Solid Solution• Intermediate Solid Solution
– Intermediate phases found at other than the two
composition extremes
• Intermetallic Compound
– Discrete intermediate compounds exist (rather than
solid solutions) in metal-metal solutions
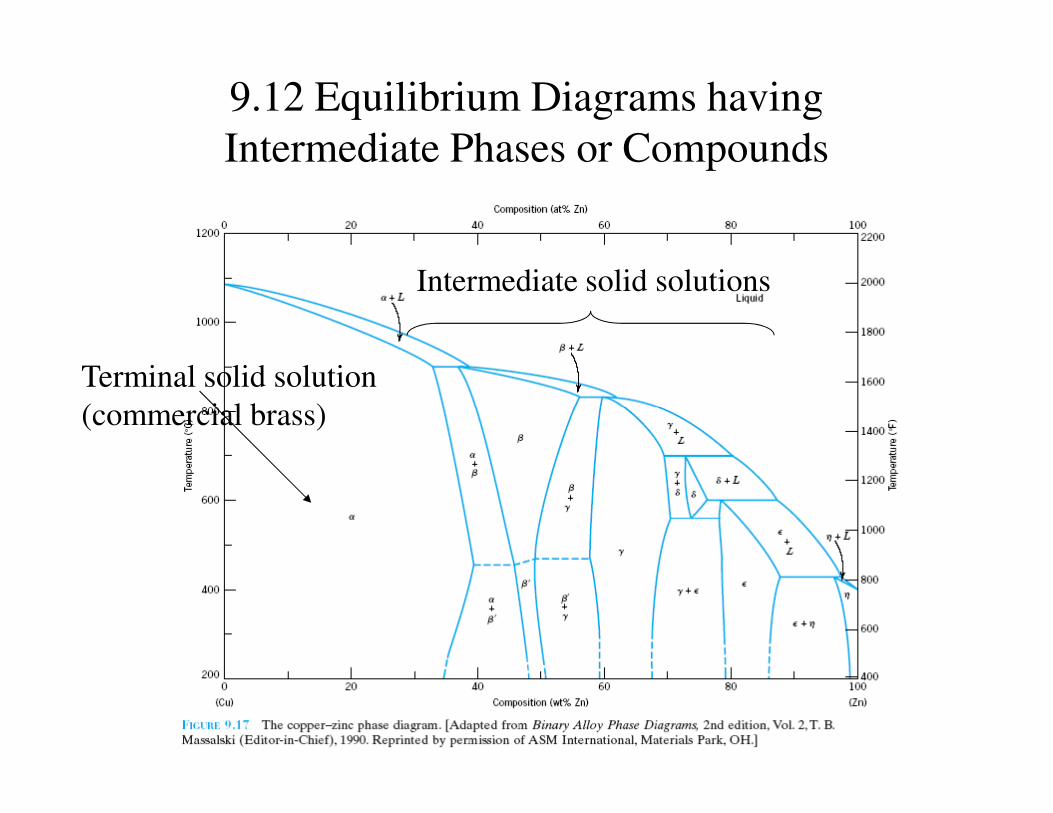
9.12 Equilibrium Diagrams having
Intermediate Phases or Compounds
Intermediate solid solutions
Terminal solid solution
(commercial brass)(commercial brass)
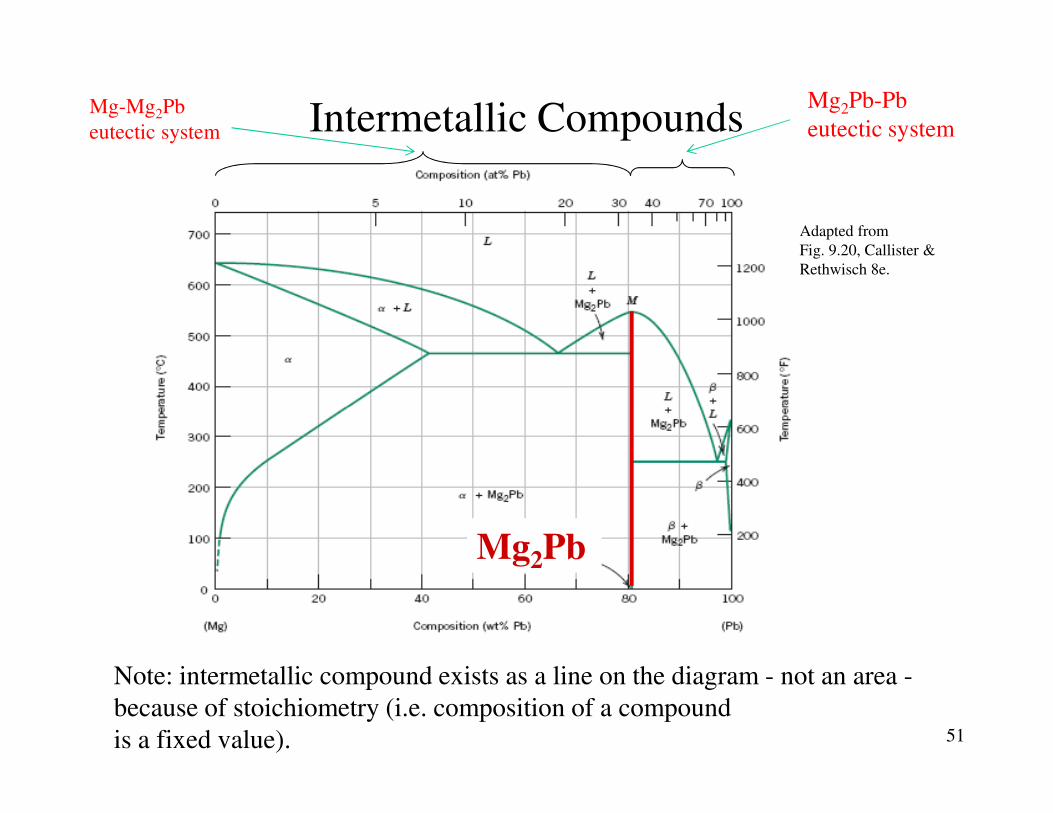
Intermetallic Compounds
Adapted from
Fig. 9.20, Callister &
Rethwisch 8e.
Mg-Mg2Pb
eutectic system
Mg2Pb-Pb
eutectic system
51
Mg2Pb
Note: intermetallic compound exists as a line on the diagram - not an area -
because of stoichiometry (i.e. composition of a compound
is a fixed value).
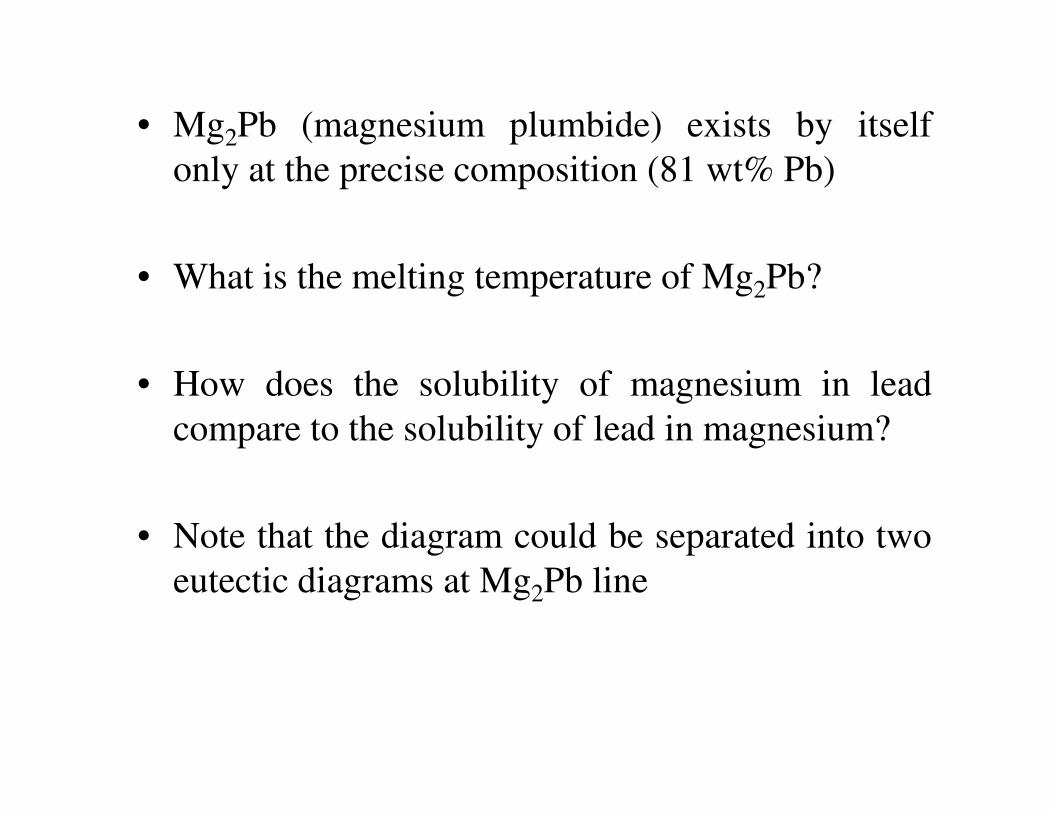
• Mg2Pb (magnesium plumbide) exists by itself
only at the precise composition (81 wt% Pb)
• What is the melting temperature of Mg2Pb?
• How does the solubility of magnesium in lead
compare to the solubility of lead in magnesium?
• Note that the diagram could be separated into two
eutectic diagrams at Mg2Pb line
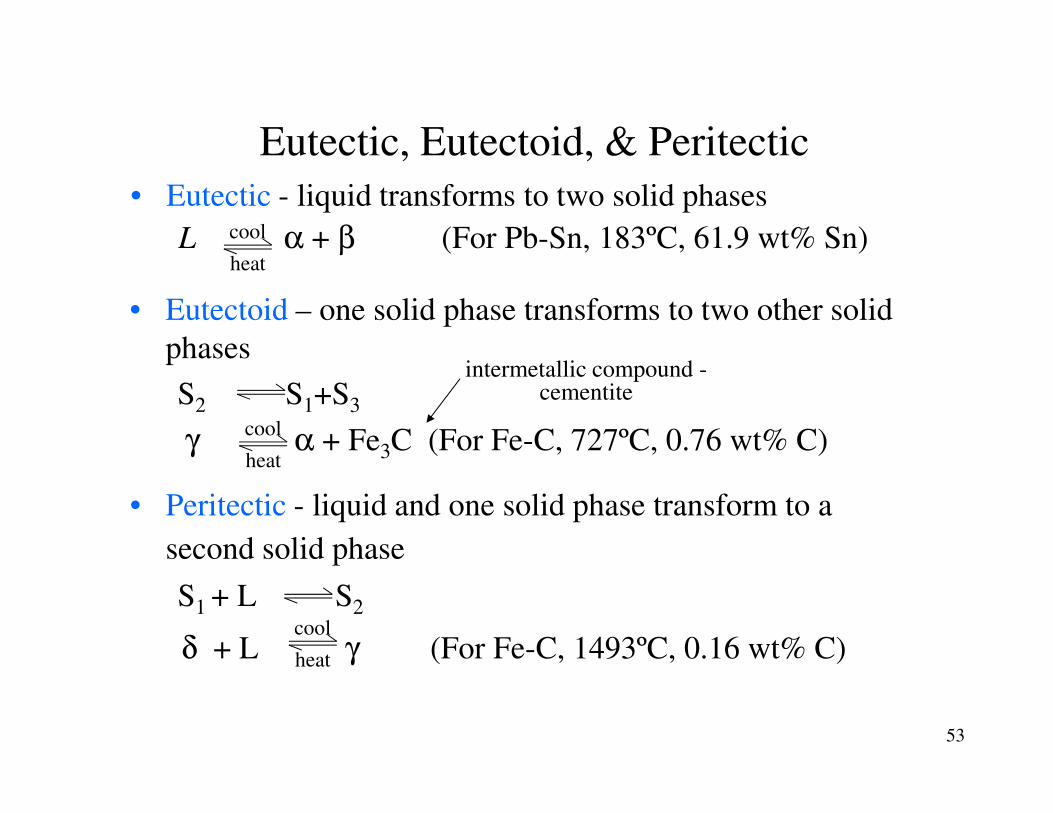
• Eutectoid – one solid phase transforms to two other solid
phases
S2 S1+S3
intermetallic compound -cementite
Eutectic, Eutectoid, & Peritectic
• Eutectic - liquid transforms to two solid phases
L α + β (For Pb-Sn, 183ºC, 61.9 wt% Sn)cool
heat
53
S2 S1+S3
γ α + Fe3C (For Fe-C, 727ºC, 0.76 wt% C)cool
heat
cool
heat
• Peritectic - liquid and one solid phase transform to a
second solid phase
S1 + L S2
δ + L γ (For Fe-C, 1493ºC, 0.16 wt% C)
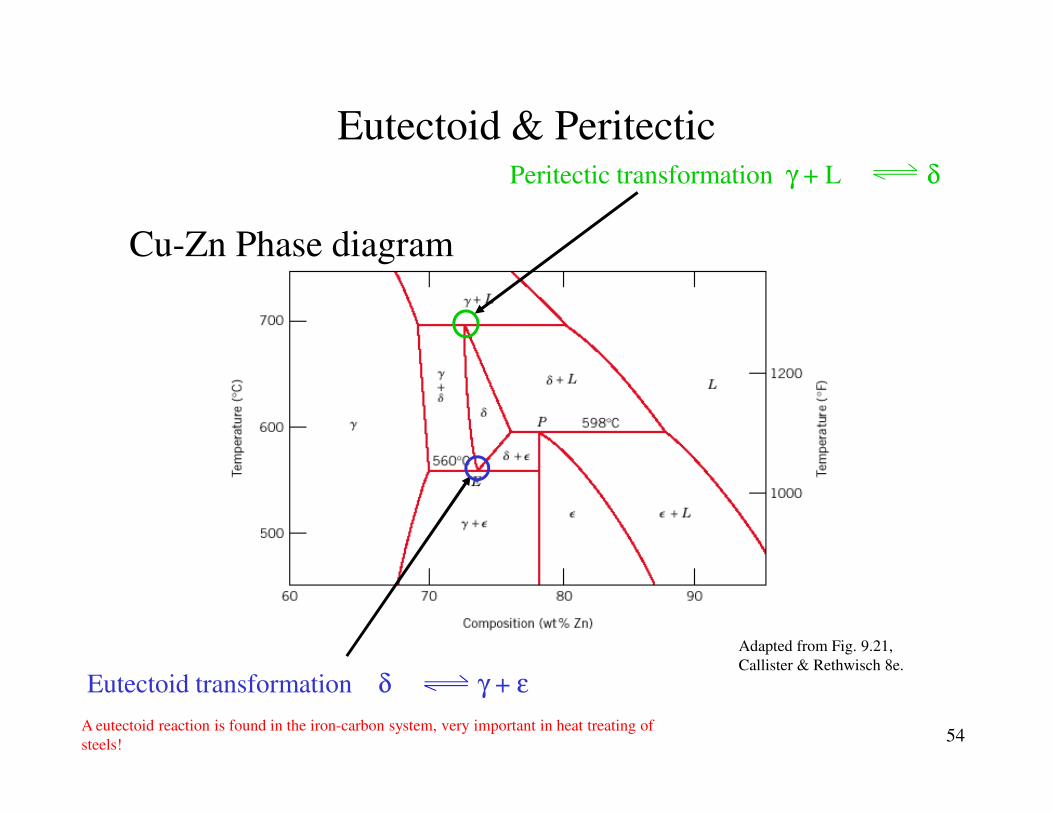
Eutectoid & Peritectic
Cu-Zn Phase diagram
Peritectic transformation γ + L δ
54
Adapted from Fig. 9.21,
Callister & Rethwisch 8e.
Eutectoid transformation δ γ + ε
A eutectoid reaction is found in the iron-carbon system, very important in heat treating of
steels!
9.15 Congruent Phase Transformations
• Transformations with no change in composition• Melting of pure materials
• Allotropic transformations
• Incongruent• Incongruent
– At least one of the phases will experience a change in
composition
• Eutectic, eutectoid
• Melting of an alloy that belongs to an isomorphous system
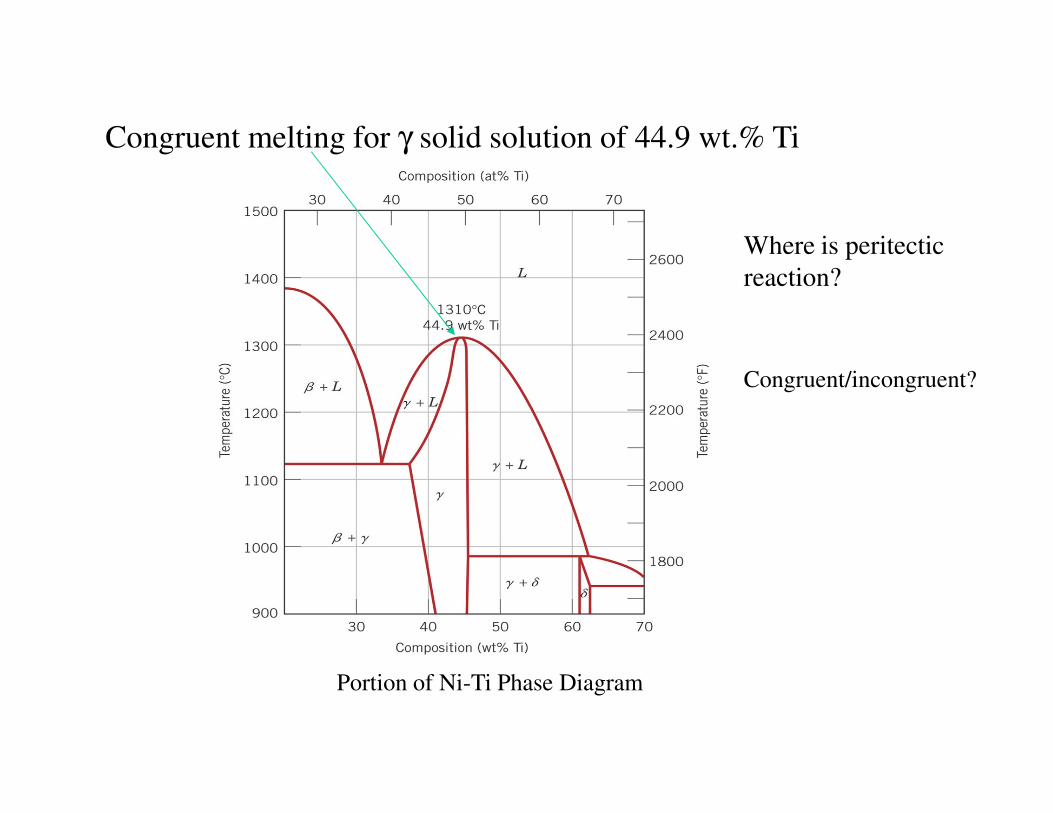
Congruent melting for γ solid solution of 44.9 wt.% Ti
Where is peritectic
reaction?
Congruent/incongruent?
Portion of Ni-Ti Phase Diagram
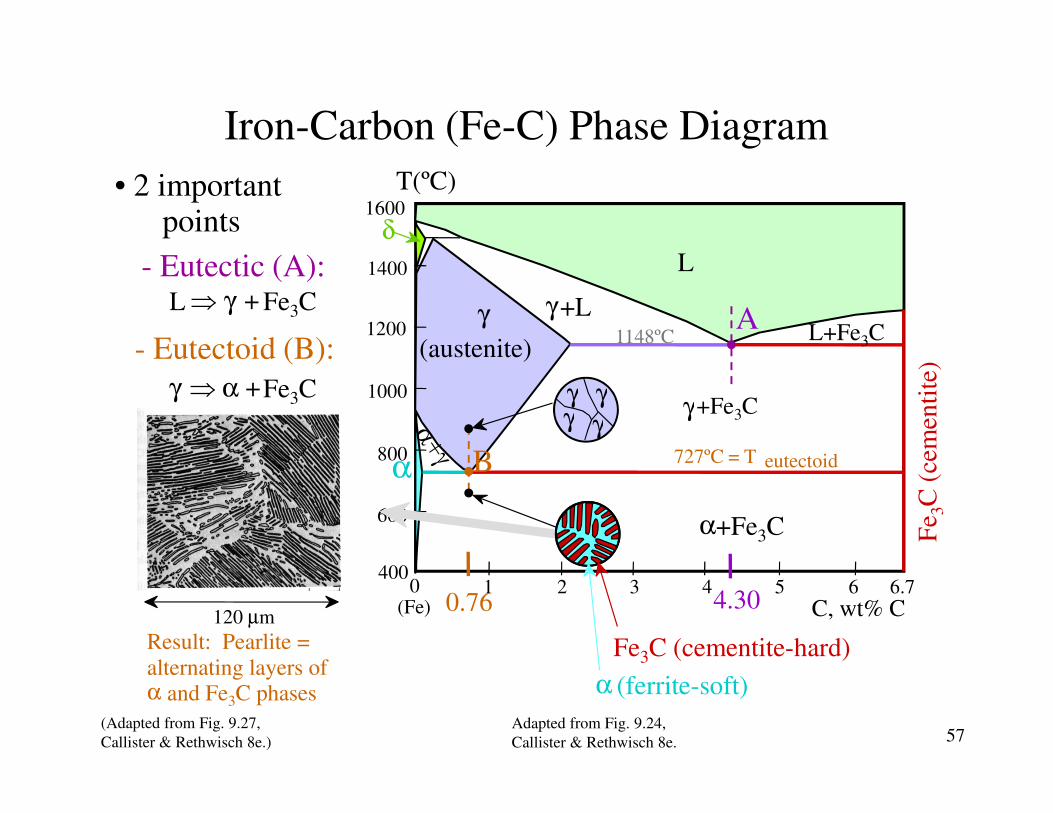
Iron-Carbon (Fe-C) Phase Diagram
• 2 important points
- Eutectoid (B):
γ ⇒ α +Fe3C
- Eutectic (A):L⇒ γ + Fe3C
C (
cem
enti
te)
1600
1400
1200
1000
L
γ
(austenite)
γ+L
γ+Fe3C
δ
1148ºC
T(ºC)
γ γγγ
AL+Fe3C
57Adapted from Fig. 9.24,
Callister & Rethwisch 8e.
Fe 3
C (
cem
enti
te)
800
600
4000 1 2 3 4 5 6 6.7
γ+Fe3C
α+Fe3C
(Fe) C, wt% C
α 727ºC = T eutectoid
4.30
Result: Pearlite =
alternating layers of α and Fe3C phases
120 µm
(Adapted from Fig. 9.27,
Callister & Rethwisch 8e.)
0.76
B
γ γγγ
Fe3C (cementite-hard)
α (ferrite-soft)
C (
cem
enti
te)
1600
1400
1200
1000
800
L
γ
(austenite)
γ+L
γ + Fe3C
L+Fe3C
δ
1148ºC
T(ºC)
(Fe-C
System)
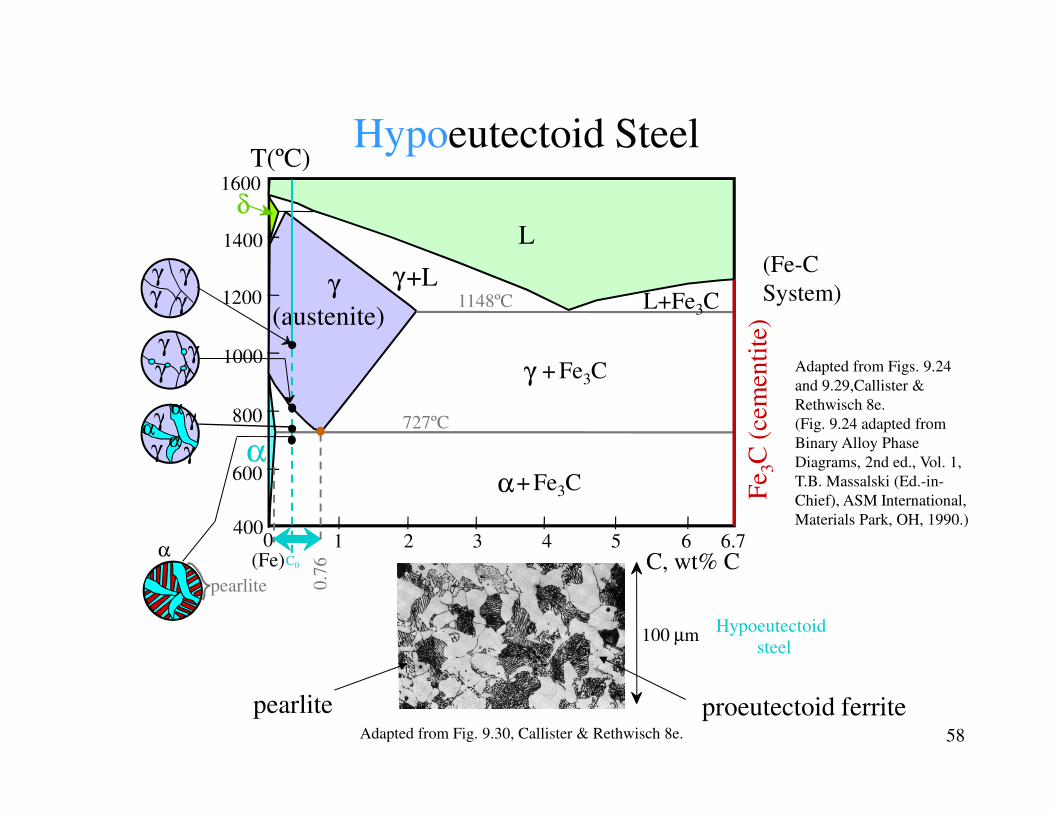
Hypoeutectoid Steel
Adapted from Figs. 9.24
and 9.29,Callister &
Rethwisch 8e. γ γα
γγγ γ
γ γγγ
58
Fe 3
C (
cem
enti
te)
800
600
4000 1 2 3 4 5 6 6.7
α+ Fe3C
(Fe) C, wt% C
α727ºC
C0
0.7
6
Rethwisch 8e.
(Fig. 9.24 adapted from
Binary Alloy Phase
Diagrams, 2nd ed., Vol. 1,
T.B. Massalski (Ed.-in-
Chief), ASM International,
Materials Park, OH, 1990.)
Adapted from Fig. 9.30, Callister & Rethwisch 8e.
proeutectoid ferritepearlite
100 µmHypoeutectoid
steel
α
pearlite
γ
γ γ
γα
αα
C (
cem
enti
te)
1600
1400
1200
1000
800
L
γ
(austenite)
γ+L
γ + Fe3C
L+Fe3C
δ
1148ºC
T(ºC)
(Fe-C
System)
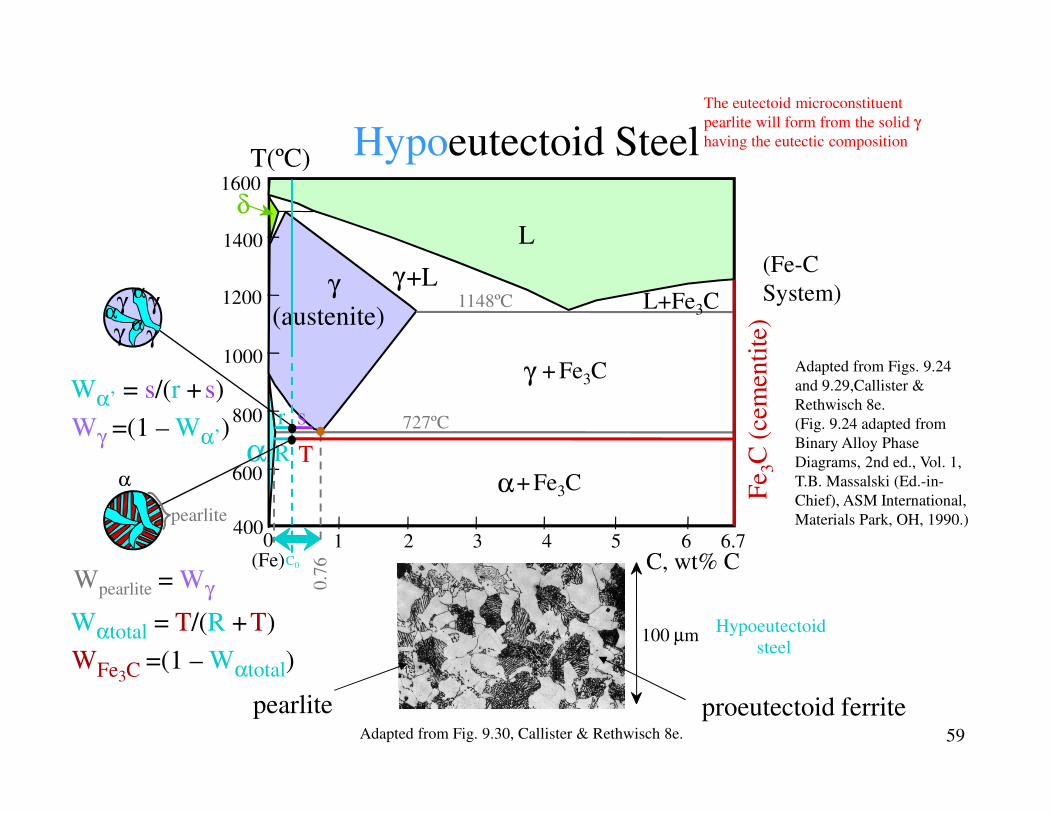
Hypoeutectoid Steel
γ
γ γ
γα
αα
srWα’ = s/(r + s)
Adapted from Figs. 9.24
and 9.29,Callister &
Rethwisch 8e.
The eutectoid microconstituent
pearlite will form from the solid γhaving the eutectic composition
59
Fe 3
C (
cem
enti
te)
800
600
4000 1 2 3 4 5 6 6.7
α+ Fe3C
(Fe) C, wt% C
α727ºC
C0
0.7
6
srWγ =(1 – Wα’)R T
α
pearlite
Wpearlite = Wγ
Wαtotal = T/(R +T)
W =(1 – Wαtotal)Fe3C
Rethwisch 8e.
(Fig. 9.24 adapted from
Binary Alloy Phase
Diagrams, 2nd ed., Vol. 1,
T.B. Massalski (Ed.-in-
Chief), ASM International,
Materials Park, OH, 1990.)
Adapted from Fig. 9.30, Callister & Rethwisch 8e.
proeutectoid ferritepearlite
100 µmHypoeutectoid
steel
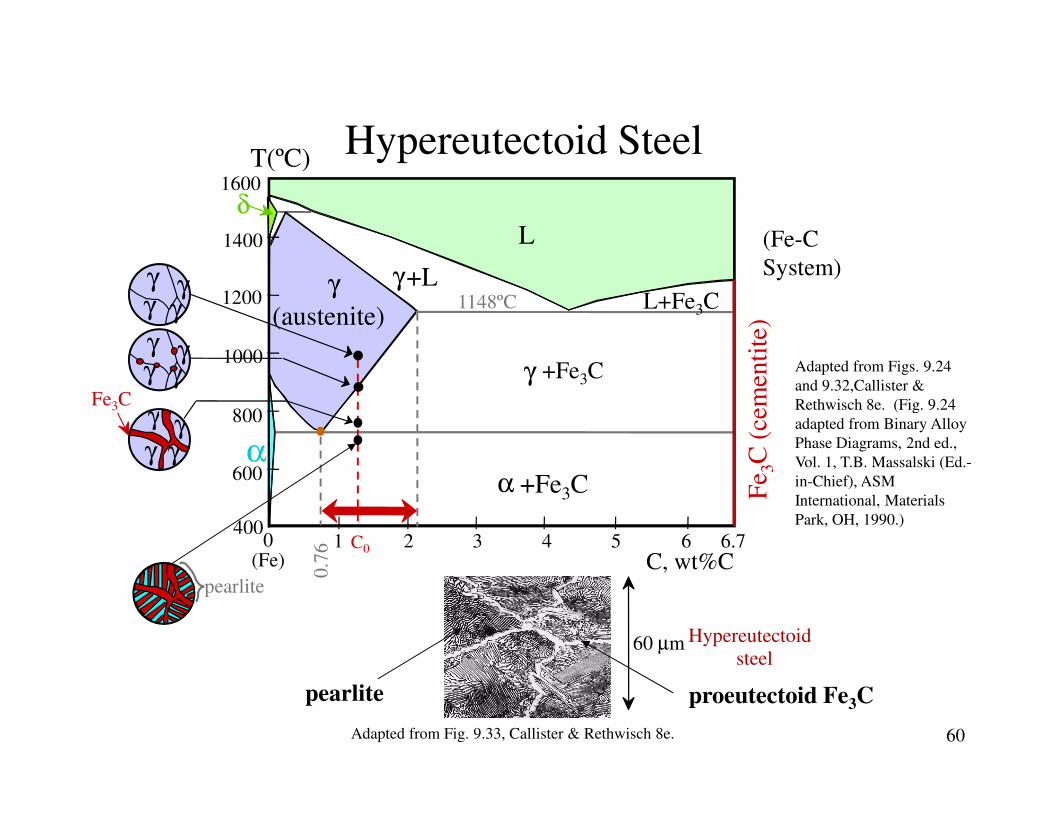
Hypereutectoid Steel
C (
cem
enti
te)
1600
1400
1200
1000
800
L
γ
(austenite)
γ+L
γ +Fe3C
L+Fe3C
δ
1148ºC
T(ºC)
Adapted from Figs. 9.24
and 9.32,Callister &
Rethwisch 8e. (Fig. 9.24
(Fe-C
System)
Fe3Cγ γ
γγγ γ
γγγ γ
60
Fe 3
C (
cem
enti
te)
800
600
4000 1 2 3 4 5 6 6.7
α +Fe3C
(Fe) C, wt%C
α
Rethwisch 8e. (Fig. 9.24
adapted from Binary Alloy
Phase Diagrams, 2nd ed.,
Vol. 1, T.B. Massalski (Ed.-
in-Chief), ASM
International, Materials
Park, OH, 1990.)
0.7
6 C0
Fe3C
γγ
γ γ
Adapted from Fig. 9.33, Callister & Rethwisch 8e.
proeutectoid Fe3C
60 µm Hypereutectoid
steel
pearlite
pearlite
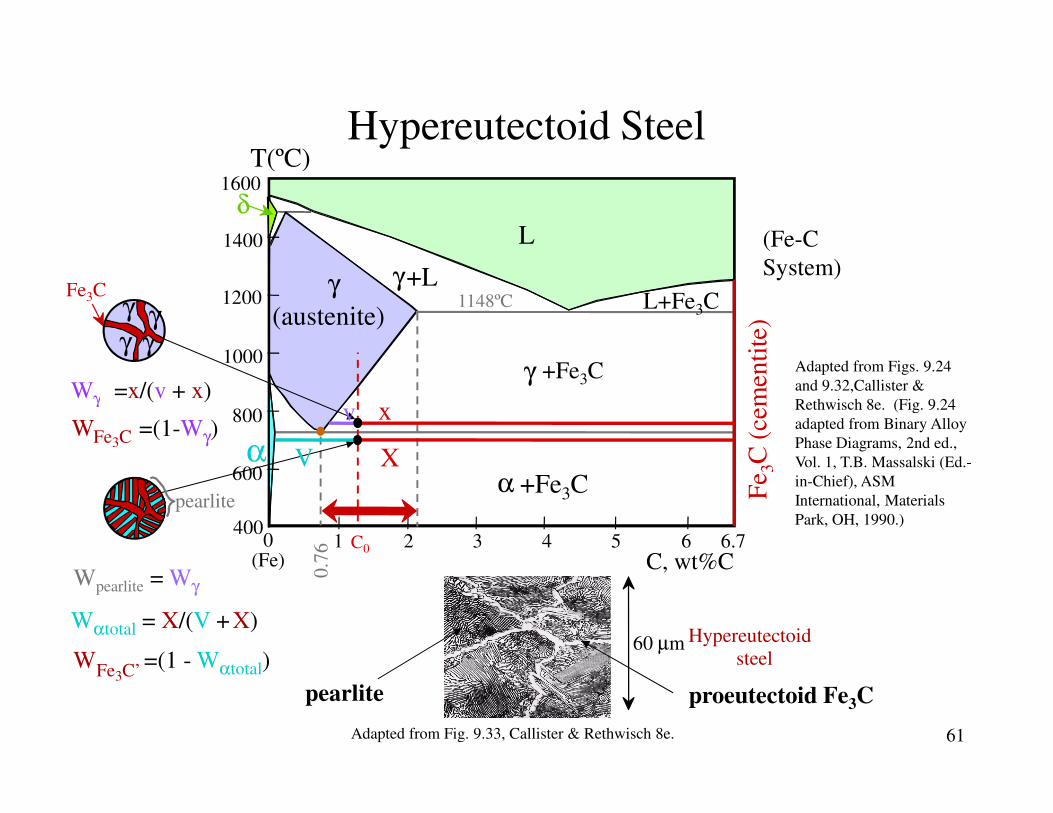
C (
cem
enti
te)
1600
1400
1200
1000
800
L
γ
(austenite)
γ+L
γ +Fe3C
L+Fe3C
δ
1148ºC
T(ºC)Hypereutectoid Steel
(Fe-C
System)Fe3C
γγ
γ γ
xvWγ =x/(v + x)
Adapted from Figs. 9.24
and 9.32,Callister &
Rethwisch 8e. (Fig. 9.24
61
Fe 3
C (
cem
enti
te)
800
600
4000 1 2 3 4 5 6 6.7
α +Fe3C
(Fe) C, wt%C
α
0.7
6 C0
pearlite
xv
V X
Wpearlite = Wγ
Wαtotal = X/(V +X)
W =(1 - Wαtotal)Fe3C’
W =(1-Wγ)Fe3C
Adapted from Fig. 9.33, Callister & Rethwisch 8e.
proeutectoid Fe3C
60 µm Hypereutectoid
steel
pearlite
Rethwisch 8e. (Fig. 9.24
adapted from Binary Alloy
Phase Diagrams, 2nd ed.,
Vol. 1, T.B. Massalski (Ed.-
in-Chief), ASM
International, Materials
Park, OH, 1990.)
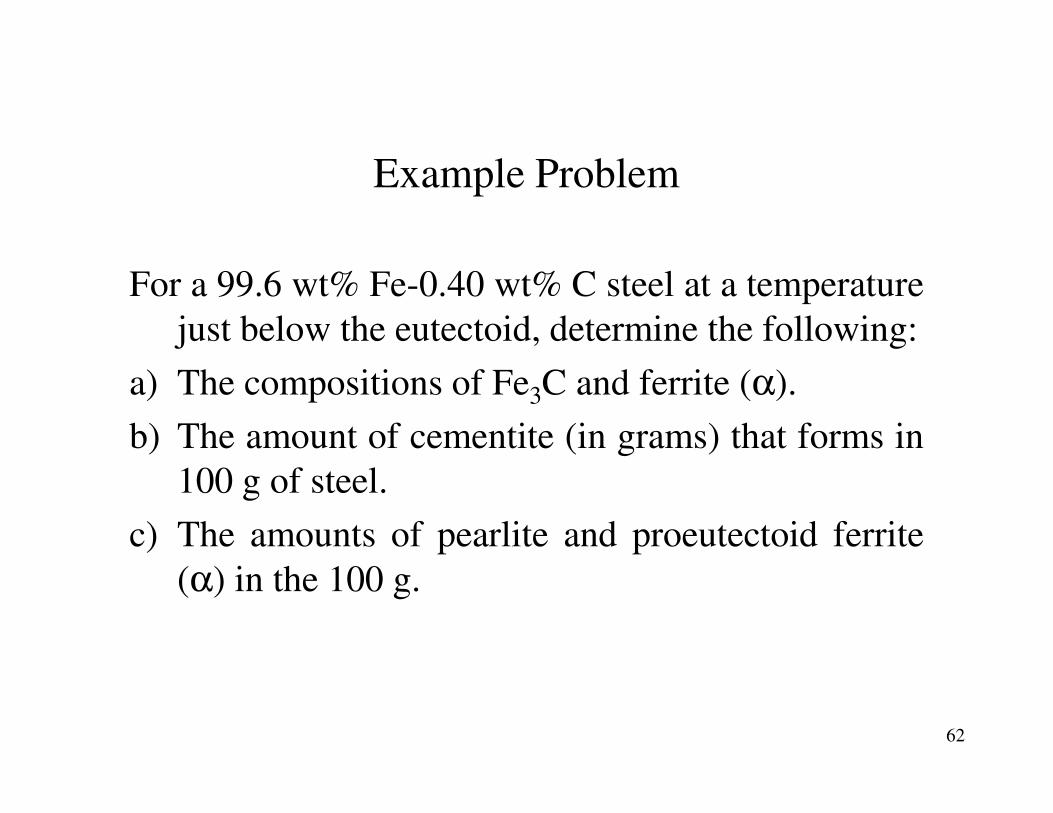
Example Problem
For a 99.6 wt% Fe-0.40 wt% C steel at a temperature
just below the eutectoid, determine the following:
a) The compositions of Fe3C and ferrite (α).
62
3
b) The amount of cementite (in grams) that forms in
100 g of steel.
c) The amounts of pearlite and proeutectoid ferrite
(α) in the 100 g.
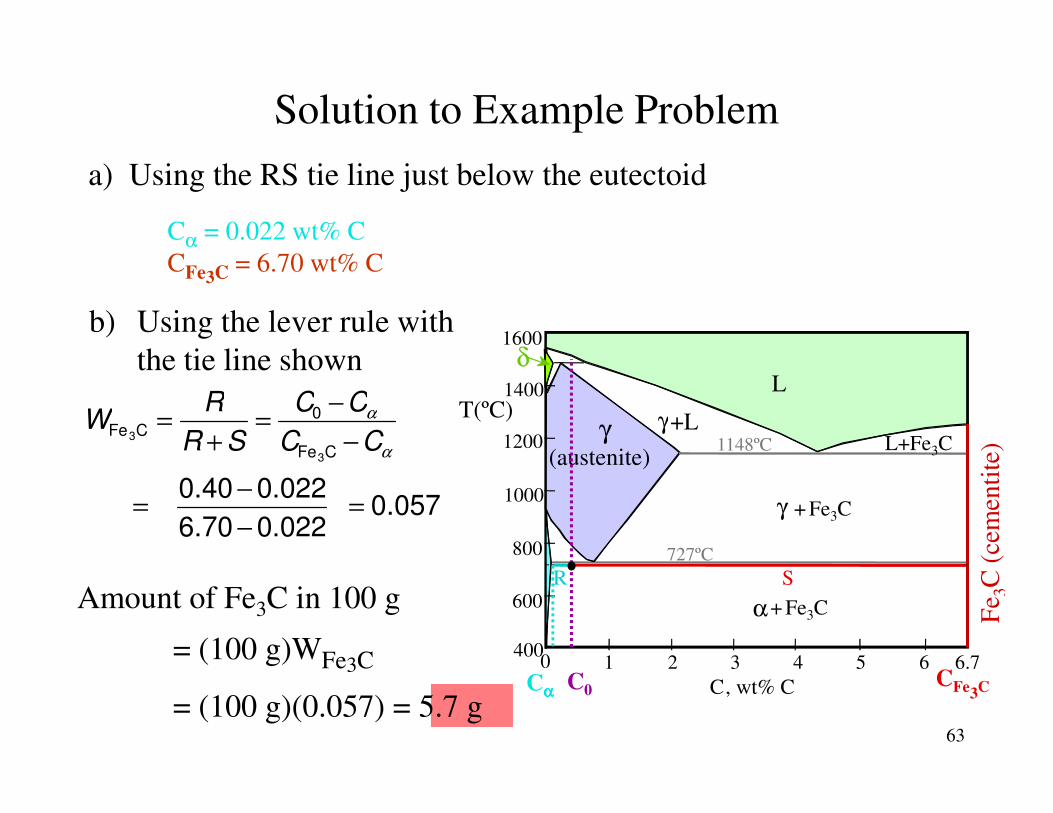
Solution to Example Problem
W =R
=C0 −Cα
b) Using the lever rule with
the tie line shown
a) Using the RS tie line just below the eutectoid
Cα = 0.022 wt% C
CFe3C = 6.70 wt% C
1600
1400 L
γ
δ
T(ºC)
63
WFe3C =R
R + S=
C0 −Cα
CFe3C −Cα
= 0.40 − 0.022
6.70 − 0.022 = 0.057
Fe 3
C (
cem
enti
te)1200
1000
800
600
4000 1 2 3 4 5 6 6.7
γ (austenite)
γ+L
γ + Fe3C
α+ Fe3C
L+Fe3C
C, wt% C
1148ºC
T(ºC)
727ºC
C0
R S
CFe C3Cαααα
Amount of Fe3C in 100 g
= (100 g)WFe3C
= (100 g)(0.057) = 5.7 g
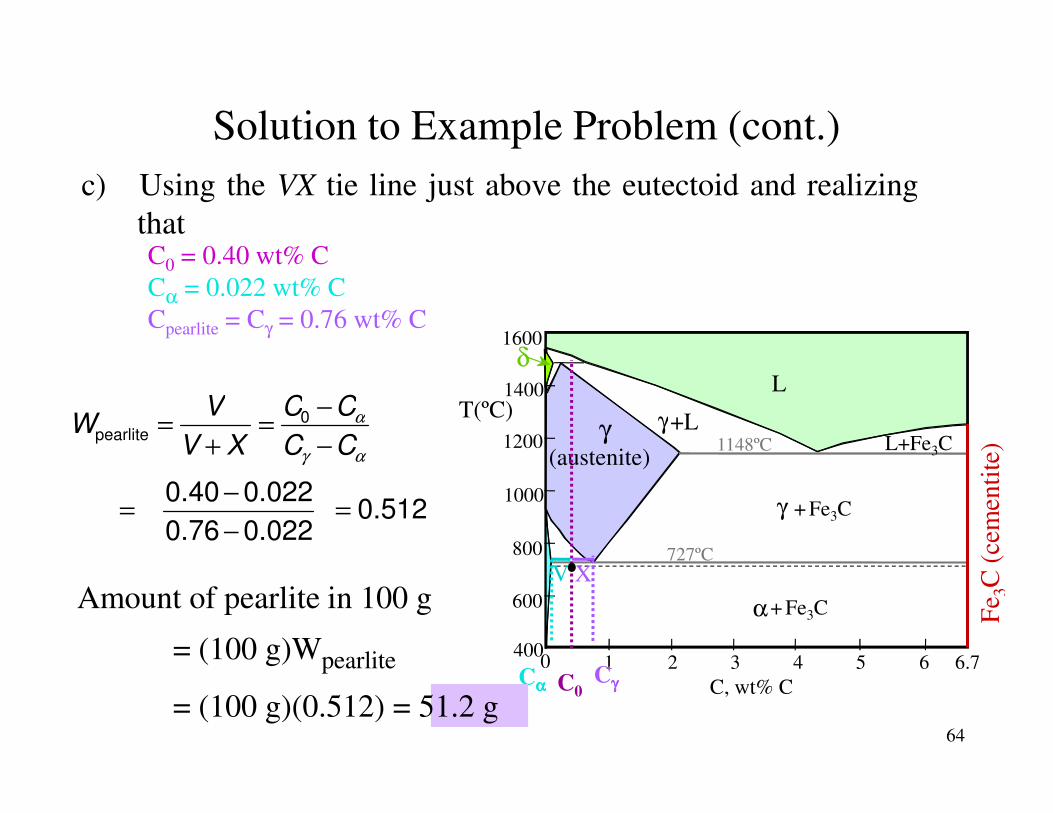
Solution to Example Problem (cont.)
c) Using the VX tie line just above the eutectoid and realizing
thatC0 = 0.40 wt% C
Cα = 0.022 wt% C
Cpearlite = Cγ = 0.76 wt% C1600
1400 L
γ
δ
T(ºC)=
V=
C −Cα
64
Fe 3
C (
cem
enti
te)1200
1000
800
600
4000 1 2 3 4 5 6 6.7
γ (austenite)
γ+L
γ + Fe3C
α+ Fe3C
L+Fe3C
C, wt% C
1148ºC
T(ºC)
727ºC
C0
V X
CγγγγCαααα
Wpearlite =V
V + X=
C0 −Cα
Cγ −Cα
= 0.40 − 0.022
0.76 − 0.022 = 0.512
Amount of pearlite in 100 g
= (100 g)Wpearlite
= (100 g)(0.512) = 51.2 g
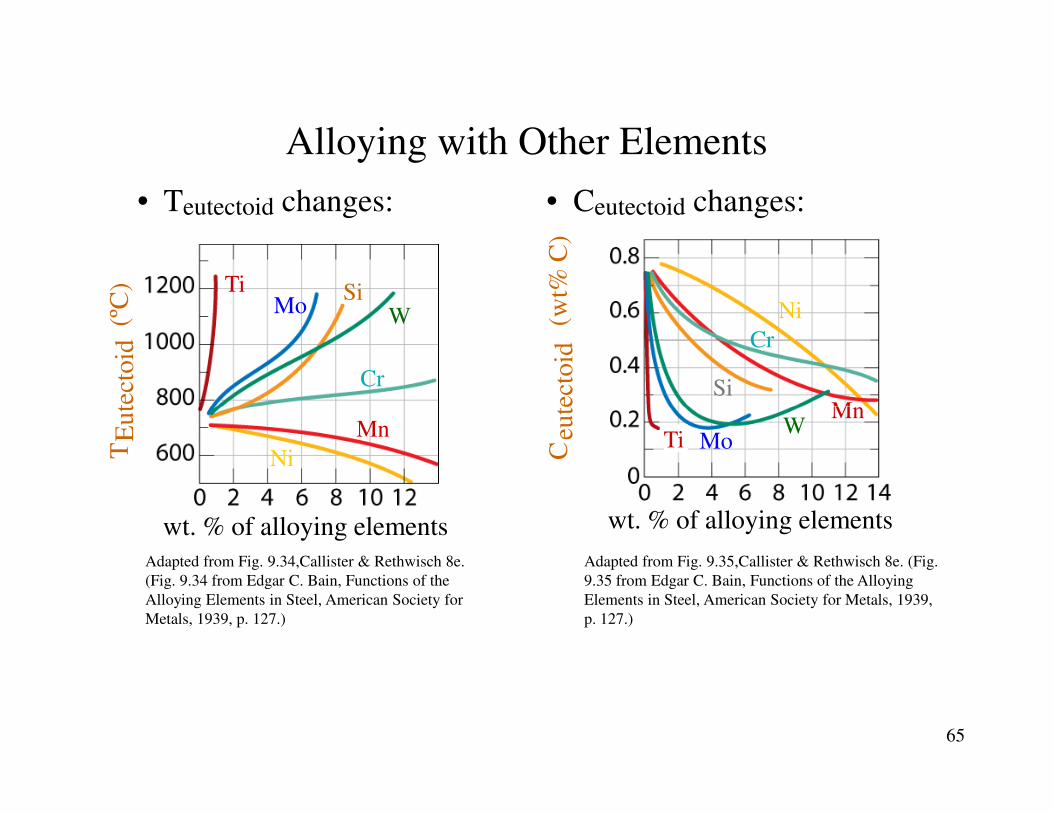
Alloying with Other Elements
• Teutectoid changes:
Eu
tect
oid
(ºC
) TiMo
SiW
Cr
• Ceutectoid changes:
eute
cto
id(w
t% C
)
Ni
Cr
SiMn
65
Adapted from Fig. 9.34,Callister & Rethwisch 8e.
(Fig. 9.34 from Edgar C. Bain, Functions of the
Alloying Elements in Steel, American Society for
Metals, 1939, p. 127.)
TE
ute
cto
id
wt. % of alloying elements
Ni
Mn
Adapted from Fig. 9.35,Callister & Rethwisch 8e. (Fig.
9.35 from Edgar C. Bain, Functions of the Alloying
Elements in Steel, American Society for Metals, 1939,
p. 127.)
wt. % of alloying elements
Ceu
tect
oid
Ti
MnW
Mo
• Phase diagrams are useful tools to determine:
-- the number and types of phases present,
-- the composition of each phase,
-- and the weight fraction of each phase
given the temperature and composition of the system.
Summary
66
• The microstructure of an alloy depends on
-- its composition, and
-- whether or not cooling rate allows for maintenance of
equilibrium.
• Important phase diagram phase transformations include
eutectic, eutectoid, and peritectic.
9.11, 9.13, 9.17, 9.20, 9.32
Core Problems:
ANNOUNCEMENTS
Reading:
9.1 thru 9.20, will not be tested on 9.16, 9.17
67
Self-help Problems: