Embed Size (px)
Citation preview

© 1999 Blackwell Science Ltd 1043
Plant, Cell and Environment (1999) 22, 1043–1055
interest in the variation of both photosynthesis and stomatal conductance over individual leaves (see reviews by Terashima 1992; Pospísilová & Santr °ucek 1994;Weyers & Lawson 1997). Stomatal heterogeneity at thewhole leaf level has been demonstrated directly by micro-scopic studies (e.g. Spence 1987; Smith, Weyers & Berry1989; van Gardingen, Jeffree & Grace 1989), from obser-vations of leaf infiltration patterns (Beyschlag & Pfanz1990) or by survey studies using porometer or infrared gasanalysis (IRGA) data (Weyers & Lawson 1997). Stomatalheterogeneity has also been inferred from evidence forphotosynthetic heterogeneity, whether from 14C fixation orstarch accumulation (Downton, Loveys & Grant 1988;Terashima et al. 1988) or via chlorophyll fluorescenceimaging as an estimate of electron transport (Daley et al.1989; Mott, Gordon & Berry 1993; Eckstein et al. 1996;Meyer & Genty 1998). There is increasing circumstantialevidence, however, that in many cases stomatal conduc-tance is not necessarily closely coupled to variation ofassimilation rate (Barradas & Jones 1996; Weyers &Lawson 1997; Jones 1998).
Unfortunately most methods for studying heterogeneityare not capable of giving quantitative information on vari-ation in stomatal conductance (Beyschlag & Pfanz 1990) orare at best of rather coarse resolution (Weyers & Lawson1997), labour-intensive or interfere significantly with thenatural leaf behaviour (especially microscopic and chambermethods). The increasing availability of sensitive infraredimaging systems opens up the possibility of high resolutionstudies of stomatal variation over leaf surfaces and theirdynamics.
Although some infrared thermographic measurements oftemperature variation over leaf surfaces have been made,most have been concerned with the investigation ofprocesses such as boundary-layer heat transfer processes(Raschke 1960; Clark & Wigley 1974;Wigley & Clark 1974),thermogenesis (van Der Straeten et al. 1995) or the detec-tion of freezing (Wisniewski, Lindow & Ashworth 1997).Limited studies on stomata (Hashimoto, Morimoto &Funada 1982, Hashimoto et al. 1984) have confirmed thatthermal imaging can have adequate resolution to detectlocal variation in stomatal aperture and have shown, usingelectron microscopy, that there can be a relationshipbetween leaf temperature variation and stomatal aperture.
ABSTRACT
This paper describes a new approach to the calibration ofthermal infrared measurements of leaf temperature for theestimation of stomatal conductance and illustrates its appli-cation to thermal imaging of plant leaves. The approach isbased on a simple reformulation of the leaf energy balanceequation that makes use of temperature measurements onreference surfaces of known conductance to water vapour.The use of reference surfaces is an alternative to the accu-rate measurement of all components of the leaf energybalance and is of potentially wide application in studies ofstomatal behaviour. The resolution of the technique whenapplied to thermal images is evaluated and some results ofusing the approach in the laboratory for the study of stom-atal behaviour in leaves of Phaseolus vulgaris L. are presented. Conductances calculated from infrared mea-surements were well correlated with estimates obtainedusing a diffusion porometer.
Key-words: infrared thermography; leaf energy balance;leaf temperature; stomatal conductance; stomatal hetero-geneity; thermal imaging.
INTRODUCTION
It is well established from energy balance considerationsthat leaf temperature varies with evaporation from leavesand hence is a function of stomatal conductance (Tanner1963; Fuchs & Tanner 1966; Jones 1992). On the basis ofthis, remote infrared sensing of canopy temperature (as asurrogate for stomatal conductance) has become an estab-lished technique for irrigation scheduling in arid environ-ments (e.g. Idso et al. 1981; Idso 1982; Fuchs 1990; Jones1994) and a number of papers have used formulations ofthe basic energy balance equation to derive more or lessexplicit estimates of stomatal conductance from infraredthermometry or thermography in the field (Inoue 1987;Smith, Barrs & Fischer 1988; Inoue et al. 1990; Taconet et al. 1995; Jones et al. 1997).
In the last 15 years or so there has been increasing
Correspondence: Hamlyn Jones. Fax: + 44 382344275; e-mail:[email protected]
Use of thermography for quantitative studies of spatialand temporal variation of stomatal conductance over leafsurfaces
H. G. JONES
Department of Biological Sciences, University of Dundee, Dundee DD1 4HN, Scotland, UK

Nevertheless there remains a need to investigate the quan-titative relationship between temperature variation over aleaf surface, as obtained by thermal imaging, and stomatalconductance.
This paper describes the use of infrared thermography asa flexible and powerful technique for the quantitative studyof spatial and temporal variation of stomatal conductancein plant leaves and presents a new calibration approachbased on model surfaces of known conductance as internalreferences, thus reducing reliance on environmental measurements.
MATERIALS AND METHODS
Basic theory
The evaporative cooling as water is lost through stomata isan important component of the local leaf energy balance,so leaf temperature can provide a sensitive indicator of leafconductance to water vapour (glW) or its reciprocal, the leafresistance (rlW). Although strictly glW includes the conduc-tance to water loss through the cuticle as well as throughthe stomata, in most cases it can be taken as an approxi-mation to the stomatal conductance and the two terms willbe used interchangeably. Evaluation of the leaf energybalance gives the following dependence of leaf–air tem-perature difference on the total resistance to loss of watervapour (rW) (see Jones 1992; equation 9·6):
(1)
where Tleaf - Tair is the leaf-to-air temperature difference,Rni is the net isothermal radiation (the net radiation thatwould be received by an equivalent surface at air temper-ature), de is the air water vapour pressure deficit (VPD),rHR is the parallel resistance to heat (raH) and radiativetransfer (rR = 4esTair
4/rcp), e is the emissivity of the surface,s is the Stefan-Bolzmann constant, g is the psychrometricconstant, r is the density of air, cp is the specific heat capac-ity of air and s is the slope of the curve relating saturationvapour pressure to temperature. All resistances and energyexchanges are expressed per unit projected leaf area. Foramphistomatous leaves rW is simply the sum of the bound-ary layer and stomatal resistances (raW + rlW), but forhypostomatous leaves it is given by (2raW + rlW) (see Monteith & Unsworth 1990).
Although data on appropriate estimates of boundarylayer resistances for the low windspeeds common in thelaboratory are scanty (Schuepp 1993) an estimate can bemade assuming that the value of the boundary layer resis-tance to heat transfer (raH; units, s mm-1) is given as theparallel sum of a forced convection component calculatedaccording to Jones (1992; equation 3·31 divided by thefactor of 1·5 to allow for instability in the boundary layer)
(2)
and a free convection component estimated (Monteith &Unsworth 1990) as:
r d uaH forced( ) = ( ) ◊100 0 5
T Tr r R r e c
r srleaf air
HR W ni HR p
p W HRc- =
( ) -( ) +[ ]
g d rr g
1044 H. G. Jones
(3)
where d is the characteristic dimension of the leaf and u is the windspeed. The boundary layer resistance to watervapour transport was estimated as 0·92 raH (Jones 1992).The relative importance of free convection increases aswindspeed decreases. For the theoretical estimates of sen-sitivity of leaf temperature to stomatal conductance, Eqn 1was solved by iteration, after initially assuming that theresistance to free convection was infinite and then using thecalculated (Tleaf - Tair) to revise the estimated boundarylayer resistance. Where necessary, conversion betweenmolar units (e.g. mmol m-2 s-1) and mass units (e.g. mms-1) for conductance or resistance was according to equa-tion 3·23 in Jones (1992), i.e. at 25 °C, gW (mmol m-2
s-1) = 40 gW (mm s-1).
Calibration for estimation of leaf conductance
It is clear from Eqn 1 that leaf temperature depends notonly on stomatal resistance (or conductance) but also on arange of other environmental and plant variables; it is thiscomplexity and the associated difficulty of measuring allthese variables accurately that has made it difficult toobtain accurate absolute estimates of stomatal conductancefrom measurements of leaf temperature. One approach tocalibration is to use the temperatures of comparable sur-faces of similar size and surface characteristics to the leafof interest. If these are similarly exposed to incident radia-tion and have known surface conductance to water vapourit is possible to eliminate the need for estimation of theenvironmental variables.
It can be shown (Appendix; Jones 1999) that substitutionof the surface temperature of a wet surface (Twet where rlW
= 0) and of a dry surface (Tdry where rlW = •) into Eqn 1and eliminating Tair, Rn and de from the resulting equations,enables one to write
(4)
where G equals {1/(raW + (s/g)rHR)} for amphistomatousleaves or models and {1/(2raW + (s/g)rHR)} for hypostoma-tous leaves or models.An important feature of Eqn 4 is thatglW can be determined solely from a combination of mea-surements of the temperatures of the leaf and of equivalentwet and dry surfaces and a term, G, that depends only onthe resistance to heat and water loss through the leafboundary layer. It is also notable that the multiplier in thisequation (G) is independent of net radiation absorbed orof air vapour pressure deficit and only weakly dependenton temperature.
Unfortunately estimation of absolute values of glW fromEqn 4 requires an independent estimate of the boundarylayer resistance. Although this can be obtained by calcula-tion from Eqns 2 and 3, it is more convenient to estimateG directly using thermal data. This can be done by meas-uring the temperature of another similar surface with aknown intermediate conductance to water vapour (gref).In this case, the boundary layer term can then be estimated
g T T T T Glw dry leaf leaf wet= -( ) -( ){ } ¥
r T TaH leaf airfree( ) = -( ) ◊400 0 33
© 1999 Blackwell Science Ltd, Plant, Cell and Environment, 22, 1043–1055
from measurements of Tdry, Twet and the temperature of the surface with known conductance (Tref) after sub-stituting gref for glW and Tref for Tleaf in Eqn 4 and rearranging
(5)
This calibration can then be substituted back into Eqn 4and used to estimate the surface conductance correspond-ing to any measured temperature for a leaf under the sameconditions. As an extension of this approach the value ofthe term G could be estimated by fitting data for two ormore different model surfaces. A number of microporousmembranes are now available which could be used toprovide a range of known conductances (see below).
Thermal imaging
Thermal images were obtained using a Thermovision 900LW/ST Sterling-cooled long-wave (8–12 mm) infraredimaging system with a 10° lens controlled using IRWinRes1·1 software [Agema Infrared Systems Ltd. (now known asFTIR Systems), Leighton Buzzard, UK]. Macro imageswere obtained using a 20° lens with supplementary close-up lens. The detector array has 230 elements per line and atemperature resolution of 0·08 °C, and the software allowscorrection for object emissivity (set empirically at 0·93 forleaf material in this study, which is within the range quotedfor Phaseolus vulgaris; Idso et al. 1969), object distance,relative humidity and ambient temperature. Air tempera-ture was measured with a precision mercury-in-glass ther-mometer accurate to better than 0·1 °C. Leaf and referencesurface temperatures obtained by the thermal imager werecompared with those measured using inserted 40 gaugecopper-constantan thermocouples read on a microvolt-meter. Agreement for leaves was generally within ± 0·3 °C,which is within the error of the thermocouple measure-ments suggesting that the emissivity values used wereappropriate, but there was some evidence that the imagerunderestimated the temperature of the reference surfacesby about 0·5 °C (equivalent to an emissivity error ofapproximately 0·008). Observed temperatures of dry andfilm-covered surfaces were therefore increased by 0·5 °Cfor calculations. We did not detect any effect of the direc-
G g T T T T= -( ) -( )ref ref wet dry ref
Thermographic studies of stomatal conductance over leaf surfaces 1045
tion of view of the imager (i.e. whether the leaf was viewedfrom the adaxial or abaxial side) on the results obtained.For convenience, all the results presented are for leavesviewed from the adaxial side.
Stomatal/surface conductance
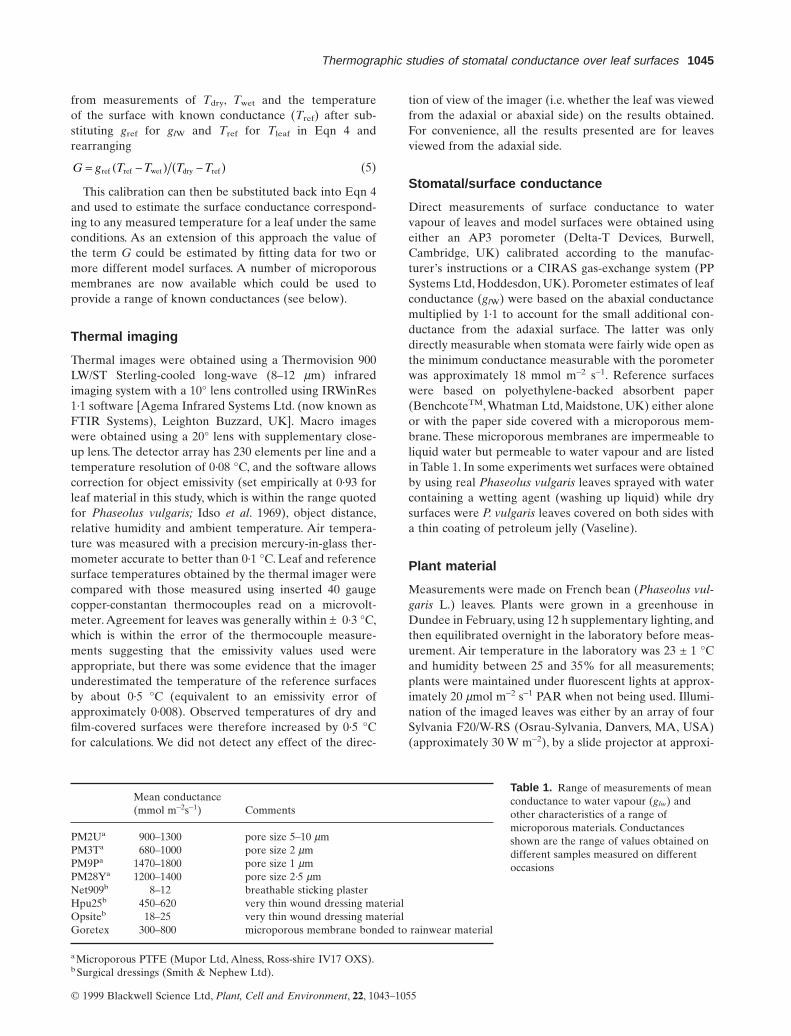
Direct measurements of surface conductance to watervapour of leaves and model surfaces were obtained usingeither an AP3 porometer (Delta-T Devices, Burwell,Cambridge, UK) calibrated according to the manufac-turer’s instructions or a CIRAS gas-exchange system (PPSystems Ltd, Hoddesdon, UK). Porometer estimates of leafconductance (glW) were based on the abaxial conductancemultiplied by 1·1 to account for the small additional con-ductance from the adaxial surface. The latter was onlydirectly measurable when stomata were fairly wide open asthe minimum conductance measurable with the porometerwas approximately 18 mmol m-2 s-1. Reference surfaceswere based on polyethylene-backed absorbent paper(BenchcoteTM, Whatman Ltd, Maidstone, UK) either aloneor with the paper side covered with a microporous mem-brane. These microporous membranes are impermeable toliquid water but permeable to water vapour and are listedin Table 1. In some experiments wet surfaces were obtainedby using real Phaseolus vulgaris leaves sprayed with watercontaining a wetting agent (washing up liquid) while drysurfaces were P. vulgaris leaves covered on both sides witha thin coating of petroleum jelly (Vaseline).
Plant material
Measurements were made on French bean (Phaseolus vul-garis L.) leaves. Plants were grown in a greenhouse inDundee in February, using 12 h supplementary lighting, andthen equilibrated overnight in the laboratory before meas-urement. Air temperature in the laboratory was 23 ± 1 °Cand humidity between 25 and 35% for all measurements;plants were maintained under fluorescent lights at approx-imately 20 mmol m-2 s-1 PAR when not being used. Illumi-nation of the imaged leaves was either by an array of fourSylvania F20/W-RS (Osrau-Sylvania, Danvers, MA, USA)(approximately 30 W m-2), by a slide projector at approxi-
© 1999 Blackwell Science Ltd, Plant, Cell and Environment, 22, 1043–1055
Table 1. Range of measurements of meanconductance to water vapour (glw) andother characteristics of a range ofmicroporous materials. Conductancesshown are the range of values obtained ondifferent samples measured on differentoccasions
Mean conductance(mmol m-2s-1) Comments
PM2Ua 900–1300 pore size 5–10 mmPM3Ta 680–1000 pore size 2 mmPM9Pa 1470–1800 pore size 1 mmPM28Ya 1200–1400 pore size 2·5 mmNet909b 8–12 breathable sticking plasterHpu25b 450–620 very thin wound dressing materialOpsiteb 18–25 very thin wound dressing materialGoretex 300–800 microporous membrane bonded to rainwear material
a Microporous PTFE (Mupor Ltd, Alness, Ross-shire IV17 OXS).b Surgical dressings (Smith & Nephew Ltd).
mately 50 cm with a 150 W bulb and an 85 mm lens (200–350 W m-2), or by very low output tungsten lighting.
RESULTS
Theoretical sensitivity
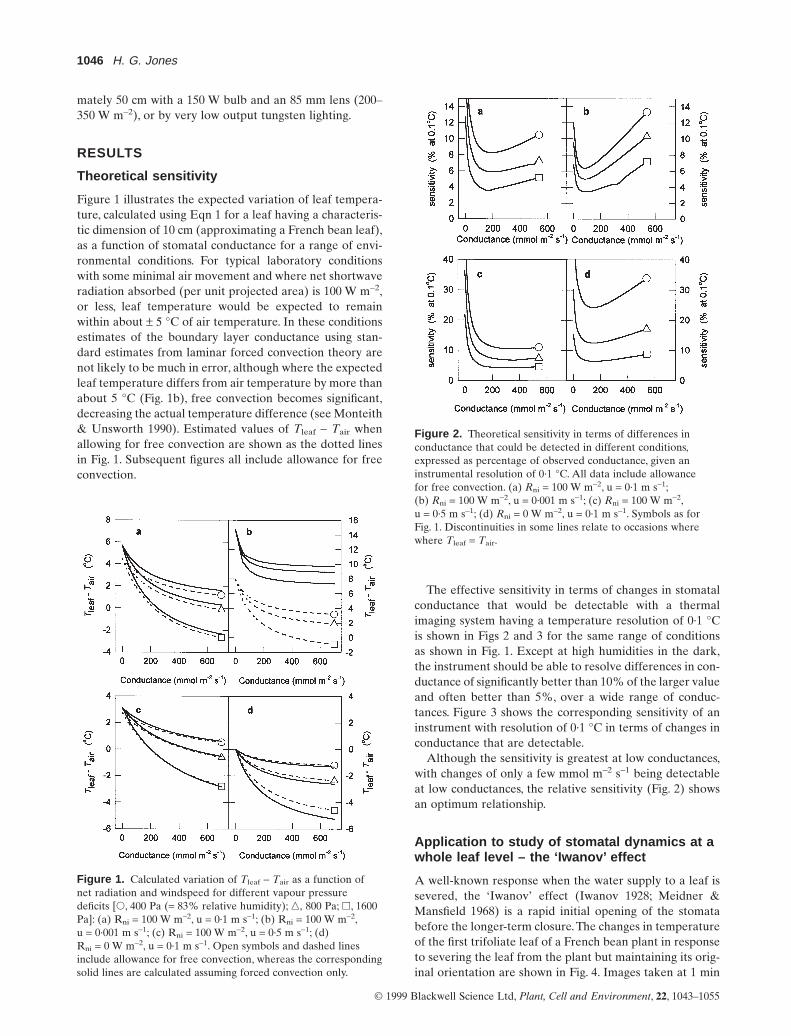
Figure 1 illustrates the expected variation of leaf tempera-ture, calculated using Eqn 1 for a leaf having a characteris-tic dimension of 10 cm (approximating a French bean leaf),as a function of stomatal conductance for a range of envi-ronmental conditions. For typical laboratory conditionswith some minimal air movement and where net shortwaveradiation absorbed (per unit projected area) is 100 W m-2,or less, leaf temperature would be expected to remainwithin about ± 5 °C of air temperature. In these conditionsestimates of the boundary layer conductance using stan-dard estimates from laminar forced convection theory arenot likely to be much in error, although where the expectedleaf temperature differs from air temperature by more thanabout 5 °C (Fig. 1b), free convection becomes significant,decreasing the actual temperature difference (see Monteith& Unsworth 1990). Estimated values of Tleaf - Tair whenallowing for free convection are shown as the dotted linesin Fig. 1. Subsequent figures all include allowance for freeconvection.
1046 H. G. Jones
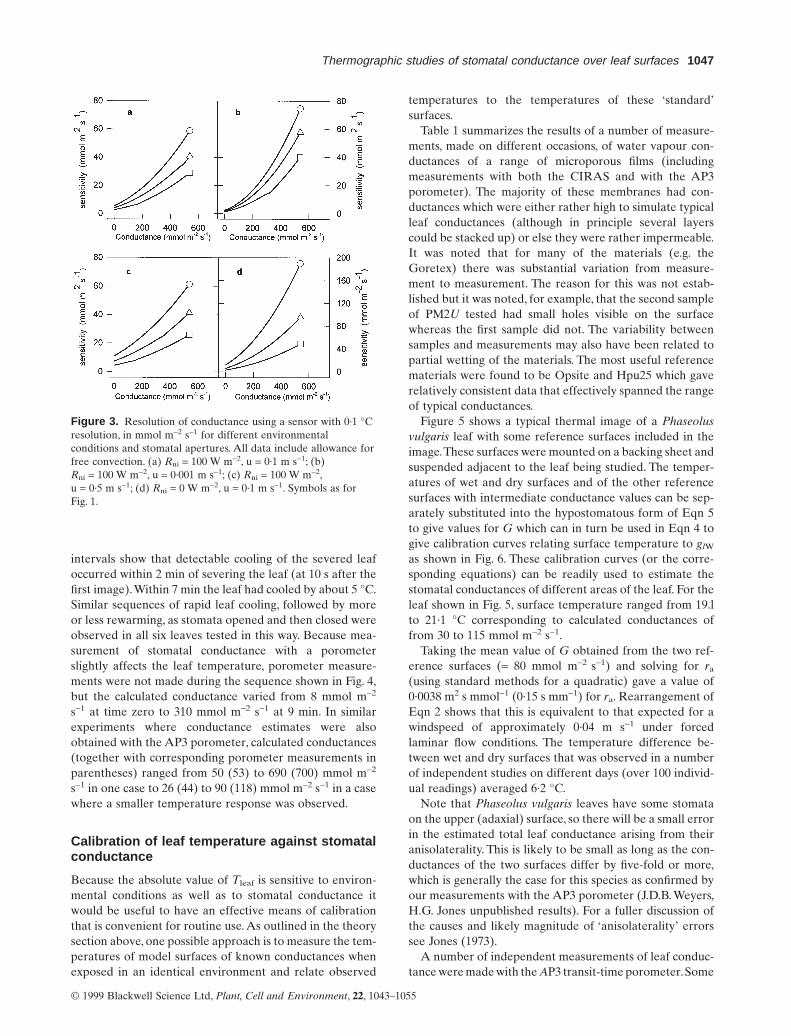
The effective sensitivity in terms of changes in stomatalconductance that would be detectable with a thermalimaging system having a temperature resolution of 0·1 °Cis shown in Figs 2 and 3 for the same range of conditionsas shown in Fig. 1. Except at high humidities in the dark,the instrument should be able to resolve differences in con-ductance of significantly better than 10% of the larger valueand often better than 5%, over a wide range of conduc-tances. Figure 3 shows the corresponding sensitivity of aninstrument with resolution of 0·1 °C in terms of changes inconductance that are detectable.
Although the sensitivity is greatest at low conductances,with changes of only a few mmol m-2 s-1 being detectableat low conductances, the relative sensitivity (Fig. 2) showsan optimum relationship.
Application to study of stomatal dynamics at awhole leaf level – the ‘Iwanov’ effect
A well-known response when the water supply to a leaf issevered, the ‘Iwanov’ effect (Iwanov 1928; Meidner &Mansfield 1968) is a rapid initial opening of the stomatabefore the longer-term closure.The changes in temperatureof the first trifoliate leaf of a French bean plant in responseto severing the leaf from the plant but maintaining its orig-inal orientation are shown in Fig. 4. Images taken at 1 min
© 1999 Blackwell Science Ltd, Plant, Cell and Environment, 22, 1043–1055
Figure 1. Calculated variation of Tleaf - Tair as a function ofnet radiation and windspeed for different vapour pressuredeficits [s, 400 Pa (= 83% relative humidity); n, 800 Pa; h, 1600Pa]: (a) Rni = 100 W m-2, u = 0·1 m s-1; (b) Rni = 100 W m-2,u = 0·001 m s-1; (c) Rni = 100 W m-2, u = 0·5 m s-1; (d)Rni = 0 W m-2, u = 0·1 m s-1. Open symbols and dashed linesinclude allowance for free convection, whereas the correspondingsolid lines are calculated assuming forced convection only.
Figure 2. Theoretical sensitivity in terms of differences inconductance that could be detected in different conditions,expressed as percentage of observed conductance, given aninstrumental resolution of 0·1 °C. All data include allowance for free convection. (a) Rni = 100 W m-2, u = 0·1 m s-1;(b) Rni = 100 W m-2, u = 0·001 m s-1; (c) Rni = 100 W m-2,u = 0·5 m s-1; (d) Rni = 0 W m-2, u = 0·1 m s-1. Symbols as forFig. 1. Discontinuities in some lines relate to occasions wherewhere Tleaf = Tair.
intervals show that detectable cooling of the severed leafoccurred within 2 min of severing the leaf (at 10 s after thefirst image).Within 7 min the leaf had cooled by about 5 °C.Similar sequences of rapid leaf cooling, followed by moreor less rewarming, as stomata opened and then closed wereobserved in all six leaves tested in this way. Because mea-surement of stomatal conductance with a porometerslightly affects the leaf temperature, porometer measure-ments were not made during the sequence shown in Fig. 4,but the calculated conductance varied from 8 mmol m-2
s-1 at time zero to 310 mmol m-2 s-1 at 9 min. In similarexperiments where conductance estimates were alsoobtained with the AP3 porometer, calculated conductances(together with corresponding porometer measurements inparentheses) ranged from 50 (53) to 690 (700) mmol m-2
s-1 in one case to 26 (44) to 90 (118) mmol m-2 s-1 in a casewhere a smaller temperature response was observed.
Calibration of leaf temperature against stomatalconductance
Because the absolute value of Tleaf is sensitive to environ-mental conditions as well as to stomatal conductance itwould be useful to have an effective means of calibrationthat is convenient for routine use. As outlined in the theorysection above, one possible approach is to measure the tem-peratures of model surfaces of known conductances whenexposed in an identical environment and relate observed
Thermographic studies of stomatal conductance over leaf surfaces 1047
temperatures to the temperatures of these ‘standard’ surfaces.
Table 1 summarizes the results of a number of measure-ments, made on different occasions, of water vapour con-ductances of a range of microporous films (includingmeasurements with both the CIRAS and with the AP3porometer). The majority of these membranes had con-ductances which were either rather high to simulate typicalleaf conductances (although in principle several layerscould be stacked up) or else they were rather impermeable.It was noted that for many of the materials (e.g. theGoretex) there was substantial variation from measure-ment to measurement. The reason for this was not estab-lished but it was noted, for example, that the second sampleof PM2U tested had small holes visible on the surfacewhereas the first sample did not. The variability betweensamples and measurements may also have been related topartial wetting of the materials. The most useful referencematerials were found to be Opsite and Hpu25 which gaverelatively consistent data that effectively spanned the rangeof typical conductances.
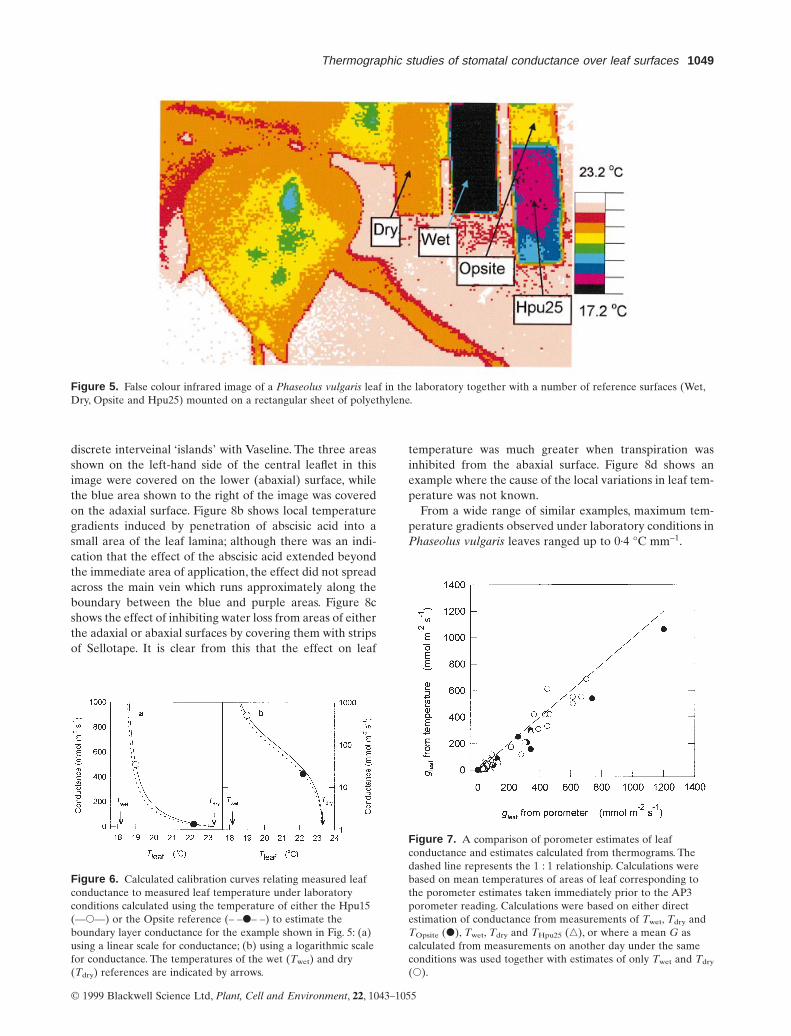
Figure 5 shows a typical thermal image of a Phaseolusvulgaris leaf with some reference surfaces included in theimage.These surfaces were mounted on a backing sheet andsuspended adjacent to the leaf being studied. The temper-atures of wet and dry surfaces and of the other referencesurfaces with intermediate conductance values can be sep-arately substituted into the hypostomatous form of Eqn 5to give values for G which can in turn be used in Eqn 4 togive calibration curves relating surface temperature to glW
as shown in Fig. 6. These calibration curves (or the corre-sponding equations) can be readily used to estimate thestomatal conductances of different areas of the leaf. For theleaf shown in Fig. 5, surface temperature ranged from 19.lto 21·1 °C corresponding to calculated conductances offrom 30 to 115 mmol m-2 s-1.
Taking the mean value of G obtained from the two ref-erence surfaces (= 80 mmol m-2 s-1) and solving for ra
(using standard methods for a quadratic) gave a value of0·0038 m2 s mmol-1 (0·15 s mm-1) for ra. Rearrangement ofEqn 2 shows that this is equivalent to that expected for awindspeed of approximately 0·04 m s-1 under forcedlaminar flow conditions. The temperature difference be-tween wet and dry surfaces that was observed in a numberof independent studies on different days (over 100 individ-ual readings) averaged 6·2 °C.
Note that Phaseolus vulgaris leaves have some stomataon the upper (adaxial) surface, so there will be a small errorin the estimated total leaf conductance arising from theiranisolaterality. This is likely to be small as long as the con-ductances of the two surfaces differ by five-fold or more,which is generally the case for this species as confirmed byour measurements with the AP3 porometer (J.D.B. Weyers,H.G. Jones unpublished results). For a fuller discussion ofthe causes and likely magnitude of ‘anisolaterality’ errorssee Jones (1973).
A number of independent measurements of leaf conduc-tance were made with the AP3 transit-time porometer.Some
© 1999 Blackwell Science Ltd, Plant, Cell and Environment, 22, 1043–1055
Figure 3. Resolution of conductance using a sensor with 0·1 °Cresolution, in mmol m-2 s-1 for different environmentalconditions and stomatal apertures. All data include allowance forfree convection. (a) Rni = 100 W m-2, u = 0·1 m s-1; (b)Rni = 100 W m-2, u = 0·001 m s-1; (c) Rni = 100 W m-2,u = 0·5 m s-1; (d) Rni = 0 W m-2, u = 0·1 m s-1. Symbols as forFig. 1.

1048 H. G. Jones
© 1999 Blackwell Science Ltd, Plant, Cell and Environment, 22, 1043–1055
Figure 4. False colour infrared images of the first trifoliate leaf of a Phaseolus vulgaris leaf in the laboratory takenat 1 min intervals. The leaf was severed from the plant 10 s after the first image was captured. The mean temperatureof a 1 cm2 circle on the leaf surface is indicated on each image. All images use the same temperature scale rangingfrom black representing temperatures below 18 °C to white representing temperatures above 25.5 °C.
of these are compared with stomatal conductances calcu-lated from thermal data in Fig. 7 to provide an independenttest of the conductance estimates from leaf temperature.This figure shows a close relationship between the two inde-pendent estimates of conductance (R2 = 0·949), althoughthere was some evidence that the porometer estimates wereconsistently higher, especially at low conductances.
Spatial variability of stomatal conductance overthe leaf surface
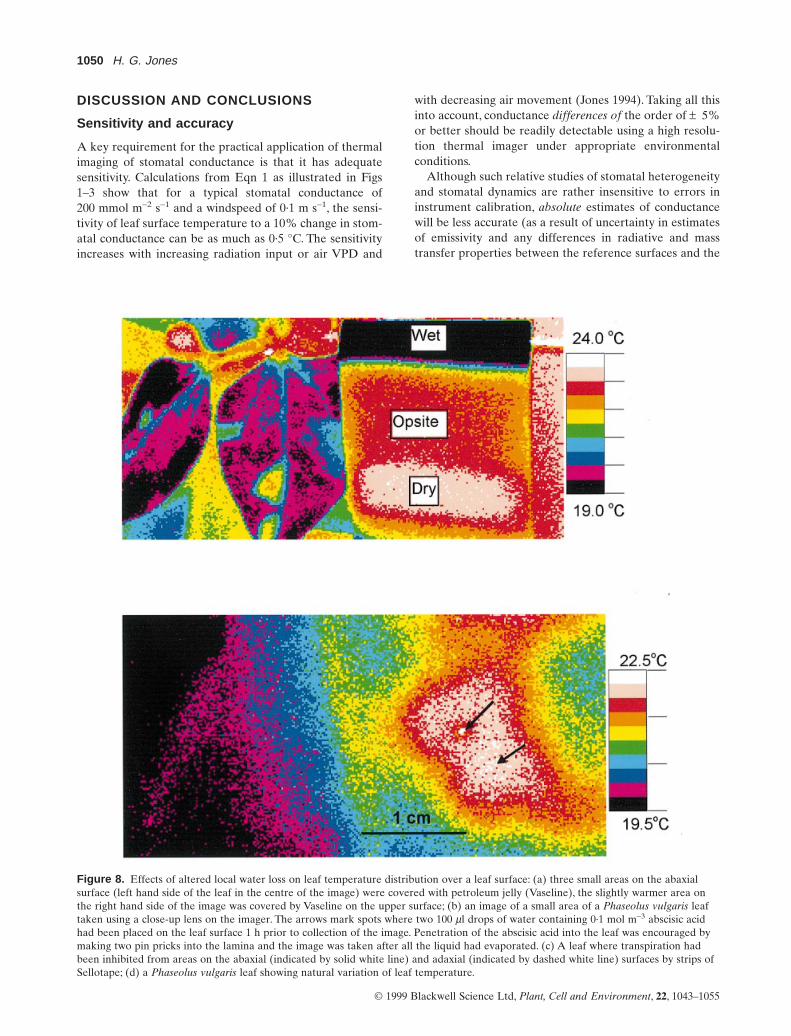
Some examples of possible spatial variation in temperatureover Phaseolus vulgaris leaves are shown in Fig. 8. Figure 8ashows an example where transpiration from small sharplydefined areas of the leaf was inhibited by pasting over
Thermographic studies of stomatal conductance over leaf surfaces 1049
© 1999 Blackwell Science Ltd, Plant, Cell and Environment, 22, 1043–1055
Figure 5. False colour infrared image of a Phaseolus vulgaris leaf in the laboratory together with a number of reference surfaces (Wet,Dry, Opsite and Hpu25) mounted on a rectangular sheet of polyethylene.
Figure 6. Calculated calibration curves relating measured leafconductance to measured leaf temperature under laboratoryconditions calculated using the temperature of either the Hpu15(—s—) or the Opsite reference (– –d– –) to estimate theboundary layer conductance for the example shown in Fig. 5: (a)using a linear scale for conductance; (b) using a logarithmic scalefor conductance. The temperatures of the wet (Twet) and dry(Tdry) references are indicated by arrows.
Figure 7. A comparison of porometer estimates of leafconductance and estimates calculated from thermograms. Thedashed line represents the 1 : 1 relationship. Calculations werebased on mean temperatures of areas of leaf corresponding tothe porometer estimates taken immediately prior to the AP3porometer reading. Calculations were based on either directestimation of conductance from measurements of Twet, Tdry andTOpsite (d), Twet, Tdry and THpu25 (n), or where a mean G ascalculated from measurements on another day under the sameconditions was used together with estimates of only Twet and Tdry
(s).
discrete interveinal ‘islands’ with Vaseline. The three areasshown on the left-hand side of the central leaflet in thisimage were covered on the lower (abaxial) surface, whilethe blue area shown to the right of the image was coveredon the adaxial surface. Figure 8b shows local temperaturegradients induced by penetration of abscisic acid into asmall area of the leaf lamina; although there was an indi-cation that the effect of the abscisic acid extended beyondthe immediate area of application, the effect did not spreadacross the main vein which runs approximately along theboundary between the blue and purple areas. Figure 8cshows the effect of inhibiting water loss from areas of eitherthe adaxial or abaxial surfaces by covering them with stripsof Sellotape. It is clear from this that the effect on leaf
temperature was much greater when transpiration wasinhibited from the abaxial surface. Figure 8d shows anexample where the cause of the local variations in leaf tem-perature was not known.
From a wide range of similar examples, maximum tem-perature gradients observed under laboratory conditions inPhaseolus vulgaris leaves ranged up to 0·4 °C mm-1.
1050 H. G. Jones
© 1999 Blackwell Science Ltd, Plant, Cell and Environment, 22, 1043–1055
Figure 8. Effects of altered local water loss on leaf temperature distribution over a leaf surface: (a) three small areas on the abaxialsurface (left hand side of the leaf in the centre of the image) were covered with petroleum jelly (Vaseline), the slightly warmer area onthe right hand side of the image was covered by Vaseline on the upper surface; (b) an image of a small area of a Phaseolus vulgaris leaftaken using a close-up lens on the imager. The arrows mark spots where two 100 ml drops of water containing 0·1 mol m-3 abscisic acidhad been placed on the leaf surface 1 h prior to collection of the image. Penetration of the abscisic acid into the leaf was encouraged bymaking two pin pricks into the lamina and the image was taken after all the liquid had evaporated. (c) A leaf where transpiration hadbeen inhibited from areas on the abaxial (indicated by solid white line) and adaxial (indicated by dashed white line) surfaces by strips ofSellotape; (d) a Phaseolus vulgaris leaf showing natural variation of leaf temperature.
DISCUSSION AND CONCLUSIONS
Sensitivity and accuracy
A key requirement for the practical application of thermalimaging of stomatal conductance is that it has adequatesensitivity. Calculations from Eqn 1 as illustrated in Figs1–3 show that for a typical stomatal conductance of200 mmol m-2 s-1 and a windspeed of 0·1 m s-1, the sensi-tivity of leaf surface temperature to a 10% change in stom-atal conductance can be as much as 0·5 °C. The sensitivityincreases with increasing radiation input or air VPD and
with decreasing air movement (Jones 1994). Taking all thisinto account, conductance differences of the order of ± 5%or better should be readily detectable using a high resolu-tion thermal imager under appropriate environmental conditions.
Although such relative studies of stomatal heterogeneityand stomatal dynamics are rather insensitive to errors ininstrument calibration, absolute estimates of conductancewill be less accurate (as a result of uncertainty in estimatesof emissivity and any differences in radiative and masstransfer properties between the reference surfaces and the
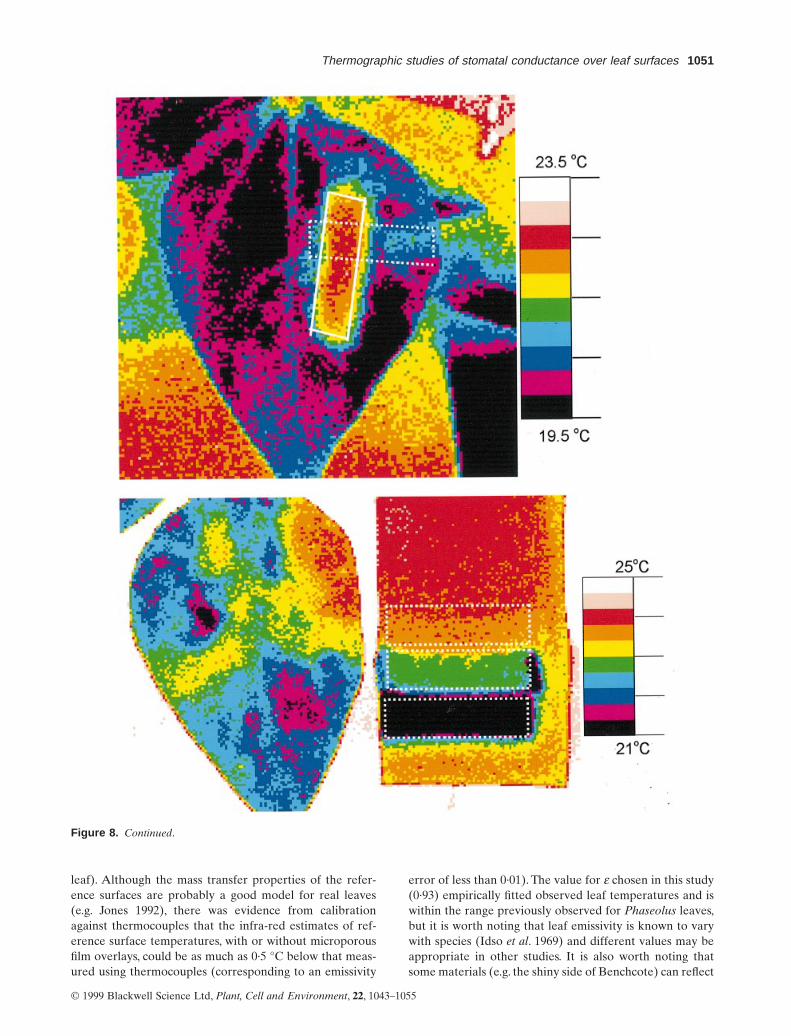
leaf). Although the mass transfer properties of the refer-ence surfaces are probably a good model for real leaves(e.g. Jones 1992), there was evidence from calibrationagainst thermocouples that the infra-red estimates of ref-erence surface temperatures, with or without microporousfilm overlays, could be as much as 0·5 °C below that meas-ured using thermocouples (corresponding to an emissivity
Thermographic studies of stomatal conductance over leaf surfaces 1051
error of less than 0·01). The value for e chosen in this study(0·93) empirically fitted observed leaf temperatures and iswithin the range previously observed for Phaseolus leaves,but it is worth noting that leaf emissivity is known to varywith species (Idso et al. 1969) and different values may beappropriate in other studies. It is also worth noting thatsome materials (e.g. the shiny side of Benchcote) can reflect
© 1999 Blackwell Science Ltd, Plant, Cell and Environment, 22, 1043–1055
Figure 8. Continued.
IR radiation, and even leaves can reflect a small amount ofradiation from high temperature sources.
The absolute error in estimates of stomatal conductancearises from both random errors and non-random errors(e.g. differences in emissivity or absorption coefficientbetween the various surfaces). The random component canbe calculated from the laws of propagation of errorsthrough differentiation of Eqn 4, and are minimal when theleaf conductance is close to the reference surface conduc-tance. An extreme example of the non-random errorsresulting from emissivity differences between surfacesoccurs when all the reference temperatures have a consis-tent bias. For example if one assumes a consistent error inthe measured temperature of all references of 0·4 °C (= anemissivity error of 0·005) the percentage error in conduc-tance estimates can be obtained from Fig. 2 by multiplyingthe given values by four, and the absolute errors by multi-plying the values in Fig. 3 by four. In this case the absoluteleaf conductance estimate under the typical conditions usedin these experiments could be in error by about 15–25%(Fig. 2b). The errors for other combinations of emissivityerrors can readily be determined from simulation, as canany error relating to differences in shortwave absorptioncoefficients causing Rni to differ (assumed equal for all sur-faces in Eqn 5). In practice this latter error will tend to besmall because Rni is only a small component of the totalenergy balance at the low irradiances in these laboratoryexperiments.
Another source of error in the accurate estimation ofconductance at different points over a leaf can arise be-cause of the build up of significant temperature gradientsalong a leaf when an airstream blows over it; for exampleClark & Wigley (1974) demonstrated gradients of up to3 °C along a leaf surface in parallel turbulent flow. Thepresent experiments were conducted in relatively still air ina laboratory; under such conditions thermal gradients alongthe lamina will be minimized, especially where free con-vection and preferential heat loss from sharp points (seeMonteith & Unsworth 1990) is also minimized by ensuringthat leaf–air temperature differences are kept belowapproximately 5 °C. Although small thermal gradientsresulting from differences in sensible heat transfer couldhave build up in our conditions, these gradients were likelyto have been generally less than a few tenths of a degree(see, e.g. Figs 4 & 5), and are likely to be much smaller thantemperature differences caused by differences in evapora-tive cooling.
Spatial resolution
The calibration approach proposed is applicable both tostandard infra-red thermometry which operates at the scalesof the whole leaf or canopy and to thermal imaging of leaves.The actual spatial resolution of stomatal conductance onsingle leaves depends on the spatial resolution of the imagerand on the lateral heat transfer properties of the leaf. Theimagers used in this work had a spatial resolution of at least180 pixels per line. Using the 20° lens at the standard oper-
1052 H. G. Jones
ating distance of about 0·7 m, a pixel corresponds to an areaof approximately 1 mm ¥ 1 mm, whereas with the close-uplens a pixel corresponds to approximately 0·2 mm ¥ 0·2 mm.In practice the factor limiting the spatial resolution of esti-mates of stomatal conductance is the rate of the lateral heattransfer within the leaf. A measure of the spatial resolutionavailable is the half-distance (the distance over which halfthe total temperature change between two steady valueseither side of a step change in leaf conductance occurs).
For a leaf of thickness l, an approximate solution for thehalf distance (across a linear boundary) can be obtained byassuming a sharp change in glW at the boundary (at x = 0)and a constant effective coefficient for heat loss to the air.In steady conditions, q0 the temperature difference betweenthe leaf at the boundary and the equilibrated temperatureinfinitely far from the boundary, can be taken as half thedifference between the equilibrium values either side of theboundary as calculated using Eqn 1 after substitutingappropriate values of rW. The rate of additional heat loss atthis temperature (Hx) can be obtained by replacing Rni inEqn 1 by (Rni + Hx) and rearranging. This system is equiv-alent to heat transfer from cooling fins (see, e.g. Pitts &Sissom 1977) for which one can describe the rate of changeof temperature with distance by
(6)
where m = ÷(hP/kA), and k is the thermal conductivity ofthe leaf, h is the coefficient for heat loss from the surface(= Hx/q0), and P/A is the ratio of the surface for heat lossto the cross sectional area of the leaf. This is equivalent tom = ÷(Hx/klq0). The half distance is then given by2 ln(0·5)/m.
For a typical Phaseolus leaf under our laboratory condi-tions (Rni = 100 W m-2, u = 0·04 m s-1, 30% relative humid-ity, and for a change from glW= 0 to glW= 160 mmol m-2 s-1)and assuming that l = 200 mm and k (0·5 W m -1°C-1; Jones1992) gives a half distance of approximately 3·1 mm whichis close to the typical values observed in our experiments(see Fig. 8). The maximum lateral temperature gradientsobserved were between 0·3 °C mm-1 and 0·4 °C mm-1.
Speed of response
The ability of thermal imaging to follow rapid changes instomatal conductance is not often likely to be limited by thetime constant of the imager (which for the equipment usedhere is better than 1 s) but is more likely to be limited bythe rate of temperature equilibration of the leaf. Anapproximation to the time constant (t) of leaf temperatureresponse to an instantaneous change in its energy balanceis given by (equation 9·11; Jones 1992)
(7)
where r*cp*l* is the heat capacity per unit area of leaf.Analysis of temperature dynamics when images were
taken at 10 or 20 s intervals after slightly warming leavesby hand gave time constants around 20 s in the present lab-
tr
r g=
( ) + ( )[ ]{ }* * *c l
c r s rp
p 1 HR w
q q0 = -e mx
© 1999 Blackwell Science Ltd, Plant, Cell and Environment, 22, 1043–1055

oratory conditions (data not shown). This corresponds wellwith other experimental data (Gates 1980) and with thetheoretical values derived from Eqn 7 when substitutingmeasurements of the fresh mass per unit area for the laminaof Phaseolus vulgaris leaves (= 163 ± 15·0 g m-2 measuredas the mean ± standard deviation of 15 leaves similar tothose used in the present work) and assuming a specificheat capacity of 3750 J kg -1°C-1 (Jones 1992). These sub-stitutions give expected time constants for the leaf tempera-ture response to an instantaneous change in stomatalconductance (at a windspeed of 0·1 m s-1) as 16·8 s withopen stomata (glW = 800 mmol m-2 s-1; rW = 50 s m-1) or34·4 s with closed stomata. This value would be propor-tionately increased as leaf thickness increases and willdecrease as windspeed increases, falling to 5·7 s for openstomata with a windspeed of 1 m s-1.
Other observations and implications
The high sensitivity of leaf temperature to stomatal con-ductance means that use of infrared thermography toevaluate processes such as freezing tolerance, or especiallyevidence of thermogenesis (e.g. van Der Straeten et al.1995), must be interpreted with care. These latter authorsobserved an increase in leaf temperature of 0·5 to 1·0 °Cwhen leaves were treated with salicylic acid, which theyattributed to salicylic acid-induced thermogenesis. How-ever, at the low stomatal conductances reported in theirexperiments (12 to 20 mmol m-2 s-1) it can be seen fromFig. 2, that such temperature differences could have beencaused by changes in stomatal conductance as small as5 mmol m-2 s-1, a difference which would have beenextremely difficult to detect with a porometer with any con-fidence, especially bearing in mind the very limited replica-tion used for their porometer measurements, and theknown effects of salicylic acid on stomatal closure (e.g.Larqué-Saavedra 1978).
An alternative approach to the estimation of leaf con-ductance from leaf temperature is to measure or estimateall other components of the leaf energy balance, includingabsorbed net radiation, air humidity, air temperature andboundary layer conductance (Smith et al. 1988; Inoue et al.1990; Jones 1994). Although useful data can be obtained bysuch approaches, a particular advantage of the presentapproach is that it is based on one consistent type of meas-urement (temperature as measured by infrared) supple-mented by just the additional estimation of the boundarylayer conductance.This, together with the formulation used,means that absolute errors (e.g. in temperature measure-ment) largely tend to cancel out; this is in contrast to the more usual energy balance approaches (e.g. Inoue et al. 1990) which depend on a range of independent measurements whose errors will tend to be additive.
Conclusions
This paper presents a new approach to the absolute cali-bration of thermal measurements of leaf temperature for
Thermographic studies of stomatal conductance over leaf surfaces 1053
the estimation of stomatal conductance. It is a logical devel-opment from the crop water stress index approach of Idso(Idso et al. 1981; Idso 1982) but is based on a number of keyinnovations. In particular it uses a simple reformulation ofthe leaf energy balance involving temperature measure-ments on reference surfaces of known conductance towater vapour to allow absolute calibration of temperaturemeasurements. This avoids the need for direct measure-ment of environmental variables such as incident radiationabsorbed, humidity, and windspeed. The calculations pre-sented here, together with the observations on actual tem-perature variation with stomatal conductance, show thatwhen used in a relative mode infrared thermography hascomparable, and in many circumstances better, resolutionthan that quoted for other methods currently available (seeWeyers & Lawson 1997). It should be noted, however, thatabsolute calibration is rather sensitive to errors in estima-tion of reference surface temperatures, implying a need foraccurate information on emissivities of the different sur-faces (reference and leaf). Nevertheless, the good correla-tion between porometer measurements and calculatedconductances does support the validity of the approach andthat the energy balance of the reference surfaces is similarto that of the Phaseolus leaves.
The approach is therefore particularly suitable for quan-titative studies of spatial and temporal variation of con-ductance over single leaves or for the screening of largenumbers of leaves remotely for stomatal conductance, asoccurs in genetic screening programmes. Indeed Raskin &Ladyman (1988) have used infrared thermography toisolate an abscisic acid-insensitive barley mutant. Thepresent theoretical analysis provides a basis for optimizingthe conditions for maximal sensitivity of the technique insuch studies. Furthermore, as a remote technique it does notinterfere with stomatal function. Even though the effectivespatial resolution is of the order of a few millimetres, thetechnique will be a valuable complement to chlorophyll fluorescence imaging of photosynthesis (e.g. Daley et al.1989; Meyer & Genty 1998) to allow a rigorous analysis of relationships between photosynthesis and stomatal conductance.
ACKNOWLEDGMENTS
The support of Kevin Ellis and Agema Ltd (now FTIRSystems) are gratefully acknowledged for the loan of theThermovision 900 system. In addition Dr David Harrisonof Ninewells Hospital kindly let us do some preliminarymeasurements using his Thermovision 880 infrared imagingsystem. I am also grateful to Dr Jonathan Weyers for somestimulating discussion.
REFERENCES
Barradas V. & Jones H.G. (1996) Responses of CO2 assimilation tochanges in irradiance: laboratory and field data and a model forbeans (Phaseolus vulgaris L.). Journal of Experimental Botany47, 639–645.
© 1999 Blackwell Science Ltd, Plant, Cell and Environment, 22, 1043–1055
Beyschlag W. & Pfanz H. (1990) A fast method to detect the occur-rence of non-homogeneous distribution of stomatal aperture inheterobaric plant leaves. Oecologia 82, 52–55.
Clark J.A. & Wigley G. (1974) Heat and mass transfer from realand model leaves. In Heat and Mass Transfer (ed. D.A. Vries),pp. 413–422. Scripta, Washington.
Daley P.F., Raschke K., Ball J.T. & Berry J.A. (1989) Topographyof photosynthetic activity of leaves obtained from video images of chlorophyll fluorescence. Plant Physiology 90,1233–1238.
van Der Straeten D., Chaerle L., Sharkov G., Lambers H. & vanMontagu M. (1995) Salicylic acid enhances the activity of thealternative pathway of respiration in tobacco leaves and inducesthermogenicity. Planta 196, 412–419.
Downton W.J.S., Loveys B.R. & Grant W.J.R. (1988) Non-uniformstomatal closure induced by water stress causes putative non-stomatal inhibition of photosynthesis. New Phytologist 110,503–509.
Eckstein J., Artsaenko O., Conrad U., Peisker M. & Beyschlag W.(1996) Abscisic acid is not necessarily required for the inductionof patchy stomatal closure. Journal of Experimental Botany 49,611–616.
Fuchs M. (1990) Infrared measurement of canopy temperature anddetection of plant water stress. Theoretical and Applied Clima-tology 42, 253–261.
Fuchs M. & Tanner C.B. (1966) Infrared thermometry of vegeta-tion. Agronomy Journal 58, 597–601.
van Gardingen P.R., Jeffree C.E. & Grace J. (1989) Variation instomatal aperture in leaves of Avena fatua L. observed by low-temperature scanning electron microscopy. Plant, Cell and Envi-ronment 12, 887–888.
Gates D.M. (1980) Biophysical Ecology. Springer-Verlag, NewYork-Heidelberg-Berlin.
Hashimoto Y., Ino T., Kramer P., Naylor A.W. & Strain B.R. (1984)Dynamic anaylsis of water stress of sunflower leaves by meansof a thermal image processing system. Plant Physiology 76,266–269.
Hashimoto Y., Morimoto T. & Funada S. (1982) Image processingfor plant information in the relation between leaf temperatureand stomatal aperture. In Technological and MethodologicalAdvances in Measurement (eds. G. Striker, K. Havrilla, J. Solt &T. Kemeny),Vol. 3, pp. 313–320. North Holland,Amsterdam,TheNetherlands.
Idso S.B. (1982) Non-water-stressed baselines: a key to measuringand interpreting plant water stress. Agricultural Meteorology 27,59–70.
Idso S.B., Jackson R.D., Ehrler W.L. & Mitchell S.T. (1969) Amethod for determination of infrared emittance of leaves.Ecology 50, 899.
Idso S.B., Jackson R.D., Pinter P.J., Reginato R.J. & Hatfield J.L.(1981) Normalizing the stress-degree-day parameter for envi-ronmental variability. Agricultural Meteorology 24, 45–55.
Inoue Y. (1987) Remote monitoring of the physiological-ecological status of crops. III Estimating remotely the transpira-tion of corn canopy by means of multisensing of infrared canopytemperature and micrometeorological data. Japanese Journal ofCrop Science 56, 337–344.
Inoue Y., Kimball B.A., Jackson R.D., Pinter P.J. Jr & Reginato R.J.(1990) Remote estimation of leaf transpiration rate and stom-atal resistance based on infrared thermometry. Agricultural andForest Meteorology 51, 21–33.
Iwanov L. (1928) Zur Methodik der Transpirations-bestimmungam Standort. Ber. Deutsch. Bot. Geseele 46, 306–310.
Jones H.G. (1973) Gas exchange through plant leaves having dif-ferent transfer resistances through their two surfaces. AustralianJournal of Biological Science 26, 1045–1055.
1054 H. G. Jones
Jones H.G. (1992) Plants and Microclimate, 2nd edn, p. 428. Cam-bridge University Press, Cambridge.
Jones H.G. (1994) Use of infra-red thermometry for irrigationscheduling. Aspects of Applied Biology 38, 247–253.
Jones H.G. (1998) Stomatal control of photosynthesis and transpi-ration. Journal of Experimental Botany 49, 387–398.
Jones H.G., Aikman D. & McBurney T.A. (1997) Improvements toinfra-red thermometry for irrigation scheduling in humid cli-mates. Acta Horticulturae 449, 259–266.
Larqué-Saavedra A. (1978) The antitranspirant effect of acetyl-salicylic acid on Phaseolus vulgaris. Physioloia Plantarum 43,126–128.
Meidner H. & Mansfield T.A. (1968) Physiology of Stomata.McGraw-Hill, London.
Meyer S. & Genty B. (1998) Mapping intercellular CO2 mole frac-tion (Ci) in Rosa rubiginosa leaves fed with abscisic acid by usingchlorophyll fluorescence imaging - significance of Ci estimatedfrom leaf gas exchange. Plant Physiology 116, 947–957.
Monteith J.L. & Unsworth M.A. (1990) Principles of Environmen-tal Physics, 2nd edn. Edward Arnold, London.
Mott K.A., Gordon Z.G. & Berry J.A. (1993) Asymmetric stomatalclosure for the two surfaces of Xanthium strumarium L. leavesat low humidity. Plant, Cell and Environment 16, 25–34.
Pitts D.R. & Sissom L.E. (1977) Heat Transfer. McGraw-Hill, NewYork.
Pospísilová J. & Santr °ucek J. (1994) Stomatal patchiness. BiologiaPlantarum 36, 481–510.
Raschke K. (1960) Heat transfer between plant and environment.Annual Review of Plant Physiology 11, 111–126.
Raskin I. & Ladyman A.R. (1988) Isolation and characterisationof a barley mutant with absicisic-acid-insensitive stomata. Planta173, 73–78.
Schuepp P.H. (1993) Tansley Review No. 59: leaf boundary layers.New Phytologist 125, 477–507.
Smith R.C.G., Barrs H.D. & Fischer R.A. (1988) Inferring stomatalresistance of sparse crops from infrared measurements of foliagetemperature. Agricultural and Forest Meteorology 42, 183–198.
Smith S., Weyers J.D.B. & Berry W.G. (1989) Variation in stomatalcharacteristics over the lower leaf surface of Commelina com-munis leaves. Plant, Cell and Environment 12, 653–659.
Spence R.D. (1987) The problem of aperture variability in stom-atal responses, particularly aperture variance, to environmentaland experimental conditions. New Phytologist 107, 303–315.
Taconet O., Olioso A., Ben Mehrez M. & Brisson N. (1995) Sea-sonal estimation of evaporation and stomatal conductance overa soybean field using surface IR temperatures. Agricultural andForest Meteorology 73, 321–337.
Tanner C.B. (1963) Plant temperatures. Agronomy Journal 55,210–211.
Terashima I. (1992) Anatomy of non-uniform leaf photosynthesis.Photosynthesis Research 31, 195–212.
Terashima I., Wong S.C., Osmond C.B. & Farquhar G.D. (1988)Characterisation of non-uniform photosynthesis induced byabscisic acid in leaves having different mesophyll anatomies.Plant and Cell Physiology 29, 385–394.
Weyers J.D.B. & Lawson T. (1997) Heterogeneity in stomatal char-acteristics. Advances in Botanical Research 26, 317–352.
Wigley G. & Clark J.A. (1974) Heat transport coefficients for constant energy flux models of broad leaves. Boundary-LayerMeteorology 1, 123–156.
Wisniewski M., Lindow S.E. & Ashworth E.N. (1997) Observationsof ice nucleation and propagation in plants using infrared videothermography. Plant Physiology 113, 327–334.
Received 10 December 1998; received in revised form 28 January1999; accepted for publication 28 January 1999
© 1999 Blackwell Science Ltd, Plant, Cell and Environment, 22, 1043–1055
APPENDIX
For a dry surface (rW = •) Eqn 1 reduces to
(A1)
The temperature of the corresponding wet surface (Twet)can be calculated from Eqn 1 by setting rW equal to zerogiving
(A2)T Tr r R r e c
c r srni p
p HRwet air
HR aW HR
aw
- =-
( ) +[ ]g d r
r g
T T r cdry air HR ni pR- = r
Thermographic studies of stomatal conductance over leaf surfaces 1055
Subtracting Eqn A2 from Eqn A1 and dividing by the dif-ference between Eqns 1 and A1, reduces to
(A3)
Using the substitution that {(Tdry - Twet)/(Tdry - Tleaf)} - 1= (Tleaf - Twet)/(Tdry - Tleaf), this can be rearranged to giveEqn 5.
T TT T
r r s r
s rldry wet
dry leaf
W aW HR
aW HRr-( )-( )
=+ + ( )
+ ( )g
g
© 1999 Blackwell Science Ltd, Plant, Cell and Environment, 22, 1043–1055