Embed Size (px)
Citation preview
Use of the estimated intraclass correlation for correctingdifferences in effect size by level
Soyeon Ahn & Nicolas D. Myers & Ying Jin
Published online: 30 September 2011# Psychonomic Society, Inc. 2011
Abstract In a meta-analysis of intervention or group com-parison studies, researchers often encounter the circumstancein which the standardized mean differences (d-effect sizes) arecomputed at multiple levels (e.g., individual vs. cluster).Cluster-level d-effect sizes may be inflated and, thus, mayneed to be corrected using the intraclass correlation (ICC)before being combined with individual-level d-effect sizes.The ICC value, however, is seldom reported in primarystudies and, thus, may need to be computed from othersources. This article proposes a method for estimating theICC value from the reported standard deviations within aparticular meta-analysis (i.e., estimated ICC) when anappropriate default ICC value (Hedges, 2009b) is unavailable.A series of simulations provided evidence that the proposedmethod yields an accurate and precise estimated ICC value,which can then be used for correct estimation of a d-effectsize. The effects of other pertinent factors (e.g., number ofstudies) were also examined, followed by discussion ofrelated limitations and future research in this area.
Keywords Intraclass correlation (ICC) .Meta-analysis .
Standardized mean difference .Multilevel . Level ofanalysis
The standardized mean difference (also known as the d-effectsize) has been widely used to evaluate the effects ofinterventions and treatments in the social sciences andeducation (Hedges, 2009b; Hedges & Hedberg, 2007). Thed-effect size has been considered a scale-free index thatquantifies the strength and direction of the intervention/
treatment effect or group mean difference (Cooper, Hedges,& Valentine, 2009). Thus, many researchers have combinedd-effect sizes from multiple studies and have drawn astatistical inference about the overall intervention/treatmenteffect (e.g., Mol, Bus, & de Jong, 2009; Slavin, Lake,Chambers, Chueng, & Davis, 2009) or group meandifference (e.g., Swanson & Hsieh, 2009).
In a meta-analysis of studies in the social sciences andeducation, researchers often encounter the circumstance inwhich d-effect sizes are computed using summary statistics(i.e., means and standard deviations) originating frommultiple levels (e.g., student vs. classroom or patient vs.clinic) across studies. For example, in a meta-analysisexamining the effect of teachers’ professional developmentprograms on student mathematics achievement by Salinas(2010), two studies used aggregated data at the classroomlevel, while the rest of the studies were based on data at thestudent level.
Because individuals (e.g., students, clients) within thesame cluster (e.g., classroom, counselors) are likely to benonindependent, resulting in underestimated standard errors(Raudenbush & Bryk, 2002), d-effect sizes computed at thecluster level tend to be inflated, as compared with d-effectsizes computed at the individual level (Hedges, 2007,2009a, b; What Works Clearinghouse [WWC], 2008).Thus, d-effect sizes from different levels should not becombined in a meta-analysis prior to the estimation of anoverall effect size that accounts for the magnitude ofnonindependence by level.
Such an issue often arises when studies included in ameta-analysis are based on either individual- or cluster-level data. Studies reporting findings from both cluster- andindividual-level data could provide sufficient statistics totake account of dependency among samples within thesame cluster when computing d-effect size. However, thereare some cases in education and/or the social sciences
S. Ahn (*) :N. D. Myers :Y. JinUniversity of Miami,Coral Gables, FL, USAe-mail: [email protected]
Behav Res (2012) 44:490–502DOI 10.3758/s13428-011-0153-1

where providing findings from both cluster- and individual-level data is not feasible. For instance, a researcher usingdata gathered from a state may be restricted only toclassroom data, rather than individual student data. In sucha case, no information is provided at the individual level,which prevents the researcher from taking account ofsample dependency when computing effect size. Clearly,in cases where only individual-level data are available, itwould be incorrect for the researcher to rely on negativelybiased standard errors that result from ignoring the nestednature of the data.
For handling such an issue, researchers have suggestedcorrecting the d-effect size computed at the cluster-level(dclusters) and its associated variance vðdclustersÞ
� �from the
clusters using an intraclass correlation (ICC), which canultimately be combined with the d-effect size computed atthe individual level (dindividuals). The formulas for correctingdclusters that can be compatible with dindividuals, which isdescribed in Hedges (2009b), are
dadjusted ¼ dclusters»ffiffiffiffiffiffiffiffiffiICC
p; ð1Þ
and
vðdadjustedÞ ¼ vðdclustersÞ»ICC: ð2ÞConsequently, the cluster-level d-effect size (dadjusted)
and its variance vðdadjustedÞ� �
adjusted by the ICC value are
no longer biased and, thus, are compatible with theindividual-level d-effect sizes.
The critical correcting factor in Eqs. 1 and 2 is the ICCvalue, which represents the degree to which observations inthe same cluster are dependent due to shared variances(Hox, 2002; Kreft & de Leeuw, 1998). Simply, the ICCvalue (ρ) is the proportion of cluster-level variances2clusters
� �to total variance s2
total
� �and is given by
r ¼ s2clusters
s2total
¼ s2clusters
s2clusters þ s2
individuals
; ð3Þ
where s2individualsis the individual-level variance.
However, the correcting factor given in Eqs. 1 and 2, theICC value, is seldom reported in studies (Hedges, 2009b),which makes it difficult to correct for differences in thecluster-level d-effect sizes. As a resolution, some researchershave suggested imputing a plausible default ICC value fromother sources. For instance, the WWC (2008) recommendedusing default ICC values of .20 for achievement outcomesand .10 for behavioral and attitudinal outcomes. These defaultvalues, which may not take ICC variation among differentachievement variables or behavioral and attitudinal outcomesinto account, were based on an analysis of the empiricalliterature in the field of education. Following the WWC’sguideline, Salinas (2010) and Scher and O’Reilly (2009)
adjusted the cluster-level d-effect sizes using the default ICCvalue of .20 in their meta-analyses, both of which examinedthe effect of teachers’ professional development programs onstudent achievement.
In addition, Hedges (2009b) proposed the computation ofa default ICC value from a probability-based survey data setsuch as the National Assessment of Educational Progress(NAEP). For instance, Hedges and Hedberg (2007) haveprovided a summary of the ICC values for mathematics andreading computed from the national probability samples atdifferent grade levels and in different regions of the UnitedStates (i.e., urban, suburban, rural). In their study, Hedgesand Hedberg found that the average ICC across all gradelevels was .22, which was computed using four existingnational data sets (e.g., the Early Childhood LongitudinalStudy and the Longitudinal Study of American Youth).
Although the method for extracting a default ICC valuedescribed above would be a reasonable option in certaincircumstances, it is not practical for every context in which theclustering of observations occurs. For example, the suggestedsources for the ICC value, such as the data set with thenational probability samples or empirical studies reporting theICC value, would not always be available. Moreover, even ifthey exist, these values may be limited for some specificsubpopulations with unique characteristics. For instance, thedefault ICC value of .20 for student achievement suggested byWWC (2008) and Hedges (2009b) may not be appropriatefor samples composed mostly of students from nonmajorityethnic backgrounds. For instance, Maerten-Rivera, Myers,Lee, and Penfield (2010) reported the ICC value of .13 forscience achievements based on 23,854 fifth-grade studentsfrom 198 elementary schools in a large urban school districtwith a diverse student population. The ethnic background ofthe student population in their study consisted of 60%Hispanic, 28% African American, 11% White NonHispanic,and 1% Asian or Native American. Another instance inwhich a default ICC value of .20 may not be appropriate wasprovided by Myers, Feltz, Maier, Wolfe, and Reckase(2006), who provided evidence for an average ICC valueof approximately .33 across physical education variables.
In resolving the practical limitations of the existingapproach, the present study proposes using informationfrom the included studies of any particular meta-analysis.Specifically, the ICC value, which is the proportion ofbetween-cluster variance to total variance, can be estimatedfrom variances/standard deviations and sample sizes thatare typically reported in treatment/intervention or comparisonstudies. Thus, the estimated ICC value is not dependent oneither the availability of external sources (e.g., a synthesis ofprobability-based survey national data sets) or the ICC valuebeing provided in each study of a meta-analysis.
In the following sections, we first present how to estimatethe ICC value from the reported standard deviations/variances
Behav Res (2012) 44:490–502 491

and sample sizes. Then, by using a Monte Carlo simulation,the performance of the ICC estimation was examined underdifferent conditions, such as number of cluster (l) andindividual (m) levels and the population ICC values (ρ).Finally, the application of the ICC estimation in a series ofhypothetical meta-analyses that varied by both study features[e.g., the population mean difference between control andtreatment groups (γtrt − γctr) and the number of studiesincluded (l + m)] was investigated. Specifically, the overalleffect-size estimator after correcting for differences in levels,using the estimated ICC value, was compared with onewithout the ICC correction and the other with a default ICCvalue (i.e., ρ = .20) correction in relation to other studyfeatures.
Estimating the ICC value
Suppose that a hypothetical meta-analysis of l number ofstudies at the cluster level (e.g., classrooms) and m number ofstudies at the individual level (e.g., students) was undertaken.And from those studies, the variances/standard deviations andsample sizes for control and treatment groups were reported.From the l number of cluster- and the m number ofindividual-level variances/standard deviations for both controland treatment groups, let us define the lth cluster-levelstandard deviation (= square root of variance) and the mthindividual-level standard deviation as SDl (l = 1, 2, . . . , l −1, l) and SDm (m = 1, 2, . . . , m − 1, m), respectively. Theseindividual-level and cluster-level standard deviations areclosely related to the population ICC.
As is described in Raudenbush and Bryk (2002), thelogarithmic transformed standard deviation is normallydistributed with a sample mean of log SDð Þ þ 1= 2»ð½n� 1ð ÞÞ� and an approximate variance of 1= 2» n� 1ð Þð Þ.From the sampling distribution of the logarithmic transformedstandard deviation, the weighted average cluster-level standarddeviation can be estimated on the logarithmic scale by
logðbsclusterÞ ¼Pll¼1
wlsl
Pll¼1
wl
; ð4Þ
where sl is defined as log SDlð Þ þ 1= 2» nl � 1ð Þð Þ½ � for the lthcluster-level study, where nl is the number of clusters for lthcluster-level study; wl is defined as 1/ vl, where vl is1= 2» nl � 1ð Þð Þ.
Because the estimate is on a logarithmic scale, it istransformed back to the original scale via
bscluster ¼ expðlogðbsclusterÞÞ: ð5Þ
Following Eqs. 4 and 5, the cluster-level variances forboth control bscluster ctrð Þ and treatment bscluster trtð Þ groupscan be estimated.
Similarly, the weighted-average total standard deviationis estimated on the logarithmic scale:
logðbs totalÞ ¼Pmm¼1
wmsm
Pmm¼1
wm
; ð6Þ
where sm is log SDmð Þ þ 1= 2» nm � 1ð Þð Þ½ � for the mthindividual-level study, where nm is sample size for themth individual-level study; wm is defined as 1/ vm, where vmis 1/(2 * (nm − 1)). Then, the value is transformed back tothe original scale, using
bs total ¼ expðlogðbs totalÞÞ: ð7ÞAgain, using Eqs. 6 and 7, the total variances for controlbs total ctrð Þ and treatment bs total trtð Þ groups would be
estimated.Finally, the ICC value can be estimated on the basis of
the cluster-level standard deviation estimate and totalstandard deviation estimate,
br ¼ bscluster ctr þ bscluster trtð Þ2bs total ctr þ bs total trtð Þ2 ; ð8Þ
where ctr and trt refer to control and treatment groups,respectively.
The ICC value estimated using Eq. 8, which is indeed aratio of the estimated cluster-level variance to the estimatedtotal variance, is independent of variations in the scale ofthe measures across studies.1 Hence, the estimated scale-independent ICC value can be used to adjust differences oneffect sizes by level, in cases in which the included studiesin a meta-analysis employ widely varying scales ofmeasures to represent the underlying construct of interest,which is often observed in practice.
Simulation 1: ICC estimation
The first simulation examined the performance of theestimated ICC value on the basis of Eqs. 4–8 under
1 In order to test whether or not the computed ICC value was sensitive tovariation in the scale of measures, the authors of the present studyconducted a small simulation study, in which the scale of measures wasvaried when computing the ICC value (Eq. 8). Mean bias and MSEvalues of the computed ICC value were .03 and < .00001, respectively,suggesting that the computed ICC was not affected by variation in thescale of measures. Such a result was found irrespective of any studyfeatures, including number of measures with different scales, populationICC value, sample size, and number of effect sizes. Full results of thissimulation study are available by request to the first author.
492 Behav Res (2012) 44:490–502

different conditions. These conditions were determinedby relevant factors (i.e., l, m, nl, and nm) that might affectthe estimation of the ICC value. In this section, datageneration and parameters used in the simulation werefirst discussed, followed by the presentation of simulationresults.
Data generation
Using R (R Development Core Team, 2008) version 2.11.1,data for the population experimental and control groups,each having 30 individuals per cluster, were generated fromthe normal distributions with means (i.e., γctr and γtrt ) andrespective total variances (i.e., s2
ctr and s2trt). Total variances
were the sum of between-level variance (i.e., τctr and τtrt)and within-level variance (i.e., s2
within ctr and s2within trt),
which were determined by the population intraclasscorrelation (i.e., ρ). The between-level variances weregenerated from the normal distribution with a mean of 0and respective between-level variances (i.e., τctr and τtrt).The within-level variances were generated from the normaldistribution with a mean of 0 and respective within-levelvariances (i.e., s2
within ctr and s2within trt).
From the generated population data for control andtreatment groups, the l number of the v clusters and the mnumber of the w individuals were randomly sampled, andtheir standard deviations of the scores for the l number ofclusters and the m number of individuals were computedfor both treatment and control groups. From these observedstandard deviations, the ICC value was estimated usingEqs. 4–8.
Choice of parameters
The relevant factors that would affect the estimation of theICC value used in the simulation included the number ofcluster levels (l), cluster sample size (v), the number ofindividual levels (m), individual sample size (w), thepopulation mean difference between control and treatmentgroups (γtrt−γctr), and the population ICC value (ρ).
First, four population ICC values of .05, .15, .25, and .33were used to represent the true population proportion ofbetween-level variance to total variance. These were chosento represent the small, small to medium, medium to large,and large between-level variances, respectively (Hox &Maas, 2001; Hox, Maas, & Brinkhuis, 2010). Second, threepopulation mean differences between the control andtreatment groups were set to 0.2, 0.5, and 0.7, indicatingsmall, medium, and large group mean difference (Cohen,1988). Last, the numbers of cluster-level and individual-level studies (i.e., [l , m]) were set to [5, 5], [10, 10], [20,20], [30, 30], and [60, 60] with the fixed cluster size and
individual size of 30. In reality, the numbers of cluster andindividual levels typically vary, and sample sizes oftendiffer across studies as well. For simplicity, however, thefixed sample size of 30 equal for control and treatmentgroups were used to compute d-effect sizes for both cluster-and individual-level data..
In all, from the 12 populations (i.e., [γtrt − γctr] = 0.2,0.5, 0.7 by ρ = .05. .15, .25, .33), a total of 60 uniqueconditions (i.e., [l ,m] = [5, 5], [10,10], [20,20], [30, 30],[60, 60]) were generated. These 60 different conditionswere replicated 1,000 times, yielding 60,000 estimated ICCvalues.
Evaluation of estimator
Two criteria were used to evaluate the performance ofthe ICC estimation. One was the relative bias of theestimated ICC value (Hoogland & Boomsma, 1998),which is defined by
BiasðbrÞ ¼ br� rr
; ð9Þ
where br is the mean of the ICC estimates across all replicationsfor each condition, and ρ is the population ICC value. Theabsolute value of relative bias [Bias(br)] less than |−0.05| isconsidered to be an acceptable range of the relative bias value(Hoogland & Boomsma, 1998). And, the second index wasthe mean square error (MSE) of the ICC estimates, which iscomputed as
MSEðbrÞ ¼ br� rh i2
� varðbrÞ; ð10Þ
where E(br) is computed as the mean br value and var(br) isthe empirical variance of the br values across the 1,000replications for each combination.
Results
Table 1 displays the descriptive statistics of the relative biasand MSE values of the estimated ICC by all the conditionsmanipulated in the simulation. The average relative biasvalues of the estimated ICC ranged from 0.001 to 0.007,and the average MSE values were from 0.001 to 0.006,indicating that the ICC value was estimated accurately andprecisely across three population mean differences and fourpopulation ICC values. In particular, the absolute value ofthe average relative bias values for all conditions was lessthan |−0.05|, indicating that both the relative bias values ofthe estimated ICC were in an acceptable range. The meanrelative bias and MSE values of the estimated ICC werelargest when the population ICC was set to .05 and .33,respectively. Because there were both negligible bias and
Behav Res (2012) 44:490–502 493

similar precision across conditions (see Table 1), explainingthe variance in these two outcomes was not undertaken.Simply, the estimated ICC was unbiased and relativelyprecise across conditions.
Simulation 2: use of the estimated ICC in meta-analysis
The second simulation examined the application of theestimated ICC value to a set of hypothetical meta-analysesthat varied by study features. Specifically, we used asimulation to examine the effect of incorporating theestimated ICC value from studies in meta-analyses ofstandardized mean differences (ds). We looked at therelative bias and MSE values of the estimators of meaneffects, which varied by the ICC correction methods (i.e.,no ICC correction, default ICC correction, and estimatedICC correction).We further compared the relative bias andMSE values of three overall mean effect-size estimatorswith different ICC correction methods in relation to thepopulation mean difference, the number of studies (l + m),and the ratio of the number of cluster-level ds (l) to thenumber of individual-level ds (m) [l : m].
Data generation
From 12 population control and treatment groups that weregenerated in simulation 1 (i.e., 3 population mean differencesof 0.2, 0.5, and 0.7 × 4 population ICC values of .05, .15, .25,and .33), the set of hypothetical meta-analyses having l (i.e.,number of studies using clusters) + m (i.e., number of studiesusing individuals) studies were created. From the included l +m studies, the cluster-level d-effect sizes were corrected usingthe estimated ICC value, and then the average variance-
weighted d-effect size2 was computed and compared with theaverage weighted d-effect sizes without ICC correction andwith a default ICC (i.e., .20) correction.
Choice of parameters
In addition to the two parameters used to generate thepopulation data in simulation 1 (i.e., the population meandifference between control and treatment groups and thepopulation ICC value), two other factors were added. Onewas the total number of studies included in the meta-analysis (l + m), and the other was the proportion of thenumber of studies using clusters (l) to the number of studiesusing individuals (m) [l : m].
Number of studies included (l + m) Ahn and Becker (2011)found that the number of studies included in meta-analysisranged from 12 to 180, on the basis of a review of 71 meta-analyses published in the Review of Educational Researchfrom 1990 to 2004 and the Psychological Bulletin from 1995to 2004. Of 71 meta-analyses, Ahn and Becker showed thatalmost half of the studies included fewer than 50 studies intheir studies. Therefore, two values of 12 (i.e., meta-analysiswith the least numbers of studies) and 30 (i.e., meta-analysiswith the average number of 12 and 50 studies) were set tototal number of studies (l + m).
Ratio of l to the m (l : m) Of the l + m number of theincluded studies, the following three sets of l : m [1:1 (i.e.,l = 6, m = 6; l = 15, m = 15)], [2:1 (i.e., l = 8, m = 4; l = 20,
2 More details about the average variance-weighted effect size can befound in Cooper et al. (2009).
Table 1 Relative bias and MSEvalue of the estimated ICC Population
MeanDifference
PopulationICC Value
Relative Bias MSE
Min Max M SD Min Max M SD
.2 .05 0.007 0.008 0.007 0.0005 0.001 0.003 0.002 0.001
.15 0.002 0.003 0.002 0.0004 0.001 0.007 0.002 0.003
.25 0.001 0.001 0.001 0.0002 0.0003 0.011 0.003 0.005
.33 0.001 0.002 0.001 0.0004 0.001 0.023 0.006 0.010
.5 .05 0.006 0.007 0.006 0.0004 0.001 0.002 0.001 0.001
.15 0.002 0.003 0.002 0.0003 0.001 0.006 0.002 0.002
.25 0.001 0.002 0.002 0.0003 0.001 0.015 0.005 0.006
.33 0.001 0.001 0.001 0.0004 0.000 0.020 0.005 0.008
.7 .05 0.006 0.007 0.007 0.0004 0.001 0.002 0.001 0.001
.15 0.001 0.002 0.002 0.0003 0.001 0.006 0.002 0.002
.25 0.001 0.002 0.001 0.0002 0.001 0.012 0.004 0.005
.33 0.0005 0.001 0.001 0.0004 0.0003 0.021 0.005 0.009
494 Behav Res (2012) 44:490–502

m = 10)], and [1:2 (i.e., l = 4, m = 8; l = 10, m = 20)] werechosen as a ratio of cluster-level studies to individual-levelstudies. In reality, the ratio of cluster-level studies toindividual-level studies would likely vary considerably;yet, for parsimony, these three patterns were chosen.
Estimators
The overall variance-weighted mean effect-size (dest.) withthe cluster-level ds adjusted by the estimated ICC valueusing Eqs. 4–8 were computed and compared with theoverall variance-weighted mean effect size (dwithout) with nocorrected cluster-level ds and the overall variance-weightedmean effect size with the cluster-level ds (ddefault) adjustedby the default ICC value of .20 (which was suggested byWWC, 2008, for educational outcomes). These three meaneffect-size estimators were computed for each conditionthat varied by the population mean difference, the populationICC value, the number of studies included, and the ratio ofcluster-level studies to individual-level studies.
To sum up, from 12 populations (i.e., 3 population meandifferences of 0.2, 0.5, and 0.7 × 4 population ICC values of.05, .15, .25, and .33), 72 unique conditions (i.e., 2 values oftotal number of studies (i.e., 12 and 30) × 3 values of a ratio ofcluster-level studies to individual-level studies (i.e., [1:1],[1:2], and [2:1]) were generated. For each condition with1,000 replications, three variance-weighted overall effect sizes(i.e., dwithout, ddefault, and dest) were computed. Therefore, atotal of 216,000 effect-size estimators were obtained from 72different conditions, which were replicated 1,000 times.
Evaluation of estimators
Two criteria— the relative bias and MSE values—were usedto evaluate the overall effect-size estimators. Representing
the overall d-effect size as bd and the population effect size asδ, the relative bias and MSE values of the estimated d-effectsize is computed by
BiasðbdÞ ¼ bd � dd
; ð11Þ
and
MSEðbdÞ ¼ bd � dh i2
þ varðbdÞ; ð12Þ
where bd was computed as the mean bd value, and var(bd) is theempirical variance of the bd values across the 1,000replications for each combination. The absolute value of Bias
(bd) less than |−0.05| is considered to be an acceptable range ofthe relative bias value (Hoogland & Boomsma, 1998).
Descriptive statistics were first computed for the relativebias and MSE values of three estimators across the 72conditions. Then two sets of ANOVAs were conducted tocompare the relative bias and MSE of three variance-weighted overall effect sizes with different ICC correctionmethods (i.e., dwithout, ddefault, and dest ) in relation to thesimulation parameters. The factors modeled in theANOVAs included the population mean difference, thepopulation ICC value, the total number of studies included,and the ratio of cluster-level studies to individual-levelstudies. The main effect of each parameter and theinteraction effects with type of the ICC correction methodwere modeled in the ANOVAs as predictors of the relativebias and MSE values. In the ANOVAs, the significancelevel was set to .015, and the partial eta-squared value (h2),which is a relatively less sample-size-sensitive measure,was used to describe the impact of each predictor.
Results
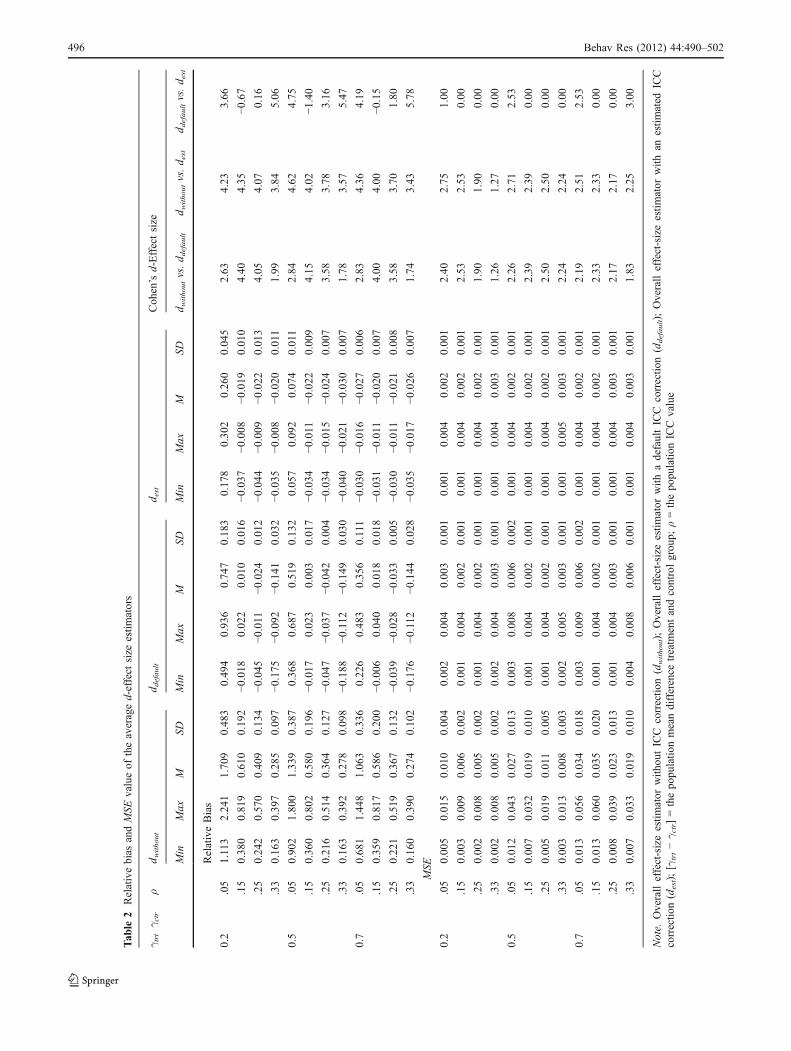
Table 2 displays the descriptive statistics of the relative biasand MSE values of three overall mean effect-size estimators(dest., dwithout, ddefault) by the population mean differenceand the population ICC value. As is shown in Table 2, thedest. had average relative bias values ranging from 0.03 to0.26 and average MSE values ranging from 0.002 to 0.003.dest, had an average relative bias of less than |−.05|, exceptin two conditions. The two exceptions showing a bias largerthan |−.05| were when the population value was negligible,in which the ICC correction by level was not necessary. Yetdest had approximately zero average MSE values acrossconditions. These results indicated that the estimated overalleffect-size estimator with an estimated ICC correction was anaccurate and precise one.
On the other hand, the estimated overall effect size without acorrection (dwithout) had an average relative bias ranging from0.27 to 1.71 and average MSE values ranging from 0.005 to0.035. This result showed that the overall effect-size estimatorwithout an ICC correction was biased and contained sizableerrors. Similarly, the estimated overall effect size with adefault ICC value of .20 correction (ddefault) had an averagerelative bias that was frequently bigger than an acceptable
range of relative bias of |−.05| (i.e., Bias = |− 0.15| to |−0.75|)and MSE values between 0.002 and 0.006, showing thatddefault was also biased and inaccurate.
As is shown in the last three columns of Table 2,Cohen’s d-effect size comparing mean differences betweendwithout and dest ranged from 3.43 to 4.62 in the absolutemagnitude of bias values and from 1.26 to 2.43 in the MSEvalues, suggesting that the bias and MSE values of dwithoutare bigger than those of dest to a large degree. And Cohen’sd-effect sizes for differences in the absolute magnitude ofthe bias values between ddefault and dest ranged from 0.15 to
Behav Res (2012) 44:490–502 495
Tab
le2
Relativebias
andMSE
valueof
theaveraged-effect
size
estim
ators
γ trt
γ ctr
ρd w
ithout
d default
d est
Coh
en’sd-Effectsize
Min
Max
MSD
Min
Max
MSD
Min
Max
MSD
d withoutvs.d d
efault
d withoutvs.d e
std d
efaultvs.d e
st
RelativeBias
0.2
.05
1.113
2.24
11.70
90.48
30.49
40.93
60.74
70.18
30.17
80.30
20.26
00.04
52.63
4.23
3.66
.15
0.38
00.81
90.61
00.19
2−0
.018
0.02
20.01
00.01
6−0
.037
−0.008
−0.019
0.01
04.40
4.35
−0.67
.25
0.24
20.57
00.40
90.13
4−0
.045
−0.011
−0.024
0.01
2−0
.044
−0.009
−0.022
0.01
34.05
4.07
0.16
.33
0.16
30.39
70.28
50.09
7−0
.175
−0.092
−0.141
0.03
2−0
.035
−0.008
−0.020
0.011
1.99
3.84
5.06
0.5
.05
0.90
21.80
01.33
90.38
70.36
80.68
70.51
90.13
20.05
70.09
20.07
40.011
2.84
4.62
4.75
.15
0.36
00.80
20.58
00.19
6−0
.017
0.02
30.00
30.01
7−0
.034
−0.011
−0.022
0.00
94.15
4.02
−1.40
.25
0.21
60.51
40.36
40.12
7−0
.047
−0.037
−0.042
0.00
4−0
.034
−0.015
−0.024
0.00
73.58
3.78
3.16
.33
0.16
30.39
20.27
80.09
8−0
.188
−0.112
−0.149
0.03
0−0
.040
−0.021
−0.030
0.00
71.78
3.57
5.47
0.7
.05
0.68
11.44
81.06
30.33
60.22
60.48
30.35
60.111
−0.030
−0.016
−0.027
0.00
62.83
4.36
4.19
.15
0.35
90.81
70.58
60.20
0−0
.006
0.04
00.01
80.01
8−0
.031
−0.011
−0.020
0.00
74.00
4.00
−0.15
.25
0.22
10.51
90.36
70.13
2−0
.039
−0.028
−0.033
0.00
5−0
.030
−0.011
−0.021
0.00
83.58
3.70
1.80
.33
0.16
00.39
00.27
40.10
2−0
.176
−0.112
−0.144
0.02
8−0
.035
−0.017
−0.026
0.00
71.74
3.43
5.78
MSE
0.2
.05
0.00
50.01
50.01
00.00
40.00
20.00
40.00
30.00
10.00
10.00
40.00
20.00
12.40
2.75
1.00
.15
0.00
30.00
90.00
60.00
20.00
10.00
40.00
20.00
10.00
10.00
40.00
20.00
12.53
2.53
0.00
.25
0.00
20.00
80.00
50.00
20.00
10.00
40.00
20.00
10.00
10.00
40.00
20.00
11.90
1.90
0.00
.33
0.00
20.00
80.00
50.00
20.00
20.00
40.00
30.00
10.00
10.00
40.00
30.00
11.26
1.27
0.00
0.5
.05
0.01
20.04
30.02
70.01
30.00
30.00
80.00
60.00
20.00
10.00
40.00
20.00
12.26
2.71
2.53
.15
0.00
70.03
20.01
90.01
00.00
10.00
40.00
20.00
10.00
10.00
40.00
20.00
12.39
2.39
0.00
.25
0.00
50.01
90.011
0.00
50.00
10.00
40.00
20.00
10.00
10.00
40.00
20.00
12.50
2.50
0.00
.33
0.00
30.01
30.00
80.00
30.00
20.00
50.00
30.00
10.00
10.00
50.00
30.00
12.24
2.24
0.00
0.7
.05
0.01
30.05
60.03
40.01
80.00
30.00
90.00
60.00
20.00
10.00
40.00
20.00
12.19
2.51
2.53
.15
0.01
30.06
00.03
50.02
00.00
10.00
40.00
20.00
10.00
10.00
40.00
20.00
12.33
2.33
0.00
.25
0.00
80.03
90.02
30.01
30.00
10.00
40.00
30.00
10.00
10.00
40.00
30.00
12.17
2.17
0.00
.33
0.00
70.03
30.01
90.01
00.00
40.00
80.00
60.00
10.00
10.00
40.00
30.00
11.83
2.25
3.00
Note.
Overalleffect-sizeestim
ator
with
outICC
correctio
n(d
without);
Overalleffect-sizeestim
ator
with
adefaultICC
correctio
n(d
default);Overalleffect-sizeestim
ator
with
anestim
ated
ICC
correctio
n(d
est);
[γtrt−γ c
tr]=thepo
pulatio
nmeandifference
treatm
entandcontrolgrou
p;ρ=thepo
pulatio
nICC
value
496 Behav Res (2012) 44:490–502

5.78, indicating that the dest was more accurate than ddefault,yet the differences were small (with ρ of .25 for γtrt − γctrof .20, ρ of .15 for γtrt − γctr of .70) to large. For the MSEvalues, Cohen’s d-effect size between ddefault and destranged from 0 to 3.00, indicating that the dest was moreprecise, except when ρ was either .15 or .25, whose MSEvalues were identical at 0.001. Overall, the dest was themost accurate and precise, as compared with dwithout andddefault, with exceptions on the identical MSE values of destand ddefault when ρ was either .15 or .25
As is displayed in Table 3, the relative bias and MSEvalues of the estimators differed depending on the ICCcorrection method (F(2, 120) = 13,598.56, p < .01, for therelative bias value; F(2, 120) = 684.33, p < .01, for the MSEvalue). A post hoc comparison using Tukey’s adjustmentshowed that both relative bias and MSE values of dest werelower than those of dwithout (Mdiff = −0.64, p < .01, for therelative bias value and Mdiff = 0.015, p < .01, for the MSEvalue). And the relative bias and MSE values of dest werelower than ddefault, yet mean differences were not statisticallysignificant (Mdiff = −0.068, p = .13, for the relative bias valueand Mdiff = −0.001, p = .43, for the MSE value).
These three overall effect-size estimators (i.e., dwithout,ddefault, and dest.) were next compared in relation to severalstudy features manipulated in the simulation. Thesecomparisons were based on two separate ANOVAs on therelative bias and MSE values of the overall mean effect-sizeestimators. Because the main purpose of each ANOVA wasto compare three effect-size estimators in relation to otherstudy features manipulated in the simulation, only theinteraction effect related to type of ICC corrections (i.e., no
ICC correction, default ICC correction, and estimated ICCcorrection) with other study factors (i.e., the populationmean difference, the population ICC value, the number ofstudies included, and ratio of number of cluster-levels tonumber of individual-levels) were modeled.
As is displayed in Table 3, results from ANOVAsindicated that there were significant three-way interactionsof the ICC correction methods with the population meandifference, the population ICC value, and the ratio ofnumbers of clusters to individual levels on both relativebias and MSE values of the overall effect-size estimators.Because the higher-order interactions superseded maineffects, only significant three-way interaction effects wereinvestigated further.
Figure 1 displays the significant three-way interactionsof the ICC correction methods (i.e., no ICC correction,default correction, and estimated ICC correction) with therelative bias values. The effect of the population meandifference on the relative bias of the overall effect-sizeestimators was relatively large, when the population ICCwas set to .05 (see Fig. 1a). However, when the populationICC was set to either .15 or .25, mean differences in therelative biases of ddefault, and dest were almost identicalacross all the population mean difference. However, meandifferences in the relative bias values of ddefault and destincreased when the population ICC value was .33. Inparticular, when the population ICC value was equal to .33,the relative bias value of ddefault.was larger in a negativedirection, as compared with that of dest. As is shown insecond column from the last of Table 2, Cohen’s d-effectsize for differences in the absolute magnitude of the bias
Table 3 ANOVA results on the relative bias and MSE values of effect-size estimators
Source Relative Bias MSE
SS df MS F η2 SS df MS F η2
[γtrt − γctr] 0.51 2 0.26 389.80** .87 0.002 2 0.001 145.34** 0.71
ρ 13.30 3 4.43 6773.50** .99 0.0007 3 0.0002 33.94** 0.46
[l + m] 2.31E-05 1 2.31E-05 0.04 .00 0.0003 1 0.0003 43.15** 0.26
[l : m] 0.98 2 0.49 750.64** .93 0.0008 2 0.0004 56.25** 0.48
ρcorrection 17.80 2 8.90 13598.56** 1.00 0.0095 2 0.005 684.33** 0.92
[γtrt − γctr]* ρ * ρcorrection 1.40 18 0.08 118.98** .95 0.0006 18 3.39E-05 4.90** 0.42
[l : m] * ρ * ρcorrection 1.64 18 0.09 139.25** .95 0.0018 18 0.0001 14.75** 0.69
[l + m] *ρ * ρcorrection 0.001 9 0.0002 0.24 .02 1.97E-06 9 2.19E-07 .03 0.002
[γtrt − γctr]*[l : m] * ρcorrection 0.02 12 0.0016 2.40** .19 0.001 12 9.29E-05 13.40** 0.57
[γtrt − γctr]* [l + m] * ρcorrection 0.001 6 0.0002 0.28 .01 3.95E-07 6 6.58E-08 .01 0.0005
[l + m] * [l : m] * ρcorrection 0.0003 6 4.23E-05 0.06 .003 3.04E-06 6 5.06E-07 .07 0.004
Error 0.08 120 0.0007 0.0008 120 6.93E-06
Total 42.03 215 0.02 215
Note. ** p < .01; [γtrt − γctr] = the population mean difference between treatment and control groups; ρ = the population ICC value; [l + m] = thenumber of studies; [l : m] = [# of cluster-levels : # of individual-levels]; ρcorrection = type of the ICC correction method
Behav Res (2012) 44:490–502 497

A
B
C
Fig. 1 Relative bias of theoverall effect size by studyfeatures
498 Behav Res (2012) 44:490–502

values between ddefault and dest were all over 5, indicatingthat dest.has lower bias values, as compared with ddefault.
The relative bias value of dest was consistent across thefour population ICC values regardless of the ratio of thenumber of cluster-level studies to the number of individual-level studies. And across all population ICC values, thedifferences between dest and ddefault in the relative bias werenegligible. However, the effects of different ratios of clusterand individual levels on the relative bias value of dwithoutand ddefault were different across four ICC values. Inparticular, the overall mean-effect estimators (i.e., dwithoutand ddefault ) with more individual-level studies were moreaccurate (see Fig. 1b).
In addition, the effects of different proportions of clusterlevels and individual levels on the relative bias of dest werefairly consistent for all population mean difference (seeFig. 1c). However, as is shown in Fig. 1c, both ddefault anddwithout had smaller relative bias values when the individuallevels were twice the cluster-levels, while these had largerrelative bias values with the same numbers of individualand cluster levels included.
Figure 2 presents the significant three-way interactions ofthe ICC correction methods on the MSE value of the overalleffect-size estimators. As is shown in Fig. 2a, the MSE valueof dest was consistently low (almost zero) regardless of thepopulation mean difference and the population ICC value.However, the MSE values of ddefault and dwithout differedconsiderably by both the population ICC value and thepopulation mean difference. Specifically, ddefault had almostzero MSE values when the population ICC was either .15 or.25, but its MSE values increased as the population meandifference got bigger only with the population ICC value of.05 and .33. For the MSE values, Cohen’s d-effect sizebetween ddefault and dest was over 1 when the population ICCvalues was either .05 or .33, indicating that the dest was moreprecise, except when ρ was either .15 or .25. And thedifferences in the MSE value of dwithout by the populationmean difference became smaller when the population ICCbecame larger (see Fig. 2a).
As is displayed in Fig. 2b, differences in MSE values ofddefault and dwithout by different ratios of cluster andindividual levels were bigger as the population meandifference became larger. However, the MSE values of destwere consistently low (almost zero) regardless of thepopulation mean difference or the population ICC. Andhaving more cluster levels yielded slightly bigger MSEvalues of both ddefault and dest , yet produced smaller MSEvalues of dwithout .
Lastly, having a different ratio of the number of cluster-level studies to the number of individual-level studies onthe MSE values of dest was consistent across fourpopulation ICC values. However, the effect of differentratios of cluster and individual levels on the MSE values of
dwithout were not consistent across four ICC values, showingthat having more individual-level studies made the MSEvalues of dwithout smaller (see Fig. 2c).
General discussion
The present study focused on the central issue ofsynthesizing d-effect sizes originating from different levels(e.g., students and classrooms). This issue often arises whenthe included studies examine the effect of an intervention ortreatment that can be implemented at different levels. Also,a mixture of studies providing d-effect sizes from bothcluster-level and individual-level data can be found whencomparing naturally occurring groups. For instance, theeffect of teachers’ having a bachelor degree (BA) inmathematics on student math achievement can be studiedby either comparing mean scores from classrooms ofteachers with BAs with those of teachers without BAs orcomparing students mean scores of two teacher groups.
Although the danger of drawing inferences aboutindividual behavior on the basis of cluster data (WWC,2008), which is referred to as the fallacy of ecologicalinference (Robinson, 1950), has long been discussed, manyresearchers still utilize aggregated data, and many meta-analyst may include these studies in their syntheses. Theuse of aggregated data could be done for the convenience ofthe researchers and/or because the meaning of the effect issimilar across levels. There are also some situations inwhich the individual-level group assignments are notfeasible for political or practical reasons (Hedges &Hedberg, 2007) or the individual-level data are notaccessible (e.g., the restricted use of individual-level data).In all of these cases, the proposed method may assist incombining studies originating at different levels.
The correction of the cluster-level d-effect sizes usingthe ICC value is necessary because the cluster-level d-effectsizes are upwardly biased. However, it can be challengingto obtain the ICC value because the studies using clustereddata do not often report it (Hedges, 2009b). Although theexisting recommendations for extracting a default ICCvalue, particularly on the basis of empirical searches ofprevious studies or data sets using the national-levelprobability samples, might be reasonable in some cases,practical limitations remain. In resolving such limitations,the present study proposes incorporating the estimated ICCfrom standard deviations/variances that are often reported(unlike the ICC value) in the included studies for anyparticular meta-analysis.
As was shown in the first simulation, the ICC value wasaccurately and precisely estimated from the standarddeviations, with the average relative bias less than anacceptable range of |−.05| and MSE values approximately
Behav Res (2012) 44:490–502 499

A
B
C
Fig. 2 MSE values of the over-all effect size by study features
500 Behav Res (2012) 44:490–502

close to zero. Also, the ICC value was not sensitive tovariation in the scale of the measures that represented thesame underlying construct of interest. The accuracy andprecision of the ICC estimation were consistent irrespectiveof any study features. In other words, the proposed modelproduced the accurate and precise estimation of the ICCvalue, which eventually affects the correct estimation of theoverall effect size in a meta-analysis.
In general, the estimated overall effect size aftercorrecting the cluster-level d-effect size using the estimatedICC value was unbiased and accurate, having averagerelative bias less than |−.05| and MSE values close to zero.Specifically, the overall effect-size estimator with theestimated ICC correction had significantly lower meanrelative bias and MSE values, as compared with no ICCcorrection. Even though the mean difference in the relativebias and MSE values of the effect-size estimators was notstatistically significant, the overall effect size with theestimated ICC correction was lower than that with a defaultICC correction (Mdiff = −0.068 for the relative bias valueand Mdiff = −0.001 for the MSE value).
The relative bias and MSE values of the overall effect-size estimators with different ICC corrections varieddepending on the population mean difference, the popula-tion ICC value, and the ratio of cluster-level studies toindividual-level studies. Specifically, the relative bias andMSE values of the overall effect size with the estimatedICC correction were similar to that of the overall effect sizewith a default ICC correction, when the population ICC valuewas set to either .15 or .25. This makes sense because thecomputed overall effect size with a default ICC correction wasbased on the cluster-level d-effect sizes corrected by a defaultICC value of .20. However, relative bias and MSE values ofthe overall effect size with a default ICC correction werebigger than those with the estimated ICC correction when thepopulation ICC value was set to either .05 or .33.
The advantage of the proposed method largely comesfrom the accuracy and precision of the ICC estimation,which does not appear to be sensitive to variation in thescale of measures, and leads to the correct estimation of theoverall effect size in a meta-analysis. In addition, the easeof utilizing the proposed method for any contexts of interestis quite appealing. Specifically, the estimation of bothbetween and total variances for the ICC computation is asimple application of the regular meta-analytic procedure.Therefore, any meta-analysts can easily extract the ICCvalue from the reported standard deviations and samplesizes. Moreover, the estimated ICC value from studieswould be better to represent the unique characteristics ofthe population whose data are nested in nature.
In spite of these practical advantages of the proposedmethod, there are a few methodological concerns. First, thepresent study assumes that standard deviations/variances are
from the same population, and thus the fixed-effect model isused to estimate the between and within variances. In caseswhere the fixed effect of standard deviation is suspicious, therandom-effects model should be used to estimate the averagevariances (Raudenbush, 1994). Second, the proposed methodassumes that standard deviations and sample sizes areavailable from the included studies. Such concern would berelatively trivial, since most intervention and comparisonstudies report summary statistics. Lastly, the parameters usedin simulations 1 and 2 might be too hypothetical to representthe reality. For instance, in reality, the numbers of cluster andindividual levels vary considerably, and sample sizes oftendiffer across studies as well.
In spite of these methodological concerns, the proposedmethod appears to be both practical and applicable to manycontexts of research synthesis. Also, the estimated overalleffect size after correcting cluster-level effect sizes is unbiasedand accurate, which is due mainly to the correctly estimatedICC value incorporated into the overall effect-size estimation.However, it should be reemphasized that the practicality of theproposed method is dependent on the primary studiesproviding the necessary information for estimating the ICCvalue, particularly standard deviations and sample sizes.
References
Ahn, S., & Becker, B. J. (2011). Incorporating quality scores in meta-analyses. Manuscript submitted for publication.
Cohen, J. (1988). Statistical power analysis for the behavioralsciences. Hillsdale, NJ: Erlbaum.
Cooper, H., Hedges, L., & Valentine, J. (2009). The handbook ofresearch synthesis and meta-analysis (2nd ed.). New York:Russell Sage Foundation.
Hedges, L. V. (2007). Correcting a significance test for clustering.Journal of Educational and Behavioral Statistics, 32, 151–179.
Hedges, L. V. (2009a). Adjusting a significance test for clustering indesigns with two levels of nesting. Journal of Educational andBehavioral Statistics, 34, 464–490.
Hedges, L. V. (2009b). Effect sizes in nested designs. In H. M.Cooper, L. V. Hedges, & J. C. Valentine (Eds.), The handbook ofresearch synthesis and meta-analysis (pp. 337–355). New York:Russell Sage Foundation.
Hedges, L. V., & Hedberg, E. C. (2007). Intraclass correlation forplanning group randomized experiments in education. EducationalEvaluation and Policy analysis, 29, 60–87.
Hoogland, J. J., & Boomsma, A. (1998). Robustness studies incovariance structure modeling: An overview and a meta-analysis.Sociological Methods and Research, 26, 329–367.
Hox, J. J. (2002). Multilevel analysis: Techniques and applications.Mahwah, NJ: Erlbaum.
Hox, J. J., & Maas, C. J. M. (2001). The accuracy of multilevelstructural equation modeling with pseudobalanced groups andsmall samples. Structural Equation Modeling, 8, 157–174.
Hox, J. J., Maas, C. J. M., & Brinkhuis, M. J. S. (2010). The effect ofestimation method and sample size in multilevel structuralequation modeling. Statistica Neerlandica, 64, 157–170.
Kreft, I., & de Leeuw, J. (1998). Introducing multilevel modeling.Thousand Oaks, CA: Sage.
Behav Res (2012) 44:490–502 501

Maerten-Rivera, J., Myers, N. D., Lee, O., & Penfield, R. (2010).Student and school predictors of high-stakes assessment inscience. Science Education, 94, 937–962.
Mol, S. E., Bus, A. G., & de Jong, M. T. (2009). Interactive book readingin early education: A tool to stimulate print knowledge as well asoral language. Review of Educational Research, 79, 979–1007.
Myers, N. D., Feltz, D. L., Maier, K. S., Wolfe, E. W., & Reckase, M.D. (2006). Athletes’ evaluations of their head coach’s coachingcompetency. Research Quarterly for Exercise and Sport, 77,111–121.
R Development Core Team. (2008). R: A language and environmentfor statistical computing. Vienna: R Foundation for StatisticalComputing.
Raudenbush, S.W. (1994). Random-effects model. In H. M. Cooper & L.V. Hedges (Eds.), The handbook of research synthesis (pp. 301–323). New York: Russell Sage Foundation.
Raudenbush, S. W., & Bryk, A. S. (2002). Hierarchical linear models:Applications and data analysis methods (2nd ed.). NewburyPark, CA: Sage.
Robinson, W. S. (1950). Ecological correlation and the behavior ofindividuals. American Sociological Review, 15, 351–357.
Salinas, A. (2010). Investing in teachers: What focus of professionaldevelopment lead to the highest student gains in mathematicsachievement?. Unpublished doctoral dissertation, University ofMiami.
Scher, L., & O’Reilly, F. (2009). Professional development for K–12math and science teacher: What do we really know? Journal ofResearch on Educational Effectiveness, 2, 209–249.
Slavin, R. E., Lake, C., Chambers, B., Chueng, A., & Davis, S. (2009).Effective reading programs for the elementary grades: A best-evidence synthesis. Review of Educational Research, 79, 1391–1466.
Swanson, H. L., & Hsieh, C.-J. (2009). Reading disabilities in adults:A selective meta-analysis of literature. Review of EducationalResearch, 79, 1362–1390.
What Works Clearinghouse. (2008). Procedures and standards handbook(version 2.0). Retrieved June 4, 2010, from http://ies.ed.gov/ncee/wwc/pdf/wwc_procedures_v2_standards_handbook.pdf
502 Behav Res (2012) 44:490–502