Embed Size (px)
Citation preview
Use of Laser Scanning Technology to Obtain As-Built Records of Historic Covered Bridges Robert J. RossBrian K. BrashawSamuel J. Anderson
United StatesDepartment ofAgriculture
Forest Service
ForestProductsLaboratory
ResearchPaperFPL–RP–669
In cooperation with theUnited StatesDepartment ofTransportationFederal Highway Administration
August 2012
Ross, Robert J.; Brashaw, Brian K.; Anderson, Samuel J. 2012. Use of laser scanning technology to obtain as-built records of historic covered bridges. Research Paper FPL-RP-669. Madison, WI: U.S. Department of Agricul-ture, Forest Service, Forest Products Laboratory. 18 p.
A limited number of free copies of this publication are available to the public from the Forest Products Laboratory, One Gifford Pinchot Drive, Madison, WI 53726–2398. This publication is also available online at www.fpl.fs.fed.us. Laboratory publications are sent to hundreds of libraries in the United States and elsewhere.
The Forest Products Laboratory is maintained in cooperation with the University of Wisconsin.
The use of trade or firm names in this publication is for reader information and does not imply endorsement by the United States Department of Agriculture (USDA) of any product or service.
The USDA prohibits discrimination in all its programs and activities on the basis of race, color, national origin, age, disability, and where applicable, sex, marital status, familial status, parental status, religion, sexual orienta-tion, genetic information, political beliefs, reprisal, or because all or a part of an individual’s income is derived from any public assistance program. (Not all prohibited bases apply to all programs.) Persons with disabilities who require alternative means for communication of program informa-tion (Braille, large print, audiotape, etc.) should contact USDA’s TARGET Center at (202) 720–2600 (voice and TDD). To file a complaint of discrimi-nation, write to USDA, Director, Office of Civil Rights, 1400 Independence Avenue, S.W., Washington, D.C. 20250–9410, or call (800) 795–3272 (voice) or (202) 720–6382 (TDD). USDA is an equal opportunity provider and employer.
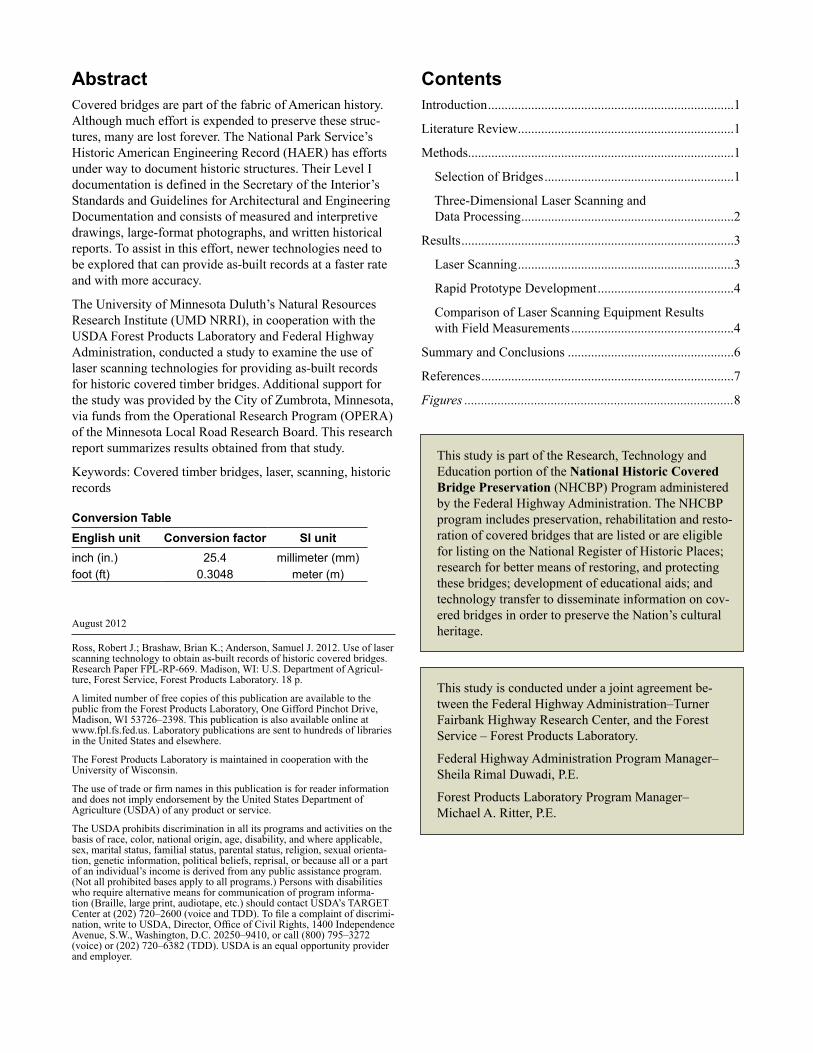
AbstractCovered bridges are part of the fabric of American history. Although much effort is expended to preserve these struc-tures, many are lost forever. The National Park Service’s Historic American Engineering Record (HAER) has efforts under way to document historic structures. Their Level I documentation is defined in the Secretary of the Interior’s Standards and Guidelines for Architectural and Engineering Documentation and consists of measured and interpretive drawings, large-format photographs, and written historical reports. To assist in this effort, newer technologies need to be explored that can provide as-built records at a faster rate and with more accuracy.
The University of Minnesota Duluth’s Natural Resources Research Institute (UMD NRRI), in cooperation with the USDA Forest Products Laboratory and Federal Highway Administration, conducted a study to examine the use of laser scanning technologies for providing as-built records for historic covered timber bridges. Additional support for the study was provided by the City of Zumbrota, Minnesota, via funds from the Operational Research Program (OPERA) of the Minnesota Local Road Research Board. This research report summarizes results obtained from that study.
Keywords: Covered timber bridges, laser, scanning, historic records
ContentsIntroduction ..........................................................................1
Literature Review .................................................................1
Methods................................................................................1
Selection of Bridges .........................................................1
Three-Dimensional Laser Scanning and Data Processing ................................................................2
Results ..................................................................................3
Laser Scanning .................................................................3
Rapid Prototype Development .........................................4
Comparison of Laser Scanning Equipment Results with Field Measurements .................................................4
Summary and Conclusions ..................................................6
References ............................................................................7
Figures .................................................................................8
This study is part of the Research, Technology and Education portion of the National Historic Covered Bridge Preservation (NHCBP) Program administered by the Federal Highway Administration. The NHCBP program includes preservation, rehabilitation and resto-ration of covered bridges that are listed or are eligible for listing on the National Register of Historic Places; research for better means of restoring, and protecting these bridges; development of educational aids; and technology transfer to disseminate information on cov-ered bridges in order to preserve the Nation’s cultural heritage.
This study is conducted under a joint agreement be-tween the Federal Highway Administration–Turner Fairbank Highway Research Center, and the Forest Service – Forest Products Laboratory.
Federal Highway Administration Program Manager– Sheila Rimal Duwadi, P.E.
Forest Products Laboratory Program Manager– Michael A. Ritter, P.E.
Conversion TableEnglish unit Conversion factor SI unitinch (in.) 25.4 millimeter (mm)foot (ft) 0.3048 meter (m)
Use of Laser Scanning Technology to Obtain As-Built Records of Historic Covered BridgesRobert J. Ross, Supervisory Research General EngineerForest Products Laboratory, Madison, Wisconsin
Brian K. Brashaw, Program Director, Samuel J. Anderson, Engineer, University of Minnesota Duluth, Natural Resources Research Institute
IntroductionCovered bridges are part of the fabric of American history, and several hundred historic covered bridges still exist to-day. Although much effort is expended to preserve these structures, the high cost of restoration, neglect, vandalism, and arson often take their toll. Many are lost forever. One of the more famous bridges from The Bridges of Madison County movie fame was burned in 2003, and Hurricane Irene destroyed a number of New England bridges in 2011. Because we cannot completely prevent these types of inci-dents from occurring, the National Park Service’s Historic American Engineering Record (HAER) has efforts under way to document historic structures. Their Level I documen-tation is defined in the Secretary of the Interior’s Standards and Guidelines for Architectural and Engineering Documen-tation. It consists of measured and interpretive drawings, large-format photographs, and written historical reports. To assist in this effort, newer technologies need to be explored that can provide as-built records at a fast rate and with greater accuracy.
The demonstration study summarized in this report was conducted to examine the technical feasibility of using la-ser scanning technologies for obtaining as-built records for historic covered timber bridges. A secondary objective was to identify other applications of this technology, notably for other transportation structures.
Literature ReviewThree-dimensional (3D) laser scanners are instruments that record precise and accurate surface data of objects in a non-destructive manner. These instruments use an infrared beam of light to calculate and record the distance to an object, typically as data points with spatial coordinates. These data are then analyzed using various types of computer software to generate a detailed image of coordinates and dimensions. Three-dimensional laser scanners have successfully been used to digitize objects of various sizes ranging from small diagnostic artifacts to large, complex sites of monumental architecture (FARO Technologies 2011a, b).
A wide number of companies manufacture various types of 3D laser scanners. Generally, these units use light detec-tion and ranging technology (LiDAR), where laser pulses
determine the distance to an object or surface. The distance to an object is determined by using time-of-flight between transmission of a pulse and detection of the reflected signal. A point cloud of data is then collected and can be converted into the true shape of the object.
The units used in this project, a FARO LS 880 model and a Photon 120 model (FARO Technologies, Lake Mary, Flor-ida), used similar technology to acquire the scan points. A laser beam is emitted from a rotating mirror out toward the area being scanned. The laser beam is then reflected back to the scanner by objects in its path. The distance to the objects defining an area is calculated, as well as their relative verti-cal and horizontal angles (FARO Technologies 2011a, b).
Several bridge projects were noted in the literature review. The Pennsylvania Department of Transportation (PennDOT) completed an initial study in 1999. In this study, the goals were to evaluate the technology for creating as-built draw-ings. A comparison of traditional and 3D scanning estimated an overall time savings of 100+ person-hours through the use of 3D scanning (Foltz 2000). Based on this assessment, PennDOT purchased two laser scanners in 2000. A second assessment was completed by Jaselskis and others in 2003, showing that laser scanning could be used cost effectively for preliminary surveys to develop triangular network (TIN) meshes of roadway surfaces and to measure bridge beam camber more safely and quickly compared with convention-al approaches. Other applications noted in this publication showed potential applications for laser scanning to include developing as-built drawings of historical structures such as the bridges of Madison County.
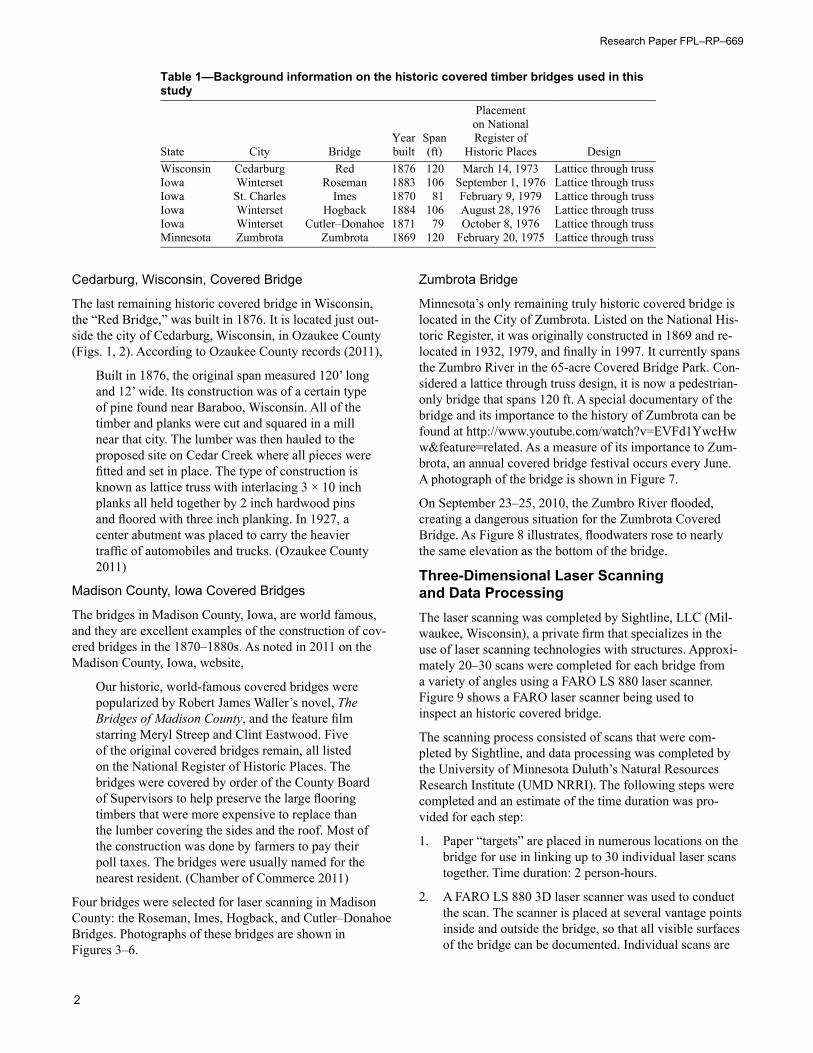
MethodsSelection of BridgesThe bridges for scanning and assessment used in this study are located in Wisconsin, Iowa, and Minnesota. Key back-ground information (Table 1), detailed descriptions, and photographs are summarized in the following paragraphs. Contact was made with the appropriate government or administrative staff for each bridge, and permission was also secured to obtain scans. Note that four of the bridges scanned included the historic Madison County, Iowa, bridges.
Research Paper FPL–RP–669
2
Cedarburg, Wisconsin, Covered Bridge
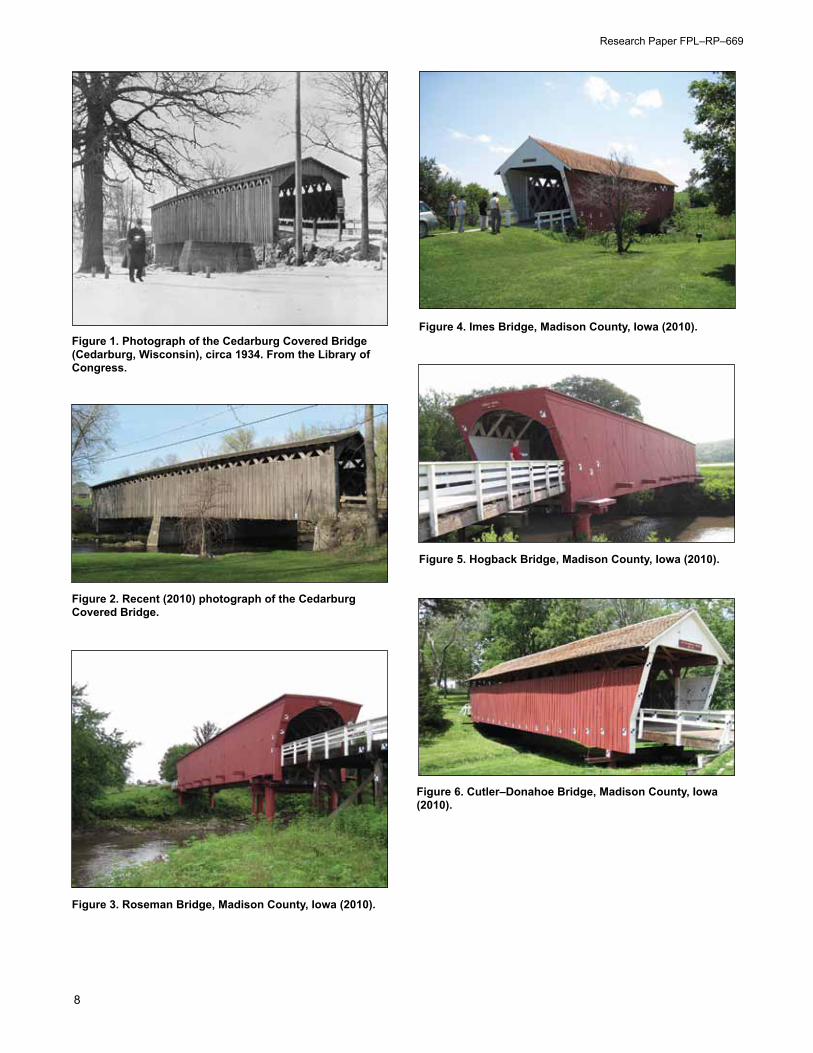
The last remaining historic covered bridge in Wisconsin, the “Red Bridge,” was built in 1876. It is located just out-side the city of Cedarburg, Wisconsin, in Ozaukee County (Figs. 1, 2). According to Ozaukee County records (2011),
Built in 1876, the original span measured 120’ long and 12’ wide. Its construction was of a certain type of pine found near Baraboo, Wisconsin. All of the timber and planks were cut and squared in a mill near that city. The lumber was then hauled to the proposed site on Cedar Creek where all pieces were fitted and set in place. The type of construction is known as lattice truss with interlacing 3 × 10 inch planks all held together by 2 inch hardwood pins and floored with three inch planking. In 1927, a center abutment was placed to carry the heavier traffic of automobiles and trucks. (Ozaukee County 2011)
Madison County, Iowa Covered Bridges
The bridges in Madison County, Iowa, are world famous, and they are excellent examples of the construction of cov-ered bridges in the 1870–1880s. As noted in 2011 on the Madison County, Iowa, website,
Our historic, world-famous covered bridges were popularized by Robert James Waller’s novel, The Bridges of Madison County, and the feature film starring Meryl Streep and Clint Eastwood. Five of the original covered bridges remain, all listed on the National Register of Historic Places. The bridges were covered by order of the County Board of Supervisors to help preserve the large flooring timbers that were more expensive to replace than the lumber covering the sides and the roof. Most of the construction was done by farmers to pay their poll taxes. The bridges were usually named for the nearest resident. (Chamber of Commerce 2011)
Four bridges were selected for laser scanning in Madison County: the Roseman, Imes, Hogback, and Cutler–Donahoe Bridges. Photographs of these bridges are shown in Figures 3–6.
Zumbrota Bridge
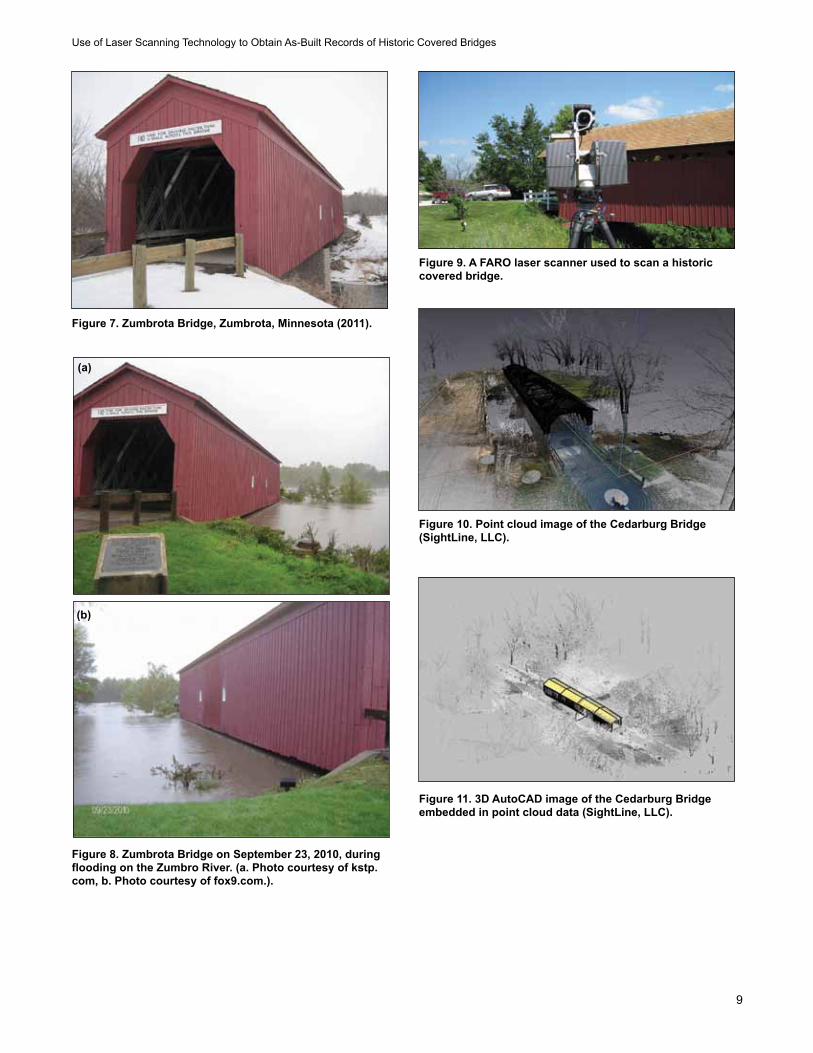
Minnesota’s only remaining truly historic covered bridge is located in the City of Zumbrota. Listed on the National His-toric Register, it was originally constructed in 1869 and re-located in 1932, 1979, and finally in 1997. It currently spans the Zumbro River in the 65-acre Covered Bridge Park. Con-sidered a lattice through truss design, it is now a pedestrian-only bridge that spans 120 ft. A special documentary of the bridge and its importance to the history of Zumbrota can be found at http://www.youtube.com/watch?v=EVFd1YwcHww&feature=related. As a measure of its importance to Zum-brota, an annual covered bridge festival occurs every June. A photograph of the bridge is shown in Figure 7.
On September 23–25, 2010, the Zumbro River flooded, creating a dangerous situation for the Zumbrota Covered Bridge. As Figure 8 illustrates, floodwaters rose to nearly the same elevation as the bottom of the bridge.
Three-Dimensional Laser Scanning and Data Processing
The laser scanning was completed by Sightline, LLC (Mil-waukee, Wisconsin), a private firm that specializes in the use of laser scanning technologies with structures. Approxi-mately 20–30 scans were completed for each bridge from a variety of angles using a FARO LS 880 laser scanner. Figure 9 shows a FARO laser scanner being used to inspect an historic covered bridge.
The scanning process consisted of scans that were com-pleted by Sightline, and data processing was completed by the University of Minnesota Duluth’s Natural Resources Research Institute (UMD NRRI). The following steps were completed and an estimate of the time duration was pro-vided for each step:
1. Paper “targets” are placed in numerous locations on the bridge for use in linking up to 30 individual laser scans together. Time duration: 2 person-hours.
2. A FARO LS 880 3D laser scanner was used to conduct the scan. The scanner is placed at several vantage points inside and outside the bridge, so that all visible surfaces of the bridge can be documented. Individual scans are
Table 1—Background information on the historic covered timber bridges used in this study
State City Bridge Yearbuilt
Span(ft)
Placement on National Register of
Historic Places Design Wisconsin Cedarburg Red 1876 120 March 14, 1973 Lattice through truss Iowa Winterset Roseman 1883 106 September 1, 1976 Lattice through truss Iowa St. Charles Imes 1870 81 February 9, 1979 Lattice through truss Iowa Winterset Hogback 1884 106 August 28, 1976 Lattice through truss Iowa Winterset Cutler–Donahoe 1871 79 October 8, 1976 Lattice through truss Minnesota Zumbrota Zumbrota 1869 120 February 20, 1975 Lattice through truss
Use of Laser Scanning Technology to Obtain As-Built Records of Historic Covered Bridges
3
completed in approximately 15–20 min. When a single scan is completed, it is saved to a computer as an .ls file. It is highly recommended that a computer with significant computing power and high levels of RAM memory be used to process the millions of data points created during the scanning process. Time duration: 10 person-hours.
3. After all visible portions of the bridge have been scanned, the software files are linked using FARO Scene software. This software allows an individual to identify the targets placed prior to the scanning process and use them to link or attach one scan to another. It is also possible to filter, using various techniques or software, extraneous images (for instance, a vehicle traveling across the bridge or background vegetation). The process of linking two individual scans is repeated several times until all scans have been compiled into one large scan depicting the entire bridge. Time dura-tion: 9 person-hours.
4. Once a bridge has been completely assembled us-ing all of the individual scans, it can be exported as a point cloud, depicting all visible aspects and actual dimensions of the bridge. This cloud of data was then exported into AutoCAD software (Autodesk, Inc., San Rafael, California) using an add-in provided by Kubit USA (Houston, Texas). This add-in allows a user to im-port point cloud files in addition to the ones inherently recognized by AutoCAD 2011 and has additional mod-eling tools for working directly with point cloud data in AutoCAD. Once a point cloud has been exported into AutoCAD, it can be divided into multiple cross sec-tions. This is done so that specific components of the bridge can be seen more clearly. From this point, two-dimensional (2D) and 3D models of the bridge can be generated. Time duration: 40+ person-hours.
ResultsLaser ScanningA number of types of images can be presented from process-ing point cloud data. These images include a point cloud image resulting from only one scan, a point cloud image created from multiple scans, a parametric picture created from a point cloud scan, a point cloud image imbedded in AutoCAD, and 2D/3D AutoCAD images. These images can be created using FARO Scene software or AutoCAD 2011 with a Kubit USA add-in.
As to the project activities, the majority of the scan process-ing for the Cedarburg, Wisconsin, bridge was completed by Sightline, LLC. The processing of the scan data for the Madison County, Iowa, bridges and the Zumbrota, Minne-sota, bridge was completed by the UMD NRRI. The project team decided that based on the processing time estimates, detailed in-point cloud and 3D AutoCAD, data would be
provided for the Cedarburg, Imes, and Zumbrota Bridges, with only point cloud data for the Hogback, Cutler– Donahoe, and Roseman Bridges. All the digital points could be further processed to develop detailed dimensional infor-mation, as the point cloud images are considered accurate data. The point cloud images could also be further processed using Kubit USA add-ins for AutoCAD 2011. Each bridge scan and AutoCAD image is shown in the following sections.
Cedarburg, Wisconsin, Covered Bridge
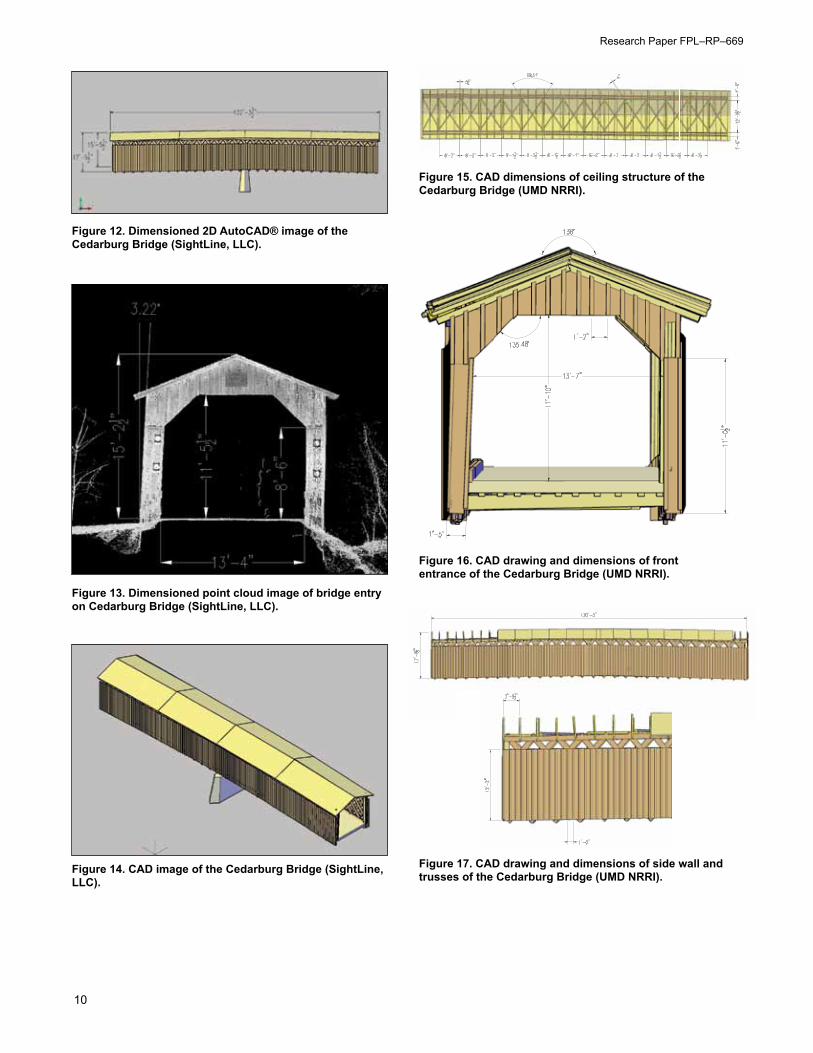
Figures 10–17 show various images created from 3D laser scanning conducted during the project for the Cedarburg Bridge. This includes point cloud images and AutoCAD drawings created from the point cloud images. The Imes Bridge is the only Madison County Bridge where the point cloud data was used to create AutoCAD drawings. Our proj-ect team has all of the point cloud data that could be used in the future to create AutoCAD drawings for the other Madison County bridges (Hogback, Cutler–Donahoe, and Roseman) scanned during the project.
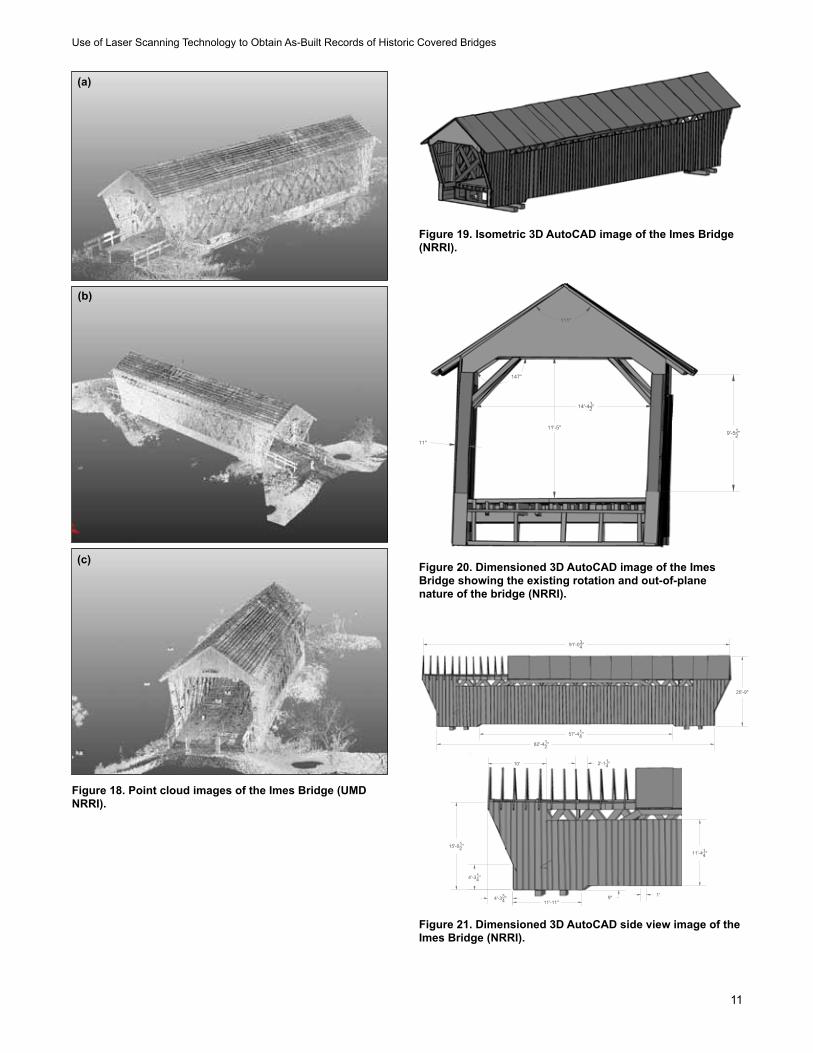
Imes Bridge, Madison County, Iowa
For the Imes Bridge, the data show the accurate dimensions and shape of the bridge at the time of scanning. No correc-tions were made to straighten any bridge members, such as would be done to create new construction drawings. Fig-ures 18–23 show that the bridge is no longer perfectly plane, but that it has twisted and moved over time.
Roseman Covered Bridge, Madison County, Iowa
Figures 24–25 shows various planar views and point cloud images created from 3D laser scanning conducted during the project for the Roseman Bridge, located in Madison County, Iowa. These point images are fully dimensioned computer files that can be used to determine dimensions, skew of the bridge, deflection, and other characteristics as needed, with-out importing into AutoCAD or other software platforms.
Hogback Covered Bridge, Madison County, Iowa
Figure 26 shows various point cloud images created from 3D laser scanning conducted during the project for the Hog-back Bridge located in Madison County, Iowa. These point images are fully dimensioned computer files that can be used to determine dimensions, skew of the bridge, deflec-tion, and other characteristics as needed, without importing into AutoCAD or other software platforms.
Cutler–Donahoe Covered Bridge, Madison County, Iowa
Figures 27 and 28 show various point cloud images created from 3D laser scanning conducted during the project for the Cutler–Donahoe Bridge, located in Madison County, Iowa. These point images are fully dimensioned computer files that can be used to determine dimensions, skew of the
Research Paper FPL–RP–669
4
bridge, deflection, and other characteristics as needed, with-out importing into AutoCAD or other software platforms.
Zumbrota Covered Bridge, Zumbrota, Minnesota
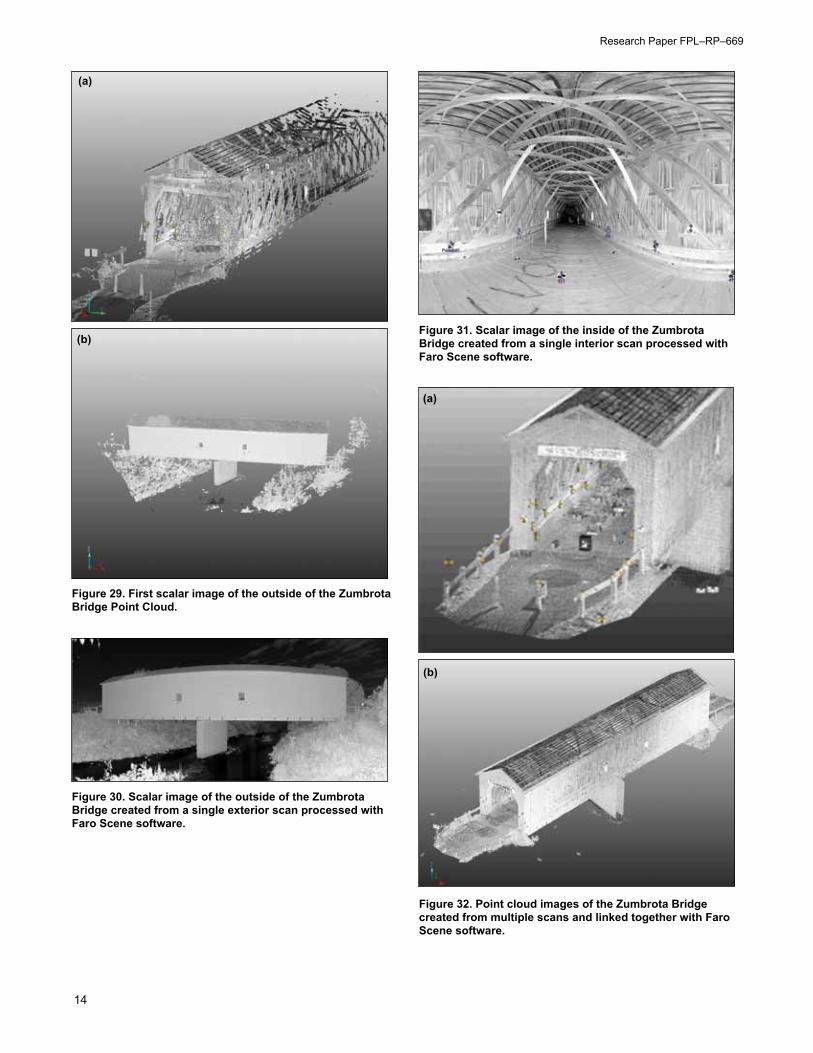
Additional project funds were received from the Minnesota Local Road Research Board’s Operational Research Pro-gram (OPERA) to conduct 3D laser scanning of the most significant historic covered bridge in Minnesota, located in Zumbrota. The bridge, built in 1869 (and relocated several times), is now located in a city park and spans the Zumbro River. Figures 29–36 show various scalar images and point cloud images created from 3D laser scanning conducted during the project. These figures show each different type of possible image that can be created using FARO Scene software or AutoCAD 2011 with a Kubit USA add-in. These images include a point cloud image resulting from only one scan, a scalar image created from a point cloud scan, a point cloud image created from multiple scans, a point cloud im-age imbedded in AutoCAD, and 2D/3D AutoCAD images. All of the scan data, images, and figures were provided to the City of Zumbrota for any further processing as appropri-ate.
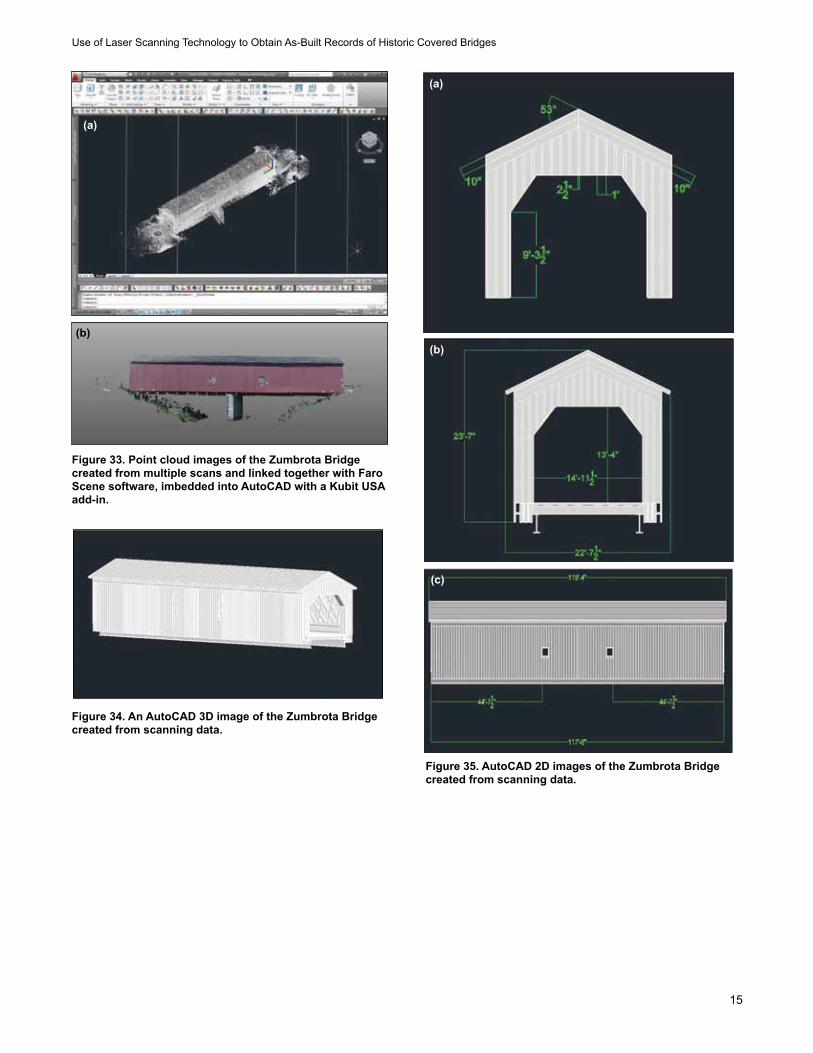
In contrast to the Imes Bridge, significant efforts were made to straighten the dimensions of the bridge in AutoCAD in an effort to create a drawing that could be used to construct a new bridge. This was a significant undertaking, and added nearly 40 h of processing time to data processing. This pro-cess creates a drawing that would be more consistent with the original construction of the bridge, not its current shape and condition (Brashaw 2010).
Rapid Prototype DevelopmentFollowing processing and development of the 3D scan-ning images, a digital 3D CAD file was used to generate a 1/100th 3D scale replica of the bridge at the Northern Lights Technology Center of UMD NRRI. In processing the data, we found that it would only be possible to produce an ac-curate external version of the bridge. We could not create a true replica of the inside of the bridge because a 1/100th scale of a 6-in.-wide beam would only have a thickness of 0.06 in. This is below the thickness that can be created using rapid prototyping, and these thin members would not have strength because many of the beams and members are only connected at the ends. The 3D image that was used by the Vanguard unit to create the 1/100th model shown in Figure 37 from Vanguard Si2 selective laser sintering (SLS) equipment (3D Systems, Valencia, California) was used to create the scale replica of the bridge (Fig. 38). Because the scan data were corrected to achieve straight members, this model would be consistent with the true nature of the bridge at construction, not its condition in 2010.
Comparison of Laser Scanning Equipment Results with Field MeasurementsOne of the objectives of this project was to assess the ac-
curacy of laser scanning to determine accurate dimensions of the bridges. The FARO laser scanner used for the project was rated at an accuracy of 1/4 in. at a distance of 150 ft. However, the typical distance of the laser scanner in this project ranged from 50–100 ft, improving the accuracy over the rated number. For this phase of the project, only the Madison County, Iowa, bridges were measured to verify the accuracy. To conduct this task, digital photos of each bridge were taken as soon as the project team arrived. These photos were then printed on a portable printer and used to record the accurate dimensions measured with traditional tape mea-sures (1/16-in. accuracy).
Each bridge was then scanned using the laser scanner at up to 20+ locations. The raw scan data were processed into point cloud data. The locations measured using traditional measuring equipment on the photographs were then located in the digital files and the digital dimensions noted. Based on these data, a comparison between the actual and digital measurements was taken. The comparison data are reported for each of the four Madison County bridges in the follow-ing sections. Fourteen to sixteen locations were samples for each bridge with a very small error noted. This mean error of the 14–16 measurements ranged from 0.04–0.08 in. (1.01–2.02 mm), within the rated accuracy of 1/4 in. at 150 ft.
Imes Covered Bridge, Madison County, Iowa
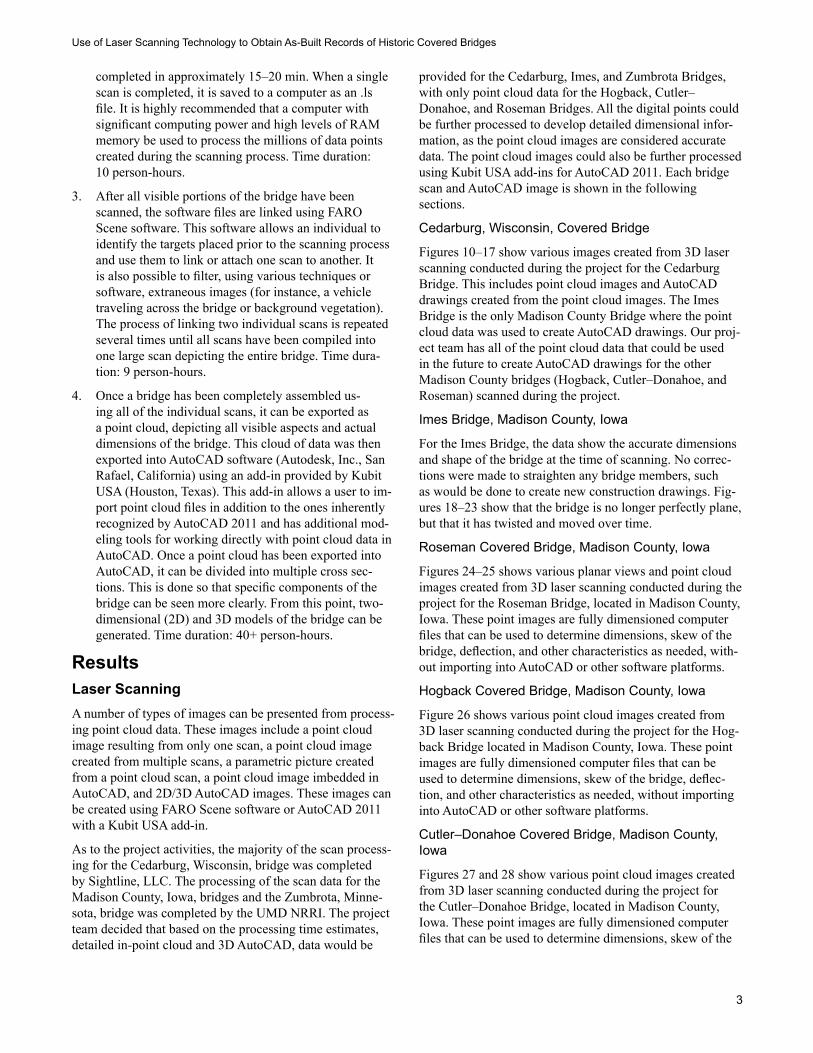
Figure 39 shows the locations on the bridges where the actual measurements were collected using traditional tape measures to a resolution of 1/16 in. Once the point cloud was developed from the multiple laser scans of a bridge, the data were extracted from the digital file and simply compared for accuracy. Table 2 shows the results of this comparison, showing that laser scanning is a very accurate means of determining dimensions for use in creating as-built documentation.
Hogback Covered Bridge, Madison County, Iowa
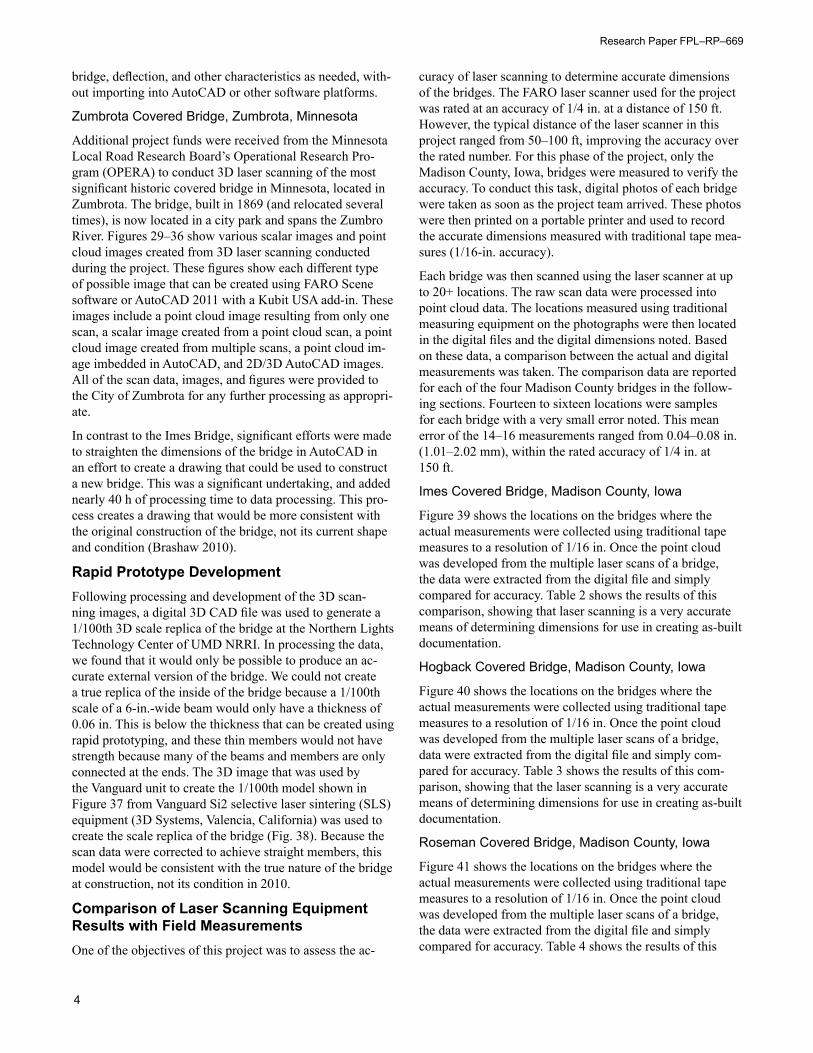
Figure 40 shows the locations on the bridges where the actual measurements were collected using traditional tape measures to a resolution of 1/16 in. Once the point cloud was developed from the multiple laser scans of a bridge, data were extracted from the digital file and simply com-pared for accuracy. Table 3 shows the results of this com-parison, showing that the laser scanning is a very accurate means of determining dimensions for use in creating as-built documentation.
Roseman Covered Bridge, Madison County, Iowa
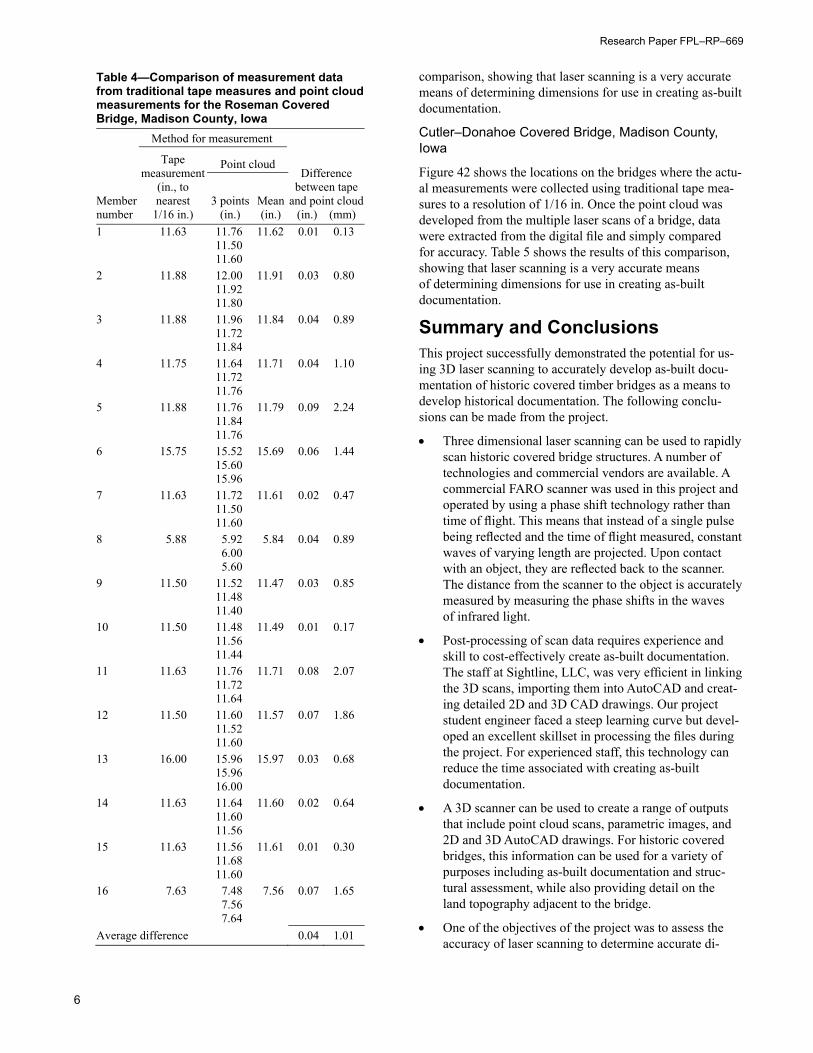
Figure 41 shows the locations on the bridges where the actual measurements were collected using traditional tape measures to a resolution of 1/16 in. Once the point cloud was developed from the multiple laser scans of a bridge, the data were extracted from the digital file and simply compared for accuracy. Table 4 shows the results of this
Use of Laser Scanning Technology to Obtain As-Built Records of Historic Covered Bridges
5
Table 2—Comparison of measurement data from traditional tape measures and point cloud measurements for the Imes Covered Bridge, Madison County, Iowa
Member number
Method for measurement
Tapemeasurement
(in., to nearest
1/16 in.)
Point cloud Difference
between tapeand point cloud
(in.) (mm) 3 points
(in.) Mean(in.)
1 2.88 2.68 2.73 0.15 3.77 2.76 2.74 2 2.88 2.84 2.77 0.10 2.58 2.84 2.64 3 11.25 11.40 11.21 0.04 0.93 11.20 11.04 4 5.50 5.24 5.43 0.07 1.86 5.40 5.64 5 11.50 11.32 11.30 0.20 5.08 11.20 11.38 6 11.50 11.40 11.48 0.02 0.51 11.48 11.56 7 11.75 11.72 11.73 0.02 0.59 11.84 11.62 8 11.63 11.52 11.55 0.08 1.99 11.52 11.60 9 11.75 11.76 11.79 0.04 0.93 11.80 11.80 10 12.13 12.24 12.03 0.10 2.50 12.04 11.80 11 1.75 1.76 1.69 0.06 1.44 1.68 1.64 12 11.88 11.84 11.79 0.09 2.24 11.72 11.80 13 11.63 11.84 11.60 0.03 0.64 11.44 11.52 14 11.75 11.88 11.80 0.05 1.27 11.72 11.80 15 12.00 11.96 11.95 0.05 1.35 12.08 11.80 16 1.88 1.80 1.83 0.05 1.23 1.80 1.88 Average difference 0.07 1.83
Table 3—Comparison of measurement data from traditional tape measures and point cloud measurements for the Hogback Covered Bridge, Madison County, Iowa
Member number
Method for measurement
Tapemeasurement
(in., to nearest
1/16 in.)
Point cloud Difference
between tapeand point cloud
(in.) (mm) 3 points
(in.) Mean(in.)
1 8.00 7.96 8.03 0.03 0.68 8.04 8.08 2 11.75 11.84 11.72 0.03 0.76 11.76 11.56 3 12.00 12.16 12.07 0.07 1.69 12.04 12.00 4 15.75 15.96 15.77 0.02 0.59 15.68 15.68 5 11.38 11.20 11.33 0.04 1.06 11.28 11.52 6 11.88 11.96 11.81 0.06 1.57 11.80 11.68 7 11.63 11.60 11.59 0.04 0.97 11.48 11.68 8 14.88 14.96 14.88 0.01 0.13 14.88 14.80 9 11.38 11.20 11.28 0.09 2.41 11.40 11.24 10 15.88 16.00 15.88 0.01 0.13 15.76 15.88 11 11.50 11.40 11.51 0.01 0.17 11.48 11.64 12 11.75 11.64 11.69 0.06 1.44 11.80 11.64 13 12.00 11.84 11.89 0.11 2.71 11.84 12.00 14 12.00 11.72 11.87 0.13 3.39 11.84 12.04 Average difference 0.05 1.26
Research Paper FPL–RP–669
6
comparison, showing that laser scanning is a very accurate means of determining dimensions for use in creating as-built documentation.
Cutler–Donahoe Covered Bridge, Madison County, Iowa
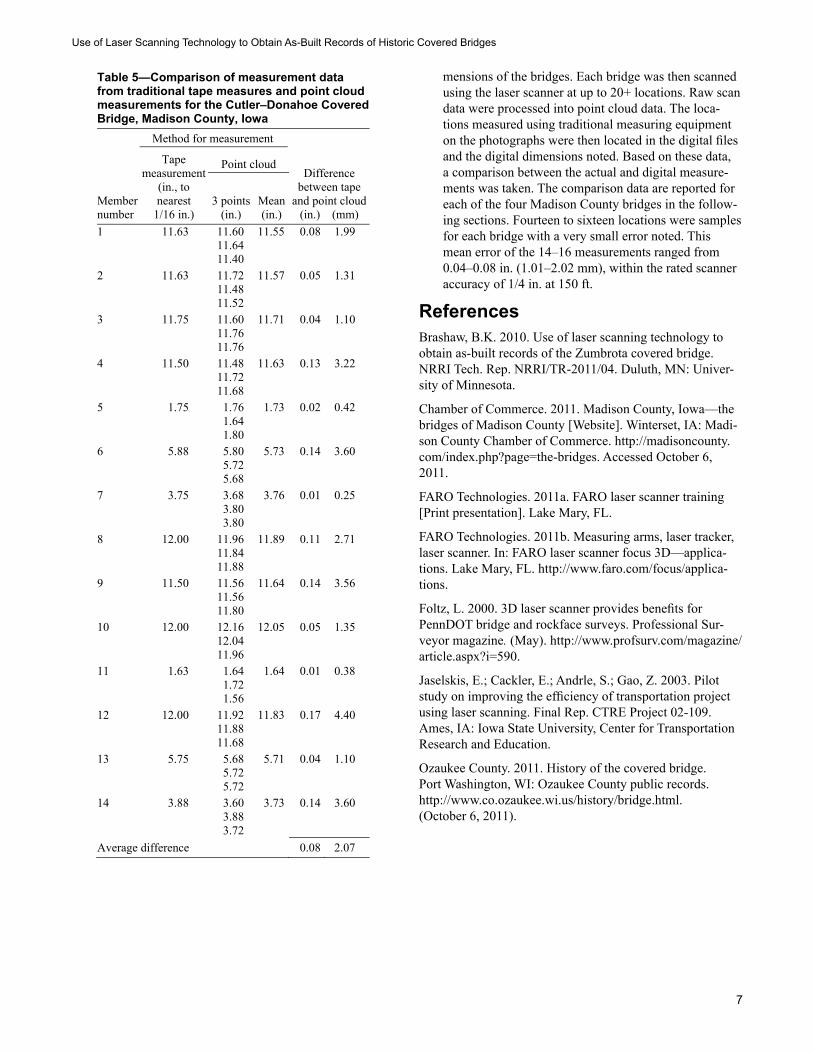
Figure 42 shows the locations on the bridges where the actu-al measurements were collected using traditional tape mea-sures to a resolution of 1/16 in. Once the point cloud was developed from the multiple laser scans of a bridge, data were extracted from the digital file and simply compared for accuracy. Table 5 shows the results of this comparison, showing that laser scanning is a very accurate means of determining dimensions for use in creating as-built documentation.
Summary and ConclusionsThis project successfully demonstrated the potential for us-ing 3D laser scanning to accurately develop as-built docu-mentation of historic covered timber bridges as a means to develop historical documentation. The following conclu-sions can be made from the project.
• Three dimensional laser scanning can be used to rapidly scan historic covered bridge structures. A number of technologies and commercial vendors are available. A commercial FARO scanner was used in this project and operated by using a phase shift technology rather than time of flight. This means that instead of a single pulse being reflected and the time of flight measured, constant waves of varying length are projected. Upon contact with an object, they are reflected back to the scanner. The distance from the scanner to the object is accurately measured by measuring the phase shifts in the waves of infrared light.
• Post-processing of scan data requires experience and skill to cost-effectively create as-built documentation. The staff at Sightline, LLC, was very efficient in linking the 3D scans, importing them into AutoCAD and creat-ing detailed 2D and 3D CAD drawings. Our project student engineer faced a steep learning curve but devel-oped an excellent skillset in processing the files during the project. For experienced staff, this technology can reduce the time associated with creating as-built documentation.
• A 3D scanner can be used to create a range of outputs that include point cloud scans, parametric images, and 2D and 3D AutoCAD drawings. For historic covered bridges, this information can be used for a variety of purposes including as-built documentation and struc-tural assessment, while also providing detail on the land topography adjacent to the bridge.
• One of the objectives of the project was to assess the accuracy of laser scanning to determine accurate di-
Table 4—Comparison of measurement data from traditional tape measures and point cloud measurements for the Roseman Covered Bridge, Madison County, Iowa
Member number
Method for measurement
Tapemeasurement
(in., to nearest
1/16 in.)
Point cloud Difference
between tapeand point cloud
(in.) (mm) 3 points
(in.) Mean(in.)
1 11.63 11.76 11.62 0.01 0.13 11.50 11.60 2 11.88 12.00 11.91 0.03 0.80 11.92 11.80 3 11.88 11.96 11.84 0.04 0.89 11.72 11.84 4 11.75 11.64 11.71 0.04 1.10 11.72 11.76 5 11.88 11.76 11.79 0.09 2.24 11.84 11.76 6 15.75 15.52 15.69 0.06 1.44 15.60 15.96 7 11.63 11.72 11.61 0.02 0.47 11.50 11.60 8 5.88 5.92 5.84 0.04 0.89 6.00 5.60 9 11.50 11.52 11.47 0.03 0.85 11.48 11.40 10 11.50 11.48 11.49 0.01 0.17 11.56 11.44 11 11.63 11.76 11.71 0.08 2.07 11.72 11.64 12 11.50 11.60 11.57 0.07 1.86 11.52 11.60 13 16.00 15.96 15.97 0.03 0.68 15.96 16.00 14 11.63 11.64 11.60 0.02 0.64 11.60 11.56 15 11.63 11.56 11.61 0.01 0.30 11.68 11.60 16 7.63 7.48 7.56 0.07 1.65 7.56 7.64 Average difference 0.04 1.01
Use of Laser Scanning Technology to Obtain As-Built Records of Historic Covered Bridges
7
mensions of the bridges. Each bridge was then scanned using the laser scanner at up to 20+ locations. Raw scan data were processed into point cloud data. The loca-tions measured using traditional measuring equipment on the photographs were then located in the digital files and the digital dimensions noted. Based on these data, a comparison between the actual and digital measure-ments was taken. The comparison data are reported for each of the four Madison County bridges in the follow-ing sections. Fourteen to sixteen locations were samples for each bridge with a very small error noted. This mean error of the 14–16 measurements ranged from 0.04–0.08 in. (1.01–2.02 mm), within the rated scanner accuracy of 1/4 in. at 150 ft.
ReferencesBrashaw, B.K. 2010. Use of laser scanning technology to obtain as-built records of the Zumbrota covered bridge. NRRI Tech. Rep. NRRI/TR-2011/04. Duluth, MN: Univer-sity of Minnesota.
Chamber of Commerce. 2011. Madison County, Iowa—the bridges of Madison County [Website]. Winterset, IA: Madi-son County Chamber of Commerce. http://madisoncounty.com/index.php?page=the-bridges. Accessed October 6, 2011.
FARO Technologies. 2011a. FARO laser scanner training [Print presentation]. Lake Mary, FL.
FARO Technologies. 2011b. Measuring arms, laser tracker, laser scanner. In: FARO laser scanner focus 3D—applica-tions. Lake Mary, FL. http://www.faro.com/focus/applica-tions.
Foltz, L. 2000. 3D laser scanner provides benefits for PennDOT bridge and rockface surveys. Professional Sur-veyor magazine. (May). http://www.profsurv.com/magazine/article.aspx?i=590.
Jaselskis, E.; Cackler, E.; Andrle, S.; Gao, Z. 2003. Pilot study on improving the efficiency of transportation project using laser scanning. Final Rep. CTRE Project 02-109. Ames, IA: Iowa State University, Center for Transportation Research and Education.
Ozaukee County. 2011. History of the covered bridge. Port Washington, WI: Ozaukee County public records. http://www.co.ozaukee.wi.us/history/bridge.html. (October 6, 2011).
Table 5—Comparison of measurement data from traditional tape measures and point cloud measurements for the Cutler–Donahoe Covered Bridge, Madison County, Iowa
Member number
Method for measurement
Tapemeasurement
(in., to nearest
1/16 in.)
Point cloud Difference
between tapeand point cloud
(in.) (mm) 3 points
(in.) Mean(in.)
1 11.63 11.60 11.55 0.08 1.99 11.64 11.40 2 11.63 11.72 11.57 0.05 1.31 11.48 11.52 3 11.75 11.60 11.71 0.04 1.10 11.76 11.76 4 11.50 11.48 11.63 0.13 3.22 11.72 11.68 5 1.75 1.76 1.73 0.02 0.42 1.64 1.80 6 5.88 5.80 5.73 0.14 3.60 5.72 5.68 7 3.75 3.68 3.76 0.01 0.25 3.80 3.80 8 12.00 11.96 11.89 0.11 2.71 11.84 11.88 9 11.50 11.56 11.64 0.14 3.56 11.56 11.80 10 12.00 12.16 12.05 0.05 1.35 12.04 11.96 11 1.63 1.64 1.64 0.01 0.38 1.72 1.56 12 12.00 11.92 11.83 0.17 4.40 11.88 11.68 13 5.75 5.68 5.71 0.04 1.10 5.72 5.72 14 3.88 3.60 3.73 0.14 3.60 3.88 3.72 Average difference 0.08 2.07
Research Paper FPL–RP–669
8
Figure 1. Photograph of the Cedarburg Covered Bridge (Cedarburg, Wisconsin), circa 1934. From the Library of Congress.
Figure 2. Recent (2010) photograph of the Cedarburg Covered Bridge.
Figure 3. Roseman Bridge, Madison County, Iowa (2010).
Figure 4. Imes Bridge, Madison County, Iowa (2010).
Figure 5. Hogback Bridge, Madison County, Iowa (2010).
Figure 6. Cutler–Donahoe Bridge, Madison County, Iowa (2010).
Use of Laser Scanning Technology to Obtain As-Built Records of Historic Covered Bridges
9
Figure 7. Zumbrota Bridge, Zumbrota, Minnesota (2011).
(a)
(b)
Figure 8. Zumbrota Bridge on September 23, 2010, during flooding on the Zumbro River. (a. Photo courtesy of kstp.com, b. Photo courtesy of fox9.com.).
Figure 9. A FARO laser scanner used to scan a historic covered bridge.
Figure 10. Point cloud image of the Cedarburg Bridge (SightLine, LLC).
Figure 11. 3D AutoCAD image of the Cedarburg Bridge embedded in point cloud data (SightLine, LLC).
Research Paper FPL–RP–669
10
Figure 12. Dimensioned 2D AutoCAD® image of the Cedarburg Bridge (SightLine, LLC).
Figure 13. Dimensioned point cloud image of bridge entry on Cedarburg Bridge (SightLine, LLC).
Figure 14. CAD image of the Cedarburg Bridge (SightLine, LLC).
PRO
DU
CED
BY
AN
AU
TOD
ESK
ED
UC
ATI
ON
AL
PRO
DU
CT
PRODUCED BY AN AUTODESK EDUCATIONAL PRODUCT
PRO
DU
CED
BY A
N A
UTO
DESK
EDU
CA
TION
AL PR
OD
UC
T
PRODUCED BY AN AUTODESK EDUCATIONAL PRODUCT
Figure 15. CAD dimensions of ceiling structure of the Cedarburg Bridge (UMD NRRI).
PRO
DU
CED
BY
AN
AU
TOD
ESK
ED
UC
ATI
ON
AL
PRO
DU
CT
PRODUCED BY AN AUTODESK EDUCATIONAL PRODUCT
PRO
DU
CED
BY A
N A
UTO
DESK
EDU
CA
TION
AL PR
OD
UC
T
PRODUCED BY AN AUTODESK EDUCATIONAL PRODUCT
Figure 16. CAD drawing and dimensions of front entrance of the Cedarburg Bridge (UMD NRRI).
PRO
DU
CED
BY
AN
AU
TOD
ESK
ED
UC
ATI
ON
AL
PRO
DU
CT
PRODUCED BY AN AUTODESK EDUCATIONAL PRODUCT
PRO
DU
CED
BY A
N A
UTO
DESK
EDU
CA
TION
AL PR
OD
UC
T
PRODUCED BY AN AUTODESK EDUCATIONAL PRODUCT
PRO
DU
CED
BY
AN
AU
TOD
ESK
ED
UC
ATI
ON
AL
PRO
DU
CT
PRODUCED BY AN AUTODESK EDUCATIONAL PRODUCT
PRO
DU
CED
BY A
N A
UTO
DESK
EDU
CA
TION
AL PR
OD
UC
T
PRODUCED BY AN AUTODESK EDUCATIONAL PRODUCT
Figure 17. CAD drawing and dimensions of side wall and trusses of the Cedarburg Bridge (UMD NRRI).
Use of Laser Scanning Technology to Obtain As-Built Records of Historic Covered Bridges
11
(a)
(b)
(c)
Figure 18. Point cloud images of the Imes Bridge (UMD NRRI).
ImesNatural Resources Research Institute
IsometericView
PRO
DU
CED
BY
AN
AU
TOD
ESK
ED
UC
ATI
ON
AL
PRO
DU
CT
PRODUCED BY AN AUTODESK EDUCATIONAL PRODUCT
PRO
DU
CED
BY A
N A
UTO
DESK
EDU
CA
TION
AL PR
OD
UC
T
PRODUCED BY AN AUTODESK EDUCATIONAL PRODUCT
Figure 19. Isometric 3D AutoCAD image of the Imes Bridge (NRRI).
PRO
DU
CED
BY
AN
AU
TOD
ESK
ED
UC
ATI
ON
AL
PRO
DU
CT
PRODUCED BY AN AUTODESK EDUCATIONAL PRODUCT
PRO
DU
CED
BY A
N A
UTO
DESK
EDU
CA
TION
AL PR
OD
UC
T
PRODUCED BY AN AUTODESK EDUCATIONAL PRODUCT
Figure 20. Dimensioned 3D AutoCAD image of the Imes Bridge showing the existing rotation and out-of-plane nature of the bridge (NRRI).
ImesNatural Resources Research Institute
Side View
11'-414"
91'-034"
82'-412"
57'-414"
1'11'-11"
10'
4'-334"
4'-314"
15'-012"
2'-114"
9"
20'-9"
PRO
DU
CED
BY
AN
AU
TOD
ESK
ED
UC
ATI
ON
AL
PRO
DU
CT
PRODUCED BY AN AUTODESK EDUCATIONAL PRODUCT
PRO
DU
CED
BY A
N A
UTO
DESK
EDU
CA
TION
AL PR
OD
UC
T
PRODUCED BY AN AUTODESK EDUCATIONAL PRODUCT
Figure 21. Dimensioned 3D AutoCAD side view image of the Imes Bridge (NRRI).

Research Paper FPL–RP–669
12
PRO
DU
CED
BY
AN
AU
TOD
ESK
ED
UC
ATI
ON
AL
PRO
DU
CT
PRODUCED BY AN AUTODESK EDUCATIONAL PRODUCT
PRO
DU
CED
BY A
N A
UTO
DESK
EDU
CA
TION
AL PR
OD
UC
T
PRODUCED BY AN AUTODESK EDUCATIONAL PRODUCT
PRO
DU
CED
BY
AN
AU
TOD
ESK
ED
UC
ATI
ON
AL
PRO
DU
CT
PRODUCED BY AN AUTODESK EDUCATIONAL PRODUCT
PRO
DU
CED
BY A
N A
UTO
DESK
EDU
CA
TION
AL PR
OD
UC
T
PRODUCED BY AN AUTODESK EDUCATIONAL PRODUCT
Figure 22. Dimensioned 3D AutoCAD internal side wall image of the Imes Bridge (NRRI).
PRO
DU
CED
BY
AN
AU
TOD
ESK
ED
UC
ATI
ON
AL
PRO
DU
CT
PRODUCED BY AN AUTODESK EDUCATIONAL PRODUCT
PRO
DU
CED
BY A
N A
UTO
DESK
EDU
CA
TION
AL PR
OD
UC
T
PRODUCED BY AN AUTODESK EDUCATIONAL PRODUCT
Figure 23. Dimensioned 3D AutoCAD ceiling image of the Imes Bridge (NRRI).
Figure 24. Planar views of a single laser scan of the Roseman Bridge (NRRI).
(a)
(b)
Figure 25. Point cloud images of the Roseman Bridge (NRRI).
(a)
(b)

Use of Laser Scanning Technology to Obtain As-Built Records of Historic Covered Bridges
13
Figure 26. Point cloud image of the Hogback Bridge (NRRI).
(a)
(b)
(c)
(d)
Figure 27. Point cloud images of the Cutler–Donahoe Bridge (NRRI).
Figure 28. Point cloud image (enhanced with clear view software setting) of the Cutler–Donahoe Bridge (UMD NRRI).
(a)
(b)
Research Paper FPL–RP–669
14
Figure 29. First scalar image of the outside of the Zumbrota Bridge Point Cloud.
Figure 30. Scalar image of the outside of the Zumbrota Bridge created from a single exterior scan processed with Faro Scene software.
Figure 31. Scalar image of the inside of the Zumbrota Bridge created from a single interior scan processed with Faro Scene software.
(a)
(b)
(a)
(b)
Figure 32. Point cloud images of the Zumbrota Bridge created from multiple scans and linked together with Faro Scene software.
Use of Laser Scanning Technology to Obtain As-Built Records of Historic Covered Bridges
15
Figure 33. Point cloud images of the Zumbrota Bridge created from multiple scans and linked together with Faro Scene software, imbedded into AutoCAD with a Kubit USA add-in.
Figure 34. An AutoCAD 3D image of the Zumbrota Bridge created from scanning data.
(a)
(b)
(a)
(b)
(c)
Figure 35. AutoCAD 2D images of the Zumbrota Bridge created from scanning data.
Research Paper FPL–RP–669
16
(a)
(b)
(c)
(d)
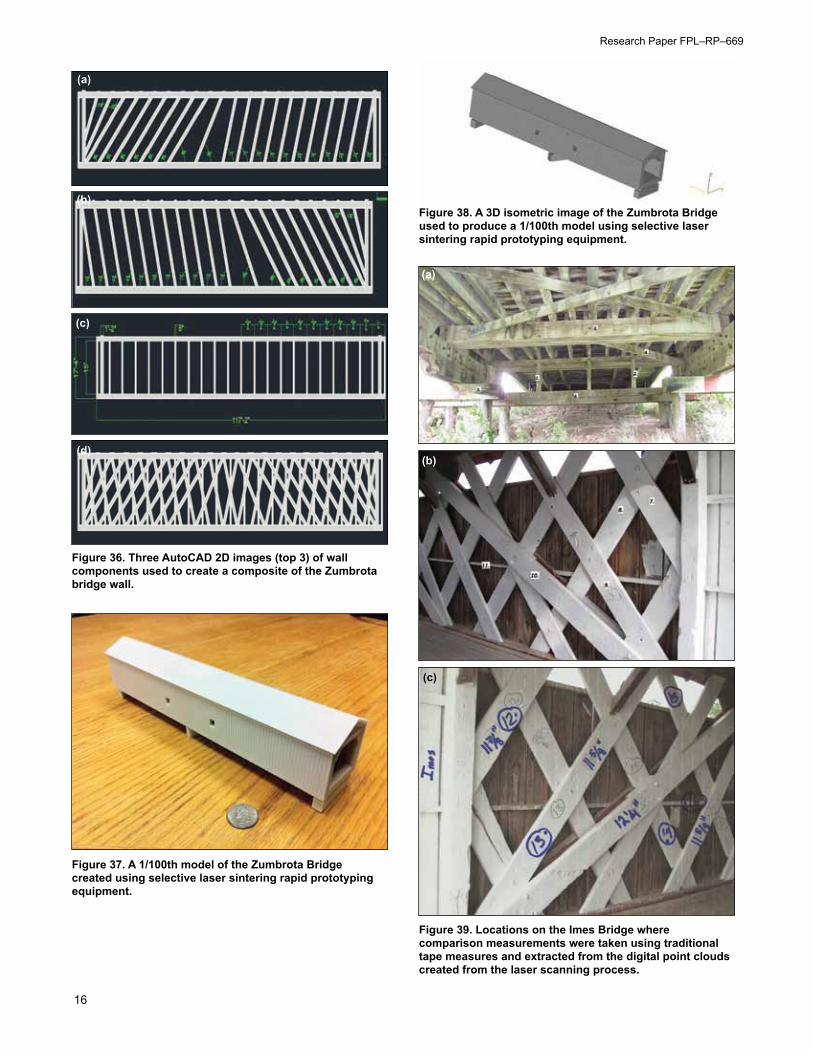
Figure 36. Three AutoCAD 2D images (top 3) of wall components used to create a composite of the Zumbrota bridge wall.
Figure 37. A 1/100th model of the Zumbrota Bridge created using selective laser sintering rapid prototyping equipment.
Figure 38. A 3D isometric image of the Zumbrota Bridge used to produce a 1/100th model using selective laser sintering rapid prototyping equipment.
Figure 39. Locations on the Imes Bridge where comparison measurements were taken using traditional tape measures and extracted from the digital point clouds created from the laser scanning process.
(a)
(b)
(c)
Use of Laser Scanning Technology to Obtain As-Built Records of Historic Covered Bridges
17
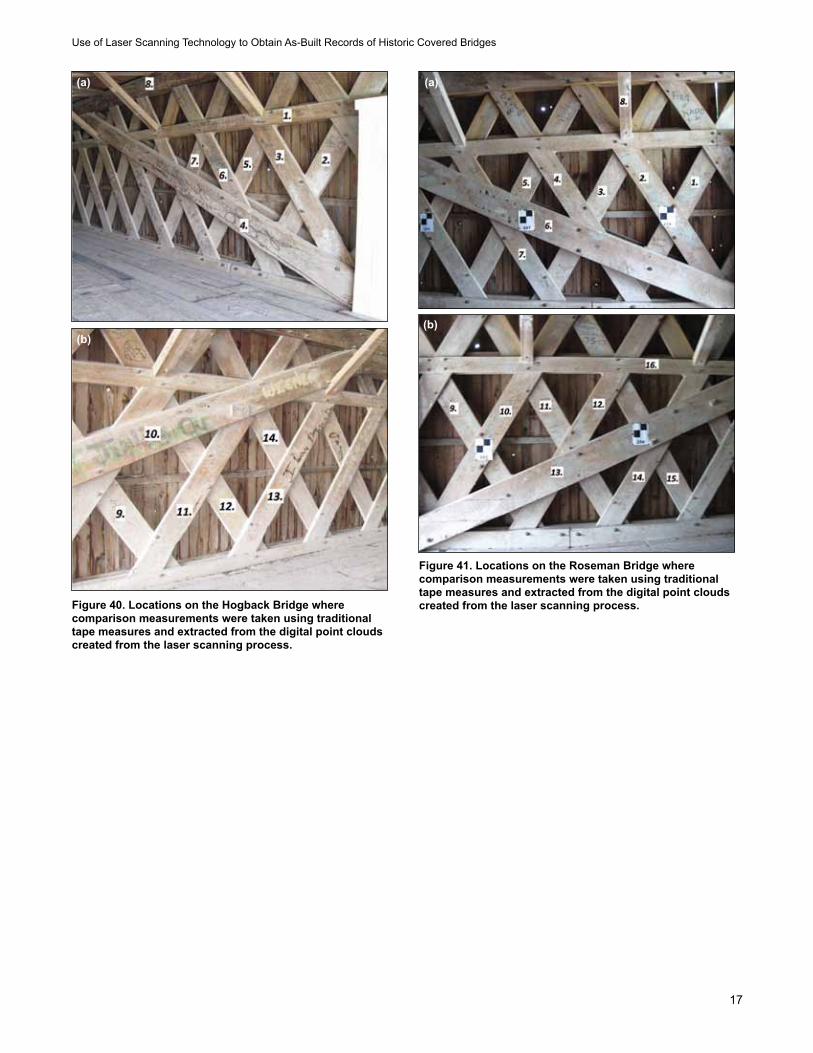
Figure 40. Locations on the Hogback Bridge where comparison measurements were taken using traditional tape measures and extracted from the digital point clouds created from the laser scanning process.
(a)
(b)
(a)
(b)
Figure 41. Locations on the Roseman Bridge where comparison measurements were taken using traditional tape measures and extracted from the digital point clouds created from the laser scanning process.
Research Paper FPL–RP–669
18
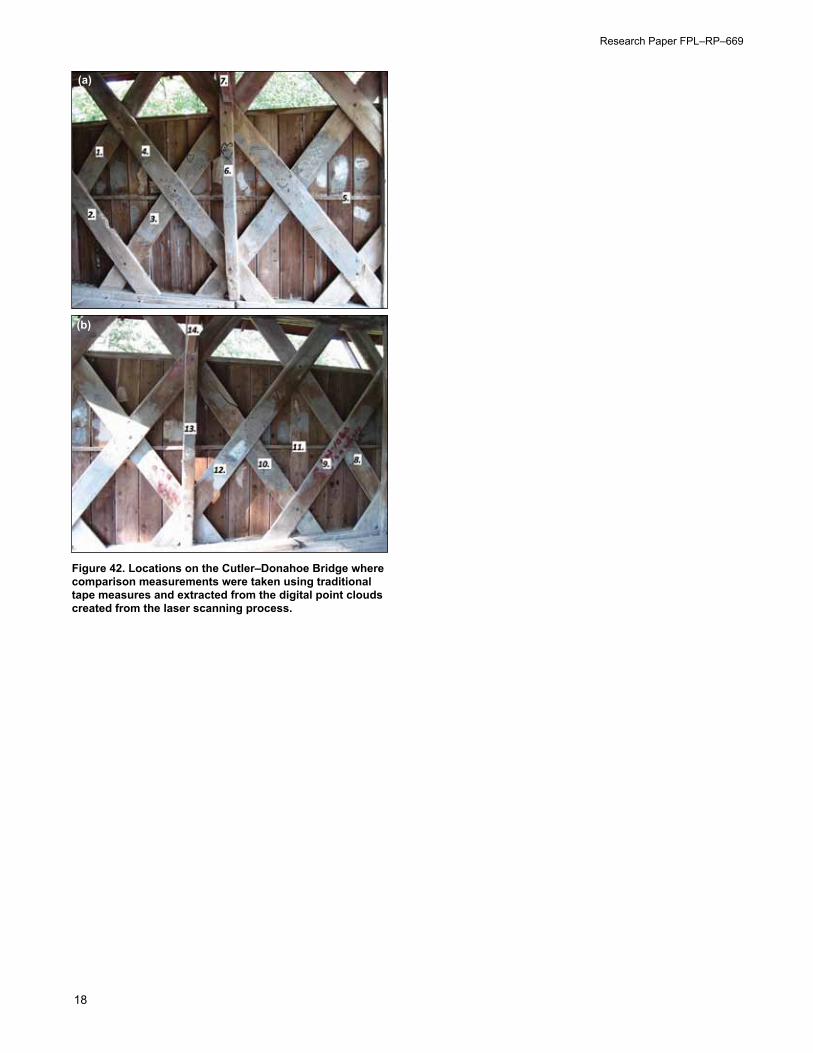
Figure 42. Locations on the Cutler–Donahoe Bridge where comparison measurements were taken using traditional tape measures and extracted from the digital point clouds created from the laser scanning process.
(a)
(b)