Embed Size (px)
Citation preview
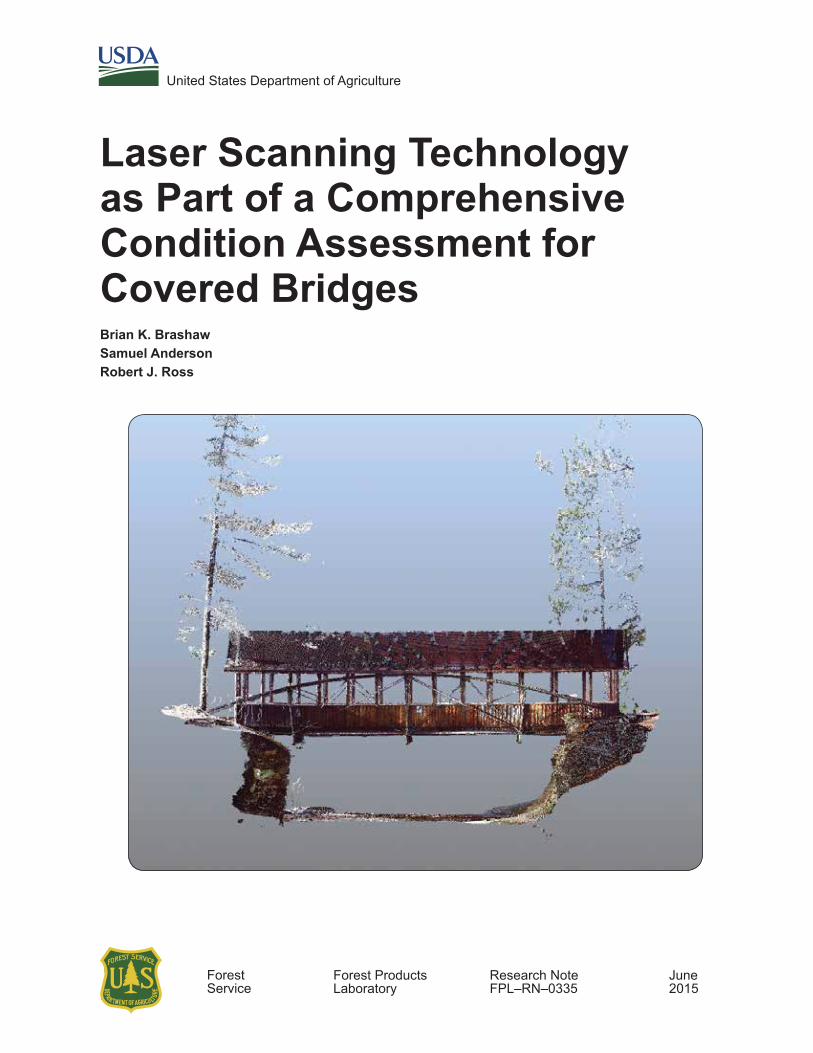
Laser Scanning Technology as Part of a Comprehensive Condition Assessment for Covered BridgesBrian K. BrashawSamuel AndersonRobert J. Ross
Research NoteFPL–RN–0335
United States Department of Agriculture
Forest Service
Forest ProductsLaboratory
June2015
June 2015
Brashaw, Brian K.; Anderson, Samuel; Ross, Robert J. 2015. Laser scan-ning technology as part of a comprehensive condition assessment for cov-ered bridges. Research Note FPL-RN-0335. Madison, WI: U.S. Department of Agriculture, Forest Service, Forest Products Laboratory. 10 p.
A limited number of free copies of this publication are available to the public from the Forest Products Laboratory, One Gifford Pinchot Drive, Madison, WI 53726–2398. This publication is also available online at www.fpl.fs.fed.us. Laboratory publications are sent to hundreds of libraries in the United States and elsewhere.
The Forest Products Laboratory is maintained in cooperation with the University of Wisconsin.
The use of trade or firm names in this publication is for reader information and does not imply endorsement by the United States Department of Agriculture (USDA) of any product or service.
The USDA prohibits discrimination in all its programs and activities on the basis of race, color, national origin, age, disability, and where applicable, sex, marital status, familial status, parental status, religion, sexual orienta-tion, genetic information, political beliefs, reprisal, or because all or a part of an individual’s income is derived from any public assistance program. (Not all prohibited bases apply to all programs.) Persons with disabilities who require alternative means for communication of program informa-tion (Braille, large print, audiotape, etc.) should contact USDA’s TARGET Center at (202) 720–2600 (voice and TDD). To file a complaint of discrimi-nation, write to USDA, Director, Office of Civil Rights, 1400 Independence Avenue, S.W., Washington, D.C. 20250–9410, or call (800) 795–3272 (voice) or (202) 720–6382 (TDD). USDA is an equal opportunity provider and employer.
ContentsIntroduction ...................................................................... 1
Initial Work on Laser Scanning with Covered Bridges ...................................................... 1
Literature Review ............................................................. 2
Demonstration Study ....................................................... 2
Amnicon Falls Covered Bridge—An Overview ......... 2
Field Testing with 3D Laser Scanning Equipment ...... 2
Processing of Data Obtained from Laser Scans ............... 3
Role of Laser Scanning Technologies in Condition Assessment of Timber Bridges and Structures ................ 8
3D Laser Scanning ........................................................... 8
Visual Inspection .............................................................. 8
Hammer Sounding and Probing ....................................... 8
Moisture Content Determination ..................................... 9
Stress-Wave Timing Techniques ...................................... 9
Resistance Microdrilling .................................................. 9
Summary .......................................................................... 9
Literature Cited .............................................................. 10
AbstractNew noncontact technologies have been developed and implemented for determining as-built condition and current dimensions for a wide variety of objects and buildings. In this study, a three-dimensional laser scanner was used to determine the dimensions and visual condition of a historic bridge in the Amnicon Falls State Park in northern Wiscon-sin. 3D scanning provides millions of data points of infor-mation about the bridge being inspected. The point clouds of data collected depict all visible aspects and actual dimen-sions of the bridge. This information can be used to deter-mine areas of the bridge that show excessive deflection, rotation or skew of the structure, damaged members, and other visual indicators that a human eye cannot easily iden-tify or quantify. This technique could be incorporated into a comprehensive inspection protocol for historic covered bridges that includes 3D laser scanning, visual inspection, hammer sounding and probing, moisture content determina-tion, stress-wave timing, and resistance microdrilling.
Keywords: Condition assessment, 3D laser scanning, timber bridge historic, covered bridges, laser scanning, condition assessment
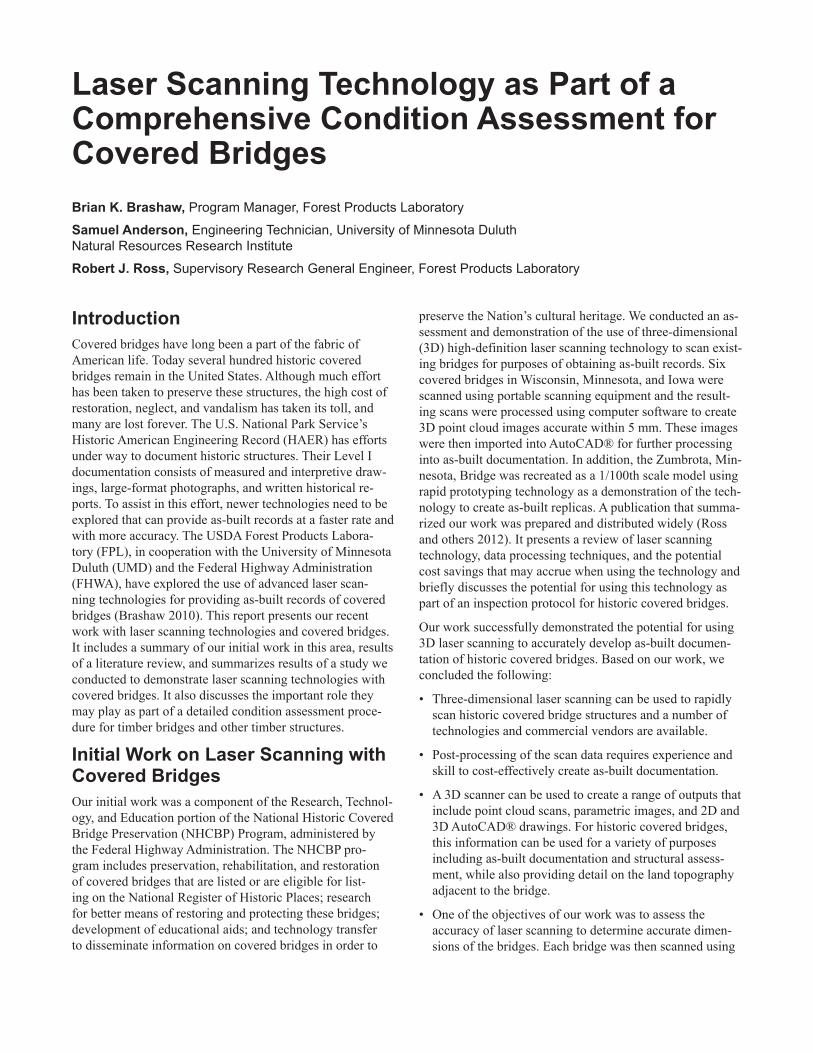
Laser Scanning Technology as Part of a Comprehensive Condition Assessment for Covered BridgesBrian K. Brashaw, Program Manager, Forest Products Laboratory
Samuel Anderson, Engineering Technician, University of Minnesota Duluth Natural Resources Research Institute
Robert J. Ross, Supervisory Research General Engineer, Forest Products Laboratory
IntroductionCovered bridges have long been a part of the fabric of American life. Today several hundred historic covered bridges remain in the United States. Although much effort has been taken to preserve these structures, the high cost of restoration, neglect, and vandalism has taken its toll, and many are lost forever. The U.S. National Park Service’s Historic American Engineering Record (HAER) has efforts under way to document historic structures. Their Level I documentation consists of measured and interpretive draw-ings, large-format photographs, and written historical re-ports. To assist in this effort, newer technologies need to be explored that can provide as-built records at a faster rate and with more accuracy. The USDA Forest Products Labora-tory (FPL), in cooperation with the University of Minnesota Duluth (UMD) and the Federal Highway Administration (FHWA), have explored the use of advanced laser scan-ning technologies for providing as-built records of covered bridges (Brashaw 2010). This report presents our recent work with laser scanning technologies and covered bridges. It includes a summary of our initial work in this area, results of a literature review, and summarizes results of a study we conducted to demonstrate laser scanning technologies with covered bridges. It also discusses the important role they may play as part of a detailed condition assessment proce-dure for timber bridges and other timber structures.
Initial Work on Laser Scanning with Covered BridgesOur initial work was a component of the Research, Technol-ogy, and Education portion of the National Historic Covered Bridge Preservation (NHCBP) Program, administered by the Federal Highway Administration. The NHCBP pro-gram includes preservation, rehabilitation, and restoration of covered bridges that are listed or are eligible for list-ing on the National Register of Historic Places; research for better means of restoring and protecting these bridges; development of educational aids; and technology transfer to disseminate information on covered bridges in order to
preserve the Nation’s cultural heritage. We conducted an as-sessment and demonstration of the use of three-dimensional (3D) high-definition laser scanning technology to scan exist-ing bridges for purposes of obtaining as-built records. Six covered bridges in Wisconsin, Minnesota, and Iowa were scanned using portable scanning equipment and the result-ing scans were processed using computer software to create 3D point cloud images accurate within 5 mm. These images were then imported into AutoCAD® for further processing into as-built documentation. In addition, the Zumbrota, Min-nesota, Bridge was recreated as a 1/100th scale model using rapid prototyping technology as a demonstration of the tech-nology to create as-built replicas. A publication that summa-rized our work was prepared and distributed widely (Ross and others 2012). It presents a review of laser scanning technology, data processing techniques, and the potential cost savings that may accrue when using the technology and briefly discusses the potential for using this technology as part of an inspection protocol for historic covered bridges.
Our work successfully demonstrated the potential for using 3D laser scanning to accurately develop as-built documen-tation of historic covered bridges. Based on our work, we concluded the following:
• Three-dimensional laser scanning can be used to rapidly scan historic covered bridge structures and a number of technologies and commercial vendors are available.
• Post-processing of the scan data requires experience and skill to cost-effectively create as-built documentation.
• A 3D scanner can be used to create a range of outputs that include point cloud scans, parametric images, and 2D and 3D AutoCAD® drawings. For historic covered bridges, this information can be used for a variety of purposes including as-built documentation and structural assess-ment, while also providing detail on the land topography adjacent to the bridge.
• One of the objectives of our work was to assess the accuracy of laser scanning to determine accurate dimen-sions of the bridges. Each bridge was then scanned using
Research Note FPL–RN–0335
2
the laser scanner at 20+ points. The raw scan data were processed into point cloud data. The locations measured using traditional measuring equipment on the photo-graphs were then located in the digital files and the digital dimensions noted. Based on these data, we compared the actual and digital measurements. The comparison data are reported for each of the four Madison County, Iowa, bridges in the following sections. Fourteen to sixteen points were sampled from each bridge with a very small error noted. This mean error of the 14–16 measurements ranged from 0.04 to 0.08 in. (1.01 to 2.02 mm) within the rated scanner accuracy of 1/4 in. at 150 ft.
Literature ReviewThree-dimensional (3D) laser scanners are instruments that record precise and accurate surface data of objects in a non-destructive manner. These instruments use an infrared beam of light to calculate and record the distance to an object, typically as data points with spatial coordinates. These data are then analyzed using various types of computer software to generate a final detailed image of coordinates and dimen-sions. 3D laser scanners have successfully been used to digi-tize objects of various sizes ranging from small diagnostic artifacts to large, complex sites of monumental architecture (FARO 2011b).
A wide number of companies manufacture various types of 3D laser scanners. Generally, these units use LiDAR (light detection and ranging) technology, where laser pulses determine the distance to an object or surface. The distance to an object is determined by using time-of-flight between transmission of a pulse and detection of the reflected signal. A point cloud of data is then collected and processed into the true shape of the object. The FARO scanner we used in this project used phase shift technology rather than time of flight. This means that instead of a single pulse being reflected and the time of flight measured, constant waves of varying length are projected. Upon contact with an object, they are reflected back to the scanner. The distance from the scanner to the object is accurately measured by measur-ing the phase shifts in the waves of infrared light (FARO 2011b).
Several publications have documented the use of 3D laser scanning on bridges. The Pennsylvania Department of Transportation (PennDOT) completed an initial study in 1999. In their study, their stated goals were to evaluate the technology for creating as-built drawings (Foltz 2000). They compared traditional and 3D scanning methods and estimated an overall time savings of 100+ man hours, which was achieved through the use of 3D scanning. Based on this assessment, PennDOT purchased two laser scanners in 2000. A second assessment of the technology was com-pleted by Jaselskis and others (2003). They showed that laser scanning could be used cost effectively for preliminary surveys to develop TIN meshes of roadway surfaces and to
measure bridge beam camber in a safer and quicker fashion compared to conventional approaches. Other potential ap-plications noted in their report included developing as-built drawings for historic structures.
The use of laser scanners to inspect bridges is well docu-mented. Jaselskis and others (2005), for example, noted the potential for using laser scanners in the bridge inspection process. Their use has been reported on, specifically on the inspection of concrete decks (Tang and others 2011) and concrete columns (Zhu and others 2010). Atasoy and others (2011) completed an assessment of a variety of visualiza-tion techniques to improve a bridge inspector’s assessment through the use of point cloud data.
Demonstration StudyThe study described in the following sections was designed to demonstrate use of laser scanning technologies in the assessment of covered bridges. The bridge selected for scan-ning and assessment was located near Superior, Wisconsin, in the Amnicon Falls State Park. Built in 1900, this bow-string pony truss bridge has a span of 55 ft.
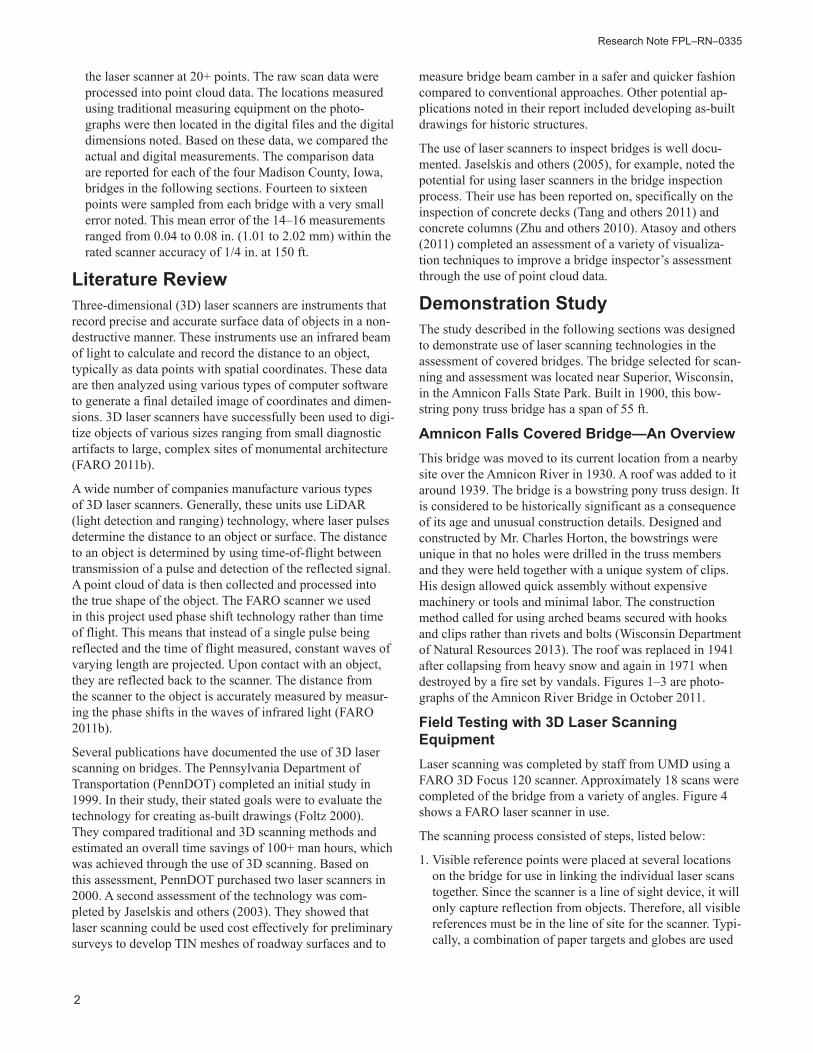
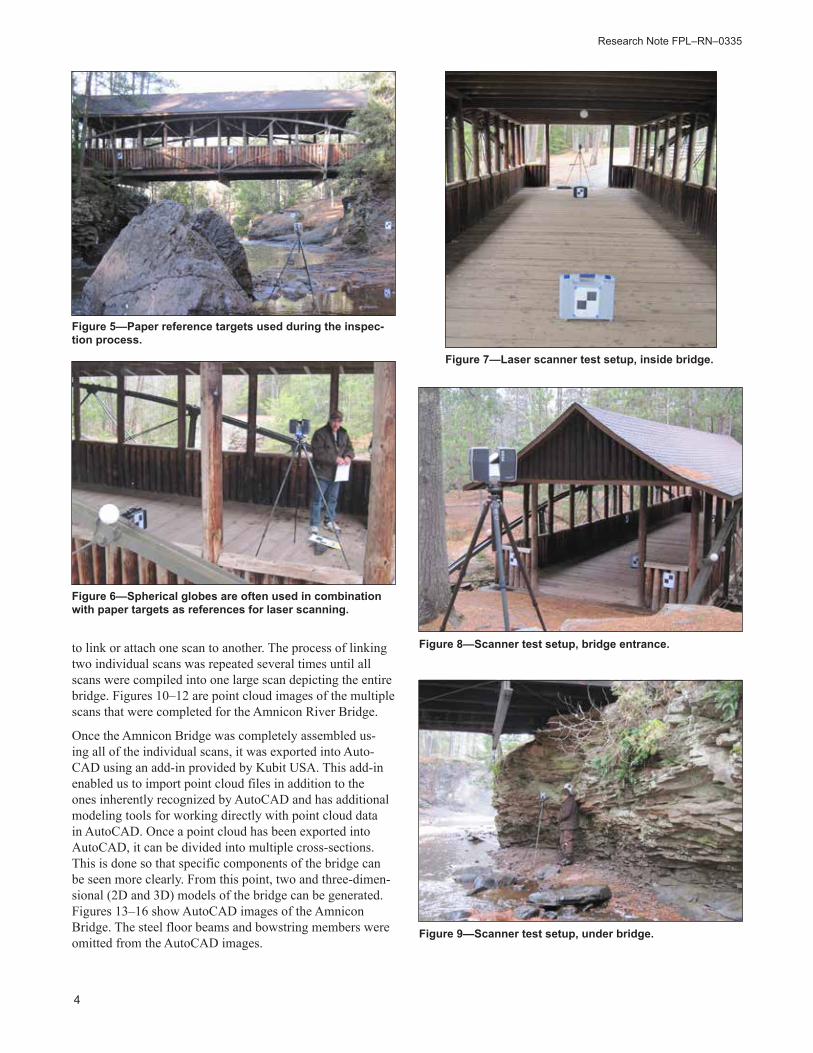
Amnicon Falls Covered Bridge—An OverviewThis bridge was moved to its current location from a nearby site over the Amnicon River in 1930. A roof was added to it around 1939. The bridge is a bowstring pony truss design. It is considered to be historically significant as a consequence of its age and unusual construction details. Designed and constructed by Mr. Charles Horton, the bowstrings were unique in that no holes were drilled in the truss members and they were held together with a unique system of clips. His design allowed quick assembly without expensive machinery or tools and minimal labor. The construction method called for using arched beams secured with hooks and clips rather than rivets and bolts (Wisconsin Department of Natural Resources 2013). The roof was replaced in 1941 after collapsing from heavy snow and again in 1971 when destroyed by a fire set by vandals. Figures 1–3 are photo-graphs of the Amnicon River Bridge in October 2011.
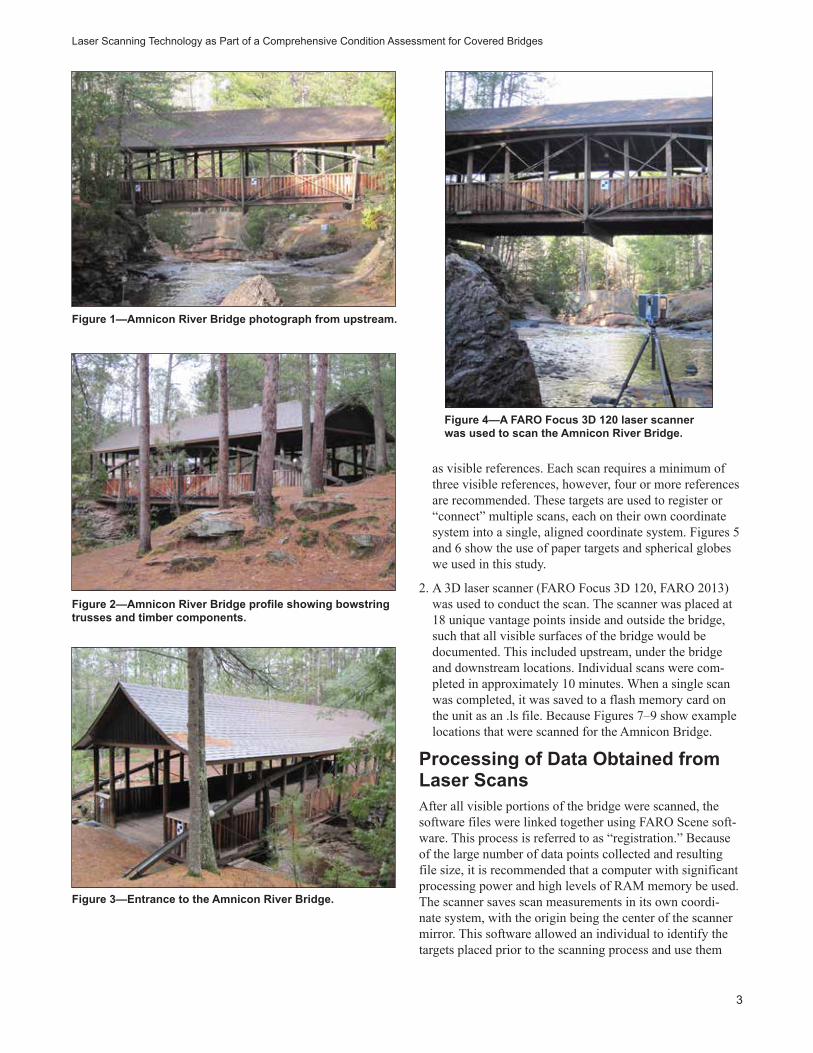
Field Testing with 3D Laser Scanning Equipment Laser scanning was completed by staff from UMD using a FARO 3D Focus 120 scanner. Approximately 18 scans were completed of the bridge from a variety of angles. Figure 4 shows a FARO laser scanner in use.
The scanning process consisted of steps, listed below:
1. Visible reference points were placed at several locations on the bridge for use in linking the individual laser scans together. Since the scanner is a line of sight device, it will only capture reflection from objects. Therefore, all visible references must be in the line of site for the scanner. Typi-cally, a combination of paper targets and globes are used
Laser Scanning Technology as Part of a Comprehensive Condition Assessment for Covered Bridges
3
as visible references. Each scan requires a minimum of three visible references, however, four or more references are recommended. These targets are used to register or “connect” multiple scans, each on their own coordinate system into a single, aligned coordinate system. Figures 5 and 6 show the use of paper targets and spherical globes we used in this study.
2. A 3D laser scanner (FARO Focus 3D 120, FARO 2013) was used to conduct the scan. The scanner was placed at 18 unique vantage points inside and outside the bridge, such that all visible surfaces of the bridge would be documented. This included upstream, under the bridge and downstream locations. Individual scans were com-pleted in approximately 10 minutes. When a single scan was completed, it was saved to a flash memory card on the unit as an .ls file. Because Figures 7–9 show example locations that were scanned for the Amnicon Bridge.
Processing of Data Obtained from Laser ScansAfter all visible portions of the bridge were scanned, the software files were linked together using FARO Scene soft-ware. This process is referred to as “registration.” Because of the large number of data points collected and resulting file size, it is recommended that a computer with significant processing power and high levels of RAM memory be used. The scanner saves scan measurements in its own coordi-nate system, with the origin being the center of the scanner mirror. This software allowed an individual to identify the targets placed prior to the scanning process and use them
Figure 1—Amnicon River Bridge photograph from upstream.
Figure 2—Amnicon River Bridge profile showing bowstring trusses and timber components.
Figure 3—Entrance to the Amnicon River Bridge.
Figure 4—A FARO Focus 3D 120 laser scanner was used to scan the Amnicon River Bridge.
Research Note FPL–RN–0335
4
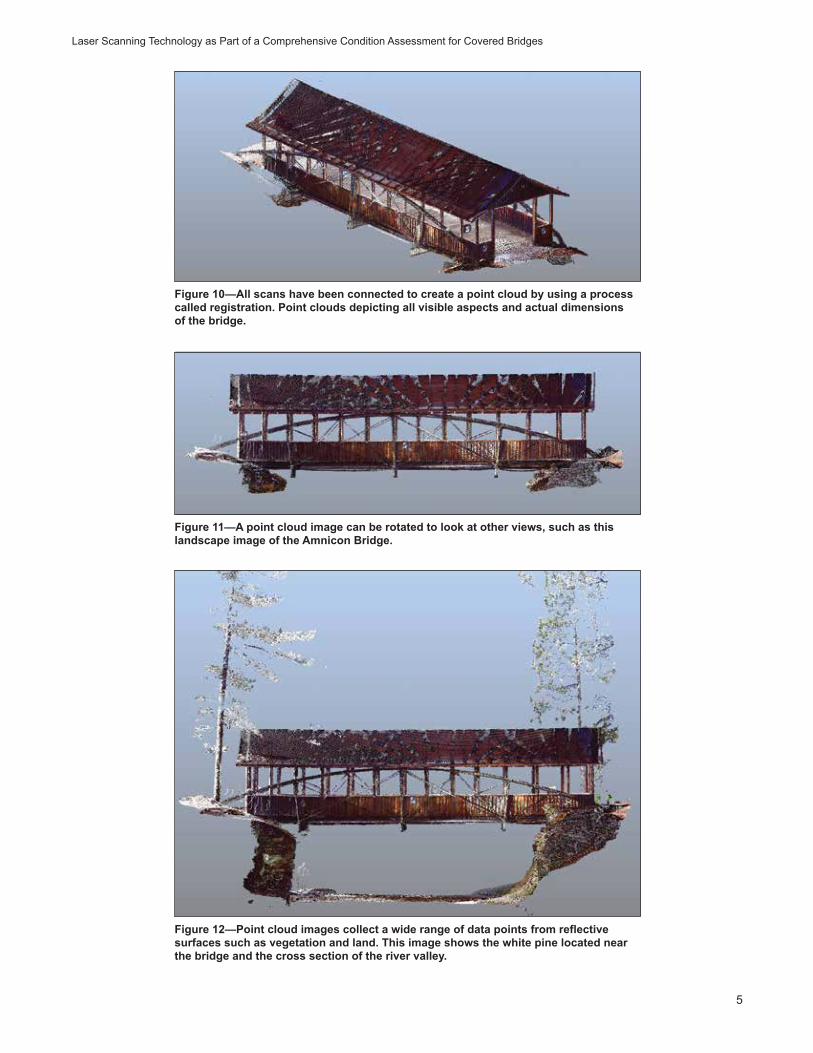
to link or attach one scan to another. The process of linking two individual scans was repeated several times until all scans were compiled into one large scan depicting the entire bridge. Figures 10–12 are point cloud images of the multiple scans that were completed for the Amnicon River Bridge.
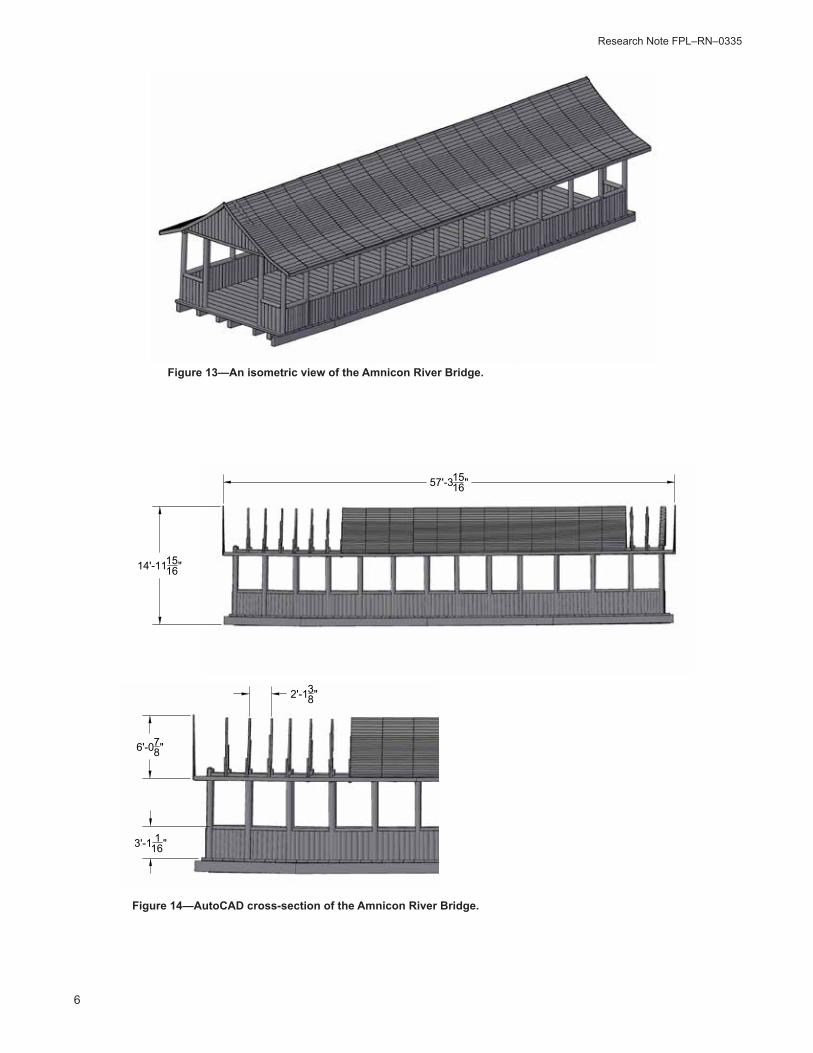
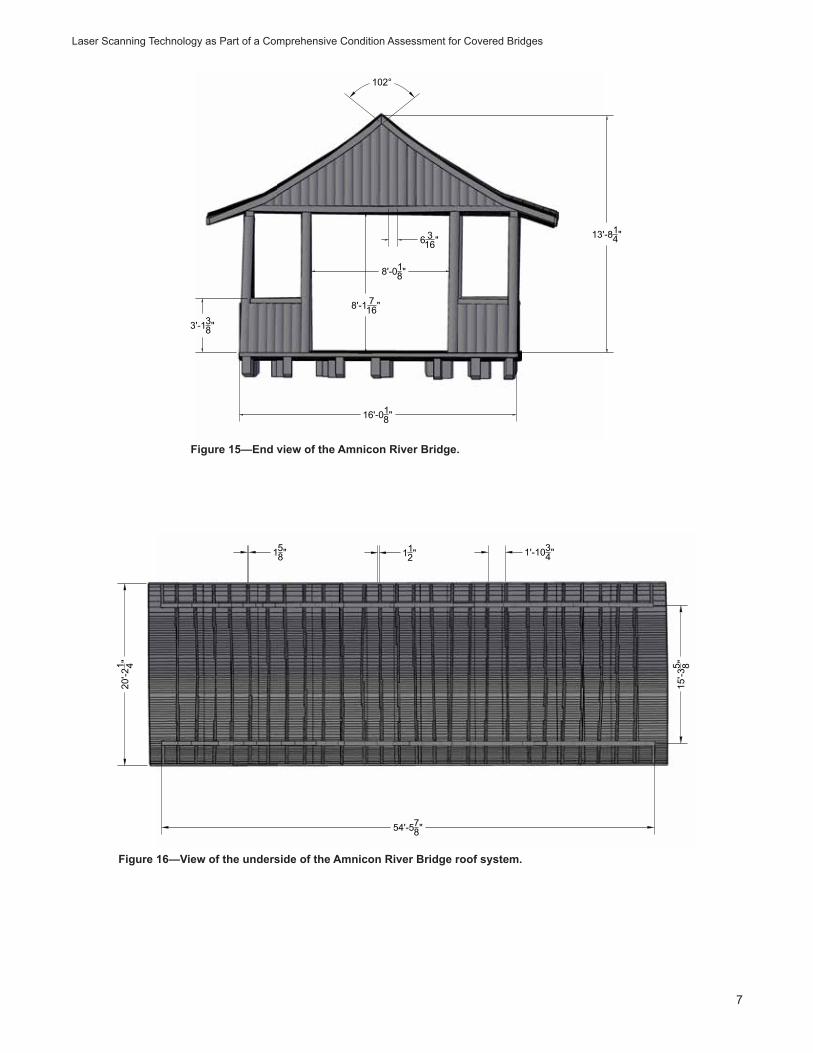
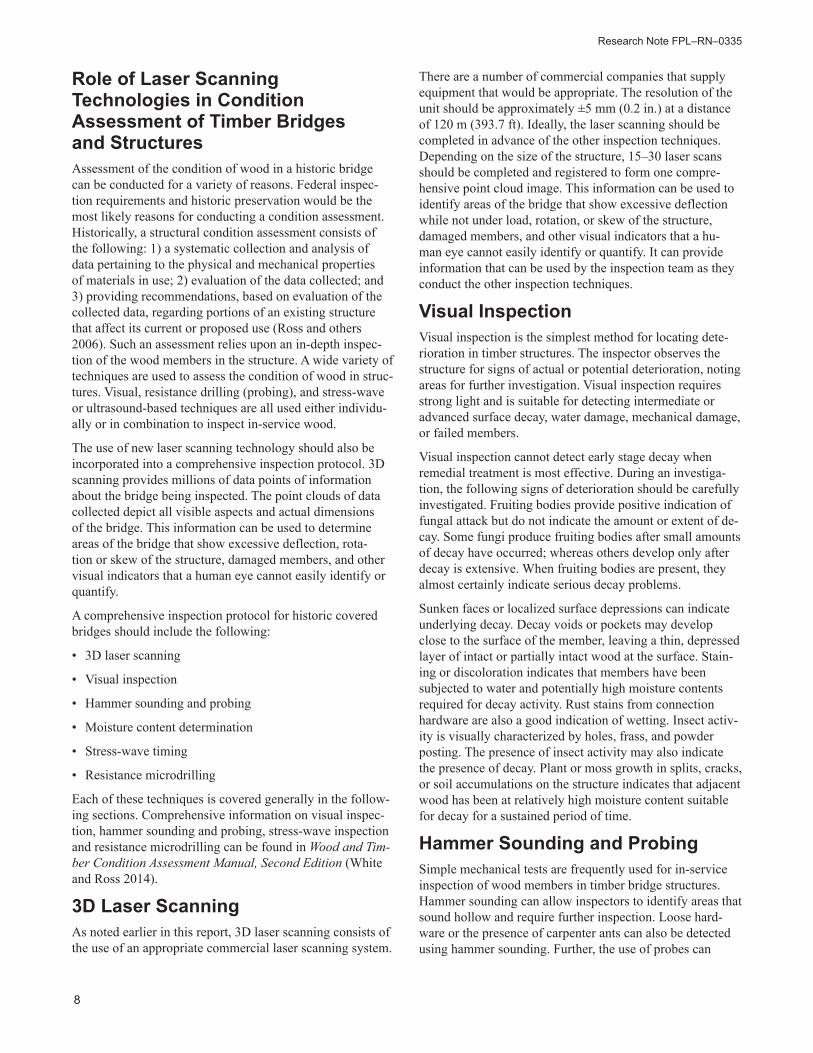
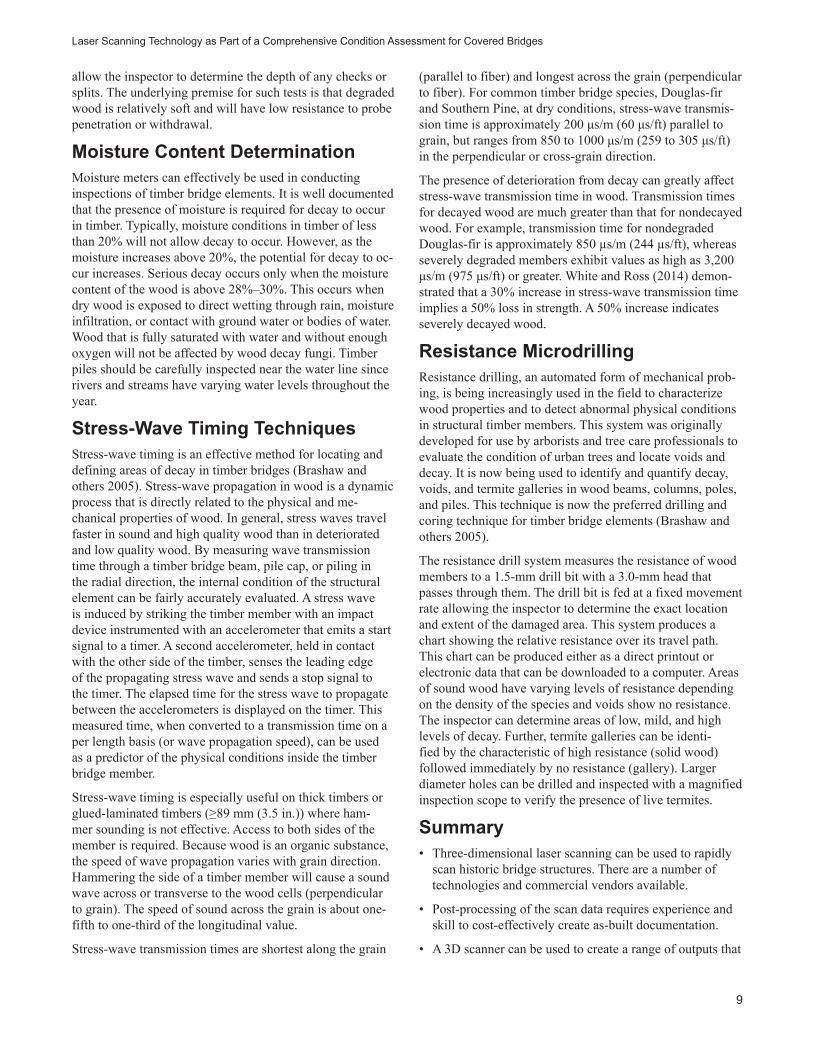
Once the Amnicon Bridge was completely assembled us-ing all of the individual scans, it was exported into Auto-CAD using an add-in provided by Kubit USA. This add-in enabled us to import point cloud files in addition to the ones inherently recognized by AutoCAD and has additional modeling tools for working directly with point cloud data in AutoCAD. Once a point cloud has been exported into AutoCAD, it can be divided into multiple cross-sections. This is done so that specific components of the bridge can be seen more clearly. From this point, two and three-dimen-sional (2D and 3D) models of the bridge can be generated. Figures 13–16 show AutoCAD images of the Amnicon Bridge. The steel floor beams and bowstring members were omitted from the AutoCAD images.
Figure 5—Paper reference targets used during the inspec-tion process.
Figure 6—Spherical globes are often used in combination with paper targets as references for laser scanning.
Figure 7—Laser scanner test setup, inside bridge.
Figure 8—Scanner test setup, bridge entrance.
Figure 9—Scanner test setup, under bridge.
Laser Scanning Technology as Part of a Comprehensive Condition Assessment for Covered Bridges
5
Figure 10—All scans have been connected to create a point cloud by using a process called registration. Point clouds depicting all visible aspects and actual dimensions of the bridge.
Figure 11—A point cloud image can be rotated to look at other views, such as this landscape image of the Amnicon Bridge.
Figure 12—Point cloud images collect a wide range of data points from reflective surfaces such as vegetation and land. This image shows the white pine located near the bridge and the cross section of the river valley.
Research Note FPL–RN–0335
6
14'-111516"
57'-31516"
6'-078"
2'-138"
3'-1 116"
PRO
DU
CED
BY
AN
AU
TOD
ESK
ED
UC
ATI
ON
AL
PRO
DU
CT
PRODUCED BY AN AUTODESK EDUCATIONAL PRODUCT
PRO
DU
CED
BY A
N A
UTO
DESK
EDU
CA
TION
AL PR
OD
UC
T
PRODUCED BY AN AUTODESK EDUCATIONAL PRODUCT
PRO
DU
CED
BY
AN
AU
TOD
ESK
ED
UC
ATI
ON
AL
PRO
DU
CT
PRODUCED BY AN AUTODESK EDUCATIONAL PRODUCT
PRO
DU
CED
BY A
N A
UTO
DESK
EDU
CA
TION
AL PR
OD
UC
T
PRODUCED BY AN AUTODESK EDUCATIONAL PRODUCT
Figure 13—An isometric view of the Amnicon River Bridge.
Figure 14—AutoCAD cross-section of the Amnicon River Bridge.
Laser Scanning Technology as Part of a Comprehensive Condition Assessment for Covered Bridges
7
13'-814"
8'-1 716"
102°
6 316"
8'-018"
16'-018"
3'-138"
PRO
DU
CED
BY
AN
AU
TOD
ESK
ED
UC
ATI
ON
AL
PRO
DU
CT
PRODUCED BY AN AUTODESK EDUCATIONAL PRODUCT
PRO
DU
CED
BY A
N A
UTO
DESK
EDU
CA
TION
AL PR
OD
UC
T
PRODUCED BY AN AUTODESK EDUCATIONAL PRODUCT
15'-35 8"
20'-21 4"
54'-578"
158" 112" 1'-1034"
PRO
DU
CED
BY
AN
AU
TOD
ESK
ED
UC
ATI
ON
AL
PRO
DU
CT
PRODUCED BY AN AUTODESK EDUCATIONAL PRODUCT
PRO
DU
CED
BY A
N A
UTO
DESK
EDU
CA
TION
AL PR
OD
UC
T
PRODUCED BY AN AUTODESK EDUCATIONAL PRODUCT
Figure 15—End view of the Amnicon River Bridge.
Figure 16—View of the underside of the Amnicon River Bridge roof system.
Research Note FPL–RN–0335
8
Role of Laser Scanning Technologies in Condition Assessment of Timber Bridges and StructuresAssessment of the condition of wood in a historic bridge can be conducted for a variety of reasons. Federal inspec-tion requirements and historic preservation would be the most likely reasons for conducting a condition assessment. Historically, a structural condition assessment consists of the following: 1) a systematic collection and analysis of data pertaining to the physical and mechanical properties of materials in use; 2) evaluation of the data collected; and 3) providing recommendations, based on evaluation of the collected data, regarding portions of an existing structure that affect its current or proposed use (Ross and others 2006). Such an assessment relies upon an in-depth inspec-tion of the wood members in the structure. A wide variety of techniques are used to assess the condition of wood in struc-tures. Visual, resistance drilling (probing), and stress-wave or ultrasound-based techniques are all used either individu-ally or in combination to inspect in-service wood.
The use of new laser scanning technology should also be incorporated into a comprehensive inspection protocol. 3D scanning provides millions of data points of information about the bridge being inspected. The point clouds of data collected depict all visible aspects and actual dimensions of the bridge. This information can be used to determine areas of the bridge that show excessive deflection, rota-tion or skew of the structure, damaged members, and other visual indicators that a human eye cannot easily identify or quantify.
A comprehensive inspection protocol for historic covered bridges should include the following:
• 3D laser scanning
• Visual inspection
• Hammer sounding and probing
• Moisture content determination
• Stress-wave timing
• Resistance microdrilling
Each of these techniques is covered generally in the follow-ing sections. Comprehensive information on visual inspec-tion, hammer sounding and probing, stress-wave inspection and resistance microdrilling can be found in Wood and Tim-ber Condition Assessment Manual, Second Edition (White and Ross 2014).
3D Laser ScanningAs noted earlier in this report, 3D laser scanning consists of the use of an appropriate commercial laser scanning system.
There are a number of commercial companies that supply equipment that would be appropriate. The resolution of the unit should be approximately ±5 mm (0.2 in.) at a distance of 120 m (393.7 ft). Ideally, the laser scanning should be completed in advance of the other inspection techniques. Depending on the size of the structure, 15–30 laser scans should be completed and registered to form one compre-hensive point cloud image. This information can be used to identify areas of the bridge that show excessive deflection while not under load, rotation, or skew of the structure, damaged members, and other visual indicators that a hu-man eye cannot easily identify or quantify. It can provide information that can be used by the inspection team as they conduct the other inspection techniques.
Visual InspectionVisual inspection is the simplest method for locating dete-rioration in timber structures. The inspector observes the structure for signs of actual or potential deterioration, noting areas for further investigation. Visual inspection requires strong light and is suitable for detecting intermediate or advanced surface decay, water damage, mechanical damage, or failed members.
Visual inspection cannot detect early stage decay when remedial treatment is most effective. During an investiga-tion, the following signs of deterioration should be carefully investigated. Fruiting bodies provide positive indication of fungal attack but do not indicate the amount or extent of de-cay. Some fungi produce fruiting bodies after small amounts of decay have occurred; whereas others develop only after decay is extensive. When fruiting bodies are present, they almost certainly indicate serious decay problems.
Sunken faces or localized surface depressions can indicate underlying decay. Decay voids or pockets may develop close to the surface of the member, leaving a thin, depressed layer of intact or partially intact wood at the surface. Stain-ing or discoloration indicates that members have been subjected to water and potentially high moisture contents required for decay activity. Rust stains from connection hardware are also a good indication of wetting. Insect activ-ity is visually characterized by holes, frass, and powder posting. The presence of insect activity may also indicate the presence of decay. Plant or moss growth in splits, cracks, or soil accumulations on the structure indicates that adjacent wood has been at relatively high moisture content suitable for decay for a sustained period of time.
Hammer Sounding and ProbingSimple mechanical tests are frequently used for in-service inspection of wood members in timber bridge structures. Hammer sounding can allow inspectors to identify areas that sound hollow and require further inspection. Loose hard-ware or the presence of carpenter ants can also be detected using hammer sounding. Further, the use of probes can
Laser Scanning Technology as Part of a Comprehensive Condition Assessment for Covered Bridges
9
(parallel to fiber) and longest across the grain (perpendicular to fiber). For common timber bridge species, Douglas-fir and Southern Pine, at dry conditions, stress-wave transmis-sion time is approximately 200 μs/m (60 μs/ft) parallel to grain, but ranges from 850 to 1000 μs/m (259 to 305 μs/ft) in the perpendicular or cross-grain direction.
The presence of deterioration from decay can greatly affect stress-wave transmission time in wood. Transmission times for decayed wood are much greater than that for nondecayed wood. For example, transmission time for nondegraded Douglas-fir is approximately 850 µs/m (244 µs/ft), whereas severely degraded members exhibit values as high as 3,200 μs/m (975 μs/ft) or greater. White and Ross (2014) demon-strated that a 30% increase in stress-wave transmission time implies a 50% loss in strength. A 50% increase indicates severely decayed wood.
Resistance MicrodrillingResistance drilling, an automated form of mechanical prob-ing, is being increasingly used in the field to characterize wood properties and to detect abnormal physical conditions in structural timber members. This system was originally developed for use by arborists and tree care professionals to evaluate the condition of urban trees and locate voids and decay. It is now being used to identify and quantify decay, voids, and termite galleries in wood beams, columns, poles, and piles. This technique is now the preferred drilling and coring technique for timber bridge elements (Brashaw and others 2005).
The resistance drill system measures the resistance of wood members to a 1.5-mm drill bit with a 3.0-mm head that passes through them. The drill bit is fed at a fixed movement rate allowing the inspector to determine the exact location and extent of the damaged area. This system produces a chart showing the relative resistance over its travel path. This chart can be produced either as a direct printout or electronic data that can be downloaded to a computer. Areas of sound wood have varying levels of resistance depending on the density of the species and voids show no resistance. The inspector can determine areas of low, mild, and high levels of decay. Further, termite galleries can be identi-fied by the characteristic of high resistance (solid wood) followed immediately by no resistance (gallery). Larger diameter holes can be drilled and inspected with a magnified inspection scope to verify the presence of live termites.
Summary• Three-dimensional laser scanning can be used to rapidly
scan historic bridge structures. There are a number of technologies and commercial vendors available.
• Post-processing of the scan data requires experience and skill to cost-effectively create as-built documentation.
• A 3D scanner can be used to create a range of outputs that
allow the inspector to determine the depth of any checks or splits. The underlying premise for such tests is that degraded wood is relatively soft and will have low resistance to probe penetration or withdrawal.
Moisture Content DeterminationMoisture meters can effectively be used in conducting inspections of timber bridge elements. It is well documented that the presence of moisture is required for decay to occur in timber. Typically, moisture conditions in timber of less than 20% will not allow decay to occur. However, as the moisture increases above 20%, the potential for decay to oc-cur increases. Serious decay occurs only when the moisture content of the wood is above 28%–30%. This occurs when dry wood is exposed to direct wetting through rain, moisture infiltration, or contact with ground water or bodies of water. Wood that is fully saturated with water and without enough oxygen will not be affected by wood decay fungi. Timber piles should be carefully inspected near the water line since rivers and streams have varying water levels throughout the year.
Stress-Wave Timing TechniquesStress-wave timing is an effective method for locating and defining areas of decay in timber bridges (Brashaw and others 2005). Stress-wave propagation in wood is a dynamic process that is directly related to the physical and me-chanical properties of wood. In general, stress waves travel faster in sound and high quality wood than in deteriorated and low quality wood. By measuring wave transmission time through a timber bridge beam, pile cap, or piling in the radial direction, the internal condition of the structural element can be fairly accurately evaluated. A stress wave is induced by striking the timber member with an impact device instrumented with an accelerometer that emits a start signal to a timer. A second accelerometer, held in contact with the other side of the timber, senses the leading edge of the propagating stress wave and sends a stop signal to the timer. The elapsed time for the stress wave to propagate between the accelerometers is displayed on the timer. This measured time, when converted to a transmission time on a per length basis (or wave propagation speed), can be used as a predictor of the physical conditions inside the timber bridge member.
Stress-wave timing is especially useful on thick timbers or glued-laminated timbers (≥89 mm (3.5 in.)) where ham-mer sounding is not effective. Access to both sides of the member is required. Because wood is an organic substance, the speed of wave propagation varies with grain direction. Hammering the side of a timber member will cause a sound wave across or transverse to the wood cells (perpendicular to grain). The speed of sound across the grain is about one-fifth to one-third of the longitudinal value.
Stress-wave transmission times are shortest along the grain
Research Note FPL–RN–0335
10
include point cloud scans, parametric images, and 2D and 3D AutoCAD® drawings. For historic bridges, this in-formation can be used for a variety of purposes including as-built documentation and structural assessment, while also providing detail on the land topography adjacent to the bridge.
• The use of new laser scanning technology should be incorporated into a comprehensive inspection protocol. Three-dimensional scanning provides millions of data points of information about the bridge being inspected. The point clouds of data collected depict all visible aspects and actual dimensions of the bridge. This infor-mation can be used to determine areas of the bridge that show excessive deflection, rotation, or skew of the struc-ture, damaged members, and other visual indicators that a human eye cannot easily identify or quantify.
• With new access to lower cost laser scanning technology, a comprehensive inspection protocol for historic covered bridges should include (1) 3D laser scanning, (2) visual inspection, (3) hammer sounding and probing, (4) mois-ture content determination, (5) stress-wave timing, and (6) resistance microdrilling.
Literature CitedAtasoy, G.; Tang, P.; Zhang, J.; Akinci, B. 2010. Visualizing laser scanner data for bridge inspection. 2010 Proceedings of the 27th International Symposium on Automation and Robotics in Construction, Bratislava, Slovakia: 390–400.
Brashaw, B.K.; Vatalaro, R.J.; Wacker, J.P.; Ross, R.J. 2005. Condition assessment of timber bridges. 1. Evaluation of a micro-drilling resistance tool. General Technical Report FPL–GTR–159. Madison, WI: U.S. Department of Agricul-ture, Forest Service, Forest Products Laboratory. 8 p.
Brashaw, B.K.; Vatalaro, R.J.; Wang, X.; Ross, R.J.; Wacker, J.P. 2005. Condition assessment of timber bridges. 2. Evalu-ation of several stress wave tools. General Technical Report FPL–GTR–160. Madison, WI: U.S. Department of Agricul-ture, Forest Service, Forest Products Laboratory. 11 p.
Brashaw, B.K. 2010. Use of laser scanning technology to obtain as-built records of the Zumbrota covered bridge. NRRI Technical Report NRRI/TR-2011/04. University of Minnesota Duluth.
FARO. 2013. FARO laser scanner technical specifications. FARO laser scanner focus 3D - the leader in 3D documenta-tion.
FARO. 2011a. Measuring arms, laser tracker, laser scanner. FARO Laser Scanner Focus 3D - APPLICATIONS.
FARO. 2011b. FARO laser scanner training. Training presentation.
Foltz, L. 2000. 3D laser scanner provides benefits for Penn DOT Bridge and Rockface surveys. Professional Sur-veyor. (May). http://www.profsurv.com/magazine/article.aspx?i=590
Jaselskis, E.; Cackler, E.; Andrle, S; Gao, Z. 2003. Pilot study on improving the efficiency of transportation project using laser scanning. Final Report CTRE Project 02-109. Center for Transportation Research and Education, Iowa State University.
Jaselskis, E.; Gao, Z.; Walters, R. 2005. Improving transpor-tation projects using laser scanning. Journal of Construction Engineering and Management. 131(3): 377–384.
Ross, R.J.; Brashaw, B.K.; Anderson, S.J. 2012. Use of laser scanning technology to obtain as-built records of historic covered bridges. Research Paper FPL–RP–669. Madison, WI: U.S. Department of Agriculture, Forest Service, Forest Products Laboratory. 18 p.
Ross, R.J.; Brashaw, B.K.; Wang, X. 2006. Structural condi-tion assessment of in-service wood. Forest Products Journal. 56(6): 4–8.
White, R.H.; Ross, R.J. 2014. Wood and timber condition assessment manual. Second edition. General Technical Report FPL–GTR–324. Madison, WI: U.S. Department of Agriculture, Forest Service, Forest Products Laboratory. 102 p.
Tang, P.; Huber, D.; Akinci, B. 2011. Characterization of la-ser scanners and algorithms for detecting flatness defects on concrete surfaces. Journal of Computing in Civil Engineer-ing. 25(1): 31–42.
Wisconsin Department of Natural Resources. 2012. Amni-con Falls State Park Horton Covered Bridge. Accessed Janu-ary 5, 2013. http://dnr.wi.gov/topic/parks/name/amnicon/bridge.html
Zhu, Z., German, S.; Brilakis, I. 2010. Detection of large-scale concrete columns for automated bridge inspection. Automation in Construction. 19(8): 1047–1055.