Embed Size (px)
Citation preview

Zambia Forestry Department Ministry of Tourism, Environment and Natural Resources
Food and Agriculture Organization of the United Nations
by Thomson Kalinda, Samuel Bwalya, Augustine Mulolwa & Hyde Haantuba
Report Prepared for the Forest Management and Planning Unit of the Forestry Department (FOMR), FAO & the Forestry Department, Ministry of Tourism, Environment and Natural Resources, Zambia
USE OF INTEGRATED LAND USE ASSESSMENT (ILUA) USE OF INTEGRATED LAND USE ASSESSMENT (ILUA)
DATA FOR FORESTRY AND AGRICULTURAL DATA FOR FORESTRY AND AGRICULTURAL
POLICY REVIEW AND ANALYSIS IN ZAMBIAPOLICY REVIEW AND ANALYSIS IN ZAMBIA

USE OF INTEGRATED LAND USE ASSESSMENT (ILUA) DATA FOR ENVIRONMENTAL AND AGRICULTURAL POLICY REVIEW AND ANALYSIS IN ZAMBIA Report Prepared for the Forest Management and Planning Unit of the Forestry Department, FAO & the Zambian Forestry Department, Ministry of Tourism, Environment and Natural Resources, Zambia –December 2008 by Thomson Kalinda1, Samuel Bwalya2, Augustine Mulolwa3 & Hyde Haantuba4 Funding through: The Finnish Ministry of Foreign Affairs, Finnish Embassy, Lusaka, Zambia Implementing Agencies: Forestry Department, Ministry of Tourism Environment and Natural Resources, Zambia Survey Department, Ministry of Lands, Zambia University of Zambia Advisory and Technical supervision: Forest Management and Planning Unit of the Forestry Department, FAO (FOMR) Editing: Thomson Kalinda, Becky Tavani
1 Dr. Thomson Kalinda, Head of Agricultural Economics & Extension Education Department, University of Zambia 2 Dr. Samuel Bwalya, Director of Research and Planning, Zambia Revenue Authority 3 Dr. Augustine Mulolwa, Department of Geomatic Engineering, University of Zambia 4 Dr. Hyde Haantuba, Coordinator, Agricultural Consultative Forum, Lusaka, Zambia


i
TABLE OF CONTENTS
TABLE OF CONTENTS .......................................................................................................................i LIST OF TABLES .............................................................................................................................. iii LIST OF FIGURES.............................................................................................................................iv LIST OF ABBREVIATIONS ................................................................................................................v EXECUTIVE SUMMARY ................................................................................................................... 1 1.0 Introduction and Background................................................................................................. 4
1.1 Introduction.......................................................................................................................... 4 1.2 The Integrated Land‐use Assessment (ILUA) Data ............................................................ 4 1.3 Structure of the Report ........................................................................................................5 1.4 Methodology and Rationale ............................................................................................... 6
1.4.1 Forestry, Economic Growth and Poverty Reduction .................................................. 6 1.4.2 Agriculture, Economic Growth and Poverty Reduction ..............................................7
1.5 Economic Context................................................................................................................ 9 1.5.1 Economic Growth and Poverty Trends in Zambia ....................................................... 9 1.5.2 Recent Performance of Zambia’s Agricultural Sector ................................................11 1.5.3 Contributions of the Forest Sector to Gross Domestic Product ............................... 13
2.0 Review of Natural Resource and Agricultural Policies in Zambia ...................................... 15 2.1 Introduction ........................................................................................................................ 15 2.2 Zambia Poverty Reduction Strategy & National Growth Strategy .................................. 15 2.3 Policies and Key Reforms in the Natural Resources Sector ............................................. 16
2.3.1 Natural Resources Programmes under the FNDP...................................................... 18 2.3.2 The Environment and Natural Resources Management and Mainstreaming Programme (ENRMMP) ...................................................................................................... 20
2.4 Forest Policy Framework ................................................................................................... 21 2.5 Zambia’s National Agricultural Policy................................................................................23
2.5.1 Linkages to other Policies/Sub‐sector Policies .......................................................... 24 2.5.2 Pro‐poor policy frameworks .......................................................................................27
2.6 Food Security Programs: Donor and Government Policy in Action................................ 28 2.6.1 State Action to Reduce Vulnerability and Support Livelihoods............................... 28
3.0 Analysis of Forest Resources and Agricultural Information using ILUA Database .......... 31 3.1 Introduction ........................................................................................................................ 31 3.2 Land Use by Land Classification......................................................................................... 31 3.3 Forest Inventory Assessment ............................................................................................33
3.3.1 Forest Biomass.............................................................................................................33 3.3.2 Distribution of Forests by DBH class ......................................................................... 34 3.3.3 Distribution of Forest by Land Tenure ...................................................................... 36 3.3.4 Commercially Valuable Timber Species .................................................................... 40 3.3.5 Distribution of Forests by Protection Status ............................................................ 43 3.3.6 Distribution of Forests by Management Plan .......................................................... 44
3.4 The Current Status of Forests........................................................................................... 45 3.5 Resource Utilization and the Environment...................................................................... 50
3.5.1 Household Livelihood Activities.................................................................................. 51 3.5.2 Crop Production ..........................................................................................................52 3.5.3 Livestock Production ................................................................................................. 54 3.5.4 Household Income..................................................................................................... 56 3.5.5 Importance of forest resources to local livelihoods ................................................ 58

ii
3.6 Household wood fuel supply and demand.......................................................................61 3.6.1 Firewood Consumption.............................................................................................. 62 3.6.2 Demand and Supply of Charcoal ............................................................................... 63
3.7 Forests as Carbon Sinks and Sequesters.......................................................................... 67 3.8 Access to Resources ......................................................................................................... 70
3.8.1 Access to Land............................................................................................................ 70 3.8.2 Level of Agricultural Input Utilization........................................................................ 71 3.8.3 Access to Credit ..........................................................................................................73 3.8.4 Access to Extension Services .................................................................................... 74 3.8.5 Access to Veterinary Services.................................................................................... 76 3.8.6 Access to closest Permanent Road ...........................................................................77
4.0 Conclusions and Recommendations....................................................................................79 4.1 General Conclusion ............................................................................................................ 79 4.2 Conclusions and Policy Recommendations for the Forest Sector.................................. 80
4.2.1 More Specific Policy Recommendations in the Forest Sector ..................................81 4.3 Conclusions and Policy Recommendations for the Agricultural Sector......................... 82
4.3.1 Policy Recommendations for the Agriculture Sector............................................... 84 4.3 Recommendations for Information Collection in Future ILUA Surveys......................... 86
REFERENCES................................................................................................................................. 88 ANNEX 1 ILUA field data survey................................................................................................. 90 ANNEX 2 ILUA Data which can be used to monitor or guide Agricultural Sector Policy implementation…………………...…………………………………………………………….104 ANNEX 3 ILUA Data which can be used to monitor or guide Livestock Policy implementation……………………………………………………………………………………...110 ANNEX 4 ILUA Data which can be used to Monitor or Guide Forestry Policy Implementation ..114 ANNEX 5 AGRICULTURAL SECTOR POLICY BRIEF…………………………………………....116 ANNEX 6 FORESTRY SECTOR POLICY BRIEF ...........................................................................120

iii
LIST OF TABLES Table 1: Contribution of natural resources to the Zambian economy in 2003 ........................... 14 Table 2: Natural resources programmes objectives & strategies under the FNDP ................... 19 Table 3: Agricultural sector and sub‐sector policy objectives.....................................................23 Table 4: Summary of linkages between national and sub‐sector policies in the agricultural and natural resources sector .............................................................................................................. 24 Table 5: Summary of various agriculture & natural resources policies in Zambia .....................27 Table 6: Forest Coverage and Forest Biomass in Zambia............................................................32 Table 7: Distribution of land by land use category ......................................................................32 Table 8: Spatial distribution of biomass by province...................................................................33 Table 9: Number of stems in each DBH class by forest type ......................................................35 Table 10: Number of stems in each DBH class by land tenure type........................................... 36 Table 11: Percentage of forest area under management plan per province ............................. 45 Table 12: Percentage distribution of households by type of cooking energy ............................55 Table 13: Total and average number of livestock owned by sample households......................55 Table 14: Proportion of households with highest ranked forest products/services by total annual income levels .................................................................................................................... 59 Table 15: Proportion of households with highest ranked forest products/services by total annual income levels .................................................................................................................... 59 Table 16: Estimates of charcoal production and deforestation................................................. 64 Table 17: Estimates of carbon sequestration from improved management of degraded forests . 69 Table 18: Distribution of households by access and proximity to credit services......................73 Table 19: Distribution of households by access and proximity to extension services...............75 Table 20: Distribution of households by access and proximity to veterinary services & drugs ..... 76 Table 21: Distribution of households by access to closest permanent road ............................. 78

iv
LIST OF FIGURES Figure 1: Zambia, annual growth rates for GDP and selected sectors, 2001 to 2006................. 10 Figure 2: Poverty trends in Zambia, 1991 to 2004 .........................................................................11 Figure 3: Growth rates in the Zambia’s economy, agricultural sector and its sub‐sector from 2001 to 2005................................................................................................................................... 12 Figure 4: Average yield levels for selected crop sub‐sectors from 2000 to 2007...................... 12 Figure 5: Distribution of forests by tree stem size (DBH) ...........................................................35 Figure 6: Forest volume per hectare by major land tenure system............................................37 Figure 7: Percentage distribution of forest area by land tenure system................................... 38 Figure 8: Forest reserves in relation to land tenure categories................................................. 39 Figure 9: Distribution of commercially valuable timber species................................................ 40 Figure 10: Commercially valuable timber by forest management regime .................................41 Figure 11: Forest volume in relation to area under formal management plans .........................41 Figure 12: Forest Volume in relation to Household Compliance with Forestry Legislation...... 42 Figure 13: Area Distribution of Forests by Protection Status..................................................... 43 Figure 14: Comparing stock estimates from three separate studies ......................................... 46 Figure 15: Extent of forest disturbance in Zambia (impact level of human activity in the forest or other wooded land)................................................................................................................. 47 Figure 16: Forest over‐exploitation in relation to land tenure categories................................. 48 Figure 17: Forest over‐exploitation in relation to rural and urban areas ................................... 48 Figure 18: Forest over‐exploitation in relation to income distribution...................................... 49 Figure 19: Distribution of forest volume by land ownership...................................................... 49 Figure 20: Volume per hectare by canopy cover and land tenure............................................. 50 Figure 21: Overall income generating activities among sampled Zambian households ............ 51 Figure 22: Proportion of land area allocated to cultivation of various crops.............................52 Figure 23: Proportion of households and cultivated crop products...........................................53 Figure 24: Crop production system by province......................................................................... 54 Figure 25: Percentage of livestock species owned by sample households............................... 54 Figure 26: Contribution of different species to total livestock units in the sample households ... 55 Figure 27: Distribution of households by total annual household income earned ................... 56 Figure 28: Household income .......................................................................................................57 Figure 29: Mean household income in relation to urban and rural areas ................................. 58 Figure 30: Household use of forests for food in relation to forest distribution ....................... 60 Figure 31: Contribution of income from forestry to total household income in relation to forest distribution .........................................................................................................................61 Figure 32: Energy (charcoal & fuelwood) use in relation to forest distribution ....................... 62 Figure 33: Distribution of land ownership among the sample households .............................. 70 Figure 34: Agricultural inputs used by sample households.........................................................72 Figure 35: Average Household Income in relation to Distance to Input Markets .....................72 Figure 36: Total livestock in relation to distance to livestock credit ......................................... 74 Figure 37: Total livestock in relation to distance to extension services .....................................75 Figure 38: Households accessing credit in relation to distance to permanent roads .............. 79

v
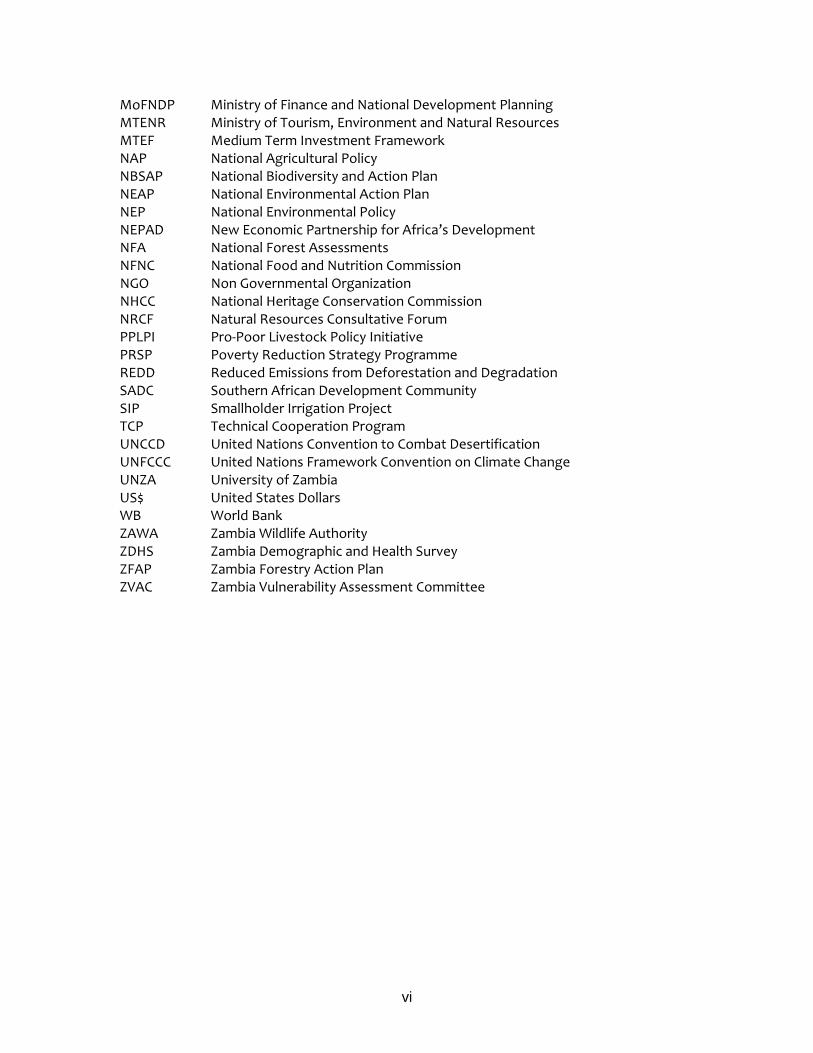
LIST OF ABBREVIATIONS AIDS Acquired Immune Deficiency Syndrome AU African Union CAADP Common Africa Agriculture Development Programme CBD Convention on Biological Diversity CBO Community Based Organization CITES Convention on International Trade in Endangered Species of Wild Flora
& Fauna COMESA Common Market for Eastern and Southern Africa CSO Central Statistical Office DBH Diameter at Breast Height DFID Department for International Development DMMU Disaster Management and Mitigation Unit DMU Disaster Management Unit ECZ Environmental Council of Zambia EISP Environmental Investment Strategic Plan EPPCA Environmental Protection and Pollution Control Act ESP Environmental Support Programme EU European Union FAO Food and Agriculture Organization of the United Nations FEWS Famine Early Warning System FNPP FAO‐Netherlands Partnership Program FINNIDA Finnish International Development Agency FNDP Fifth National Development Plan FRA Food Reserve Agency FSP Food Security Pack/Fertilizer Support Programme GDP Gross Domestic Product GEF Global Environmental Fund GLCP Global Land Cover Project GMO Genetically Modified Organisms GRZ Government of the Republic of Zambia GTZ German Technical Assistance to Zambia Ha. Hectares HIV Human Immune Virus HIPC Highly Indebted Poor Country ILUA Integrated Land‐Use Assessment JFM Joint Forestry Management Kg Kilograms LCMS Living Conditions Monitoring Survey LPG Liquefied Petroleum Gas MACO Ministry of Agriculture and Cooperatives MAFF Ministry of Agriculture and Fisheries MDGs Millennium Development Goals
vi
MoFNDP Ministry of Finance and National Development Planning MTENR Ministry of Tourism, Environment and Natural Resources MTEF Medium Term Investment Framework NAP National Agricultural Policy NBSAP National Biodiversity and Action Plan NEAP National Environmental Action Plan NEP National Environmental Policy NEPAD New Economic Partnership for Africa’s Development NFA National Forest Assessments NFNC National Food and Nutrition Commission NGO Non Governmental Organization NHCC National Heritage Conservation Commission NRCF Natural Resources Consultative Forum PPLPI Pro‐Poor Livestock Policy Initiative PRSP Poverty Reduction Strategy Programme REDD Reduced Emissions from Deforestation and Degradation SADC Southern African Development Community SIP Smallholder Irrigation Project TCP Technical Cooperation Program UNCCD UNFCCC
United Nations Convention to Combat Desertification United Nations Framework Convention on Climate Change
UNZA University of Zambia US$ United States Dollars WB World Bank ZAWA Zambia Wildlife Authority ZDHS Zambia Demographic and Health Survey ZFAP Zambia Forestry Action Plan ZVAC Zambia Vulnerability Assessment Committee

vii

1
EXECUTIVE SUMMARY
Although the Central Statistical Office of Zambia (CSO) has been routinely collecting national data from surveys on country demographics and agricultural statistics, very little effort has been made in looking at the data in an integrated format or combining it with other relevant statistics to get a full picture of land use trends. An integrated system of data serves as an effective tool for planning both at the national and sub‐national level. Food security analysis may require a diverse system of measurement and cannot adequately be analyzed through the Crop Forecast Survey, Post Harvest Survey and the Living Conditions Survey. An integrated instrument that looks at all aspects such as land use systems, forest resources, and other biophysical characteristics of the environment could help to understand environmental issues and poverty and food security concerns in Zambia. The Integrated Land‐Use Assessment (ILUA) has compiled a wide array of data on the land‐use and land‐cover situation in Zambia. This integrated system of data has been used for policy analysis in this study. The ILUA database serves as a valuable source of data for establishing a national database on Zambia’s forest related land use resources and hence can contribute to sustainable natural resource management. The analysis of ILUA data and the possibility of linking it to ancillary and other geo‐spatial data with special attention to pertinent agricultural issues in Zambia can also be useful in informing policy decision making/formulation as well as in monitoring and evaluating policy impacts. The ILUA survey data present a valuable resource that with careful filtering, analysis and continuation through the years can provide a wealth of information about land use patterns within Zambia. Based on the analysis of ILUA data which was carried out in order to identify key information needs for relevant national policies and action plans related to agriculture and forestry, the study offers the following policy implications and recommendations: 1. Zambia has a large population under extreme poverty. Even though poverty is
widespread, the majority of people in Zambia who are affected by high poverty levels are predominantly found in rural areas. The country’s poor and non‐poor are closely associated with agriculture and the greatest gains on poverty reduction can be achieved through stimulating an efficient agricultural sector. This observation in itself implies that for anti‐poverty programmes to achieve the intended, they have to be designed and implemented in a manner that takes into account the large presence of the chronic poor in rural areas.
2. Sustainable management of natural forests depends, to a large extent, on the land
tenure system. It is important to note that although the Land Act vests power over land of the President, most of the land in Zambia (62%) is practically owned and managed by customary authorities. Of the total forestland, about 30,751,000 hectares are located on customary land and only 11,824,000 hectares are located on State land. Privately owned forests with legal land titles, accounting for 5,283,000 hectares, fall under State land because no legal title is issued on customary land. Therefore all pieces of customary land that are demarcated and allocated with title deeds automatically cease to be administered as customary land and become State land. This has unfortunately caused

2
fragmentation of customary land, as conversion of customary to leasehold tenure continues to increase as State land available for allocation diminishes. In the area of land policy and in order to achieve sustainable development, the government needs to address the following priority areas: formulation and implementation of land tenure policies to improve access and legal title to land by disadvantaged groups; modifications of land tenure systems to promote rural development under indigenous and common property resource management; institutional support for land registration and titling; and land administration services.
3. Zambia’s forests are not only important for their specialized high timber species and fuel‐
wood, they are also important repositories of biodiversity and provide a wide range of environmental services to wildlife and the booming wildlife‐based tourism, agriculture, energy, hydro‐electricity generation and municipal water supply by regulating watercourses and flood regimes. Forests and woodland resources also provide pastures and forbs for livestock and enhance the productivity of soil, thereby contributing to higher crop yields. Clearly, forest management contributes to growth and income generation in downstream sectors through these linkages. In addition, forests provide numerous environmental services, including carbon sinks, habitat, flood control and watershed management. Most of these forest services play a significant role as a public good, but because of indirect linkages to downstream sectors cannot easily attract optimal private investment in long‐term forest management.
4. The ILUA data demonstrates the great potential that exists in the forest sector, all that is
needed to improve incentives for sustainable forest resource management and reduced degradation of the forest resource base. Government cannot sustainably and effectively manage public forests all by itself; it needs to expedite devolution of user rights and responsibilities to local communities, user groups and the private sector. In order to further limit deforestation and degradation of forests, there is a need to harmonize policies and strengthen linkages between the forest sector, agriculture, wildlife and tourism, and other natural resource sectors. And, optimal management of forests will also require instituting payment mechanisms or benefit sharing that will ensure that forest benefits utilized in downstream sectors are appropriately shared with the forest sector. At present, these benefits are not shared with the forest sector to help defray the cost of forestry management. This tends to suppress forest values thereby leading to sub‐optimal provision of forest conservation. Forest carbon payments for sustainably managed forests through such mechanisms as REDD could provide an optimal opportunity for capturing these benefits and rewarding adjacent communities who are able to maintain and manage high forest cover.
5. In livestock production, land tenure insecurity affects livestock production. That is, lack
of confidence in secure title to rangeland (especially on communal lands) has been shown to reduce the incentive to manage the land and forests sustainably. To prevent livestock disease transmission, overgrazing and soil compaction, livestock policy and strategies should ensure that pastoralists and livestock managers/farmers have secure tenure rights and adequate incentives for carrying out sustainable forest management.
6. The ILUA results indicate some gaps in the provision of credit services in rural areas. The
limited and often complete lack of access to rural financial services hampers
3
smallholder's efforts to improve or expand their farm activities so as to earn income. The challenge thus remains to find solutions to the problem of increasing access to credit by poor small‐scale farmers who lack collateral assets. The ILUA data highlights the imperative for improved extension, veterinary and other support services, most critically those associated with input supply and marketing infrastructure. Without adequate input markets such as fertilizers and seeds, forest fragmentation and degradation will accelerate. To date, the public sector has struggled to provide effective services in such a vast country with a scattered livestock and human population. The low population density means that service provision is inevitably very expensive. Consequently, livestock keepers do not receive sufficient technical expertise through veterinary and extension workers and thus lack satisfactory support services. There is therefore a need for the government to invest and support public extension and veterinary services in order to assist farmers improve their productivity.
7. Improving productivity in small‐scale agriculture depends on the adequacy and quality of
rural infrastructure like roads and bridges. In a number of cases, rural populations are denied access to agricultural inputs, educational materials, and health services among others because of inadequate rural transport infrastructure and means of travel. Investment in rural feeder roads, in particular, can have large poverty reduction effects per unit of investment. Roads enable farmers to participate in higher value‐added market chains, in turn significantly contributing to poverty reduction.
8. Furthermore, the government needs to increase investments in forest sector both by
increasing budgetary allocation to the forestry agency towards sustainable forest management and through effective public‐private sector partnerships. In addition, government needs to further strengthen and streamline the role of the forest sector in poverty reduction beyond what is currently reflected in the Poverty Reduction Strategy Paper and the Fifth National Development Plan.
The analyses presented here have barely scratched the surface of what could be done with further analysis of the ILUA database. The data show that households derive a wide range of products and services from forests and woodland areas underscoring the importance of this resource to their livelihood strategies and in reducing poverty. The ILUA data give policy makers an indication of land use and management and therefore can assist in developing strategies for improving the management of forest and agricultural resources and increasing the efficient use of degraded lands so as to reduce pressures on primary forests.

4
1.0 INTRODUCTION AND BACKGROUND
1.1 Introduction Zambia is abundantly endowed with the necessary resources to stimulate agricultural and rural development. Despite this endowment, the natural resources in Zambia have continued to decline both in quality and quantity. The forests in particular have been vulnerable to factors such as extensive practices of shifting cultivation and slash and burn; ever‐increasing demands for wood‐based energy (firewood and charcoal); unsustainable commercial utilization of indigenous tree species; overgrazing; and forest fires. The agricultural sector outputs have been highly variable. Recurrent drought and, more recently, unusually heavy rains, have often resulted in widespread crop failure. Crop failures have also been attributed to land degradation, poor husbandry practices and lack of appropriate seed varieties. The livestock sub‐sector is also economically important in Zambia and accounts for about 35 percent of the total agricultural production. The main livestock produced are cattle, goats, pigs and poultry. However, livestock production remains far below its potential due to several factors that include outbreaks of diseases such as corridor and foot and mouth. The traditional communal grazing has, in part, been blamed for the frequent outbreaks of cattle diseases in many rural areas. The recurrence of drought has often depleted animal grazing resources and drinking water, thus affecting the productivity of the livestock sector. Analysis of the performance over the past decade of Sub‐Saharan countries as a group suggests that significant progress has been made by most in stabilizing their macroeconomic environments. However, growth performance continues to be well below levels required to impact substantially on poverty. Although there has been a reversal of the downward trend over the last five year period through to 1999, annual average growth rates since the turn of the century have been three percent. This is well below the minimum rates of seven to eight percent required to meet relevant national policy goals and the Millennium Development Goals target (MDGs) for poverty reduction. Meeting the poverty reduction objectives established in the MDGs, halving the proportion of people living in extreme poverty is a daunting challenge, but attainable in the Sub‐Saharan region if growth is combined with policies of redistribution of the growth increment.
1.2 The Integrated Land‐use Assessment (ILUA) Data The Government of Zambia has expressed a need for up‐to‐date information on the stock and utilization of natural resources to assist in planning and sustainably managing land resources. In addition, there is currently no integrated land use database in the country which would support the use of natural resources in development planning. The Government’s focus of interest concerning land use is to put in place an integrated land use assessment system that will improve the management of land resources, and thus contribute to poverty alleviation, improved food security and sustainable economic growth. Integrated land use assessments will also encourage cross‐sectoral coordination and collaboration, bringing together stakeholders from diverse disciplines related to land use management.

5
Therefore, the Government of Zambia, through the Ministry of Tourism, Environment and Natural Resources, with the objectives of reducing poverty, promoting economic growth and building human capacity, requested technical and financial assistance from FAO to design and implement an integrated land use assessment (ILUA) survey. A Technical Cooperation Program (TCP) project was initiated in 2005, with additional funding provided by the FAO‐Netherlands Partnership Program (FNPP) and by governmental counterpart funds. The Finnish Government also contributed greatly to the study. The main activities included assessing the need for and cooperatively designing and implementing an ILUA. FAO’s Forestry and Agriculture Departments collaborated in the design and planning of the ILUA, building upon an approach developed for National Forest Assessments (NFA). Variables related to sectors beyond forestry (cropping, livestock, and environment) were included, and field manuals and survey forms were developed. The Integrated Land‐Use Assessment (ILUA) has compiled a wide array of data on the land‐use situation in Zambia. The data comprises statistical and spatial data. The statistical data was acquired through field surveys at 221 permanent sample plots systematically spread across the country and consisted of field measurements, observations and local interviews (see Annex 2). Spatial land‐cover data was generated from Land‐sat Thematic Mapper Satellite Imagery of dates ranging from 2000 to 2004 donated by the Global Land Cover Project (GLCP) in Nairobi Kenya.
1.3 Structure of the Report The report has four chapters. Chapter One gives an introduction and background of the report. This chapter begins with a presentation of the study methodology and rationale. It then ends with sections giving background information about Zambia’s economic performance and poverty trends. The performance of the agricultural sector as well as the importance of the forestry sector in Zambia’s economic development is highlighted. Chapter Two presents a review of the long‐term economic development strategies and agricultural development frameworks, policies, strategies and interventions that address poverty and food security in Zambia in the last five to ten years. Chapter Two begins with a brief review of the policies and key reforms in the natural resources sector in Zambia as well as outlining the natural resource programmes and strategies under the Fifth National Development Plan (FNDP). It also highlights Zambia’s forestry and agricultural policy frameworks. Chapter Three presents some of the indicators that were generated from the ILUA database, particularly those in the household portion of the inventory. This chapter focuses on analysis of policy‐related information on forestry, agriculture (mainly crop and livestock) from the household survey results. The Chapter discusses land use and especially the distribution of competing land uses before providing more analysis of forests and woodland resources in terms of biomass and biomass distribution across land tenure regimes. Further, the chapter provides some estimates of carbon stocks and estimates actual and potential carbon sequestered by forests and the amount of carbon credits that can be generated as financial flows to promote successful community or joint forest management projects in Zambia. Forest and woodland resources are also important sources of livelihoods and income for local communities and hence the chapter also examines the utilization of forest resources for

6
subsistence and commercial purposes. The chapter also discusses the crop and livestock production activities among the survey households as well as their level of access to resources and services such as extension and veterinary services. Lastly, Chapter Four presents the conclusions and recommendations
1.4 Methodology and Rationale The aim of this assignment was to generate information on indicators from the statistical ILUA data sets which have the potential to support, inform and enhance policy formulation and implementation on land use. To meet these objectives the survey aimed to shed light on two major questions: What is the condition of forests and woodland resources in the country? To address this, an attempt is made to provide fresh estimates of the forest stock and identify critical policies and institutional arrangements for maximizing benefits from forest management. Other questions such as the extent to which people are dependent on forests for their livelihoods are addressed. What is the current status of agriculture (crop and livestock) as a source of livelihood? To address this, the ILUA addressed a number of policy‐relevant questions such as: What crops and livestock are people producing and how much income is generated from these activities? What are the levels of access to agricultural services and input utilization? In addressing the objectives of the study, the main areas identified for policy analysis were in forestry and agriculture. These sectors were identified for detailed policy analysis due to their importance in economic growth, food security and poverty reduction. The following sections briefly explain the overarching rationales in choosing these themes in guiding the analysis and presentation of the ILUA data.
1.4.1 FORESTRY, ECONOMIC GROWTH AND POVERTY REDUCTION Poverty is now widely viewed as encompassing both monetary and non‐monetary dimensions of deprivation – including lack of income and other material means; lack of access to basic social services such as education, health and safe water; lack of personal security; and lack of empowerment to participate in the political process and in decisions that influence one’s life. The dynamics of poverty also are better understood, and extreme vulnerability to external shocks is now seen as one of its major features. Economic growth and poverty reduction programs and strategies, whether inspired by international development agencies or driven by the national development agenda, acknowledge the critical role and contribution of natural resources to the development process. However, the concerns that the poor will degrade forest resources accentuate the conflict between poverty reduction and economic growth on one hand and sustainability of the natural resources on the other. This conflict between poverty and resource sustainability is multi‐dimensional and invokes intra‐generational and inter‐generational considerations in forest management. It is, however, also true that poverty reduction and economic growth often entail increasing per‐capita consumption, and sustaining this prosperity can eventually erode

7
and, in some cases, induce costly and irreversible effects on the natural resource base, including forests. Underlying contemporary development discourse and poverty reduction options in Southern Africa and Zambia in particular is the question of how forests and woodland resources can be made to play a greater role in mitigating conditions of poverty especially among the rural poor. The role of forest resources can be enhanced through the adoption of good forest management practices, increased investment and value addition to forest products and services harvested from forests and woodlands. Skepticisms however remain among those who question the extent to which forests and woodland resources can contribute to poverty reduction and indeed to the national economy without at the same time depleting or degrading the forest resource base. They argue that there is a limited role that forests and trees can play in stimulating growth of the rural economy and in reducing rural poverty. Notwithstanding these concerns, there is well documented evidence to suggest that in most cases forests and woodland resources are important to rural livelihoods and in much forest resource rich countries, forests make significant contribution to national economies and welfare of forest dependent communities. Forests provide primary and secondary services. For instance, forests provide critical habitat to wildlife that supports a thriving wildlife‐based tourism sector, helps to reduces soil erosion, regulates flood regimes, protect the watershed and water catchments that support municipal and industrial water supply, including hydro‐electric generation and irrigation agriculture in addition to proving wide array of other environmental services. Attempts to account and value these services have continued to occupy a central theme in environmental and natural resource economics (environmental valuation theory and practice) and motivate the need to revise conventional national income accounting approaches to incorporate different products and services that forests and woodland provide to the national (global) economy. While acknowledging that quantifying and monetizing forest products and services is challenging, it is not entirely incomprehensible. It is possible to provide, wherever possible, conservative estimates of these values to enable resource users, managers and policymakers to appreciate the important role forests and woodland resources play in poverty reduction and indeed its contribution to the national economy as a whole. The contribution of forests is often understated in most national income accounts statistics of developing countries. Most of these statistics report the contribution of the forests and forest sector in a superficial way, masking its contribution with agricultural or manufacturing and reporting the rest as residual part of the wider informal sector
1.4.2 AGRICULTURE, ECONOMIC GROWTH AND POVERTY REDUCTION There is an intimate relationship between poverty and agriculture. Of the 1.2 billion people worldwide living on less than a dollar a day, 900 million live in rural areas where agriculture remains the major means of securing a livelihood. Even though there are obvious conflicts related to forest cover clearance for agricultural production, the sustainable growth of agriculture has a more powerful impact on poverty reduction than any other economic sector. Agriculture can and does reduce poverty and inequality, making specific contributions as measured by progress towards achieving the Millennium Development Goals.

8
Agricultural development favours the sector where the majority of poor people work and use the land. It generates employment, creates income, and increases the ability of poor people to secure and create further assets. In contrast to industrialized economies, the majority of agricultural products in developing countries are grown, produced and marketed by small‐scale family producers. Agriculture is the most important source of employment in most poor countries. A 1 percent increase in agricultural productivity has been found to reduce the proportion of people living on less than $1 a day by 0.6‐1.2 percent. Not only can agriculture reduce poverty directly, but it can also stimulate growth in the wider economy, provided it is based mainly on family producers. Family‐based agriculture is not only a key to both rural and urban food security and to household livelihoods but also to agriculture’s broader contributions to economic growth and its indirect linkages to poverty reduction and sustainable development are often overlooked in development policy formulation. Agriculture contributes to viable rural communities, enhances food security, reduces rural and urban poverty, promotes equitable and sustainable development, and helps ensure social stability, cultural continuity and rural heritage. Food security is one of the most prominent features of agriculture’s multi‐functionality. Agriculture has ensured that global food production has more than kept pace with human population growth. Ninety percent of the food produced in the world is consumed within the country or region producing it, and most of that usage lies outside of the commercial system. On average worldwide, poor people in rural areas derive half of their household income from farming. Agriculture supplies food and primary commodities, lowers food prices, provides surplus labour and capital, and consumes non‐farm production. Similarly, there is a relationship between food security and access to resources like land, credit and extension. Land is the key asset for hundreds of millions of poor around the globe who work in agriculture on a part‐ or full‐time basis. Land and the resources derived from it is the primary source of not only nutrition and income, but identity, wealth, and credit access. Thus, the nature of rights to land and resources (including common property and aquatic resources) and the way in which they are documented and can be exchanged are key determinants for sustainable agricultural development as well as improved livelihoods for those in the rural sector. In terms of international agreements and reporting requirements, governments around the world made a commitment to adopting national strategies for sustainable development, and this commitment is reflected in the Millennium Development Goals (e.g., Goal 7 on “ensuring environmental sustainability”). Therefore, adequate institutional arrangements are required to determine rights and access to rural resources, such as land, water, and trees as a prerequisite to agricultural development and food security. It has been recognized that governments need to ensure more equitable access by its citizens to natural resources, as well as support in developing and adopting policies, programmes, best practices and tools for land tenure to facilitate access to land, ensure user rights and improve land stewardship. There is an urgent need to increase the efficiency of present resource utilization while simultaneously conserving and, where possible, enhancing the productive capacity of the natural resource base. Credit and capital are basic requisites to increase agricultural production. Farmers need short‐term credit to buy improved seeds, fertilizers, insecticides and herbicides. They also

9
need long‐term credit to invest in more efficient technologies ‐ irrigation, labour‐saving tools and implements and transport ‐ and to set up new enterprises if conditions are favourable. The principal reforms to the rural credit markets have involved the scaling down, elimination, or privatization of the public rural development banks that had been the principal conduit of the loans to agriculture before the reforms. Subsidies for rural credit have been reduced or eliminated as have interest rate controls on private sector rural credit and forced allocations of credit to agriculture. Improvement of the productivity of small‐scale agriculture also depends on the adequacy and quality of rural infrastructure like roads and bridges. Adequate and quality rural infrastructure can facilitate the development of functional markets and well‐functioning agricultural markets can reduce the cost of food and uncertainty of supply, thereby improving food security for both poor and non‐poor households. Better markets also result in higher net returns to farmers, derived from reduced post‐harvest losses, lower transaction and transfer costs, access to a broader base of consumers, and potentially greater value addition. Agricultural technology and extension is an integral part of agricultural development because it significantly contributes to increased agricultural development and thereby to the well‐being of rural populations. Most governments recognize the importance of focusing on building and strengthening their country’s capacity for research and technology development, assessment and transfer in agriculture, forestry, fisheries and natural resources management leading to improved sustainable production systems. The efficiency of extension systems in sustainable agriculture and rural development for food security is a major concern in the poverty reduction programmes. Priorities of its work in agricultural extension include promoting participatory extension strategies and approaches; training of extension staff in topics such as the integration of gender, environment and HIV/AIDS as a socio‐economic problem into extension and training programmes; addressing extension management and extension‐research linkages; and developing extension programmes and methodological tools tailored to farmers' needs in various agro‐ecological and socio‐economic contexts.
1.5 Economic Context
1.5.1 ECONOMIC GROWTH AND POVERTY TRENDS IN ZAMBIA Over the last few years, Zambia has achieved an impressive record in macroeconomic growth and stability. Growth has accelerated in recent years, averaging 5.2 percent per year between 2002 and 2005 and represents a reversal of the economic stagnation experienced during the 1990s. The exchange rate stability has improved with the local currency appreciating against convertible currencies in recent years, and both the country’s fiscal balance and balance of payments position have recorded improvements; the inflation rate has gone down from over 30 percent in 2000 to single digit levels of about 8.5 percent by June 2006 (GRZ 2006a). As can be seen in Figure 1, GDP growth over the last few years has been especially strong, with the overall economy growing in excess of five percent between 2003 and 2006.

10
Figure 1: Zambia, annual growth rates for GDP and selected sectors, 2001 to 2006
-5
0
5
10
15
20
25
2001 2002 2003 2004 2005 2006
Gro
wth
Rat
e (%
)
Agriculture Mining & Quarrying Manufacturing Construction GDP
Source: Central Statistical Office, National Accounts Although most sectors have contributed positively to growth, the recent period has been dominated by the rapid expansion of mining and construction. The renewed growth of the mining sector is a result of recapitalisation and new investments following the privatisation of state‐owned mines in 2000 and by favourable conditions in world commodity markets. The construction sector has also recorded rapid growth as a result of private construction activities, especially in residential housing around the main urban centres and in facilitating mining sector investments. Manufacturing has also grown strongly in recent years, averaging above 5 percent. Manufacturing has benefited from new and sustained investment that began in the late 1990s. However, much of this growth has been concentrated in food processing and textiles, such that there is still little high‐value manufacturing taking place in the country (GRZ 2006b). Unlike the industrial sectors, agriculture has not performed well in recent years, with wide fluctuations in production and a low average growth rate of only 2.6 percent. This reflects considerable variation in weather patterns as well as inadequate infrastructure and generally poor market access. Much of the growth that has taken place has been driven by cash crops such as cotton and tobacco, and has been concentrated in specific areas of the country (GRZ 2006b). Despite the overall strong performance of the economy, higher levels of GDP growth have not translated into significant declines in poverty. As can be seen in Figure 2, national trends of poverty remain high at about 68 percent and have changed little since 1998. Between 1998 and 2004, poverty in rural and urban areas declined by 5 percent and 3 percent, respectively. The incidence of poverty in the rural areas fell from 83 percent in 1998 to 78 percent in 2004, while poverty in urban areas declined to 53 percent from 56 percent in 1998. Rural incidence of extreme poverty fell from 71 percent in 1998 to 65 percent in 2004. In urban areas, the incidence of extreme poverty declined by 2 percent from 36 percent to 34 percent. National incidence of extreme poverty also fell from 58 percent in 1998 to 53

11
percent in 2004 (CSO 2005). Even though the Gini coefficient, a measure of inequality of wealth distribution, declined from 0.66 in 1998 to 0.57 in 2004, Zambia’s income distribution inequality still remains high (World Bank 2007, IMF 2007). Figure 2: Poverty trends in Zambia, 1991 to 2004
Poverty Trends, National
0
10
20
30
40
50
60
70
80
1991 1993 1996 1998 2004
Pov
erty
Rat
e (%
)
Overall Poverty Extreme Poverty
Poverty Trends, Rural & Urban
0102030405060708090
100
1991 1993 1996 1998 2004
Pov
erty
Rat
e (%
)
Rural Overall Poverty Rural Extreme PovertyUrban Overall Poverty Urban Extreme Poverty
Source: CSO 2005 In terms of the current status of income poverty, high levels of poverty continue to be associated with more remote rural provinces such as Western Province (83 percent), Luapula (79 percent), and North‐Western Province (76 percent). The incidence of poverty was lowest in more urbanized regions like Lusaka (48 percent) and the Copper belt Provinces (56 percent). While the proportion of the population living in poverty did not vary much among the provinces, there were quite significant variations in terms of the proportion of the population living in extreme poverty across the provinces. The rate of extreme poverty varied from 29 percent in Lusaka Province to 64 percent in Luapula Province (CSO 2005; GRZ 2006b). Incidences of extreme poverty are also high in rural areas where two thirds of the population are extremely poor compared to only one third in the urban areas. It can be observed that both the incidence of poverty and extreme poverty were much higher in rural areas as compared to urban areas during the period 1991 to 2004 . This has led to the observation that although poverty is widespread and all places in Zambia are affected by high poverty levels, it remains predominantly rural.
1.5.2 RECENT PERFORMANCE OF ZAMBIA’S AGRICULTURAL SECTOR
A review of the agricultural sector indicates that between 2000 and 2005, total growth in the sector was 7.7%, giving an annual growth rate for the agricultural sector of 1.5 % (see Figure 3). Annual growth rate for the sector as a whole ranged between a high of 5.0% in 2003 and a low of ‐2.6% in 2001. Total growth for the agriculture sub‐sector (crops and livestock) over the period 2000‐2005 was 5.8% giving an annual average growth rate for agriculture of 1.2%. Agriculture within the AU/NEPAD/COMESA framework includes the crop, fisheries, livestock and forestry sectors. The forestry sub‐sector grew by 21.5% over the same period giving an annual average growth rate of 4.3%. The fisheries sub‐sector experienced a total decline of –2.51% giving an average annual growth rate of –0.5%.

12
Figure 3: Growth rates in the Zambia’s economy, agricultural sector and its sub‐sector from 2001 to 2005
-8
-6
-4
-2
0
2
4
6
8
Perc
ent G
row
th (%
)
Fisheries -0.5 -0.6 -0.8 -0.6 0 -0.5Crops & Livestock -6 -6.3 8 6.1 3 1.2Forestry 4.3 4.3 4.3 4.3 4.3 4.3Total Agriculture -2.6 -1.7 5 4.2 2.8 1.5Total Economy 4.9 3.3 5.1 5.4 5.1 4.8
2001 2002 2003 2004 2005 Avg.
Source: Central Statistical Office, National Accounts Figure 3 illustrates that the forestry sub‐sector experienced positive growth throughout the 2000‐2005 period whereas the fisheries sub‐sector experienced consistent decline over the same period. The agriculture sub‐sector experienced decline over the 2000‐2002 period. Growth in the agriculture sub‐sector peaked at 8.0% over the 2002‐2003 period due to good weather. However, growth declined to 6.1% and 3.0% over 2003‐2004 and 2004‐2005, respectively. This is mainly driven by increases in production area and to a much lower extent by productivity gains which in fact for some crops are even negative (sees Figure 4). Continuing with such developments will lead to deterioration of the natural resource base for agricultural production and is therefore unsustainable. Figure 4: Average yield levels for selected crop sub‐sectors from 2000 to 2007
0
1
2
3
4
5
6
7
2000 2001 2002 2003 2004 2005 2006 2007
Year
Pro
duct
ivity
( in
t/ha
)
CerealsLegumes & Oil CropsRoots & Tubers
Source: MACO and CSO data.
13
Despite the consistent growth in the forestry sub‐sector, the consistent decline in the fisheries sub‐sector and both negative and positive growth in the agriculture sub‐sector, in general, the sector has been characterized by lack of consistent high positive growth over the 2000‐2005 period, which is the objective of the FNDP and CAADP and necessary to achieve their targets. The past five years have been characterized by significant variations in weather conditions, with rainfall patterns characterized by late starting, uneven distribution and early ending and in some areas heavy rains, giving rise to flood and in others inadequate rainfall interrupted by long dry spells resulting in drought conditions. This pattern of erratic rainfall, limited access to improved inputs, inappropriate farming methods/technologies among a host of other factors resulted in poor agriculture performance and reduced domestic food supply. It demonstrates that Zambia’s agricultural sector is neither on track to achieve the targets set under its FNDP nor those of the CAADP and MDG. It is also not equipped to face effects of the global climate change.
1.5.3 CONTRIBUTIONS OF THE FOREST SECTOR TO GROSS DOMESTIC PRODUCT There is a growing awareness among policymakers that standard measures of national income such as Gross Domestic Product (GDP) reported in the System of National Accounts (SNA) have a number of shortcomings as measures of economic well‐being (Mabugu and Chitiga, 2002; FAO, 2004; Vincent, 1998). These standard measures often do not reflect the short and long term economic importance of natural assets and the impacts of their degradation or depletion. It is only recently that a number of countries have initiated activities to develop data systems that can be used to adjust the measures of national income by integrating data on natural assets such as energy sources, fisheries, forests and minerals in their respective systems of national accounts. More recently, many resource‐dependent countries such as Norway have expanded their national accounts to include data on depreciation of their natural assets and air pollutant emissions that help them to adjust their GDP estimates (Hecht, 1999). When making these adjustments, considerable controversy exists whether to include the imputed value of non‐marketed forest goods and services such as the benefits of biological conservation or amenity values that are necessary for making policy decisions, for example, assessing the tradeoffs between economic and environmental goals of national policies and strategies. In developing country contexts, income from subsistence is often under‐valued, especially for products that may be infrequently consumed. Similarly, informal activities are not usually accurately captured by GDP measures. As an illustration of under‐accounting of forestry resources, we take honey production. Only 400 metric tons of exported honey is recognized in official accounts, while 600‐700 metric tons of informally traded honey used for traditional beer is not adequately captured (Bwalya and Husselman, 2008). According to official figures for Zambia, the forestry sector as a whole contributed 5.4 percent to GDP in 2005, which is close to the estimated contribution of 6 percent for Africa (see Table 1; Oskamen and Mersmann, 2003). This contribution mainly comes from forest‐based industries which account for 3.7 percent of the GDP, of which charcoal production and fuel wood collection account for 2.2 percent and 0.8 percent, respectively (Puustjarvi, 2005).
14
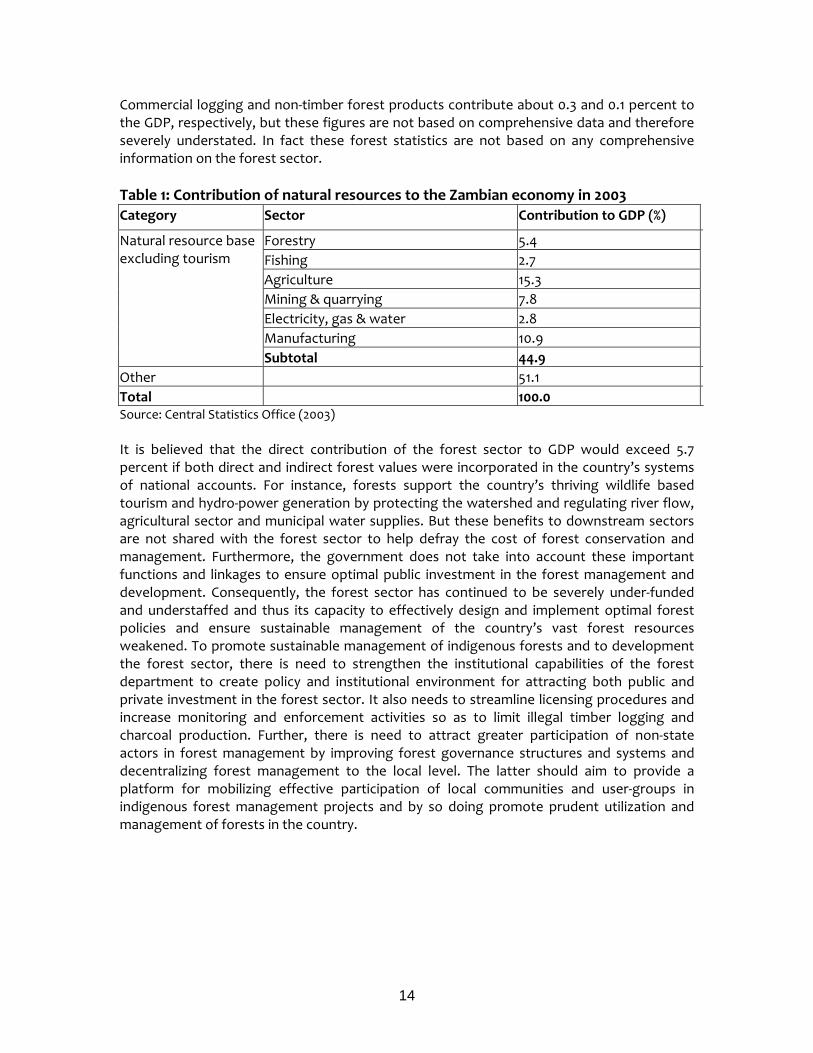
Commercial logging and non‐timber forest products contribute about 0.3 and 0.1 percent to the GDP, respectively, but these figures are not based on comprehensive data and therefore severely understated. In fact these forest statistics are not based on any comprehensive information on the forest sector. Table 1: Contribution of natural resources to the Zambian economy in 2003 Category Sector Contribution to GDP (%)
Forestry 5.4 Fishing 2.7 Agriculture 15.3 Mining & quarrying 7.8 Electricity, gas & water 2.8 Manufacturing 10.9
Natural resource base excluding tourism
Subtotal 44.9 Other 51.1 Total 100.0 Source: Central Statistics Office (2003) It is believed that the direct contribution of the forest sector to GDP would exceed 5.7 percent if both direct and indirect forest values were incorporated in the country’s systems of national accounts. For instance, forests support the country’s thriving wildlife based tourism and hydro‐power generation by protecting the watershed and regulating river flow, agricultural sector and municipal water supplies. But these benefits to downstream sectors are not shared with the forest sector to help defray the cost of forest conservation and management. Furthermore, the government does not take into account these important functions and linkages to ensure optimal public investment in the forest management and development. Consequently, the forest sector has continued to be severely under‐funded and understaffed and thus its capacity to effectively design and implement optimal forest policies and ensure sustainable management of the country’s vast forest resources weakened. To promote sustainable management of indigenous forests and to development the forest sector, there is need to strengthen the institutional capabilities of the forest department to create policy and institutional environment for attracting both public and private investment in the forest sector. It also needs to streamline licensing procedures and increase monitoring and enforcement activities so as to limit illegal timber logging and charcoal production. Further, there is need to attract greater participation of non‐state actors in forest management by improving forest governance structures and systems and decentralizing forest management to the local level. The latter should aim to provide a platform for mobilizing effective participation of local communities and user‐groups in indigenous forest management projects and by so doing promote prudent utilization and management of forests in the country.

15
2.0 REVIEW OF NATURAL RESOURCE AND AGRICULTURAL POLICIES IN ZAMBIA
2.1 Introduction This chapter of the report presents a review of the long‐term economic development strategies and agricultural development frameworks, policies, strategies and interventions that address poverty and food security in Zambia in the last five to ten years. Agriculture within the AU/NEPAD/COMESA framework includes the crop, fisheries, livestock and forestry sectors; and due to the inextricable linkage between agriculture and management of the natural resources or the environment, the Chapter begins with a brief review of the policies and key reforms in the natural resources sector in Zambia and outlines the natural resource programmes and strategies under the Fifth National Development Plan (FNDP). It also highlights Zambia’s forestry policy framework. The chapter lastly reviews the agricultural and food security policies. In order to discuss agricultural and food security policy, it is important to underscore that food security is not a stand‐alone sector. Food security policy is best understood as an amalgam of policies designed to stimulate agricultural production, support rural livelihoods, reduce vulnerability through safety nets, and to stimulate broad based economic growth.
2.2 Zambia Poverty Reduction Strategy & National Growth Strategy Two policy documents presume to set the framework for overall national level economic decision making. These are the Poverty Reduction Strategy Paper (PRSP), conducted as part of the World Bank’s HIPC process, and the more recent Fifth National Development Plan (FNDP). Both documents outline a pro‐poor agenda while the FNDP further emphasizes a wealth creation and growth strategy. The Poverty Reduction Strategy launched in 2002 is the central policy document meant to guide budget decisions. The PRSP outlined a pro‐poor strategy and stipulated budget expenditure and investments in essential social services. The Zambian PRSP identified three thematic areas as priority for achieving poverty reduction. Firstly, the productive sectors comprising agriculture, tourism, transport, and energy infrastructure. Secondly, there was strong emphasis on the social sector, consisting of education and health. Last but not the least, cross‐cutting issues of HIV/AIDS, gender and environment were also identified. The understanding behind the choice of these sectors was that they have the greatest positive externalities in the fight against poverty. Agriculture was accorded the highest priority because it is the sector in which the poor are concentrated and thus the main source of their livelihood. The PRSP also recognized that the main productive asset of the poor in Zambia is land and that 97% of the farmers in Zambia have no title to the land that they cultivate. Their productivity is also severely undermined by lack of assets such as oxen, storage facilities and mechanized farm implements. Hence these were included in the list of interventions for support such as credit, and market and technological information. Agricultural‐led diversification of the economy was held as the main engine for the creation and expansion of the poor’s opportunities to earn a decent income in a sustainable way. The PRSP also identified infrastructure development, particularly rural roads, and investments in the energy sector as cardinal in the diversification within agriculture. For the urban poor in the informal sector, it was envisaged that they needed to be supported so that they are able

16
to meet the basic necessities of life. Strategies and programmes under the PRSP therefore targeted both rural and urban based small scale informal operators in agriculture, mining, industry and tourism as well as larger operations in order to promote equitable economic growth and diversification (GRZ 2002). In 2007, the Zambian Government officially launched its second Poverty Reduction Strategy Paper, known as the Fifth National Development Plan (FNDP) for the period 2006–10. The FNDP is guided by the National Vision 2030 (NV2030), which has as its goal to transform Zambia into “a prosperous middle‐income country by the year 2030.” It is organized around the theme of “broad‐based wealth and job creation through citizenry participation and technological advancement” and it focuses on “economic infrastructure and human resources development” (GRZ 2006b; IMF 2007). While the FNDP recognizes the importance of continued contributions of the mining, construction and energy sectors to overall growth, its major focus or priority is on the sectors with direct pro‐poor growth impact through increased employment and income opportunities for the poor. These include rural development, agriculture, tourism, and the manufacturing sectors. The FNDP recognizes that poor physical infrastructure such as roads, electricity, irrigation, and water and sanitation has been one of the major bottlenecks holding back private sector development in the country. The FNDP also recognizes that spending on health and education in addition to improving health and social welfare is important for achieving sustainable growth. The FNDP also recognizes the cross‐cutting issues of HIV/AIDS, gender and the environment were of great importance in the development process (GRZ 2006b; IMF 2007). The FNDP recognizes the agricultural sector as being important for poverty reduction and that it should continue to take the center stage in promoting growth in the economy. The FNDP takes a holistic approach to development. It is the intention of the FNDP that growth in the agricultural sector be spearheaded by the private sector with the public sector providing coordination and facilitating functions. In terms of priorities, the FNDP will pay particular attention to the top priority programs that were identified in the agriculture sector. The top five are namely: Livestock development; Irrigation development; Agricultural infrastructure and Land Development; Agricultural Services and Technology Development; and Fisheries Development. In addition the FNDP will be consistent with the international and regional commitments such as the New Economic Partnership Development program (NEPAD) and the Comprehensive Africa Agriculture Development Programme (CAADP).
2.3 Policies and Key Reforms in the Natural Resources Sector Before 1985, Zambia had no coherent and comprehensive policy framework and an apex institution for the management and utilization of natural resources. Thereafter, important policy and institutional developments took place, which included the adoption of the National Conservation Strategy, the enactment of the Environmental Protection and Pollution Control Act (EPPCA), and the subsequent establishment of the Environmental Council of Zambia (ECZ) and the Ministry of Environment and Natural Resources (MENR) in 1992 as apex institutions. These heralded the development of major programmes, such as the National Environmental Action Plan (NEAP, 1994); the Environmental Support Programme (ESP); the Zambia National Biodiversity and Action Plan (NBSAP); the Zambia Forestry Action
17
Plan (ZFAP); the National Action Plan (NAP) for the implementation of United Nations Convention to Combat Desertification (UNCCD); and the Zambia Wetland Strategy and Action Plan, to name but a few (Government of the Republic of Zambia, 2006a). Despite these developments, the following challenges have remained and shall be addressed by the FNDP: • Overall, management of natural resources has historically been designated to sectoral
institutions with specific mandates based on sectoral legislation and policy frameworks. These frameworks are generally inadequate and inconsistent. Some legislation is outdated and tends to alienate local communities and do not adequately incorporate international environmental conventions. In this regard, the Government shall review and harmonize all sectoral natural resources policies and legislation. Focus shall be on the finalization of the National Environmental Policy (NEP) since this is an important step in addressing inconsistencies.
• The Government shall address the outstanding coordination problems in the NRM sector.
There are more than 30 institutions and agencies (public, NGOs/CBOs, and private sector organizations) involved in environment and natural resources management. The existence of the various institutions in itself makes coordination of activities in the sector a nightmare. The newly established Natural Resources Consultative Forum (NRCF) shall form the most important avenue in the Government’s effort to address some of the key challenges among all key stakeholders.
• Particular attention shall be given to addressing capacity deficiencies in the sector,
focusing on the existing scarcity of trained and appropriately experienced personnel able to carry out such specialized functions as policy development, implementation, analysis, harmonization of legal instruments, etc.; inadequate access to up‐to‐date natural resources data and information; inadequate financial resources; imprecise policy definition to guide resources management across sub‐sectors; inadequate attention to implementing policies already in place; inadequate awareness of policies and status of natural resources nation‐wide; inadequate or lack of guidelines and policies for integration of international conventions, communities, and the private sector in the overall resource management programmes; and inadequate inclusion of provincial and district administration and local authorities in natural resources management programmes.
• The Government shall implement the National Environmental Policy once it is approved by
Cabinet. To do this effectively, the Government shall facilitate the development of an Implementation Plan (IP) in the context of the Decentralization Policy. The Government shall also develop an Environmental Investment Strategic Plan (EISP) to order to ease up the process of implementing the NEP.
• The Government shall continue to facilitate forestry development by encouraging the
involvement of local people in forest businesses and ensure many people access the Forest Development Credit Facility. The Government shall also aim to strengthen the Zambia Forest College through improving the infrastructure and introducing skills development courses to support the private sector. The Forest Research Division shall be strengthened by improving the infrastructure, equipment, and staff skills to ensure availability of up to date information. Since most people who live in rural areas depend

18
heavily on forest resources, the Government shall aim to strengthen the private and informal sectors so that they contribute effectively to the national economy.
• The Government shall work towards the domestication of international environmental
conventions during the FNDP period. Zambia has acceded to over 20 international environmental conventions, and these have a bearing on NRM. The Government shall give priority to the domestication of 5 conventions that are critically relevant to Zambia namely, the Convention on International Trade in Endangered Species of Wild Flora and Fauna (CITES); Convention on Biological Diversity (CBD); United Nations Convention to Combat Desertification (UNCCD); Convention on Wetlands of International Importance (Ramsar Convention); United Nations Forum on Climate Change and the Convention for the Protection of World Heritage.
• The Government shall enhance the capacity of ZAWA to ensure that its wildlife
management mandate is undertaken more effectively. This shall be done in the context of ZAWA’s current Strategic Plan which recognizes the need for promoting commercial activities through broadening the tourism revenue generating base and the creation of sustainable partnerships. A review of any gaps and inconsistencies in the current wildlife policy and legislation shall be addressed during the FNDP.
• The Government shall facilitate the process of putting in place the new system and
structures for decentralized, collaborative, and enhanced forest management under the Ministry of Tourism, Environment and Natural Resources.
• The National Heritage Conservation Act will be reviewed and harmonized with other NRM
legislation. In addition, the Government shall develop subsidiary legislation to ensure that the Heritage Act is effective. Furthermore, the National Heritage Conservation Commission shall finalize and implement the Policy on Heritage Conservation (Government of the Republic of Zambia, 2006a).
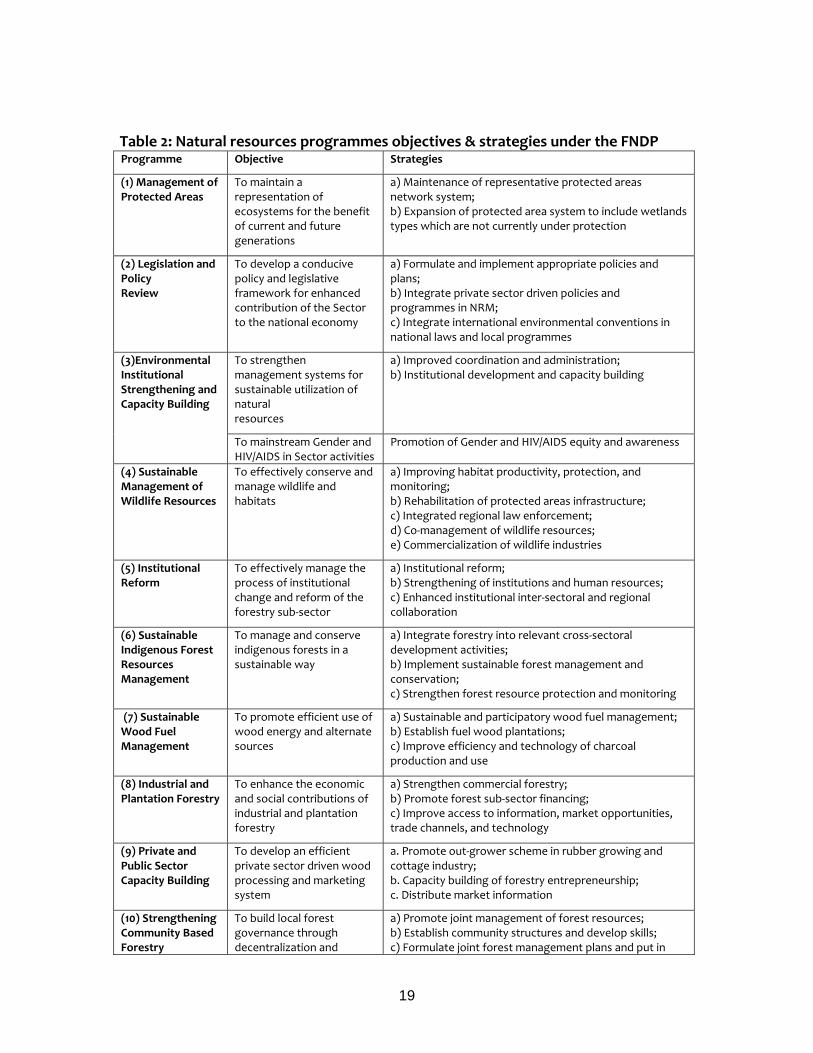
2.3.1 NATURAL RESOURCES PROGRAMMES UNDER THE FNDP The overall goal of the natural resources sector, as set out in the FNDP is “to ensure sustainable use of natural resources for the benefit of all Zambians.” In the FNDP the focus in the natural resources sector has largely been to address the key challenges elaborated above with a number of specific programme interventions. Major areas of focus under the FNDP include; Sustainable Indigenous Forest Resource Management; Sustainable Management of Wildlife Resources; Sustainable Wood Fuel Management; Industrial and Plantation Forestry Programme; Private and Public Capacity Building; Strengthening Community Based Forest Management; Agro‐Forestry and Afforestation Programme; Strengthen Forestry Education and Training Programme; Support to Forest Business Enterprises; Strengthening Forestry Research & Information Management System; Management of Protected Areas; Management of Wetlands; Sustainable Management of Heritage Resources; and Institutional Strengthening and Capacity Building. The programmes and their respective objectives and strategies for the Natural Resources Sector during the FNDP are presented in the Table 2 below.
19
Table 2: Natural resources programmes objectives & strategies under the FNDP Programme Objective Strategies
(1) Management of Protected Areas
To maintain a representation of ecosystems for the benefit of current and future generations
a) Maintenance of representative protected areas network system; b) Expansion of protected area system to include wetlands types which are not currently under protection
(2) Legislation and Policy Review
To develop a conducive policy and legislative framework for enhanced contribution of the Sector to the national economy
a) Formulate and implement appropriate policies and plans; b) Integrate private sector driven policies and programmes in NRM; c) Integrate international environmental conventions in national laws and local programmes
To strengthen management systems for sustainable utilization of natural resources
a) Improved coordination and administration; b) Institutional development and capacity building
(3)Environmental Institutional Strengthening and Capacity Building
To mainstream Gender and HIV/AIDS in Sector activities
Promotion of Gender and HIV/AIDS equity and awareness
(4) Sustainable Management of Wildlife Resources
To effectively conserve and manage wildlife and habitats
a) Improving habitat productivity, protection, and monitoring; b) Rehabilitation of protected areas infrastructure; c) Integrated regional law enforcement; d) Co‐management of wildlife resources; e) Commercialization of wildlife industries
(5) Institutional Reform
To effectively manage the process of institutional change and reform of the forestry sub‐sector
a) Institutional reform; b) Strengthening of institutions and human resources; c) Enhanced institutional inter‐sectoral and regional collaboration
(6) Sustainable Indigenous Forest Resources Management
To manage and conserve indigenous forests in a sustainable way
a) Integrate forestry into relevant cross‐sectoral development activities; b) Implement sustainable forest management and conservation; c) Strengthen forest resource protection and monitoring
(7) Sustainable Wood Fuel Management
To promote efficient use of wood energy and alternate sources
a) Sustainable and participatory wood fuel management; b) Establish fuel wood plantations; c) Improve efficiency and technology of charcoal production and use
(8) Industrial and Plantation Forestry
To enhance the economic and social contributions of industrial and plantation forestry
a) Strengthen commercial forestry; b) Promote forest sub‐sector financing; c) Improve access to information, market opportunities, trade channels, and technology
(9) Private and Public Sector Capacity Building
To develop an efficient private sector driven wood processing and marketing system
a. Promote out‐grower scheme in rubber growing and cottage industry; b. Capacity building of forestry entrepreneurship; c. Distribute market information
(10) Strengthening Community Based Forestry
To build local forest governance through decentralization and
a) Promote joint management of forest resources; b) Establish community structures and develop skills; c) Formulate joint forest management plans and put in

20
Management community based forest management
place appropriate legal frameworks
(11) Agro‐Forestry and Afforestation Programme
To strengthen the capacity of extension and research officers to actively promote agro‐forestry and afforestation activities
a) Establish on‐station and on‐farm trials; b) Promote village nurseries and establishment of woodlots; c) Formulate integrated land use plans
(12) Strengthening Forestry Education and Training
To support Zambia Forestry College and in‐service staff training
a) Rehabilitate college infrastructure and review curricula; b) Improve staff skills through staff development programmes; c) Develop and implement staff training programmes
(13) Supporting Forest Business Enterprises
To improve investment in the forestry sub‐sector and provide support to rural and urban livelihoods through sustainable forest based enterprises
a) Increase funding to Forest Development Credit Facility; b) Promote micro and small‐scale credits to rural based enterprises; c) Strengthen the informal sector; d) Promote Bee Keeping and Api‐culture
(14) Strengthening Forestry Research and Information Management System
To generate and maintain up‐to‐date forest data and information
a) Implement research programmes, inventories, and assessments; b) Conduct forest accounting and valuation; c) Rehabilitate research infrastructure; d) Establish forest database
(15) Management of Wetlands
To promote conservation and sustainable utilization of wetland resources
a) Promotion of community participation; b) Promote commercialization and value addition for wetland resources; c) Develop integrated land use planning; d) Improve regional and international collaboration; e) Improve coordination of wetlands management; f) Improve public awareness on wetland values and functions
(16) Sustainable Management of Heritage Resources
To conserve and manage national heritage
a) Encourage community participation in the conservation and management of the national heritage; b) Promote the commercialization on national heritage; c) Promote sustainable tourism development; d) Promote public awareness and education in heritage conservation; e) Strengthen research and management planning; f) Improve regional and international collaboration; g) Improve infrastructure; h) Strengthen analysis, treatment and curation of heritage materials; i) Strengthen national heritage resource protection and monitoring
Source: Government of the Republic of Zambia, 2006a
2.3.2 THE ENVIRONMENT AND NATURAL RESOURCES MANAGEMENT AND MAINSTREAMING PROGRAMME (ENRMMP)
More recently, an initiative call the Environment and Natural Resources Management and Mainstreaming Programme (ENRMMP) aiming to bring improved coordination and implementation capacity to the environment and natural resource management sector has

21
been developed. It covers the period 2008‐2012. The programme is based on the principles, priorities and objectives of Zambia’s Fifth National Development Plan (FNDP). The programme design has been determined by recognition of the urgent need to deal with key environmental issues and an acceptance that the current management capacity is insufficient for the challenges faced. The programme was formulated under the guidance of a joint task force led by the Ministry of Tourism, Environment and Natural Resources (MTENR). The task force included representatives from MTENR departments and statutory bodies and Cooperating Partners (CPs) interested in a joint mechanism for supporting the sector (Finland, Denmark, Norway and United Nations Development Programme (UNDP)). The task force’s aim was to produce a framework that would coordinate assistance to the entire sector. MTENR intends, as far as reasonably possible, to use the ENRMMP as the umbrella vehicle for all CP intervention in the Tourism, Environment and Natural Resources sector, and it is anticipated that other CPs seeking to participate in this sector may provide funding through this Programme, including for example for climate change interventions.
2.4 Forest Policy Framework In Zambia, forest policy aims at achieving sustainable management and utilization of forest resources both for the present and future generations. This basically requires that the government design and implement forest policies and strategies to ensure a sustainable flow of wood and non‐wood forest products and services in such a way as to stimulate broad based economic growth, support forest‐based livelihoods and contribute to poverty reduction. Forest policy objectives as detailed in the Zambia Forest Policy, the Forest Act of 1999 and the Zambia Forest Action Plan (2000) are as follows: • To create and develop capabilities of women, children and men at all levels of
government, the private sector and NGOs in the forest sector policy, planning, education, training, research and extensions;
• To improve the welfare of women, men and children living in rural and urban communities through equitable and complimentary participation in sustainable forest management and utilization;
• To meet, on a sustainable basis, society’s forest product requirements for sawn timber, fuel wood, poles, fodder and non‐wood forest products;
• To increase the contribution of the forest sector to the national economy through the creation of both formal and informal employment for women and men engaged in the forest sector, and the export of forest products;
• To conserve forest ecosystems and biodiversity through sustainable management for the benefits of women, men and children of both the present and future generations;
• To protect major watersheds to ensure sustenance of overall surface and underground water, climate stability, maintenance of hydro‐power supply, and other water‐based ecosystems; and
• To support sustainable agricultural production and enhance food security through improved land husbandry.

22
The key policy strategies for achieving these goals have been identified and summarized in ZFAP as (i) giving rights, responsibilities and decision‐making powers to the local people to manage forests, (ii) establishing a revolving fund to be managed by local communities; and (iii) creating incentives for farmers who are active in private/plantation forestry development, among others. The institutional arrangement and mechanisms for implementing these strategies are expected to vary from one local forest or user community to another depending on the characteristics of user‐groups or local community, the physical characteristics of forest resources to be managed, and on government regulations and policy. The nature and completeness of property rights and the monitoring and enforcement system will shape how people use and manage forests and determine the welfare and environmental outcomes from decentralized management of public forests. It is important that the capacity of local communities, private sector and government to institute, implement and support programs that enhance sustainable management of public forests are carefully assessed and not simply assumed. The basic limitation of the current institutional arrangement have already been identified and summarized in the Zambia Forestry Action Plan (2000) as (i) inadequate decentralization, (ii) inadequate sectoral coordination /inter‐sectoral cooperation, (iii) inadequate provision for joint forest management (JFM) with local communities and the private sector, and (iv) lack of legal empowerment of the local people to assume rights and management responsibilities over forest resources among many others. The first two problems points to the public doubts about the effectiveness of the Forestry Department while at the same time the Forestry Department itself feels it suffers from understaffing and budgetary shortfall to effectively manage public forests. The deficiencies and inefficiencies inherent in the two forestry agencies; namely the Forest Department and the Zambia Forests and Forestry Industries Corporation (ZAFFICO) are highlighted and discussed in the ZFAP and institutional and organizational restructuring and capacity building programs have been recommended and remedial actions provided for the Forest Bill of 1999. These institutional reforms, which include the establishment of the Zambia Forest Commission, whose major objective is to enhance institutional effectiveness and efficiency of the Forest Agency, have not been implemented. Most policymakers and analysts are pessimistic that the Forest Commission will ever be established as provided for in the Forest Bill of 1999. Due to slow progress made in implementing the ZFAP, the Forest Department recently initiated efforts to revise its objectives and goals to reflect and address emerging challenges which include mitigation and adaptation to climate change and the need to open up forest areas for ecotourism development. With respect to forest management and climate change, the Forest Department seeks to promote forest interventions that will help to address the challenges of climate change by facilitating the establishment of forest areas for carbon sequestration, building capacity with the Forest Department, local communities and private sector to identify and assess degraded forests, implement systems to reduce Greenhouse Gas (GHS) emissions from forest fires, fuel wood and deforestation, and to develop capabilities to monitor emissions and attract carbon funds into the forest sector. The second new theme relates to the need to promote ecotourism by creating an enabling environment to attract tourism investment in the forest sector and thereby increase the forest sector contribution to the national economy and employment creation. These new themes address some of the key gaps in the national forest policy and strategies that are necessary for

23
attracting investment and raising the rates of return in the forest sector, and consequently help to mitigate and adapt to the adverse effects of climate change.
2.5 Zambia’s National Agricultural Policy The Ministry of Agriculture and Cooperatives (MACO) developed its National Agricultural Policy (NAP) 2004‐2015 to up‐date its previous investment strategies and plans from 2004. The policy seeks to fulfill the Ministry’s vision for the agricultural sector “to promote development of an efficient, competitive and sustainable agricultural sector, which assures food security and increased income”. The NAP recognizes that the agricultural sector is key to the development of the Zambian economy and will be the engine of growth for the next decade and beyond. Agriculture generates between 18 ‐ 20% of the Gross Domestic Product (GDP) and provides livelihood for more that 50% of the population. The sector absorbs about 67% of the labour force and remains the main source of income and employment for the rural population. Increase in rural incomes will therefore result in overall poverty reduction and increased food security (GRZ, 2004). The main thrusts of the National Agricultural Policy (NAP) are liberalization, commercialization, promotion of public and private sector partnerships, and provision of effective services that will ensure sustainable agricultural growth. The vision for the agricultural sector recognizes the need to strengthen and expand the emerging opportunities and also deal with the challenges facing the agricultural sector. The NAP addresses several priority areas that are critical to promoting food security such as access to land, credit, and services like extension, research and markets. Several policies are articulated under the NAP. The policies and their respective objectives for the agricultural sector as presented in the NAP are summarized in Table 3 below. Table 3: Agricultural sector and sub‐sector policy objectives POLICY Overall Objective National Agricultural Policy To promote development of an efficient, competitive and sustainable
agricultural sector, which ensures food security and increased income. Sub‐Sector Policies The main sub‐sectors of the agricultural sector are Crops, Irrigation, Land‐
husbandry, Farm Power and Mechanization, Livestock, Fisheries and Cooperatives Development. Other important areas are Marketing and Input Supply, Agricultural Credit and Finance, Agricultural Training and Agricultural Information Dissemination. Of these, there are sub‐sector policies for agricultural seed under the Crops sub‐sector, Irrigation and Cooperatives Development. The following present the agricultural sub‐sector policies and the overall objectives that were formulated.
Sub‐Sector Policy Overall Objective Crops Extension
To provide efficient and effective crops extension and technical services, especially through participatory approaches, to assist farmers increase agricultural production and productivity and diversify crop production and utilization.
Crops and Soils Research
To generate and adapt technologies for increased and sustainable agricultural production and to provide high quality, appropriate, cost‐effective and efficient service to farmers.
National Seed Policy To ensure that quality seed of various crops is made available to farmers in an efficient and convenient manner with a view to increasing crop productivity and hence agricultural production.
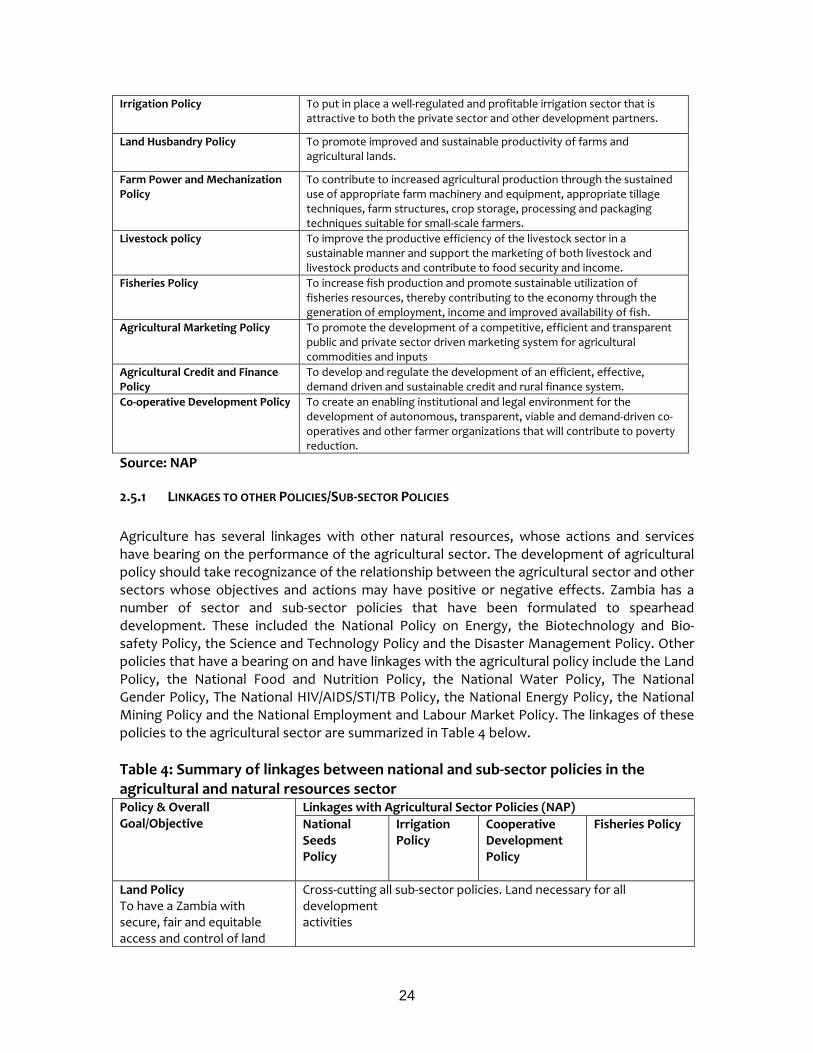
24
Irrigation Policy
To put in place a well‐regulated and profitable irrigation sector that is attractive to both the private sector and other development partners.
Land Husbandry Policy
To promote improved and sustainable productivity of farms and agricultural lands.
Farm Power and Mechanization Policy
To contribute to increased agricultural production through the sustained use of appropriate farm machinery and equipment, appropriate tillage techniques, farm structures, crop storage, processing and packaging techniques suitable for small‐scale farmers.
Livestock policy To improve the productive efficiency of the livestock sector in a sustainable manner and support the marketing of both livestock and livestock products and contribute to food security and income.
Fisheries Policy To increase fish production and promote sustainable utilization of fisheries resources, thereby contributing to the economy through the generation of employment, income and improved availability of fish.
Agricultural Marketing Policy
To promote the development of a competitive, efficient and transparent public and private sector driven marketing system for agricultural commodities and inputs
Agricultural Credit and Finance Policy
To develop and regulate the development of an efficient, effective, demand driven and sustainable credit and rural finance system.
Co‐operative Development Policy To create an enabling institutional and legal environment for the development of autonomous, transparent, viable and demand‐driven co‐operatives and other farmer organizations that will contribute to poverty reduction.
Source: NAP
2.5.1 LINKAGES TO OTHER POLICIES/SUB‐SECTOR POLICIES Agriculture has several linkages with other natural resources, whose actions and services have bearing on the performance of the agricultural sector. The development of agricultural policy should take recognizance of the relationship between the agricultural sector and other sectors whose objectives and actions may have positive or negative effects. Zambia has a number of sector and sub‐sector policies that have been formulated to spearhead development. These included the National Policy on Energy, the Biotechnology and Bio‐safety Policy, the Science and Technology Policy and the Disaster Management Policy. Other policies that have a bearing on and have linkages with the agricultural policy include the Land Policy, the National Food and Nutrition Policy, the National Water Policy, The National Gender Policy, The National HIV/AIDS/STI/TB Policy, the National Energy Policy, the National Mining Policy and the National Employment and Labour Market Policy. The linkages of these policies to the agricultural sector are summarized in Table 4 below. Table 4: Summary of linkages between national and sub‐sector policies in the agricultural and natural resources sector
Linkages with Agricultural Sector Policies (NAP) Policy & Overall Goal/Objective National
Seeds Policy
Irrigation Policy
Cooperative Development Policy
Fisheries Policy
Land Policy To have a Zambia with secure, fair and equitable access and control of land
Cross‐cutting all sub‐sector policies. Land necessary for all development activities
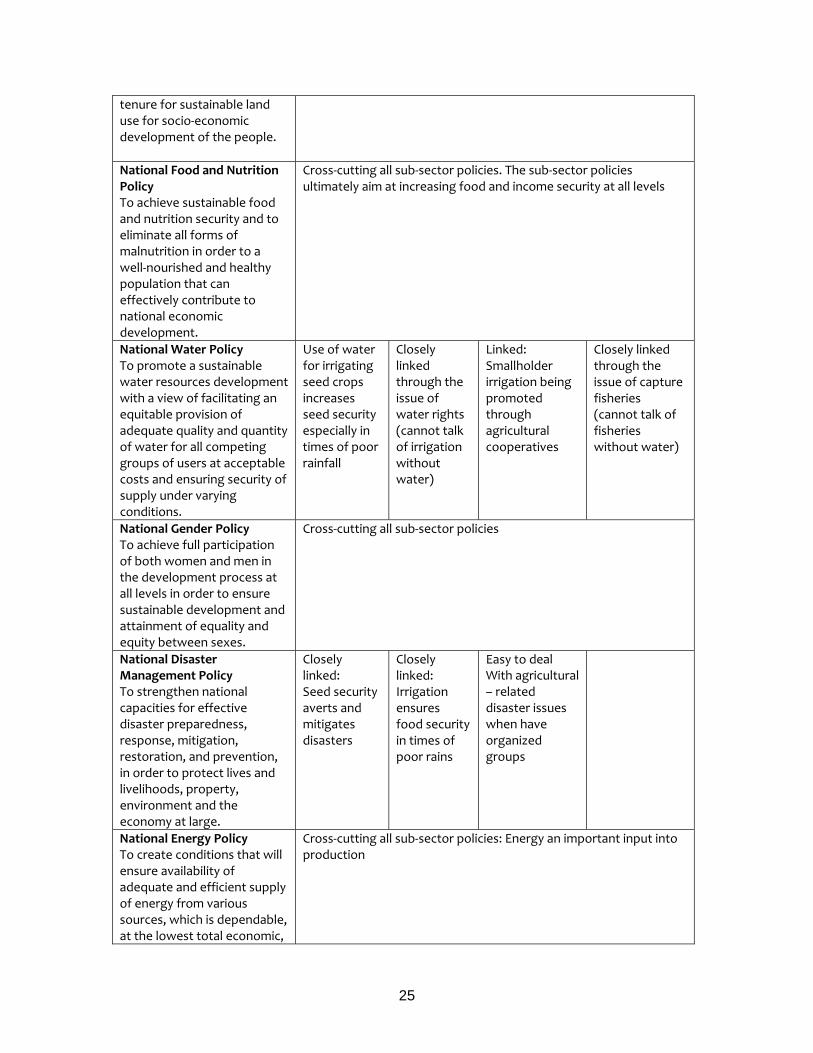
25
tenure for sustainable land use for socio‐economic development of the people. National Food and Nutrition Policy To achieve sustainable food and nutrition security and to eliminate all forms of malnutrition in order to a well‐nourished and healthy population that can effectively contribute to national economic development.
Cross‐cutting all sub‐sector policies. The sub‐sector policies ultimately aim at increasing food and income security at all levels
National Water Policy To promote a sustainable water resources development with a view of facilitating an equitable provision of adequate quality and quantity of water for all competing groups of users at acceptable costs and ensuring security of supply under varying conditions.
Use of water for irrigating seed crops increases seed security especially in times of poor rainfall
Closely linked through the issue of water rights (cannot talk of irrigation without water)
Linked: Smallholder irrigation being promoted through agricultural cooperatives
Closely linked through the issue of capture fisheries (cannot talk of fisheries without water)
National Gender Policy To achieve full participation of both women and men in the development process at all levels in order to ensure sustainable development and attainment of equality and equity between sexes.
Cross‐cutting all sub‐sector policies
National Disaster Management Policy To strengthen national capacities for effective disaster preparedness, response, mitigation, restoration, and prevention, in order to protect lives and livelihoods, property, environment and the economy at large.
Closely linked: Seed security averts and mitigates disasters
Closely linked: Irrigation ensures food security in times of poor rains
Easy to deal With agricultural – related disaster issues when have organized groups
National Energy Policy To create conditions that will ensure availability of adequate and efficient supply of energy from various sources, which is dependable, at the lowest total economic,
Cross‐cutting all sub‐sector policies: Energy an important input into production

26
financial, social and environmental cost consistent with overall national development goals. National Mining Policy To ensure that the exploitation of Zambia’s mineral resources endowment is managed on a sustainable economic, social and environmental basis and that there is an equitable sharing of the financial and developmental benefits of mining between investors and all Zambian stakeholders.
Cross‐cutting all sub‐sector policies. Closely linked to agriculture through the issue of alternative use of land for mining activities
Biotechnology and Biosafety Policy To guide the judicious use and regulation of modern biotechnology for sustainable development of the nation, with minimum risks to human and animal health, the environment and biological diversity
Closely linked: through production of improved varieties
Cooperatives to engage in agricultural practices that maintain and promote biosafety
Regulatory functions that maintain and promote biodiversity and conservation of aquatic eco‐system
Science and Technology Policy To promote and exploit science and technology as an instrument for developing an environmentally friendly indigenous technological capacity for sustainable socio‐economic development in order to improve the quality of life in Zambia.
Closely linked: Production of improved seed and improved production technology
Closely linked through production of improved irrigation technology
Linked through Cooperatives’ use of appropriate agricultural technology
Closely linked through improved fish farming technologies and sustainable management of capture fisheries
National Policy for Environment To have a national policy on environment that will support the Government's development priority to eradicate poverty and improve the quality of life of the people of Zambia.
Cross‐cutting all sub‐sector policies
National HIV/AIDS/STI/TB Policy To reduce HIV/STD transmission among Zambians and to reduce the socio‐economic impacts of
Cross‐cutting all sub‐sector policies

27
HIV/AIDS. National Decentralization Policy To achieve a fully decentralized and democratically elected system of governance characterized by open, predictable and transparent policy making and implementation processes, effective community participation in decision making, development and administration of their local affairs while maintaining sufficient linkages between the centre and the periphery.
Cross‐cutting all sub‐sector policies
National Employment and Labour Market Policy To create adequate and quality jobs under conditions that ensure adequate income and protection of workers’ basic rights.
Cross‐cutting all sub‐sector policies
Source: Adapted from Hichaambwa and Chomba, 2005
2.5.2 PRO‐POOR POLICY FRAMEWORKS In reviewing agricultural sector policies, one recognizes three broad ‘development domains’, or areas for (policy) intervention, namely, (i) reducing vulnerability; (ii) creating conditions for growth; and (iii) coping with growth. Taking these individually, each has a number of broad objectives that need to be addressed. This simple framework of intervention domains has been used by FAO’s Pro‐Poor Livestock Policy Initiative (PPLPI) to help to review and evaluate livestock sector policies. The table below presents a summary of some of Zambia’s Agriculture & Natural Resources policies in the three development domains based on the PPLPI framework. Table 5: Summary of various agriculture & natural resources policies in Zambia
PRSP (2002‐2005) & FNDP (2006‐2010) POLICIES REDUCING VULNERABILITY
POLICIES CREATING CONDITIONS FOR GROWTH
POLICIES SUSTAINING GROWTH
RISK COPING POLICES National Disaster Management Policy
ACCESS TO BREEDS National Agricultural Policy The National Seed Policy The Biotechnology and Bio‐safety Policy
TRADE Industrial, Commercial and Trade Policy
ACCESS TO LAND The Land Policy National Policy for the Environment
ACCESS TO EXTENSION AND ANIMAL HEALTH SERVICES National Agricultural Policy Agricultural Support Programme Smallholder Livestock Investment
RESEARCH National Agricultural Policy

28
Project (SLIP)2007
ACCESS TO WATER National Water Policy The Irrigation Policy and Strategy 2004 National Irrigation Plan 2004
ACCESS TO CREDIT National Agricultural Policy
ENVIRONMENT National Policy for the Environment National Policy on Wetlands National Forest Policy Policy for National Parks and Wildlife in Zambia
ACCESS TO INPUTS Fertilizer Support Programme Food Security Pack Agricultural Input Marketing Plan (AIMP)(2004
ACCESS TO MARKETS National Agricultural Policy Food Reserve Agency (FRA) Agriculture Marketing Development Plan (AMDP)(2004
FOOD SAFETY/ QUALITY National Agricultural Policy The National Food and Nutrition Policy
2.6 Food Security Programs: Donor and Government Policy in Action This section turns now from written policies and objectives to the actual programs being implemented by the Zambian Government, with donor funding. In this way, we can assess the ‘implicit’ agriculture and food security policy, that is, what is actually being done, rather than what is stated as a goal. Earlier we noted that food security is not a stand alone sector. State action in many spheres is needed to address food security, including improved health care, nutrition education, sanitation, provision of basic infrastructure, among others. Much of what the state does can affect food security. However here we look in a more focused manner at what the state is doing to address food access, availability and vulnerability reduction. This section focuses on two of the most critical roles the Zambian state has traditionally sought to play in promoting food security, first, implementing safety nets programs in order to reduce vulnerability, and second, to promote rural productivity through provision of agricultural inputs and extension services to smallholders. Here we briefly review what the Government is doing, often with the support of donors, to promote food security.
2.6.1 STATE ACTION TO REDUCE VULNERABILITY AND SUPPORT LIVELIHOODS The Government of Zambia has established Social Protection Measures to improve the livelihoods of vulnerable groups in society by enhancing their productivity and increasing self reliance. The Government has established a series of programs designed to reduce vulnerability to food insecurity and extreme poverty. The four pillars of the programmes include: public works, agricultural inputs distribution, targeted nutrition and direct transfers for the destitute and HIV/AIDS‐affected. Extension Service Provision Historically, a core part of the MACO’s mission has been to provide extension services to smallholder farmers. In the past particularly in 1960s and 70s, the Ministry loomed large within the public sector, with an extensive field level presence throughout the country and a relatively well resourced research and extension service. However, the trend toward economic liberalization in the nineties led to a sharp reduction in its role and size. The extension services were particularly hard hit, and the budget and staffing allotted for these

29
services have declined sharply. Still, the Ministry sees its extension services as a core part of its mission and means to boost the productivity of smallholders. The extension services, and the Fertilizer Support Programme (subsidized input programme), are seen by the Ministry as important tools to promote food self sufficiency. The major gaps or challenges the extension and research services need to address include development of productivity‐enhancing techniques for farmers at different levels of resources, drought‐resistant crops where needed, nutritional issues, marketing, storage and processing, and soil‐conservation. Livestock, fisheries and agro‐forestry also need to be covered by the advisory services. Food Security Pack The Food Security Pack was introduced in November 2000 with the aim of empowering vulnerable but viable farmers who had lost productive assets due to recurrent adverse weather conditions and the negative impact of Structural Adjustment Reforms that reduced the accessibility by small farmers to yield enhancing inputs and services. As a Social Safety Net programme under the Ministry of Community Development and Social Services, it is aimed at improving household food security of vulnerable households by providing them with the means of economic growth and poverty reduction. The main objective of the Pack is to empower the targeted households to be self sustaining though improved productivity and household food security and thereby contribute to poverty reduction. The government provides inputs (seed and fertilizer) to poor households. Although this programme was originally conceived as a livelihoods development strategy to shift farmers from subsistence to surplus production, it has now become a core part of Zambia’s social safety net. Fertilizer Support Programme Since credit is acknowledged to be in short supply, and it is often very costly when available, the Government has attempted to fill the vacuum of lack of access by providing input credit to farmers. Under the Fertilizer Support Programme, the Government has been providing fertilizer and improved seeds to many vulnerable but viable smallholders. The government provides a small loan repayable in‐kind consisting of seed for a cereal (i.e. maize, millet, rice), plantings for tuber (sweet potato, cassava) and seed for a legume (groundnuts, beans) and to farmers identified as vulnerable. In the past few years, millions of farmers have received input packages on credit, and this has had a positive effect on the availability of and access to food for needy households. This program is not without its critics. There has been considerable debate about the sustainability of input subsidies and its impact on the private sector. In spite of these issues, the vast majority of Zambians widely support fertilizer subsidies for the majority who cannot afford to use inorganic fertilizer. FRA ‐ National Strategic Grain Reserves The Government created the Food Reserve Agency (FRA) with the aim of guaranteeing that sufficient maize is always available within national borders to assure food security. The agency was seen as an instrument for assuring food security not as a means of market management. Its main function was to make good national shortfalls in the availability of maize that was expected to result from an inability on the part of the newly emergent private sector to supply the market fully. Thus, its objective was, in effect, to ensure that supply would be similar to that under a well functioning and stable domestic market. Even if managed without political interference and with the sole aim of ensuring stability in the availability of maize, the activities of the FRA inevitably affect the balance between domestic supply and demand and therefore domestic prices. Indeed, if they were not to affect the
30
supply‐demand balance, the Agency would have no obvious role. Thus, the FRA is necessarily used as an instrument for market management. Once this is recognised, it is clear that its activities must be managed with a high level of technical efficiency if the results of its intervention are to be replicated in a well functioning free‐market. Critics observe that the existence of the FRA deters the development of the private trade, which, if left to operate in a free market, with no government intervention, would have the incentive, and probably the capacity, to import whatever maize and other foodstuffs are necessary to meet domestic demand. Thus, the FRA’s activities tend to perpetuate the problem for which it was seen as a temporary solution. The Disaster Management and Mitigation Unit (DMMU) Under the Vice‐Presidents office, a Disaster Management and Mitigation Unit (DMMU) is tasked with coordination responsibilities for all sectors that deal with food security. It coordinates and networks with all governmental departments, UN organizations, Non‐governmental Organizations and private institutions to minimize overlaps and duplication of efforts in the implementation of food security programmes. The DMMU therefore plans and coordinates the management of national disasters including food shortages disasters. Further, it also advises government on the extent of the disasters and solicits for funds and donations from the international community when a crisis is envisaged. It also coordinates and facilitates all national crisis management projects, especially those that are related to food security. Priority actions to emergency responses include provision of adequate food relief, access to water, health and nutrition, agriculture, education and support for special protection of children and other vulnerable sections of society. The Famine Early Warning System The Famine Early Warning System (FEWS) is also active in Zambia. FEWS, a USAID‐funded activity, has been monitoring food insecurity conditions in 20 African countries including Zambia for over fifteen years. FEWS personnel maintain watch on Zambia’s “food balance sheet” comprised of statistics concerning several variables including local crop estimates, its marketing, indicators of local shortages, livelihood activities in the rural sector, and patterns of cross‐border maize trade. Though not a Government of Zambia program, it provides information to the Government which is central to its emergency planning and preparedness. Zambia Vulnerability Assessment Committee (ZVAC) Independent and objective vulnerability assessments are very important for adequate and timely responses to disasters. These assessments are also used to identify populations at risk of severe food shortages and famine. There is a Vulnerability Assessment Committee in Zambia and is comprised of technical specialists representing most of the key players in food security. These include the Ministry of Agriculture, Central Statistics Office, Meteorological Department, Disaster Management and Mitigation Unit, National Food and Nutrition Commission, Civil Society and NGOs, NEWU, CARE, World Food Programme, FEWS and other donors like UNICEF, OXFAM, and the Red Cross Society. The Vulnerability Assessment Committee is multi‐sectoral in nature and therefore, coordinates institutions dealing with food security issues and ensures full participation of various institutions in vulnerability assessments. Further, it also advises policy makers as well as donors and other stakeholders on the status of food security and measures to improve it.

31
3.0 ANALYSIS OF FOREST RESOURCES AND AGRICULTURAL INFORMATION USING ILUA DATABASE
3.1 Introduction This chapter presents some of the indicators that were generated from the ILUA database, particularly those in the household portion of the inventory. Aside from forest status and use data, the ILUA survey collected a range of data on non‐forestry variables such as cropping, livestock, and related environmental problems (see Annex 1 for field forms and questionnaires used in survey). This section focuses on analysis of policy‐related information on forestry, agriculture (mainly crop and livestock) from the household survey results. This chapter discusses land use and especially the distribution of competing land uses before providing more analysis of forests and woodland resources in terms of biomass and biomass distribution across land tenure regimes. The current forest management practices and how these practices influence forest cover and volume and biomass distribution across land tenure regimes and land ownership types are also discussed. Further, the chapter provides some estimates of carbon stocks and estimates on actual and potential carbon sequestered by forests as well as the amount of carbon credits that can be generated as financial flows to promote successful community or joint forest management projects in Zambia. Forest and woodland resources are also important sources of livelihoods and income for local communities. The utilization of forest resources for subsistence and commercial purposes is examined to generate management information that can help forest management decision‐making. The chapter also discusses the crop and livestock production activities among the surveyed households as well as household access to resources and services such as extension and veterinary services. The analysis of the data is presented in the context of its importance as a source of livelihoods, food security and poverty reduction as outlined earlier in Chapter One.
3.2 Land Use by Land Classification Data from the Integrated Land Use Assessment (ILUA) is used to analyze land use and forest resources in Zambia. The ILUA survey applied the Global Forest Resources Assessment approach developed by the United Nations Food and Agricultural organization (FAO) to classify different land uses in Zambia. This approach classifies land uses into four broad categories; namely Forests, Other Wooded Land, Other Land, and Inland Water. Forests are further subdivided into natural and assisted natural regeneration (which includes evergreen forests, semi‐evergreen and deciduous and other forest types) and forest plantation. The second category is Other Wooded Land which includes shrubs and wooded grasslands while Other Land captures barren lands, grasslands, marshland, managed lands under annual and perennial crops, pasture and fallow land, and built up areas. The last category captures inland water bodies (lakes, rivers, dams).

32
Table 6: Forest Coverage and Forest Biomass in Zambia Main Land Cover Classes Hectares Percent (%) Total Forest Area 49,968,170 66.4% Total Other Wooded Land 6,054,652 8.0% Total Other Land 15,771,081 21.0% Inland Water 3,467,497 4.6% Total (Hectares) 75,261,400 100.0% Total Biomass (million metric tonnes) 5,500 Na Total Carbon (million metric tonnes) 2,600 Na Source: ILUA data Table 6 above shows the pattern of land use in Zambia using ILUA data collected from 221 tracts across the country. The total land area of Zambia is approximately 75,261,400 hectares, of which approximately 49,968,170 hectares are under forest cover. This shows that the country has significant land under forest cover (66.4 percent), mainly dominated by semi‐evergreen forests, which account for 45.4 percent of the total land followed by deciduous forests which account for 19.7 percent (see Table 7 below). Evergreen forests only account for 1.1 percent of the total land. The country also has vast wooded grasslands which occupy 6.5 percent and shrubs and thickets which occupy 1.5 percent of the total land area. When these are added to forests, it brings the total land area under forests and woodlands to 74 percent. Other lands account for 21 percent of the total land, of which grasslands and marshlands account for 8.1 percent and 1.8 percent respectively or a total of 9.9 percent of the country’s total land area. Urban and rural development accounts for only 0.7 percent of the total land. It should be mentioned that these are tract level areas and that although Zambia obviously has urban areas, the stratified sample units of ILUA did not fall within any urban centers, since they are a rare feature. A higher sampling intensity would have captured them.
Table 7: Distribution of land by land use category Land Use Total Tract Area Percent Deciduous Forest 85.5 19.7% Evergreen Forest 4.7 1.1% Semi‐evergreen Forest 196.5 45.4% Other natural Forest 0.8 0.2% Wooded Grassland 28.2 6.5% Shrubs/Thickets 6.7 1.5% Grassland 35 8.1% Lakes 15.5 3.6% Marshland 7.7 1.8% Annual Crops 27 6.2% Perennial Crops 1.4 0.3% Fallow 13.7 3.2% Barren Land 0.1 0.0% Pastures 2.7 0.6% Rivers 4.5 1.0% Rural built‐up areas 3.2 0.7% Urban built‐up areas 0.04 0.0% Total 433.24 100.0%
Source: ILUA data
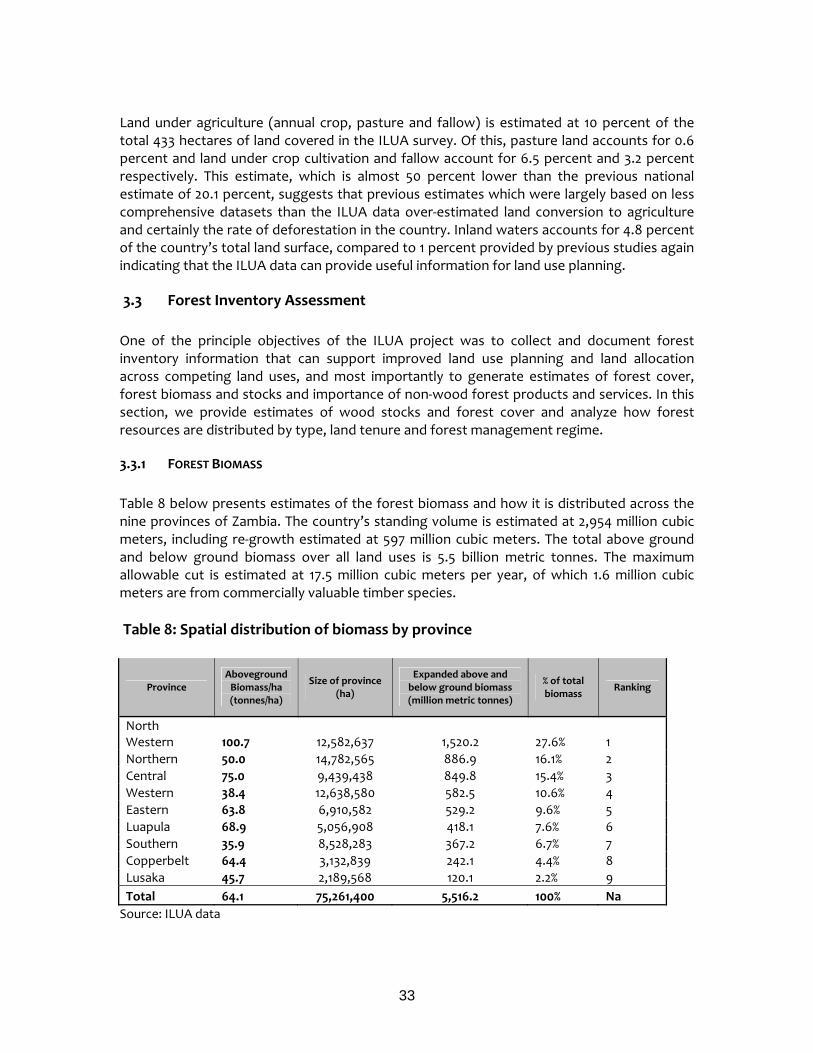
33
Land under agriculture (annual crop, pasture and fallow) is estimated at 10 percent of the total 433 hectares of land covered in the ILUA survey. Of this, pasture land accounts for 0.6 percent and land under crop cultivation and fallow account for 6.5 percent and 3.2 percent respectively. This estimate, which is almost 50 percent lower than the previous national estimate of 20.1 percent, suggests that previous estimates which were largely based on less comprehensive datasets than the ILUA data over‐estimated land conversion to agriculture and certainly the rate of deforestation in the country. Inland waters accounts for 4.8 percent of the country’s total land surface, compared to 1 percent provided by previous studies again indicating that the ILUA data can provide useful information for land use planning.
3.3 Forest Inventory Assessment One of the principle objectives of the ILUA project was to collect and document forest inventory information that can support improved land use planning and land allocation across competing land uses, and most importantly to generate estimates of forest cover, forest biomass and stocks and importance of non‐wood forest products and services. In this section, we provide estimates of wood stocks and forest cover and analyze how forest resources are distributed by type, land tenure and forest management regime.
3.3.1 FOREST BIOMASS Table 8 below presents estimates of the forest biomass and how it is distributed across the nine provinces of Zambia. The country’s standing volume is estimated at 2,954 million cubic meters, including re‐growth estimated at 597 million cubic meters. The total above ground and below ground biomass over all land uses is 5.5 billion metric tonnes. The maximum allowable cut is estimated at 17.5 million cubic meters per year, of which 1.6 million cubic meters are from commercially valuable timber species. Table 8: Spatial distribution of biomass by province
Province Aboveground Biomass/ha (tonnes/ha)
Size of province (ha)
Expanded above and below ground biomass (million metric tonnes)
% of total biomass
Ranking
North Western 100.7 12,582,637 1,520.2 27.6% 1 Northern 50.0 14,782,565 886.9 16.1% 2 Central 75.0 9,439,438 849.8 15.4% 3 Western 38.4 12,638,580 582.5 10.6% 4 Eastern 63.8 6,910,582 529.2 9.6% 5 Luapula 68.9 5,056,908 418.1 7.6% 6 Southern 35.9 8,528,283 367.2 6.7% 7 Copperbelt 64.4 3,132,839 242.1 4.4% 8 Lusaka 45.7 2,189,568 120.1 2.2% 9 Total 64.1 75,261,400 5,516.2 100% Na
Source: ILUA data

34
These estimates of forest inventory indicates that the country has sufficient stocks of wood resources to meet its current and future needs for fuelwood and construction timber and sustainable flow of other forest products and services. It is also estimated that households consume 6.359 million cubic meters per year, of which firewood and charcoal account for 85 percent of the total wood extraction and construction poles and round timber harvested for household and industrial use accounts for the remainder (Puustjarvi, 2005). This level of extraction is only 36 percent of the Maximum Allowable Cut, meaning that great potential exists to develop the forest sector and to increase its contribution to the country’s economic growth and poverty reduction efforts. It should be noted, however, that although forest resources appear to be physically abundant, wood resources are not geographically evenly distributed and this has resulted to localized depletion and scarcity of wood resources, especially for charcoal production, around urban towns and cities which is quite evident. Table 8 above shows that the Northwestern Province which is the second largest province in terms of land size has the largest total forest biomass estimated at 27.6 percent of the total country biomass, followed by Northern, Central and Western. Copperbelt and Lusaka provinces, which are also the most urbanized provinces, have the smallest share of the country’s biomass. In fact, most urban provinces have exhausted their production forests and the remaining forests are either for protection or young re‐growth forests with no critical wood biomass for charcoal production. At present Lusaka and Copperbelt Provinces are the net importers of charcoal from other provinces mostly from central province. While this will provide estimates and distribution of forest biomass, it is important to note that these estimates, like several previous studies, do not include biomass inventories of grass and other herbaceous plants. Herbaceous plants are an important feature of the country’s forest ecosystem and as such should be taken into account when analyzing ecological functions of forests and woodland resources as well as in the design and implementation of forest management practices. For instance, herbaceous plants play a critical role in igniting wild forest fires and therefore should be considered in fire prevention and control strategies. They are an important source of myriad forest foods, herbs and dyes, thatching grass, folder and forbs for livestock and wildlife. They also provide soil cover, prevent soil erosion and play an important role in climate change moderation as carbon sinks and sequesters. Therefore, there is need for future land use and forest inventory assessments to document herbaceous plant biomass, and estimate carbon stored and sequestered by such plants and further assess the socio‐economic importance of herbaceous plants to rural livelihoods and to the wildlife and livestock sectors. We expect that future ILUA surveys will generate information to fill these gaps in biomass computations.
3.3.2 DISTRIBUTION OF FORESTS BY DBH CLASS Zambia’s forests can be classified under four vegetation categories namely evergreen natural forests, semi‐evergreen, deciduous natural forests and the remainder classified as other natural forests. While biomass statistics show great potential for forest development, it is also important to examine the condition of these forests. In this section, we analyze the distribution of wood biomass by Diameter at Breast Height (DBH) class and how these are distributed across vegetation types and land tenure (Figure 5 and Table 9).

35
The distribution of forests by DBH is presented in figure 5 and DBH distribution across vegetation types in table 9. The graph shows that forests in Zambia are predominately secondary forests, with fewer than 27 percent of the forests in DBH classes that characterize primary forests. About 74 percent of forests are comprised of trees with DBH falling between 7 and 30 cm. Of these, 42 percent fall in the middle DBH bracket (20 =<DBH<30). The mean DBH is estimated at 25 cm and is fairly consistent with Chidumayo (1994) estimate of 25.54. Figure 5: Distribution of forests by tree stem size (DBH)
Forests by DBH distribution
0.0%5.0%
10.0%15.0%20.0%25.0%30.0%35.0%40.0%45.0%
DBH
shar
e
all forests
all forests 11.7% 19.9% 41.7% 18.2% 8.6%
7 =<DBH<10 10 =<DBH<20 20 =<DBH<30 30=<DBH<40 40=<DBH
Source: ILUA data Table 9: Number of stems in each DBH class by forest type
Forest Type 7 =<DBH<10 10 =<DBH<20 20 =<DBH<30 30=<DBH<40 40=<DBH Total %
Deciduous Forest 510 946 2448 989 603 5496 23.7% Evergreen Forest 44 101 256 93 50 544 2.3% Other Natural Forest 11 7 21 6 9 54 0.2% Semi‐evergreen Forest
1647 3011 7503 3383 1580 17124 73.8%
All 2212 4065 10228 4471 2242 23218 100.0%
Source: ILUA data In terms of DBH distribution across forest or vegetation types, the ILUA data above shows that the semi‐evergreen forests dominate the country’s forest cover accounting for 73.8 percent of the total forest area. Deciduous forests follow with 23.7 percent and then evergreen forests with 2.3% and other natural forests with less than 1 percent. There is no significant variation in tree diameter across forest types. Most forests are secondary forests that have experienced either selective harvesting for timber, construction poles, fuel wood or other harvesting of forest products (i.e., caterpillars) or were once clear‐cut (traditional and modern agriculture) and have gone through the process of natural regeneration. Managing these forests requires scientific knowledge about them, tree species and diversity, and species specific regenerative capabilities under varying environmental or ecological

36
conditions. For old primary forests, which account for less than a third of the total forests, management approaches and strategies depend on the objectives and outcomes envisaged from forest management.
3.3.3 DISTRIBUTION OF FOREST BY LAND TENURE Table 10 shows the distribution of DBH by land ownership. Land ownership is divided into four categories. Some forests are owned by individuals, firms or industries and other private entities such as non‐governmental organizations, considered under private ownership. Other tracts of forests are under the oversight of traditional leaders or customary authorities, while others are owned directly by the State. Those forests that could not be classified under the other land ownership categories were classified as “unknown”. One would expect that forests owned by the State, which largely are protected forests to be better managed and to have greater stem sizes than open access forests. In fact the data show a higher proportion of larger stemmed forests in State forests compared to privately owned forests. However, customary owned land appears to have the highest the greatest stem size of all, which could be explained by inaccessible tracts of forests where extraction costs are simply too high. Generally, land classified as “unknown” falls under customary tenure. Using this assumption, when “unknown” and customary owned tree stems are combined, they yield a lower number of stems above 40cm (8.9%), leaving State owned forests with the highest proportion of larger sized stems. Table 10: Number of stems in each DBH class by land tenure type
Land Tenure 7 =<DBH<10 10 =<DBH<20 20 =<DBH<30 30=<DBH<40 40=<DBH
Private Individual 9.4% 20.0% 43.9% 17.0% 9.8% Private Industries 10.7% 18.6% 46.4% 17.5% 6.8% Private Others 15.7% 24.1% 36.4% 18.6% 5.1% Public State 10.9% 16.8% 40.2% 19.6% 12.6% Customary 9.0% 17.5% 45.5% 19.3% 8.6% Unknown 6.1% 12.2% 45.1% 21.7% 14.9% All State 10.9% 18.1% 40.9% 18.9% 11.2% All Customary 8.9% 17.2% 45.5% 19.4% 8.9%
Source: ILUA data Since all land under private leasehold tenure are classified as State Land, all privately owned forests (individual, industry, and other private) are added and classified as State land and the remainder of the forestland classified as customary forestland (as “unknown” typically falls under customary owned land). When combined, the differences in DBH between land under legal title (all state) and customary ownership (all customary) diminishes, meaning that type of land ownership does not significantly influence age distribution of forests across land tenure. Further, Figure 6 below shows volume per hectare in forests across the three land tenure systems. As shown, volume per hectare under customary and public tenure is nearly the same. There does appear to be a difference between these two systems and private

37
tenure which has, on average, seven cubic meters per hectare less volume. This suggests that land tenure has some effect on forest volume, when one compares State owned forest and customary owned forest to privately owned forests. This could be because no such incentives as conservation easements currently exit to encourage forest conservation on privately owned lands. Sustainable management of natural forests does depend, to a large extent, on the land tenure system. Figure 6: Forest volume per hectare by major land tenure system
45.4 44.6
38.3
0.0
10.0
20.0
30.0
40.0
50.0
Public Customary Private
land tenure
m3/
ha
Source: ILUA data Figure 7 below shows the distribution of forest by land tenure system. It is important to note that although the Land Act vests power over land of the President, most of the land in Zambia (62%) is practically owned and managed by customary authorities. Of the total forestland, about 30,751,000 hectares are located on customary land and only 11,824,000 hectares are located on State land. Privately owned forests with legal land titles, accounting for 5,283,000 hectares, fall under State Land because no legal title is issued on customary land. Therefore all pieces of customary land that are demarcated and allocated with title deeds automatically cease to be administered as customary land and become State Land. This has unfortunately caused fragmentation of customary land, as conversion of customary to leasehold tenure continues to increase as State Land available for allocation diminishes. Below, we examine the distribution of forests not only by State and customary, but also to further split State land by type of land use (individual, industrial, others uses).

38
Figure 7: Percentage distribution of forest area by land tenure system
Source: ILUA data Figure 7 shows that most forests are located on customary land (61.5%) and are largely under open access condition. Only 23.7 percent of the forests are on State lands, which encompass such land as national forest reserves, national parks and forest areas of historical and cultural importance managed by the National Heritage Conservation Commission (NHCC). Natural forests owned and managed by individuals account for 7.2 percent, those managed by firms for industrial purposes 1.3 percent and other private institutions such as NGOs 2.1 percent. This means that natural forests that are privately owned account for 10.6 percent of the total forest area, those under customary authorities 65.74 percent (including local forest reserves and forests classified as “not known”) and those managed by government accounting for 23.7 percent. Clearly, most forests are located on customary land, and optimal design and implementation of forest regimes should seriously take this fact into account for the regime to be successful. This indicates that there is great potential to increase private sector investment and participation in forest management and further that incentives should be well targeted to attract investment and harness the potential in the forest sector for national development. (See Figure 8 below)

39
Figure 8: Forest reserves in relation to land tenure categories
Source: ILUA data Previous studies have shown that the regeneration potential of these forests, especially miombo woodlands, is quite high and is largely dependent on the fire regime. Controlling wild forest fires and applying appropriate and species specific silvicultural practices and good rainfall patterns are some of the key factors in managing natural regeneration of forests and woodlands in the country. Given high regeneration potential of most tree species, the country can improve the status of these forests and increase forest covers at reasonably low cost per hectares. The country can derive significant benefits from improved forest management and carbon sequestration, but this potential can only be realized by bringing large tracts of forestland current under open access and on customary land under formal and sustainable management. The major objective of long‐term forest management, among others, should be to secure steady supply of wood and non‐wood forest products in ways that enhances rural livelihoods and promotes poverty reduction and economic development. In this context, forest policies and strategies should encourage community based forest management especially for those forests on customary land and further to reclassify forests and ensure that forest reserves are properly sited on lands where conversion of forestland to other competing uses is lowest. For instance, all forest reserves located on lands highly valued for urban development, agriculture and mining development are threatened and face a higher probability of being cleared to pave way for development. And since most forests
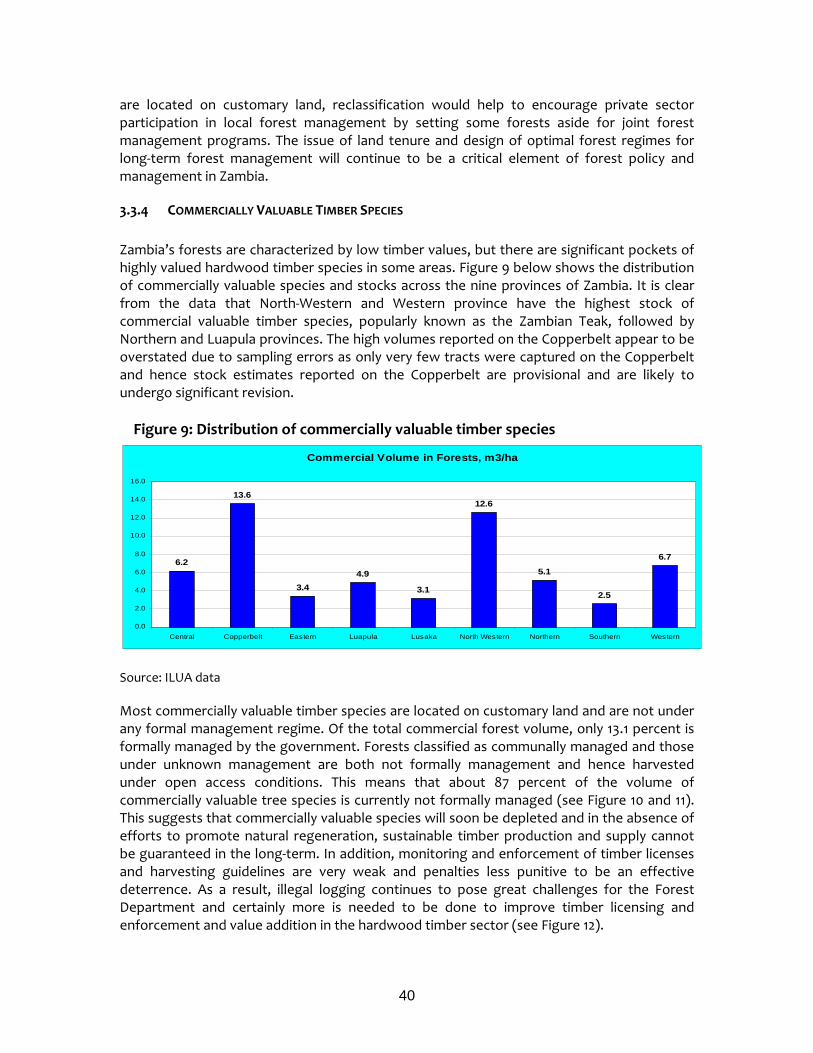
40
are located on customary land, reclassification would help to encourage private sector participation in local forest management by setting some forests aside for joint forest management programs. The issue of land tenure and design of optimal forest regimes for long‐term forest management will continue to be a critical element of forest policy and management in Zambia.
3.3.4 COMMERCIALLY VALUABLE TIMBER SPECIES Zambia’s forests are characterized by low timber values, but there are significant pockets of highly valued hardwood timber species in some areas. Figure 9 below shows the distribution of commercially valuable species and stocks across the nine provinces of Zambia. It is clear from the data that North‐Western and Western province have the highest stock of commercial valuable timber species, popularly known as the Zambian Teak, followed by Northern and Luapula provinces. The high volumes reported on the Copperbelt appear to be overstated due to sampling errors as only very few tracts were captured on the Copperbelt and hence stock estimates reported on the Copperbelt are provisional and are likely to undergo significant revision. Figure 9: Distribution of commercially valuable timber species Source: ILUA data Most commercially valuable timber species are located on customary land and are not under any formal management regime. Of the total commercial forest volume, only 13.1 percent is formally managed by the government. Forests classified as communally managed and those under unknown management are both not formally management and hence harvested under open access conditions. This means that about 87 percent of the volume of commercially valuable tree species is currently not formally managed (see Figure 10 and 11). This suggests that commercially valuable species will soon be depleted and in the absence of efforts to promote natural regeneration, sustainable timber production and supply cannot be guaranteed in the long‐term. In addition, monitoring and enforcement of timber licenses and harvesting guidelines are very weak and penalties less punitive to be an effective deterrence. As a result, illegal logging continues to pose great challenges for the Forest Department and certainly more is needed to be done to improve timber licensing and enforcement and value addition in the hardwood timber sector (see Figure 12).
Commercial Volume in Forests, m3/ha
6.2
13.6
3.44.9
3.1
12.6
5.1
2.5
6.7
0.0
2.0
4.0
6.0
8.0
10.0
12.0
14.0
16.0
Central Copperbelt Eastern Luapula Lusaka North Western Northern Southern Western

41
Figure 10: Commercially valuable timber by forest management regime
Source: ILUA Figure 11: Forest volume in relation to area under formal management plans
Source: ILUA
13.1
57.3
29.5
0 10 20 30 40 50 60 70
Com Vol in Formal Management Plan
Com Vol in TraditionalManagement Plan
Com Vol in Not KnownManagement Plan
%

42
Figure 12: Forest Volume in relation to Household Compliance with Forestry Legislation
Source: ILUA There is great potential to attract investment in commercial forest extraction and management in the country, but more data on timber volumes and the biological growth functions of commercially valuable tree species needs to be compiled and analyzed to provide more detailed insights on how best to manage natural forests to ensure sustainable timber supply and reduce ecological impacts of timber harvesting. The potential to bring open access forests under some formal forest management exists and government is encouraged to provide market‐based incentives to promote sustainable timber supply whilst safeguarding the ecological integrity of the forest resource and its ecosystem functions. It is therefore important that government escalates its efforts and commitment to forest reclassification and bring more forests currently under open access under formal management, and further design appropriate policies and programs to promote long‐term forest management in the country. Such efforts should be derived from a comprehensive land use planning exercise with harmonized and mutually consistent cross‐sectoral land use plan. For forestland reclassification to be successful government needs support through active participation of traditional authorities and local communities in the reclassification process so that the new boundaries and forest management regimes established are legitimate and based on consensus.

43
3.3.5 DISTRIBUTION OF FORESTS BY PROTECTION STATUS We have shown that over two‐thirds of the forests are located on customary lands. This also includes all local forest reserves, which as the name suggests, are located on customary land and are managed as production forests. In order to clearly understand the opportunities that exist in the forest sector, both in terms of promoting sustainable supply of forest products and services through proper utilization and management of forest resources, we present information on the extent to which forests are formally managed. Figure 13 below shows the distribution of forests by protection status. It shows that the proportion of forests that are formally managed as protected forest is only 21.6 percent of the total forests in the country. Of these, 6.5 percent are strictly national forest reserves managed as protected forests and no harvesting of wood resources is permitted on these forests. Protected forests also include forests in national parks (9.2%), areas designated as critical biological hotspots (5.5%) and other protected forest areas of historical and cultural significance (0.3%). Forests managed for production (local forests reserves) account for 23.7 percent of the total forests and those managed for multiple uses account for only 16.9%. This means that the extent of forests managed for production, including local forests reserves account for 40 percent of the total forests in the country. Significant amounts of forests (38%) were classified as either of unknown protection status or as falling under other forest protection regimes not specified in ILUA survey. Figure 13: Area Distribution of Forests by Protection Status
Source: ILUA data Clearly, there is a need to conduct comprehensive forest inventory surveys and forest reclassification to ensure that all forests are properly classified and boundaries clearly mapped. This will help to identify which forests to manage for what purpose and in determining the appropriate mix of institutional arrangements that will guarantee sustainable flow of forest benefits to the economy while at the same time promoting

44
environmental sustainability. A comprehensive land use mapping will further enable government to efficiently allocate land to various land uses and to geographically locate forest reserves in places where land values are consistent with long‐term forest management. In the last few decades, the country has witnessed increasing demand for land for agriculture and urban development, and a number of forest reserves have been cleared to pave way for agriculture and urban development. More forests are currently threatened as mineral exploitation and mining activities intensify and at present levels of development, no amount of political will would support restricting development benefits from mining to preserve a natural forest. It is therefore critical to take into account the distribution of mineral resources and anticipate future mineral development when establishing protection forests, and to adopt a long‐term perspective of land use planning and forest management. It is also clear from the ILUA data that large tracts of forestland are currently not classified under any protection status, ownership and land tenure regime. It is shown that 21.8 percent of forests are not classified under any protection status, and only 23% percent of all forests in the country have a formal management plan that is being implemented (Table 11 below). The Zambian government, through the Ministry of Tourism, Environment and Natural Resources is expected to increase the extent of the forest estate and promote long‐term forest management by reclassifying these forests and bringing them under formal sustainable management. Sustainable management can be achieved by implementing different forest management regimes that reflect the features of the forest resource to be managed and the socio‐economic dictates surrounding the forest resource. Given that over‐two thirds of the country’s land is under customary tenure and most of these forests are in good condition, substantial conservation and development benefits can be generated by adopting improved forest management practices and by increasing investment in sustainable forestry. There is need for government and other stakeholders to substantially increase investment in efforts to produce scientific knowledge and information to guide both private and public decision‐making in the forest sector. The important role forests play in climate change and mitigation and adaptation strategies provides greater justification for increasing public investments in the forest sector. Achieving sustainable forest management also calls for strategies that will cultivate local interest in community‐based forest management since most of the forests are located on customary land. The country stands to benefit greatly from carbon sequestration potential especially under the proposed Reduced Emissions from Deforestation and Degradation (REDD) Initiative under the Kyoto Protocol.
3.3.6 DISTRIBUTION OF FORESTS BY MANAGEMENT PLAN In terms of forest management, the ILUA data indicates that only 23 percent of forests are formally managed with elaborate forest management plans in place. About 41 percent are traditionally managed but have no formal management plans in place and another 36 percent of forests are not known, most likely indicating that they are not managed at all (Table 11). Traditional forest management plans and systems are based on scanty scientific information and it is unlikely that these would promote sustainable management and utilization of forest resources. There may be greater need for government through the Forest Department to expand forest extension services to local communities so as to enable

45
traditional authorities incorporate scientific information in the management and ensure that utilization patterns are sustainable and not environmentally degrading. Table 11: Percentage of forest area under management plan per province
Zambian Province
Formal Management
Traditional Management
Management Not Known
Central 30% 45% 25% Copperbelt 22% 29% 50% Eastern 33% 24% 42% Luapula 2% 46% 51% Lusaka 42% 37% 21% North Western 29% 46% 24% Northern 18% 60% 22% Southern 35% 49% 16% Western 6% 21% 73% Total % 23.0% 41.0% 36.0% Source: ILUA Data In addition, and subject to availability of resources, the forest department in collaboration with stakeholders in the forest sector should endeavor to bring unmanaged forests and those under traditional management systems under formal management. This does not necessarily imply that the forest department should claim total oversight on all public forests; rather, it should spearhead sustainable management by putting in place mechanisms devolving public rights over forests to the local level, the private sector, local communities and identified user‐groups. However, despite the country’s land tenure system and by implication the forest ownership structure, 77 percent of the country’s forests have no formal management plans in place and need to be properly managed. These forest management regimes should seriously embrace the local preferences and solicit active participation of local communities, user‐groups and traditional leaders. Management regimes that simply impose running objectives on local communities and which fail to adequately secure local interests in the forest regime especially the interests of the poor for whom these forests are most critical are unlikely to succeed in most rural communities (Jumbe, Bwalya and Husselman, 2008).
3.4 The Current Status of Forests Zambia has vast tracts of land under forest cover but their ecological condition has not been precisely known. Most previous estimates of the rate of deforestation were based on very scanty data, small samples, or inferred and extrapolated from very old forest statistics. Consequently, these statistics often are disputed as unreliable and not representative of actual facts on the ground. The ILUA data is comprehensive enough to provide more reliable estimates and help to validate previous estimates of deforestation in Zambia. To put the analysis into context, we begin by providing and comparing estimates of total forest volume from four different inventory studies. The first study was done in 1996 through the Zambia Forest Action Plan (ZFAP) which was accomplished through expert estimation rather than an

46
inventory, the second study was done as part of the Zambia Forest Support Programme in 2004 incorporating inventories made in several provinces combined with country‐wide remote sensing images and the third one refers to estimates compiled for the Global Forest Assessment by the UNFAO in 2005, using extrapolated inventory data from 1969 and 1974. Thus the latest is the ILUA estimate based on inventory data collected in 2006 and 2007. The estimates of forest biomass from these four studies are presented in the Figure 14 below. The data indicate that these estimates have not been consistent especially estimates made in 2005, which were based on small samples and largely extrapolated from old forest statistics. The ILUA statistics appear to be more representative compared to the FSP. In this context, the ILUA project has proved quite valuable in generating data necessary to re‐examine the rates of deforestation in the country. Figure 14: Comparing stock estimates from three separate studies
Total Growing Stock in Zambia, billion m3
0.000.501.001.502.002.503.003.504.004.50
ZFAP, 1996 Forest SupportProgramme, 2004
Global Forest ResourceAssessment, FAO 2005
ILUA, 2008
Source: ILUA data Deforestation estimates based on small sample observation of utilization levels and stock inventories have tended to produce quite alarming statistics on deforestation in the country. In Figure 15, we show that the level of forest disturbance in the country due to human‐induced activity is quite low, much lower than generally perceived. We divide the level of forest disturbance into four categories, namely ”non‐disturbed forests”, “slightly disturbed”, “moderately disturbed”, and “heavily disturbed”. Only 5 percent of the forests are severely degraded and 26 percent only moderately disturbed. These two indicate that roughly 32 percent of the total forests are somewhat disturbed and 63 percent are undisturbed or mildly disturbed by human activities. Approximately 5.5 percent of the forest land had unrecorded disturbance levels. The ILUA data does not validate previous estimates of deforestation of over 500,000 hectares per annual, which are extremely high and unsustainable.

47
Figure 15: Extent of forest disturbance in Zambia (impact level of human activity in the forest or other wooded land)
33.1% 30.2%25.5%
5.6% 5.5%
0.0%10.0%20.0%30.0%40.0%50.0%60.0%70.0%80.0%90.0%
100.0%
Area not disturbed Area slightlydisturbed
Area moderatelydisturbed
Area heavilydisturbed
area wheredisturbances not
recordedDisturbance level (ha)
Perc
ent o
f For
est a
nd O
ther
Woo
ded
Land
Source: ILUA data It is equally important to understand the relationship between land tenure and deforestation rates and to show whether there is a significant relationship between ownership and the condition of the forest. For instance, private property rights over the forest may provide sufficient incentives to manage the forest more sustainably but only for its private values where as open access forests provide adverse conditions and incentives that lead to over‐exploitation and degradation of the forest resource (see Figures 16, 17 and 18 below). Figure 19 below shows forest volume in cubic meters per hectares across forest ownership types. Although, as expected, the highest volumes are on protected land (forest reserves and national parks), there is no significant difference between volume per hectare on state and customary land. However, forests owned by individuals and firms seem to have less volume per hectare than those on customary and state land. This may be a reflection of the fact that incentives to promote sustainable forest management in privately owned forests are still quite poor and in need of improvement. When volume per hectare within different tree canopy covers is examined over different tenure types (Figure 20), privately owned forests appear to have the greatest volume per hectare (97 m3/ha) within the more closed tree canopies (>70%). This could indicate better management of older forests under private tenure, or the difference could be attributed to geography and ecozone type and the mere positioning of a privately owned forest within a denser vegetative zone. Regardless of what the case may be, only small proportions of the country’s forests are privately owned (12%) and efforts to promote conservation of forests on private land, for example, through conservation easement programs may be necessary to bring more forests under private management. This will also require implementing a more flexible land tenure regime that would permit easier transfer of forests currently under customary authority and unmanaged to partial or full private ownership and management.

48
Figure 16: Forest over‐exploitation in relation to land tenure categories
Source: ILUA data Note: Although there is over‐exploitation of forest resources on state land, the majority appears to occur in customary areas, however, representative (stratified) sampling in both tenure categories would have to be carried out before such a conclusion could be reached. Figure 17: Forest over‐exploitation in relation to rural and urban areas
Source: ILUA data Note: Forest over‐exploitation is within or just outside the urban centres. Most of the forests designated for fuelwood and charcoal in urban areas have been depleted

49
Figure 18: Forest over‐exploitation in relation to income distribution
Source: ILUA data Figure 19: Distribution of forest volume by land ownership
Source: ILUA data The Joint Forest Management initiative can help to foster effective partnerships between the private sector and local communities in managing those forests sitting on customary land. Further, those forests in game management areas can also be managed through public‐private partnership initiatives that blend wildlife and forest management together using the ecosystem approach to natural resource management.

50
Although rates of deforestation are not yet able be assessed due to the fact that this is the first inventory of its kind ever done in Zambia, the ILUA data demonstrates the great potential that exists in the forest sector to improve management and incentives for sustainable forest resource management and reduce degradation of the forest resource base. Government cannot sustainably and effectively manage public forests all by itself. It needs expedited devolution of user rights and responsibilities to local communities, user groups and indeed to the private sector. In order to further limit deforestation, there is need to harmonize policies and strengthen linkages between the forest sector, agriculture, wildlife and tourism, and other natural resource sectors. And, optimal management of forests will also require instituting payment mechanisms or benefit sharing that will ensure that forest benefits utilized in downstream sectors are appropriately shared with the forest sector. At present, these benefits are not shared with the forest sector to help defray the cost of forestry management. This tends to suppress forest values thereby leading to sub‐optimal provision of forest conservation. Forest carbon payments for sustainably managed forests through such mechanisms as REDD could provide an optimal opportunity for capturing these benefits and rewarding adjacent communities who are able to maintain and manage high forest cover. Figure 20: Volume per hectare by canopy cover and land tenure
10
2533
97
1925
38
6253
13
4852
86
25 26
0
20
40
60
80
100
120
Tree cover <5% Tree cover 5-10% Tree cover 10-40%
Tree cover 40-70%
Tree cover >70%
m3 /h
a
Private Public Customary
Source: ILUA data
3.5 Resource Utilization and the Environment In this section, we examine the livelihood strategies of local communities captured in the ILUA survey. First, the major economic activities of local people are analyzed based on the ranking of different income generating activities captured in the study. This is followed by a detailed analysis of the importance of forest products and services to households based on the ILUA data. Forest livelihoods, crop and livestock income generating activities are then

51
analyzed as well as the link between wood fuel demand and supply and deforestation discussed, using ILUA survey data and published national statistics. Lastly, we provide estimates of how much carbon is sequestered and stored in the trees in Zambia and provide some indicative estimates of how much money can be attracted into the forest sector through the proposed expansion of the Kyoto protocol under the Reduced Emissions from Deforestation and Degradation initiatives.
3.5.1 HOUSEHOLD LIVELIHOOD ACTIVITIES The majority of the people derive income from a variety of sources with the major ones being agriculture, livestock and harvesting of forest products. As seen in Figure 21 below, most all rural and peri‐urban households depend on crop production and livestock for their living. Fishing is also an important livelihood source for those living near our main inland fisheries although they also pursue agriculture. On‐farm income comes from the sale of food and cash crops, livestock, fishing as well as forestry products. Off‐farm income includes cash and in‐kind income from both agricultural work and non‐agricultural activities, and others. Figure 21: Overall income generating activities among sampled Zambian households (multiple responses)
91%59%
12%2%
0%9%
1%10%
4%
0% 20% 40% 60% 80% 100%
Sect
ors
Crop Production Livestock/herding Forestry Urban/Peri-urban TourismFishery Mining Activity_Others Unknown
Source: ILUA data Figure 21 shows rankings of different income generating activities of 1680 households covered in the ILUA survey. The income generating activities cited include crop production, livestock rearing, harvesting of forest products, fishing, mining, tourism and cottage industry and formal employment. Of these, crop production was ranked highest (91%) followed by livestock rearing (59%) and then harvesting of forest products (12%). Fishing was ranked fifth at 9 percent. Although there is a big gap in the ranking of forest‐based livelihoods in respect to agriculture, the CSO’s Living Conditions Monitoring Survey of 2004 (Table 12) illustrates that over 83 percent of all households in Zambia depend on wood resources (firewood and charcoal) for their cooking energy and over 97 percent of rural households depend solely on fuelwood for their cooking energy with only 1.7 percent have access to electrical energy (CSO, 2005).

52
Table 12: Percentage distribution of households by type of cooking energy
Energy Source All Zambia (%) Rural (%) Urban (%)
Wood Fuel 83.4 97.9 60.4 Coal 0 0 0 Kerosene/paraffin/Gas 0.2 0.2 0.2 Electricity 16.2 1.7 39.3 Other 0.1 0.2 0
Source: Living Conditions Monitoring Survey, 2004 It is therefore likely that forest‐based income generating activities have been suppressed mainly because of the difficulty in capturing and quantifying forest products harvested at the household level. Below, we focus and analyze the importance of crop, livestock and forest products to households using the ILUA socio‐economic data.
3.5.2 CROP PRODUCTION The main food and cash crop is maize, both local and hybrid varieties, which are cultivated by the majority of the surveyed households (82%). As indicated in Figure 22 below, other important crops in the area that collectively occupy more than 50% of the cultivated land area are wheat (12.8%), cassava (11.8%), groundnuts (7.9%), beans (5%), millet (3.7%), cotton (3.6%), sweet potatoes (3%) and sorghum(2.5%), Maize, which accounts for most of the land under cultivation (42%), is the staple food for local people. It is largely regarded as a subsistence crop, although the bulk of the produce is marketed. Figure 22: Proportion of land area allocated to cultivation of various crops
Proportion of land area allocated to cultivation of various crops
Tobacco, 1.0%Cotton, 3.6%
Other annual food crop, 2.1%
Cassava, 11.8%
Sw eet potatoes, 3.0%
Millet, 3.7% Rye, 0.1%Sorghum, 2.5%
Rice, 1.4%Beans, 5.0%
Soya beans, 0.9%
Groundnuts, 7.9%
vineyards, 0.1%
Sunflow er, 0.8%Other non food annual
crops, 0.1%
Other fruit trees, 0.3%
irish potatoes, 0.3%Wheat, 12.8%
Maize, 42.0%
Barley, 0.1%
Oats, 0.4%
Source: ILUA data

53
Figure 23: Proportion of households and cultivated crop products
0%
10%
20%
30%
40%
50%
60%
70%
80%
90%
Maize
Groundn
uts
Cassav
aBea
nsMille
t
Sweet p
otatoe
s
Sorghu
mCotto
n
Other a
nnual
food c
rop Rice
Soya bea
ns
Sunflo
wer
Irish po
tatoes
other
non fo
od an
nual
Wheat
Mango
Tobacc
oOat
Guava
Rye
Citrus
Other fr
uit tre
esBarl
ey
Vineya
rd
Avoca
do
Mixed fru
it tree
s
Paprik
a
Pawpaw
Tree nurs
eries
orna
mental
Source: ILUA data As is illustrated in Figure 23, approximately 82% of households surveyed indicate that they cultivate maize either on small or large plots. Nearly half of all households surveyed cultivate groundnuts and cassava. Beans (32%), millet (26%), sweet potatoes (23%), sorghum (15%) and cotton (12%) were also mentioned frequently as crop products. The dominance of maize cultivation has policy implications in terms of promoting appropriate land use, diversification of crops and the provision of research and extension services. Government can consider promotion of crop diversification in order to improve food security especially in marginal areas which fail to support maize production, a crop which is highly dependent on high cost inputs like fertilizer. Alternative grains like sorghum or millet as well as tubers like cassava can be promoted for production by smallholder farmers in areas where the agro‐ecological conditions support these crops. As can be seen in Figure 24 below, most farmers in the country practice some form of multiple cropping, an indication that crop diversification has been accepted and can thus be easily be promoted.

54
Figure 24: Crop production system by province
Percentage of cultivated land and crop production system by province
0%
10%
20%
30%
40%
50%
60%
70%
80%
Cent
ral
Copp
erbe
lt
Easte
rn
Luap
ula
Lusa
ka
North
Wes
tern
North
ern
Sout
hern
Wes
tern
Tota
l
Province
Perc
enta
ge
Area MultipleCropping
Area Crop Rotation
Area under Fallow
Area ImprovedCultivar
Not Known
Source: ILUA data
3.5.3 LIVESTOCK PRODUCTION Households keep livestock, especially small ruminants and poultry, in addition to their crop production activities as a livelihood and risk management strategy. Livestock provide meat for direct household consumption and manure for crop production. Additionally, they play various roles in accomplishing social obligations such as marriage ceremonies, etc. Household livestock ownership data from ILUA is reported in Figure 25 below. The farm households in the sample own cattle and most keep some combination of small livestock like goats, pigs, chickens, ducks, turkeys, and other poultry. As can be seen in the figure cattle are the most important livestock species owned by the households and are used for various purposes. Figure 25: Percentage of livestock species owned by sample households
Cattle-Young Stock4%
Cattle-Weaners male1%
Cattle-Weaners female1%
Cattle-Adult male3%
Cattle-Adult female10%
Cattle-Oxen3%
Sheep1%
Goats12%
Pigs6%
Chiken-Layers1%
Chiken-Broilers0%
Chiken-Free Range55%
Turkeys0%
Ducks1%
Other Poultry1%
Guinea Pigs0%
Rabbits0%
Source: ILUA data

55
Table 13 and Figure 26 show the relative contribution of the different livestock species to total Livestock Units (LU) among the sample households. Clearly, cattle are predominant and are a major contributor to the total LU for the households especially in Central, Lusaka, Eastern, Southern and Western provinces where they account for more than 75% of the total LU Table 13: Total and average number of livestock owned by sample households Total Livestock Units
Central Copper belt Eastern Luapula Lusaka
North Western Northern Southern Western Total
Cattle 904 53 175.5 10 332.5 84.5 83 711.5 680 3034
Sheep 4.3 0 2.7 5.5 0 3.3 1.3 1.9 0 19
Goats 52.5 13.9 20.6 17.8 5.7 50.3 56.7 85.6 11.7 314.8
Pigs 24 5.6 58.4 27.2 1.4 35.2 78.6 43.8 18.2 292.4
Poultry 24.96 2.73 8.76 3.89 7.29 8.81 11.39 25.17 15.68 108.7
Total LU 1009.8 75.23 265.96 64.39 346.9 182.11 231 868 725.6 3769 Average Livestock Units
Cattle 4.05 0.69 0.94 0.07 5.45 0.45 0.22 3.39 3.08 1.80
Sheep 0.02 0.00 0.01 0.04 0.00 0.02 0.00 0.01 0.00 0.01
Goats 0.24 0.18 0.11 0.13 0.09 0.27 0.15 0.41 0.05 0.19
Pigs 0.11 0.07 0.31 0.19 0.02 0.19 0.21 0.21 0.08 0.17
Poultry 0.11 0.04 0.05 0.03 0.12 0.05 0.03 0.12 0.07 0.06 Average LU 4.53 0.98 1.43 0.46 5.69 0.97 0.61 4.13 3.28 2.24 No. of H/Hs 223 77 186 141 61 187 377 210 221 1683
Source: ILUA data Note: A LU (Livestock Unit) is an animal unit that represents an animal of 250 kg live weight, and is used to aggregate different species and classes of livestock as follows: cattle: 0.5; goat and sheep: 0.1; pig: 0.2; chicken and other poultry: 0.02 (compiled after Chilonda and Otte (2006)) . Figure 26: Contribution of different species to total livestock units in the sample households
0%
20%
40%
60%
80%
100%
Percent
Cen
tral
Cop
perb
elt
East
ern
Luap
ula
Lusa
ka
Nor
th W
este
rn
Nor
ther
n
Sout
hern
Wes
tern
Province
PoultryPigsGoatsSheepCattle
Source: ILUA data

56
In order to estimate an aggregate herd size for the sample households and be able to compare different herd types (cows, goats, pigs, etc), the Livestock Unit (Unit) equivalence measure was used. Based on the LU equivalence measure we find that among the sample households, on an average, the households which have the largest herd sizes are in Lusaka Province (5.7) followed by those in Central (4.5), Southern (4.1) and Western Province (3.4) and Eastern with 1.4 LU (See Table 13 above). These survey findings are consistent with what is generally known about these areas of the country in terms of livestock production. Lusaka, Southern and Central provinces are predominantly commercial farming areas with farmers who produce beef and milk for sale along the line of rail or urban centers of the country. Western and Eastern provinces also have many traditional small‐scale cattle herders among the local people which support a relatively large animal population. On the other hand, compared to the other provinces, Northern and Luapula also have a large population of traditional small‐scale farmers but they are not traditional cattle keepers and are mainly involved in crop production and production of smaller livestock species like goats, pigs and poultry.
3.5.4 HOUSEHOLD INCOME As indicated above, households depend primarily on agriculture for their livelihoods. On‐farm income comes from the sale of food and cash crops, livestock, fishing as well as forestry products. Respondents were asked to give an estimate of the total annual income that is earned by their households. As shown in Figure 27 below, most of the households reported that they earn less than K5 million annually (equivalent to US$1,400 or approximately $4/day). These figures have to be taken with caution since it is usually difficult to get accurate income data for obvious reasons. Figure 27: Distribution of households by total annual household income earned
0%
5%
10%
15%
20%
25%
30%
35%
not specif ied < 100,000ZKW
100,000 -500,000 ZKW
500,000 -1,000,000
ZKW
1,000,000 -5,000,000
ZKW
> 5,000,000ZKW
Income Category
Per
cent
Robinson, Wint and Tatem (2008) used statistical modeling to convert the ILUA survey data into continuous mapped surfaces. The statistical modelling technique used relies on access to a wide range of predictor variables that can be used to define the relationships between
Source: ILUA data

57
target and predictor values. Because they are reliable surrogates for a wide range of environmental, ecological and climatic variables and are often correlated with land use as well as land cover, satellite data were used to form the core of the distribution modelling predictor archive. These serve as useful predictors because they are readily processed to derive summary climate and vegetation indicators with measures of seasonality and variability. Other indicators are, however, also likely to be useful as predictors: demographic, topographic, hydrological, agricultural and infrastructural variables, for example. These ‘predictors’ were then overlain by ILUA tract data – displayed as graduated circles, to help evaluate the fit between the two sets of information. Figure 28 shows the modeled distribution of total household income, and clearly identifies areas where income is significantly lower than elsewhere – most notably a large area in Western Province and in parts of the north and the east. Figure 29 also shows mean income distribution in relation to urban and rural areas. Income is relatively high around the major cities. This translates into relatively high income in the mixed rain fed production systems along the old line of rail in Southern, Central, Lusaka and Copperbelt provinces. These are areas with emergent commercial and large‐scale commercial farmers as well as some level of other economic activities in the industrial and manufacturing sectors. Figure 28: Household income
Source: Robinson et al., 2008, based on ILUA data

58
Figure 29: Mean household income in relation to urban and rural areas
Source: ILUA data
3.5.5 IMPORTANCE OF FOREST RESOURCES TO LOCAL LIVELIHOODS Forest and woodland resources are important sources of materials, energy and wild foods that support local livelihoods especially in rural areas. Almost all rural households depend on forests for fuelwood and construction materials and as important sources of non‐wood forest products both for subsistence and commercial use. It is estimated that 68% of total forest product harvested by rural household is consumed within the household and the reminder (32%) is sold for cash or exchanged for household goods (Jumbe, Bwalya and Husselman, 2008). To appreciate the critical importance of forest and woodland resources to local livelihoods, we present in Table 14 and Table 15 household rankings of different forest products by household income category. It is clear that fuelwood ranked highest with 37.6%, followed by construction materials (22.5%), wild foods (10.2%) and medicine (9%). Other important forest products are industrial wood (timber) and wood for carvings and making tools. While generally the same across income groups, it is important to indicate here that significant variations do exist across households and communities. For instance, the data suggests that the poorest households ranked firewood and plant foods more highly than did the other three income groups. This is consistent with the fact that poorest households tend to have fewer livelihood and income options outside of the forest and their opportunity cost of forest collection is much lower than that of their richer counterparts. The poor also tend to be more reliant on forest gathering of firewood and wild foods for sale within village markets or in exchange for foodstuffs and other household goods. They also face critical

59
food shortfalls and depend on forest foods for survival and often to supplement their nutritional requirement. Table 14: Proportion of households with highest ranked forest products/services by total annual income levels (income in Zambian Kwacha)
Forest product/service
Less than 100,000
100,000‐500,000
500,000‐1,000,000
1,000,000‐5,000,000
Above 5,000,000 All
Industrial Wood 3.9% 5.8% 6.3% 5.1% 15.2% 7.2% Fuel Wood 43.9% 34.9% 36.3% 36.9% 35.8% 37.6% Charcoal 5.2% 5.0% 4.6% 5.4% 5.4% 5.1% Wood Products (Carvings, Tools, 1.0% 2.4% 2.1% 2.2% 2.0% 1.9% Construction Material 21.2% 22.6% 23.9% 23.0% 21.6% 22.5% Non‐Wood Utensils and Handcrafts 0.8% 1.6% 1.3% 1.5% 0.5% 1.1% Plant Food (Veg, Fruits, Beverages etc 10.3% 11.3% 7.7% 7.0% 7.8% 8.8% Other Plant Products 0.3% 0.5% 0.7% 0.7% 0.0% 0.4% Fodder and Forbs (Include. Bees ) 1.0% 0.8% 0.7% 2.0% 1.0% 1.1% Medicinal Plants 9.6% 9.6% 9.8% 9.4% 6.9% 9.0% Soap/Cosmetics, Exudates, Colorants 0.3% 0.2% 0.2% 0.4% 0.5% 0.3% Honey, Beeswax 0.3% 1.1% 2.1% 2.0% 0.5% 1.2% Animal and Animal Products (Meat) 1.3% 2.9% 2.0% 2.6% 1.5% 2.0% Environmental, Education and Cultural 1.0% 1.4% 2.3% 1.9% 1.5% 1.6% Source: ILUA data In comparison, the relatively richer households engage in relatively more capital intensive and more profitable forest based income generating activities such as timber production and large‐scale charcoal production. This is consistent with the high ranking that the richest income group place on industrial wood (timber). Relatively richer households also tend to have higher educational attainment and can afford better modern health facilities than the very poor. This is also seen in the low ranking of forests as sources of herbs and medicines or simply as a “drug store” for the poor. But these rankings reveal that forests are a “food basket” and “drug store” for the rural poor and provide critical safety‐nets for all households during environmental stressful conditions such as droughts and floods. Table 15: Proportion of households with highest ranked forest products/services by total annual income levels (income in Zambian Kwacha)
Forest Products/Income <100,000
100,000‐500,000
500,000‐1,000,000
1,000,000‐5,000,000
>1,000,000‐20,000,000 All
Wood Products 75.2% 70.7% 73.2% 72.5% 79.9% 74.3% Non‐Wood Products 23.8% 27.9% 24.5% 25.6% 18.6% 24.1% Environmental Services 1.0% 1.4% 2.3% 1.9% 1.5% 1.6% Source: ILUA data Forests also provide a wide range of local and global environmental services, which include prevention of soil erosion, protection of watercourses and moderation of weather patterns and climate change through carbon sequestration. In Table 15, we aggregated forest and

60
woodland resources into three broad categories namely, wood products, non‐wood products and environmental services. Wood products, dominated by charcoal and construction poles dominate the ranking, followed by non‐wood forest products (i.e., wild foods), and lastly environmental services. In addition to meeting their demand for wood products for own consumption, richer households are also increasingly dependent on forest products as a source of cash income (timber). The relatively low ranking of environmental services is consistent with our expectations. Conservation of forests for environmental public goods only starts to increase to appreciable levels when per‐capita income increases and reaches a certain threshold, and Zambia, like most poor countries, is still far from reaching this per‐capita income threshold. But even with these poor communities, richer households seem to have greater appreciation of environmental services forests provide than the very poor do. Overall, harvested forest products make a significant contribution to rural livelihoods and incomes of the rural poor. Forest contribution to rural household income is estimated at 20.6 percent. However, the contribution of forest products varies geographically and across households with figures ranging from as low as 12% in some locations to 65% in others depending on socio‐economic and conditioning factors which include access to markets and spatial and temporal availability of forest products (Bwalya and Husselman, 2008) (see Figure 30 and 31 below). Figure 30: Household use of forests for food in relation to forest distribution
Source: ILUA data

61
Figure 31: Contribution of income from forestry to total household income in relation to forest distribution
Source: ILUA data
3.6 Household wood fuel supply and demand Wood fuel production is an important economic activity estimated to contribute at least 3% to the country’s GDP, and accounts for approximately 80% of the total energy household balance in the economy. Wood fuel is mainly consumed by relatively poor households, with about 86% of rural households directly dependent on firewood and the remainder (14%) on charcoal. Firewood production and consumption contributes 0.8% to the country GDP, while charcoal contributes about 2.2%. It is also estimated that over 50,000 people are engaged in charcoal production on full‐time basis and earn a living from charcoal production. A large number of others are engaged in charcoal production, distribution and marketing on part‐time basis, moving into the sector during the slack period when labor is relatively abundant and also when they seek to earn some cash income to meet their household needs or purchase agricultural inputs. The majority of rural households are dependent on firewood, but still produce charcoal and firewood at least for domestic use, especially for space heating, cooking and drying fish and meat. Even those with a stable electricity supply also demand and use charcoal for barbecue as well as to prepare traditional foods, which are believed to cook better on firewood and charcoal. Strong tastes have been isolated as one of the major determinants of charcoal consumption among households with electricity in Zambia (Bwalya, 2000). Below we analyze wood fuel (firewood and charcoal) production and consumption and its impact on forest conditions and the environment.

62
3.6.1 FIREWOOD CONSUMPTION Over 86 ‐ 90% of the rural households are heavily dependent on firewood for their energy needs; making firewood the most important energy sources in the rural sector (see Figures 32 below). However, there are few studies that have analyzed at a broader scale firewood production and consumption of firewood by rural households. Most studies are based on small sample or location specific to generate broader national insights. Some of the notable ones include the World Bank/ESMAP study conducted in 1990. A recent study of Bwalya (2006) estimates that a typical household consumes 125 head‐loads of firewood per year and the head‐load of firewood weighs between 10 ‐ 15 kgs. This means that each of the 86% of rural households that depend on firewood consumes approximately 1,562 kg of dry firewood annually. Using the national population estimate for 2008 of 12,525,791 people (GRZ, FNDP, 2006) and the fact that 40% of the national population is rural; one can roughly estimate the total firewood consumed in the economy by multiplying the total number of rural households using firewood by average firewood consumption per household per year. The total number of rural household dependent on firewood is estimated by dividing rural population by the average household size of 5.1 persons per household adjusted by 86%, which is the proportion of rural households who are dependent on firewood. This estimates that there are about 982,415 rural households and of these 844,877 (86%) are dependent on firewood. The total annual firewood consumption is estimated by multiplying this figure by average household firewood consumption, yielding 1.320 million tonnes of dry firewood consumed in 2008. Figure 32: Energy (charcoal & fuelwood) use in relation to forest distribution
Source: ILUA data
63
Indigenous forests and woodland resources are important sources of household energy for most rural households and underscore the need to ensure that these forest resources are sustainably managed. Because rural households lack affordable energy substitutes, such as electricity which has only 2% of the rural households connected to its grid, increasing scarcity of fuelwood would divert labor from such household activities as food production to firewood gathering thereby reducing food production and increasing rural vulnerability to external shocks. However, ensuring sustainable management of forests for firewood is not easy because open forests are not under any formal management system, and are increasingly under threat of over‐exploitation and conversion to farmland and settlement. As observed in Bwalya (2006), distance traveled and time taken to gather a head‐load of firewood has increased in some villages. On average, it takes about 5 km to go to and from the forest collection area and as much as 2 hours to collect a standard 10 kg head‐load of firewood. In some areas where firewood is relatively scarce and the opportunity cost of labor low, firewood markets are slowly emerging, with about 5% of the firewood collected by rural household being sold for cash or in exchange for food and household materials to relatively wealthier households within the village. The question that is often asked is whether firewood collection leads to forest degradation and deforestation. There are no studies that have examined the impact of firewood collection on forest conditions and deforestation in general. However, one can infer the likely impact of firewood collection by looking at firewood harvesting practices in the rural sector. Rural households predominately gather dead wood, branches, and twigs for firewood, selecting only those tree species that burn easily, less smoky and produce quality fire. Only in very few places where firewood is scarce do people resort to cutting down young regrowth, which they leave to dry before transporting them to the village. In any case, firewood collection seems to exert negligible impact on forest conditions and deforestation. However, firewood can have some impact on carbon releases into the atmosphere when trees are cut and dried for firewood, thereby accelerating release of carbon stored in tree biomass. Given our estimate of firewood consumption of 1.32 million tonnes per year, the amount of carbon released is obtained by multiplying total firewood biomass by a carbon conversion factor of 0.47. This means that about 620,400 tonnes of carbon would be released into the atmosphere. But such carbon releases from firewood collected from already deadwood and twigs cannot be attributed to firewood consumption as mere decomposition of dead tree biomass would still release the carbon stored in tree biomass, only more slowly. Thus, on the overall, firewood collection and use by rural households appear to pose little impact on forest degradation and deforestation.
3.6.2 DEMAND AND SUPPLY OF CHARCOAL Charcoal is produced by rural and peri‐urban households mainly for sale to urban households and relatively more affluent households in the rural sector. Charcoal production, distribution and marketing employs more than 500,000 people and accounts for 2.2% of the country’s GDP. This estimate is depressed by high transaction costs associated with poor infrastructure (poor roads), long distance to urban markets as nearby production forests get exhausted and by lack of statistics on production figure on charcoal as most of the charcoal produced (as much as 95%) is not licensed. Because of this, most production figures are derived from estimates of charcoal consumption estimates by urban households. This approach is also used here to estimate the amount of charcoal that is consumed by urban households, which

64
is then used to determine the amount of charcoal that is produced and subsequently the amount of cord wood that is used to produce the charcoal. The Fifth National Development Plan (GRZ/FNDP, 2006) estimates that between 66% and 98% of the urban households rely on charcoal for domestic energy, but it’s the relatively poorer households living in low cost residential areas that are more heavily dependent on charcoal. It is estimated that 98% of the low cost urban households are heavily dependent on charcoal as a source of domestic energy and these constitute 85% of the urban population. The urban population for 2008 estimated at 60% of the total population of 12,525,791 yields approximately 7,515,475 people (or 1,473,622 urban households) at 5.1 persons per household. Of these households, 1,252,579 or 85% of the total urban households are heavily dependent on charcoal for domestic energy and per‐capita household consumption is estimated at 3.9 kg per day or 1,404 kg per annum (GRZ/FNDP, 2006). Chidumayo (1997) estimates that per‐capita urban household consumption of charcoal between 1984 and 1994 to be 1,046 kgs per year, and 100kg per capita consumption by rural households. The annual total urban consumption of charcoal is determined using per‐capita household consumption estimates in Chidumayo (1997). Urban charcoal consumption is obtained by multiplying per capita consumption by urban population. Because of production losses and charcoal residuals that remain uncollected at the kiln, consumption needs to be adjusted upwards to obtain a more accurate assessment of production. It is estimated that about 4% of the charcoal remains at the kiln as residuals, meaning that only 96% of the charcoal is recovered, bagged and delivered to the market. The total charcoal produced is calculated by multiplying consumption figure by 0.96%, and the total wood biomass used determined by dividing charcoal production figure by wood to charcoal conversion or efficiency factor of 0.25. This conversion factor is obtained from Hibajene (1994) who estimates the cord wood to charcoal production of between 17% and 33%, with a midpoint being 25%. This yields the amount of cord biomass used to produce charcoal summarized in the third column of Table 16 below. Urban charcoal consumption figures for 1969, 1980, 1990 and 2000 are obtained from Chidumayo (1997) and those for 2008 are calculated using population estimates in the Fifth National Development Plan. The rate of forest degradation (or deforestation) is estimated by assuming that production occurs in well‐stocked and undisturbed forests with figures estimated at 79.37 tonnes per hectares, so that the amount of hectares cleared (assuming clear felling) can be obtained by dividing biomass estimates by biomass per hectares (79.37 ton/ha). Table 16: Estimates of Charcoal Production and Deforestation Year Charcoal Production
(million tonnes) Wood Biomass Used (million tonnes)
Estimated Forest Degradation (million ha)
1969 0.33 1.375 0.017 1980 0.49 2.042 0.026 1990 0.685 2.854 0.036 2000 0.905 3.771 0.048 2008* 1.392 5.800 0.073
Sources: Consumption data from Chidumayo (1997); ILUA data (2008) and FNDP (2006). Note: * = indicates charcoal consumption for 2008 that includes both urban and rural charcoal consumption, the rest reflect consumption by urban households only. Urban and rural charcoal consumption is 95% and 5% respectively.

65
These estimates show that 1.392 million tonnes of charcoal is consumed at the household level. This quantity of charcoal is produced from 5.8 million tonnes of cord wood, which would result in 73,000 hectares of well‐stocked forests being cleared and/or degraded, equivalent to 0.15% of the total forest area. Now, these estimates assume that all charcoal produced is produced from trees felled primary for charcoal production. However, this assumption is unlikely to be realistic as it is believed that a large proportion of the charcoal produced comes from forests cleared largely for agriculture production or indeed other purposes. Unfortunately, there are no statistics to enable us to estimate more accurate deforestation rates due to charcoal production. The second difficulty arises from the fact that the biomass estimate of 79.37 ton/ha is likely to bias deforestation estimates as tree density or biomass per hectare is not uniform across the landscape. They vary spatially and indeed quite remarkably, thus it could mean that more forest degradation is happening rather than full scale deforestation. Even when forest density and biomass distribution is even geographically, the amount of biomass that is finally used and carbonated into charcoal will certainly vary from one producer to another, and our estimate of 96% may not be that representative (Chidumayo, 1994). In addition, deforestation due to charcoal production may be largely temporal in the sense that a large portion of the forest may be cleared, except on the kiln area or when the cleared area is converted to cultivation and can quickly regenerate as the canopy is opened up to allow stunted seedlings to receive sunlight and begin to grow. In this case, interpreting charcoal‐based deforestation calculated from consumption figures can lead to an alarmist estimate of charcoal based deforestation in the country. What appears to be the real impact is not deforestation per se, but forest degradation due to selective harvesting of trees for charcoal production, that for instance produces uneven forest stands and transitioning of forests into woodlands, as the area cleared including the kiln area is replaced by shrubs and herbaceous plants rather than young trees. Given the estimates of biomass converted to charcoal, we can assess the impact of fuel wood consumption, generally with emphasis on charcoal demand and supply. We have estimated that 5.8 million tonnes of wood biomass is cut and carbonized to produce charcoal both for urban and rural household domestic use (this excludes charcoal consumption by the private and government sector such as schools and hospitals). Now, if we attribute tree clearing primarily to charcoal production, then several environmental impacts can be discussed. Extensive tree clearing will generally lead to forest degradation, reduced habitat for wildlife, and reduced flow of several environmental goods and services, including carbon sequestration and storage. Secondly, tree clearing due to charcoal production makes it easier for the cleared land to be permanently converted to agriculture and settlement, which in turn induces farther pressure on nearby forests for consumptive (which often degrade forest ecosystems) and non‐consumptive forest uses. Thirdly, any loss of forest cover due to charcoal based deforestation reduces the amount of carbon sequestered in tree biomass, while at the same time increases the amount of carbon released both at charcoal production and consumption stages. These impacts of wood fuel supply and consumption need to be managed by focusing policy efforts to address both the demand and supply side problems and also by regulating and managing forest extraction for wood fuel. Energy strategies for managing wood fuel

66
demand and supply are well‐articulated in the FNDP and include increasing electrification of rural areas; promotion of efficient production and utilization of wood fuel and production of charcoal production manuals for dissemination to charcoal producers, and promotion of gel fuels and Liquefied Petroleum Gas (LPG) to provide alternative energy sources to wood fuel. These strategies are well‐identified and are expected to reduce wood fuel consumption by 10% (or 400,000 tonnes) per year (GRZ/FNDP, 2006). But the extent to which this target will be achieved will largely depend on effective implementation and financing of these initiatives by government, private sector and other stakeholders. On the supply and forest management side, several strategies and interventions are needed to ensure sustainable supply of wood fuel and to minimize environmental impacts of wood fuel supply. These key strategies include promotion of sustainable and participatory management of wood fuel management and establishment of wood fuel plantations and, as identified under the energy sector, to improve efficiency and technology of charcoal production and use. To ensure sustainable wood fuel plantations, the incentives should be right and the wood fuel prices high enough to provide rates of return from the investment in plantation forestry that are higher than any returns from other investment ventures to be sustainable and successful. Government should provide targeted investments to improve the rates of returns, and to incentivize user groups and private sector to establish and manage wood fuel plantations sustainably. What is rather more practical in the short to medium term is for the forest department to identify and demarcate indigenous open forests which can then be managed or regenerated if degraded into wood fuel production. These forests can then be managed collaboratively with user groups or by the forestry department for charcoal production. But production on these forests should be competitively allocated at a reasonable royalty fee to be used to manage regeneration of forests after trees have been felled for charcoal. Charcoal production would then move to the next forest compartment on a rotation basis. This is likely to yield quicker positive results than establishing exotic plantation forests for wood fuel, which is more likely to work only when wood fuel markets are fully developed and the wood fuel prices have risen above a certain threshold at which plantation forestry for wood fuel would be deemed profitable. It is however positive to induce sustainable forestry by exploiting opportunities to attract additional returns from the proposed Reduced Emissions from Deforestation and Degradation (REDD) initiatives to be considered under the Kyoto Protocol. With regard to the third strategy of increasing efficiency and production technology of charcoal production and use, greater potential may be realized at the end use than at the production stage because opportunities for expanding charcoal yield have been shown to be quite limited (Hibajene, 1994). Participatory management of indigenous forests for wood fuel and other forest products that are of critical importance to local communities or user groups is recommended as this will help to bring more open access forest under formal management and as a result increase the flow of forest products and services to the local community or user group.

67
3.7 Forests as Carbon Sinks and Sequesters Forests affect climate change through their absorption, storage and release of greenhouse gases. Deforestation may have some effect on wind flow, water vapor and flows, and the rate at which solar energy is absorbed. Moreover, deforestation ultimately releases tonnes of carbon into the atmosphere. In this and several other ways deforestation significantly effects climate change. Estimates of total carbon release from tropical deforestation currently stand at 3.8 billion tonnes, which is about 20 percent of all human‐induced carbon releases (House et al, 2006). Reducing deforestation and encouraging afforestation and reforestation can make a significant contribution towards reducing global carbon emissions. In particular, measures, strategies and programs aimed at slowing the rate of tropical deforestation can significantly reduce carbon releases and help to mitigate climate change and its impacts especially in developing countries in Africa. Despite this disproportionate effect of climate change, which has attracted a lot of attention at local and international level, it is unequivocally agreed that better forest management and reducing forest degradation and deforestation among other measures would help to mitigate climate change by reducing the amount of greenhouse gases released in the atmosphere. Mature forests act as carbon sinks by storing carbon in wood biomass for their entire lifespan and after harvest if the carbon is not eventually released. In addition, trees absorb carbon out of the atmosphere and sequester it into wood biomass. In this way, reforestation and afforestation programs are important in absorbing carbon from the atmosphere. Zambia’s forests play an important role in reducing and mitigating the effects of climate change through carbon sequestration and storage. Our estimates from ILUA data indicate that these forests, excluding plantations, store as much as 2.63 billion metric tonnes of carbon. This estimate is actually understated as it does not include carbon sequestered and stored in herbaceous plants and in belowground plant biomass. If forests are well managed and conserved the carbon already stored in tree biomass remains fixed in wood biomass and additional tonnes of carbon can be continuously absorbed from the atmosphere by improving management of degraded forests and by reducing carbon leakages elsewhere and preventing human‐induced forest fires. However, improving forest management and halting deforestation for the global public good is costly for developing countries like Zambia. It is important that the costs of climate change mitigation are properly shared across countries such that developing countries can obtain full benefits from these efforts. Therefore, there is a need to develop compensation mechanisms that would provide sufficient financial and development benefits to developing countries to encourage sustainable forest management. Otherwise, there is little incentive for the government and local communities to invest in efforts to promote long‐term forest management. It is important to relate the land tenure system and options for long‐term forest management for carbon credits. Although voluntary carbon markets are just developing and currently not quite accessible to many developing countries, it is insightful to know how revenue can be generated from sustainable forest management from carbon trading through the proposed Reduced Emissions from Deforestation and Degradation initiative. Table 17 below presents information on the amount of carbon that can be absorbed from the
68
atmosphere by managing regeneration of disturbed forests in Zambia. The second column shows the average biomass per hectare for undisturbed and disturbed forests and column three and four show the total forest area in hectares and biomass in million tonnes. The amount of carbon and carbon‐dioxide stored per hectare is shown in columns five and six and the total amount of carbon‐dioxide stored in column seven. The biomass and forest area statistics are computed from the ILUA data. The total national forest area is estimated at 50million hectares with above ground biomass of 4.5 billion metric tonnes. Biomass for undisturbed forests and disturbed forests is estimated at 79.9 and 58.1 tonnes per hectare respectively. This suggests that two opportunities to store carbon exist, one by avoiding release of carbon by averting deforestation and consequently increasing carbon sequestration on disturbed forests and another by encouraging forest regeneration on deforested areas. The total amount of carbon stored in tree biomass is calculated by multiplying biomass by a conversion factor of 0.47. The average biomass per hectare over all forest types is estimated at 81.2 tonnes. Carbon stored on undisturbed and disturbed forests is calculated at 37.3 tonnes/ha and 17.4 tonnes/ha respectively. The total carbon stored in above ground biomass over all forest types is estimated at 1.9 billion tonnes. Miombo woodlands cover a number of countries in Southern Africa, including Tanzania, Democratic Republic of Congo, Malawi, Zimbabwe, Zambia and parts of Namibia and Botswana. We use estimates of carbon sequestration in the miombo woodlands in Tanzania to calculate the rate of carbon‐dioxide absorption per hectares by multiplying the amount of carbon stored by a carbon to carbon‐dioxide conversion factor of 3.67. This yields CO2 estimates in column six (6). Multiplying CO2 estimates by net price of $2.001 yields the value of carbon credits per ha shown in column (7). If the Kyoto Protocol reconsiders the CDM to include carbon sequestration and conservation from avoided degradation and deforestation (REDD) and the criteria for assessing carbon leakages is developed and fully functional, the country can attract substantial benefits from sustainable management of its forests. The amount of income that can be generated from carbon receipts is estimated between US$ 128.0 to US$ 274.2 per hectare, and the carbon already stored in tree biomass is valued at US $4,853.34 million for undisturbed forests and US$4,198.40 million for disturbed forests. These are however not eligible for carbon credits because the current Kyoto Protocol and the Marrakech Accord restricts the Clean Development Markets in the forest sector to reforestation and afforestation projects only. Hence the country can only benefit from carbon offset in voluntary carbon markets by accumulating carbon credits through improved forest management especially afforestation of degraded forests.
1 The gross price of carbon-dioxide per tonnes is about $5 dollars, and the transaction cost of managing the forest and includes all costs associated with participating in carbon market is US $3 dollar per ton/ha and is adopted from Zahaba (2006).

69
Table 17: Estimates of carbon sequestration from improved management of degraded forests
Biomass
Above Ground Biomass (ton/ha)
Forest Area in Ha (mn)
Above Ground Biomass (mn tonnes)
Carbon per/Ha
CO2 per/Ha
Value of CO2 Stock /Ha ($)
Net Value CO2 (Ha/yr)
Undisturbed Forests (a) 79.37
17.7
1,405.8 37.3 137.1 274.2
9.60
Disturbed Forests (b) 37.06
32.8
1,214.9 17.4 64.0 128.0
4.48
Carbon Increment (d)=(a‐b) 42.31
32.8
1,386.8 19.9 73.1 146.1
5.12
Source: ILUA data Note: Carbon is calculated from above ground biomass (carbon = biomass x 0.47) and the carbon
sequestration rate is 2.2% (or 7% for CO2). A unit of carbon credit is valued at $5 dollars per hectare, and the average cost of managing forest regeneration and carbon certification is assumed at $3 dollar per ton/ha. Carbon is converted to carbon dioxide by at rate of 44/12 or 3.667 (See Zahabu, 2006).
The potential to increase forest cover and biomass through improved forest conservation and management of disturbed forests is therefore examined. We take forest cover and biomass on undisturbed forests as the maximum forest cover and biomass attainable and estimate the potential improvement as the difference between biomass on undisturbed and disturbed forests. This yields the potential incremental biomass of 42.31 ton/ha. But the regeneration period is not determined here as it is expected to vary from one forest to another depending on ecological factors, level of forest degradation and type of management interventions. The total incremental carbon sequestration arising from improved management of regeneration of disturbed forests is estimated at 20 ton/ha or (73.1 ton of carbon‐dioxide per ha) and the gross value of carbon‐dioxide per tonne is assumed at $5. The transaction cost of professional forest management plus the cost of carbon certification is estimated at $3 per ha, giving a net return on carbon credit of $2 per ton/ha (Zahabu, 2006). At 7% carbon sequestration rate, managing regeneration of disturbed forests will yield a net return of US$ 5.21 per ha per year. When tree biomass on previously disturbed forests reaches its potential level of 79.37, the amount of carbon sequestered would increase by 20 tonnes per hectare. If we assume that there are no carbon leakages on other forests so that the 20 ton/ha of additional carbon stored are net carbon credits available for trading and these occur on the entire 32.8 million hectares of disturbed forests, then a total of US$167.9 million can be generated from selling these carbon credits. This figure assumes a constant carbon sequestration rate over the period of forest regeneration until the forest reaches its maximum potential biomass of 79.37 per ha. Given that most forests are located on customary land and local communities are highly dependent on these forests for their livelihoods, the potential to improve forest management should involve active participation of local communities. It should also be pointed out here that government through the Forest Department cannot effectively ensure sustainable management of public forests all by itself. It needs to devolve and share forest management rights and responsibilities with local communities and the private sector through collaborative management initiatives such the proposed Joint Forest Management (JFM) program. According to Bwalya (2008), one of the challenges of successful

70
implementation of JFM projects in the six pilot areas is the inadequate flow of financial returns from local forest management, which is partly attributed to the fact that most of these forests are characterized by low timber values. Carbon credits can significantly increase the financial returns from local forest management and incentivize active participation of local communities and private sector in JFM programs. And improved management of local forests also broadens opportunities for the local community to adapt to climate change and direct injection of carbon money into these communities would improve their livelihoods and help to attain the millennium development goals on environmental sustainability and poverty reduction. In this context, expanding the CDM and carbon credits to include carbon sequestration and carbon conservation by improving forest management and halting deforestation would provide significant incentives for community forest management and rural development in Zambia. The poverty reduction potential of community forest management for carbon credits is great and the Kyoto Protocol should consider unlocking these potentials for developing countries in their subsequent discussions of the CDM.
3.8 Access to Resources Among the many variables that ILUA collected in its household survey was a section on ‘access to resources’ which attempted to gauge households’: a) accessibility to services, and b) accessibility to water resources. Sample households were asked to indicate their level of utilization of inputs like fertilizer as well as their level of access to land and services like veterinary, extension and credit as well as to give estimates of approximate distances to the places where they get these services.
3.8.1 ACCESS TO LAND In Zambia, farm households rely on traditional land tenure systems to acquire farm land. In general the land is often held by a group, community lineage or clan, family or individuals and an individual in the community may give a piece of it to another person for use, with the local leaders' knowledge. Once acquired, land may be passed on from generation to generation. As shown in Figure 33, the predominant form of land ownership is customary (66%) followed by access through title deeds (34%), with very few (less than 1%) having access through rent. Figure 33: Distribution of land ownership among the sample households
Title34%
Rent0%
Customary66%
Source: ILUA data

71
Few households use rented land or have formal title deeds for their land. These few households have just recently converted their land that they held under customary tenure to leasehold tenure under the provisions of the 1995 Land Act. Despite this provision, the customary land tenure system is still predominant in the country and very few households have converted their customary land into leasehold land tenure. This is probably because the act is still relatively new and a majority of people in rural communities may not be aware of these changes and their implications. The other reason is that arable land is still abundant in most districts in Zambia and farmers hardly complain of lack of access to land. The predominance of the customary tenure system in the country is an indication of the importance of the use value rather than the commodity value of land among the small‐scale farm households. However, this should not obscure the fact that land is increasingly gaining commodity value in parts of the country as indicated by the growing number of land disputes, purchases and registrations to convert land held under customary tenure to leasehold tenure. In terms of livestock production, improving management and providing adequate nutrition are critical factors to increasing livestock productivity in the communal lands. Ineffective disease treatment and vaccination programmes, inappropriate calving/kidding seasons, free movement of stock in communal land causing easy transmission of diseases have resulted in high mortality rates and low productivity of the communal livestock system. Therefore, in relation to livestock production and customary land, the key policy issue of concern is that in areas that traditionally rely on grazing, the health of rangeland is generally best maintained by traditional pastoralist practices, which regulate grazing location and herd size in accordance with drought cycles and the supply of fodder. In fact, government policies or other interventions that disrupt or discourage these practices may be a root cause of degradation
3.8.2 LEVEL OF AGRICULTURAL INPUT UTILIZATION The household survey asked respondents to indicate their level of utilization of several types of agricultural inputs as shown in Figure 34 below. Figure 35 also shows the relationship between income levels and access to input markets. The survey results show that there is very limited use of inputs like fertilizer and herbicides (11%) and irrigation facilities (0.8%) among the sample households (Figure 34). The limited use of important and productivity enhancing inputs like fertilizer can be attributed to the high cost of purchasing of these inputs. Most smallholder farmers cannot afford to buy enough fertilizer to meet their production requirements, yet the limited use of fertilizer has implications on land use. It means that farmers can only increase production by expanding the area under cultivation and thus they are opening up new areas or practicing shifting cultivation. Area expansion or shifting cultivation negatively impacts forest reserves or wooded areas.

72
Figure 34: Agricultural inputs used by sample households
Use of household inputs, % of total households
39.5
4.613.6
39.7
11.46.4
12.1 11.2
0.64.6
0.0
5.0
10.0
15.0
20.0
25.0
30.0
35.0
40.0
45.0
Hiredpersonlabour
Feeds,fodder, etc.
Veterinary,drugs etc.
Tools Spareparts,mainetance
etc.
Hiring ofpower
source,animals etc.
Transport,storage
Fertilizer,Herbisides,pesticides,
etc.
Irrigationfacilities
Other
Source: ILUA Data
Figure 35: Average Household Income in relation to Distance to Input Markets
Source: ILUA Data Note: Higher incomes are mostly found in the 0 – 50 km range of input markets. Where the incomes are high in the 50 – 250 km range, the areas are either urban or national parks

73
3.8.3 ACCESS TO CREDIT
Farmers in Zambia like those in most of the developing world generally lack cash resources to meet immediate cash needs (including farm inputs) and access to credit from financial institutions. Because credit is acknowledged to be in short supply, it is often very costly when available. The Government and NGOs attempt to fill the vacuum of lack of access by providing either cash or input credits to farmers (see Table 18). Some farmers sometimes receive input credit from private companies for the cultivation of cash crops such as cotton, tobacco etc. In terms of access to credit services, the survey results show that provinces like Eastern, Luapula, Northern and Southern have high levels of access as compared to the others. The high access to credit in these provinces is simply a reflection of the fact that the households in these areas are beneficiaries of the input credit under the Fertilizer Support Programme. Figure 36 shows the relation between the total livestock owned and access to livestock credit. The figure suggests that households which are in close proximity to livestock credit services are more likely to own more livestock than their counterparts in far flung areas. This again reflects the differences in infrastructure development with the provinces like Eastern and Northern and provinces along the line of rail with urban centers and relatively better facilities having an advantage. Credit for livestock production activities for smallholder farmers is almost non‐existent in the country. There has been a gap in the provision of financial services in the rural areas. This followed the collapse of most of the subsidized and publicly funded rural finance institutions in the mid‐1990s. This situation has been further aggravated by the closure of many commercial bank branches in peri‐urban and rural areas due to the stagnation in the rural economy and the poor infrastructure. Table 18: Distribution of households by access and proximity to credit services
% Distribution of H/H by Distance to Access Credit Services
Area
No of H/Hs Surveyed
% of H/Hs accessing Credit Services Dist =<5km Dist >5km
Central 223 23 44 54 Copperbelt 77 40 68 29 Eastern 186 65 56 43 Luapula 141 65 2 98 Lusaka 61 46 46 54 North Western 187 29 7 91 Northern 377 61 8 92 Southern 210 59 21 79 Western 221 33 4 96 Total 1683 48 22 78 Source: ILUA data

74
Figure 36: Total livestock in relation to distance to livestock credit
Source: ILUA data Note: Figure suggests that there is more livestock where distance to livestock services is shorter than where they are far. This lack of financial services in the rural areas has remained one of the constraints to rural development. In general, the financial market reforms have had a strongly negative impact on the access of small‐scale farmers to credit. Many small‐scale farmers who could have borrowed from the development banks or other institutions are unable to meet the more stringent collateral requirements. This limited and often complete lack of access to rural financial services hampers smallholder's efforts to improve or expand their farm activities so as to earn income. The challenge thus remains to find solutions to the problem of access to credit by small‐scale farmers who lack collateral assets. Many institutional innovations have been introduced in recent years to solve this problem but these have not performed very well.
3.8.4 ACCESS TO EXTENSION SERVICES An important responsibility of the government to the farming population is to provide them with extension services through extension workers of the Ministry of Agriculture and Cooperatives (MACO). The effectiveness of government in providing this vital service is affected by trained personnel. Given the limited coverage of extension services in the country in general, it was not surprising to observe that about a half of the households surveyed in North Western, Western, Copperbelt and Lusaka provinces do not have access to agricultural extension staff (Table 19).

75
Figure 37 shows the relation between the total livestock owned and access to extension services. The figure suggests that households which are in close proximity to extension services are more likely to own more livestock than their counterparts in far flung areas. This again reflects the differences in extension service provision with the provinces like Eastern and Northern and provinces along the line of rail with larger farming communities and relatively better facilities having an advantage. Table 19: Distribution of Households by Access and Proximity to Extension Services
% Distribution of H/H by Distance to Access Extension Services
Area
No of H/Hs Surveyed
% of H/Hs accessing Extension Services Dist =<5km Dist >5km
Central 223 63 19 79 Copperbelt 77 49 45 53 Eastern 186 57 60 38 Luapula 141 71 29 69 Lusaka 61 49 47 47 North Western 187 48 29 66 Northern 377 71 25 72 Southern 210 74 22 78 Western 221 46 13 83 Total 1683 61 28 69 Source: ILUA data Figure 37: Total livestock in relation to distance to extension services
Source: ILUA data Note: Figure suggests there is more livestock where distance to extension services is shorter than where they are far.

76
It can also be observed that the majority of all the sample households in most of the provinces were at distances of over 5km from their sources of extension services. The relatively low access to extension in most rural provinces relative to the others is due to several factors. Some of these have to do with public expenditure cutbacks which have meant that there are fewer extension workers being recruited to service the rural communities. In relative terms, the rural provinces like Western and North Western Province also have higher poverty levels as compared to the others and some of these remote rural areas tend to be shunned in terms of service provision.
3.8.5 ACCESS TO VETERINARY SERVICES Access to veterinary services is often looked at as a measure of the policy intent to agricultural development especially in rural areas where communities are major livestock producers. The survey results show that access to veterinary services is relatively high with the surveyed farmers in most of the provinces having access to veterinary services. However, access is quite low in urban provinces like Copperbelt (16%) and Lusaka (30%), and in rural provinces like North Western (40%) and Western Province with 47% of the sample households indicating access to veterinary services (see Table 20). Table 20: Distribution of households by access and proximity to veterinary services & drugs Access to Veterinary Services
% Distribution of H/H by Distance to Access Veterinary Services
Area
No of H/Hs Surveyed
% of H/Hs accessing Veterinary Services Dist =<5km Dist >5km
Central 180 76 13 87 Copperbelt 75 16 8 83 Eastern 135 82 52 47 Luapula 141 65 0 100 Lusaka 60 30 28 61 North Western 181 40 12 88 Northern 375 65 15 82 Southern 194 79 18 82 Western 215 47 11 84 Total 1556 61 18 81 Access to Veterinary Drugs
% Distribution of H/H by Distance to Access Veterinary Drugs
Area
No of H/Hs surveyed
% of H/Hs accessing Veterinary Drugs Dist =<5km Dist >5km
Central 223 61 9 91 Copperbelt 77 19 13 80 Eastern 186 61 42 57 Luapula 141 61 0 100 Lusaka 61 28 29 59
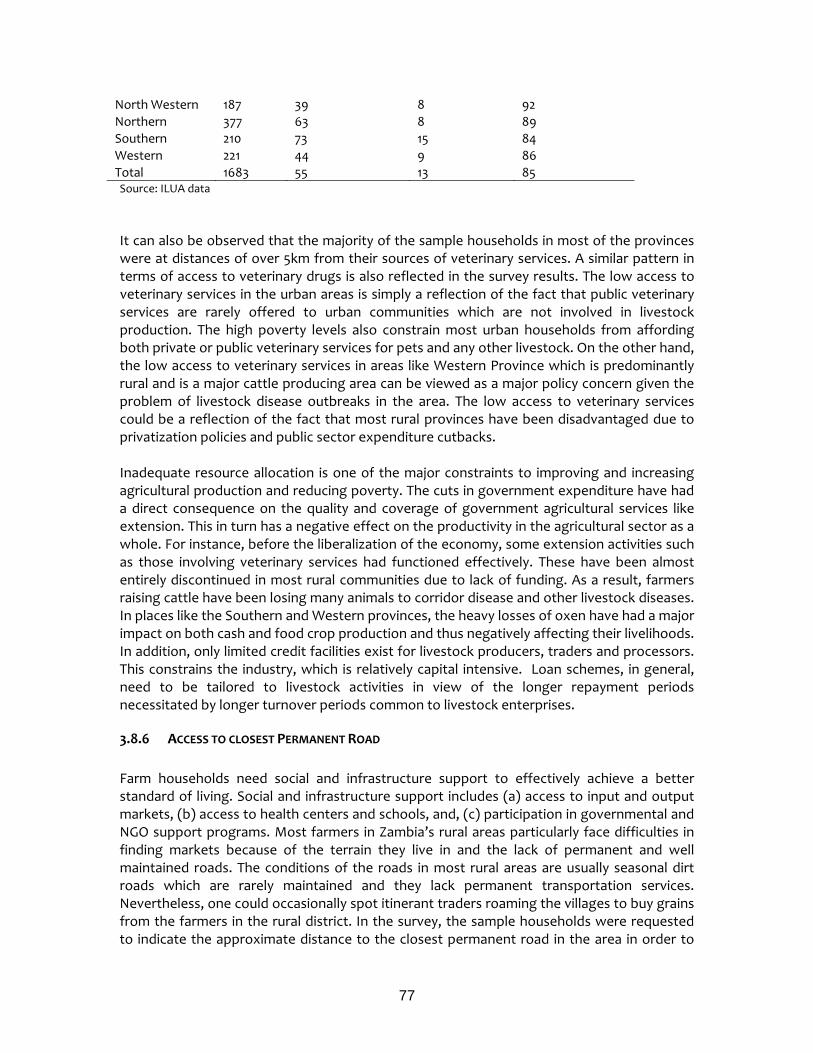
77
North Western 187 39 8 92 Northern 377 63 8 89 Southern 210 73 15 84 Western 221 44 9 86 Total 1683 55 13 85 Source: ILUA data It can also be observed that the majority of the sample households in most of the provinces were at distances of over 5km from their sources of veterinary services. A similar pattern in terms of access to veterinary drugs is also reflected in the survey results. The low access to veterinary services in the urban areas is simply a reflection of the fact that public veterinary services are rarely offered to urban communities which are not involved in livestock production. The high poverty levels also constrain most urban households from affording both private or public veterinary services for pets and any other livestock. On the other hand, the low access to veterinary services in areas like Western Province which is predominantly rural and is a major cattle producing area can be viewed as a major policy concern given the problem of livestock disease outbreaks in the area. The low access to veterinary services could be a reflection of the fact that most rural provinces have been disadvantaged due to privatization policies and public sector expenditure cutbacks. Inadequate resource allocation is one of the major constraints to improving and increasing agricultural production and reducing poverty. The cuts in government expenditure have had a direct consequence on the quality and coverage of government agricultural services like extension. This in turn has a negative effect on the productivity in the agricultural sector as a whole. For instance, before the liberalization of the economy, some extension activities such as those involving veterinary services had functioned effectively. These have been almost entirely discontinued in most rural communities due to lack of funding. As a result, farmers raising cattle have been losing many animals to corridor disease and other livestock diseases. In places like the Southern and Western provinces, the heavy losses of oxen have had a major impact on both cash and food crop production and thus negatively affecting their livelihoods. In addition, only limited credit facilities exist for livestock producers, traders and processors. This constrains the industry, which is relatively capital intensive. Loan schemes, in general, need to be tailored to livestock activities in view of the longer repayment periods necessitated by longer turnover periods common to livestock enterprises.
3.8.6 ACCESS TO CLOSEST PERMANENT ROAD Farm households need social and infrastructure support to effectively achieve a better standard of living. Social and infrastructure support includes (a) access to input and output markets, (b) access to health centers and schools, and, (c) participation in governmental and NGO support programs. Most farmers in Zambia’s rural areas particularly face difficulties in finding markets because of the terrain they live in and the lack of permanent and well maintained roads. The conditions of the roads in most rural areas are usually seasonal dirt roads which are rarely maintained and they lack permanent transportation services. Nevertheless, one could occasionally spot itinerant traders roaming the villages to buy grains from the farmers in the rural district. In the survey, the sample households were requested to indicate the approximate distance to the closest permanent road in the area in order to

78
assess the level of accessibility of these communities to important social and infrastructure support. As shown in Table 21, on average, the majority of the villages in the communities are located on a radius of 7.5km from the closest permanent road. Table 21: Distribution of households by access to closest permanent road
% Distribution of H/H by Distance to closest Permanent Road
Area Number of H/Hs surveyed D<= 7.5km 5<D=<12.5km 12.5km<D=<22.5km D>22.5km
Central 129 60 12 3 26 Copperbelt 75 81 19 0 0 Eastern 135 89 0 11 0 Luapula 126 76 24 0 0 Lusaka 50 42 30 28 0 North Western 172 60 17 19 3 Northern 360 84 9 4 2 Southern 150 60 19 21 0 Western 201 69 19 5 7 Total 1398 72 15 9 4
Source: ILUA data This distribution in terms of location of communities and proximity of permanent roads is commonplace in most parts of the country. Due to limited investments in infrastructure development of roads, most rural and urban communities tend to build their houses near the few roads available in their localities in order to easily access various services like health centres, credit, schools and markets. Figure 38 shows the relation between having access to credit services and the distance to permanent roads. The figure suggests that households which are in close proximity to permanent roads are more likely to have access to credit services than their counterparts in far flung areas. This again reflects the differences in credit service provision with the provinces like Eastern and Southern and provinces along the line of rail with larger farming communities and relatively better facilities in terms of permanent road networks having an advantage.

79
Figure 38: Households accessing credit in relation to distance to permanent roads
Source: ILUA data Note: In general all households accessing credit are within 0 – 20km of a permanent road. However, the larger number of households is only in the eastern and southern parts of the country.
4.0 CONCLUSIONS AND RECOMMENDATIONS
4.1 General Conclusion The ILUA survey data have proven to be a valuable source of information for establishing a national database on the land use resources and hence can contribute to sustainable natural resource management. The analysis of ILUA data and linking it to ancillary and other geo‐spatial data with special attention to pertinent agricultural issues in Zambia can also be useful in informing policy decision making/formulation as well as in monitoring and evaluating policy impacts. The ILUA survey data present a valuable resource that with careful filtering and analysis can provide a wealth of information about integrated land use within Zambia. The current analyses have barely scratched the surface of what could be further studied with more resources to provide medium to long term analytical expertise. Based on the above assessment of policy‐relevant data needs, it is clear that the ILUA data could assist in policy analysis particularly when addressing the key objective of sustainability and ensuring that the existing agricultural resource base is maintained and improved upon. The ILUA data can give policy makers an indication of the land use and land use conflicts which need to be addressed and therefore the data have a great potential to assist in developing strategies for improving and or maintaining bio‐diversity and promoting forestry conservation and agriculture as well as sustainable utilization of natural resources which are some of the core strategies of the

80
agricultural policy. In addition, the ILUA data could also give some information required regarding food security by giving an indication of cultivated land and other land use patterns.
4.2 Conclusions and Policy Recommendations for the Forest Sector The analysis of the forest sector using the comprehensive ILUA data indicates that the country has substantial forest resources which can be managed and properly utilized to further the country’s development prospects, and indeed to help promote poverty reduction in the rural areas. The data indicate that with the current wood stocking estimated at 2.95 billion cubic metres and with proper management, this is sufficient to meet the country’s current and future demand for forest products. The forest policy and legal framework is quite enabling, and most critical policy measures have been identified and summarized in the country’s forest policies, action plans and legal documents. The critical challenge lies in developing institutional capacity and mobilizing sufficient resource to ensure successful long‐term management of the country’s forest resources. In addition, evidence from the analysis of the ILUA data indicates that most of the country’s forests are in good condition and the rates of deforestation are quite modest. For instance, the data indicate that only 5% of the total forests are severely degraded and over 69% of the forests are in good condition. This contrasts sharply with previous estimates which indicate annual rates of deforestation of as much as 500,000 hectares mainly derived from historical and small sample information. However, until another ILUA is accomplished and because it represents time zero, deforestation rates can only be made using remote sensing images from the past and comparing them to present‐day images. Nevertheless, the ILUA data has enabled new insights to be distilled for forest management decision‐making. Zambia’s forests are extensive and occupy 67 percent of the total land area with 2.8 billion cubic metres of wood stocking, including600 million cubic meters of biomass in forest re‐growth. The total annual maximum allowable cut is 17.5 million cubic metres being, of which 1.6 million cubic metres represents annual maximum allowable cut of commercially valuable tree species. At present, investment in forest development activities and in general forest management and conservation is suboptimal and more public and private investment is needed to promote sustainable forest management and enhance its contribution to the national economy and poverty reduction. There is tremendous potential to develop the wood processing industry and increase value addition to the country’s forest resources for employment and income generation. In addition to attracting private investment, government should embrace and implement forest policy measures that would secure and promote social welfare of the local people to whom these forest resources are most critical. The ILUA socio‐economic data indicates that forests and woodland resources are critical to household food security especially during stressful conditions (drought and floods) and they are an “ice‐box”, “drug store” and “insurance” for the rural poor. Because of high forest dependency and the fact that over two thirds of all forests are located on customary land, the design of the optimal forest regime will invariably reflect this critical importance of forests to local communities and invariably provide policy space for active participation of local communities and user‐groups in managing local forests. Any forest regimes that disenfranchise local communities, given the current land tenure system, will probably not succeed in promoting sustainable management of these vast forest resources. Furthermore, government needs to expedite devolution of
81
rights and management responsibilities over some public forests to local communities, user‐groups, and the private sector, and thereby bring more forests under formal management above 22 percent. But to accomplish this, government needs to undertake a comprehensive land use planning survey, which we believe will provide the basis for forest reclassification and mapping exercise. This is crucial in ensuring appropriate land use planning and optimal allocation of land across competing land uses. This exercise would ensure, for instance, that conservation forest reserves are properly sited on lands that are consistent with long‐term forest conservation and not lands that are highly valuable for agriculture, mineral development, and even residential development. The importance of a comprehensive land use survey and forest reclassification cannot be over‐emphasized. Zambia’s forests are also critical sources of a variety of local and global environmental services. The ILUA data permitted analysis of carbon sequestration and conservation opportunities in the forest sector. The analysis indicates that these forests store significant amounts of carbon and continue to sequester or absorb considerable amounts of carbon‐dioxide from the atmosphere, thereby reducing greenhouse gases. Further, these forests provide critical climate change adaptation strategies at the local level. There is great potential to attract carbon money into the forests sector through afforestation and reforestation programs especially under the proposed Reduced Emissions of Deforestation and Degradation (REDD) initiative of the UNFCCC. If tapped, these resources could enhance the financial incentives from community or joint forest management and government should revise its forest policies and strategies to position itself to benefit from Carbon Development Mechanisms, especially through voluntary carbon markets and in the future through the proposed REDD initiative.
4.2.1 MORE SPECIFIC POLICY RECOMMENDATIONS IN THE FOREST SECTOR Given that more than two‐thirds of all forests are located in customary land and are not formally managed, there is need to increase the proportion of forests that are formally managed, both through decentralization and provision of forest extension services. Therefore, government should bring more forests under formal management and more importantly devolve and share some forest rights and responsibilities over public forests with local communities, user‐groups and the private sector. This effort is well articulated in the FNDP plan, but needs greater political will to support the decentralization process. 1) Government needs to increase efforts and resources to collecting, compiling and
analyzing land use data and particularly to undertake periodic forest inventory and utilization surveys to generate best scientific information to aid policymaking.
2) Government needs to undertake a countrywide forest reclassification exercise and
ensure that production and conservation forests and indeed other forest types are properly located and boundaries determined in full consultation with traditional authorities, local communities (and user groups) themselves since most of these forests are located on customary land.
3) There is need for a second wave of the ILUA survey that would incorporate and address
some of the gaps in the current survey and data to specifically capture forest utilization
82
information to enable detailed analysis of the contribution of the forest sector to poverty reduction, employment and to the national economy.
4) There is need to undertake a comprehensive land use study that would enable the
development of a comprehensive land use information system that will continuously be updated across all ministries to provide policy‐relevant information for land use planning and allocation. Such a cross‐sectoral database would also support optimal allocation of land across sectors and ensure optimal return from land to primary and secondary land owners.
5) A mechanism for sharing benefits from forest conservation and management captured
by downstream sectors (energy, wildlife, tourism, agriculture, etc) with the Forestry Department should be developed and implemented to support optimal and sustainable supply of forest conservation benefits to the economy and also to strengthen sectoral synergies in the economy.
6) The government, working with international stakeholders, should increase public
investment in forest conservation and management to ensure optimal and sustainable supply of global environmental goods and services through sustainable forest management. There is a need for government to exploit the potential benefit from CDM funds by accumulating and documenting carbon credits via recurring forest inventories and selling them in the voluntary carbon credit markets, and further to begin to position itself to fully benefit from the proposed REDD initiatives once they are adopted and operationalized. These funds can bolster the financial flows and incentivize local communities and user‐groups to participate in community based forest management.
7) Furthermore, the government needs to increase investments in the forest sector both by
increasing budgetary allocation to the forestry agency and provide market incentives to attract private sector investment and participation in sustainable management of forests.
8) Finally, government needs to further strengthen and streamline the role of the forest
sector in poverty reduction beyond what is currently reflected in the Poverty Reduction Strategy Paper and the Fifth National Development Plan. And more importantly, linkages between the Forest Department and the Department of Energy should further be strengthened to ensure optimal intervention in the management of wood fuel supply and utilization, and in managing the transition from wood fuel to other renewable energy sources.
4.3 Conclusions and Policy Recommendations for the Agricultural Sector Agriculture in Zambia has great potential for enhancing economic growth and reducing poverty. A vibrant agriculture sector generates significant improvements in the country’s GDP, contributes to employment creation and broadens the country’s tax base. To the extent that the livelihoods of more than 60% of the Zambian population depend on agriculture related activities, development of the sector should generate significant welfare improvements among a large proportion of the Zambian population. It is in this regard that the FNDP positions the agriculture sector as one of the drivers of the anticipated economic

83
growth required to reduce poverty. The sector’s multiplier effects are particularly noteworthy and the restoration of sustainable growth within the sector should guarantee a significant reduction in poverty levels currently being faced by 68% of the Zambian population. Agriculture productivity, especially among small scale farmers and more so among female headed households, is currently affected by inadequate access to productive assets such as oxen, and mechanized farm equipment and implements, limited access to improved agricultural inputs, high energy and transport costs, lack of mechanisms to mitigate climate related risks, declining and low soil fertility, inadequate access to agricultural support services such as finance, extension, and market and disease and pest attacks on both crops and livestock. Zambia needs to improve agriculture service provision, productivity, and production and market competitiveness in order to reduce the currently existing poverty level (Government of the Republic of Zambia, 2006a). Zambia has comparative advantage in the production of a wide range of food and non food crops, however, it has not capitalised on this comparative advantage to increase production across a wide range of products. The comparative advantages in terms of livestock, fisheries and forestry have not been systematically harnessed. To a large extent the Zambian economy remains largely a mono economy dominated by maize production. Livestock production particularly cattle production has experienced declines in recent years mainly due to diseases and poor animal husbandry practices especially among the low productivity small‐scale sub‐sector. Poor animal husbandry practices may be attributed to the low farmer‐extension worker interaction arising from a weak or inadequately funded public veterinary extension system. ILUA data has shown that a majority of the farm households in Zambia rely on traditional land tenure system to acquire farm land. The predominance of the customary tenure system in the country is an indication of the importance of the use value rather than the commodity value of land among the small‐scale farm households. However, this should not obscure the fact that land is increasingly gaining commodity value in parts of the country as indicated by the growing number of land disputes, purchases and registrations to convert land held under customary tenure to leasehold tenure. In terms of livestock production, improving management and providing adequate nutrition are critical factors to increasing livestock productivity in the communal lands. Ineffective disease treatment and vaccination programmes, inappropriate calving/kidding seasons, free movement of stock in communal land causing easy transmission of diseases have resulted in high mortality rates and low productivity of the communal livestock system. Use of improved inputs is low among small‐scale farmers in Zambia. Access to fertiliser and improved planting materials especially maize has increased considerably with projects such as the Fertiliser Support Programme and the Food Security Pack. Average fertiliser use per hectare was 28 kg in 2002 for maize which is much higher than the rate for Sub‐ Saharan Africa and slightly higher for Africa as a whole but much lower than that for Latin America and Asia. Use of improved inputs is one of the strategies for increasing productivity. The low use of fertiliser is explained by lack of or poor access to fertilizers due to high cost, poor infrastructure resulting in poor supply in remote rural areas, weak technology development and dissemination, among others. Other improvement inputs in the livestock and fisheries sub‐sectors face similar constraints.

84
The ILUA data have also shown that technology dissemination is one of the major constraints to increased productivity. The government institutions mandated to spearhead technology dissemination face serious challenges in their operations. Challenges have included high staff turnover and inadequate funding for operations. In addition, the link between research, extension and the farmer has at most times been weak. A weak and poorly funded extension system has underpinned the constraint to effective technology development and dissemination. It should however be pointed out that the Ministry of Agriculture and Cooperatives has adopted the participatory approach to extension where the farmers play an important part in identifying and driving the research agenda. Over time some successes such as the cassava breeding programme have been recorded. Effective partnerships among government, the private sector and civil society need to be fostered to aid the technology development, dissemination and adoption agenda. ILUA data has also shown that limited agriculture credit or finance has also been one of the major constraints to access to improved inputs and equipment especially among small scale farmers. Financial institutions have not been keen to lend to this category of farmers due to the long term and low returns associated with the sector and the bad credit culture which developed under years of government financed credit to the sector. Small scale access to investment funds remains largely a problem. This study has shown that most farmers in Zambia’s rural areas face serious constraints in accessing input and output markets because of poor infrastructure. The terrain they live in lacks permanent and well maintained roads. The conditions of the roads in most rural areas are usually seasonal dirt roads which are rarely maintained and they lack permanent transportation services. Due to limited investments in infrastructure development, ILUA data shows that the average rural householder has to travel an average of about 7.5 km to reach the nearest permanent road. Such conditions make it very difficult for farmers to get access to essential services such as health, education, markets and extension provision thus negatively affecting the development the rural and agricultural sector.
4.3.1 POLICY RECOMMENDATIONS FOR THE AGRICULTURE SECTOR Based on this analysis of ILUA data which is related to agriculture, the study offers the following policy implications and recommendations: 1. Increased Support of Agriculture The country has a large population under extreme poverty. Even though poverty is widespread, the majority of people in Zambia who are affected by high poverty levels are predominantly found in rural areas. The country’s poor and non‐poor are closely associated with agriculture and the greatest gains in poverty reduction can be achieved through stimulating an efficient agricultural sector. This is further reinforced by the observation that the periods of highest economic growth in most developing countries coincide with the periods when agriculture was most vibrant. This observation in itself implies that for anti‐poverty programmes to achieve the intended, they have to be designed and implemented in a manner that takes into account the large presence of the chronic poor in rural areas. There is need to design poverty reduction programmes that favour improving the efficiency and yield of the agricultural sector. It has been noted that Zambia’s prioritization/allocation of
85
public expenditure within the sector is a source of concern as more funds are allocated to expenditures for subsidies for interventions such as the Fertilizer Support Programme and operations of the Food Reserve Agency at the expense of public goods such as research and technology development and dissemination, extension and infrastructure development which are productivity enhancing investments. Therefore there is need to realign actual spending to prioritize expenditures to benefit important interventions such as agricultural research, extension, and infrastructure which are critical in improving productivity 2. Land Tenure and Access In the area of land policy and in order to achieve sustainable development, the government needs to address the following priority areas: formulation and implementation of land tenure policies to improve access to land by disadvantaged groups, especially the poor; modifications of land tenure systems to promote rural development under indigenous and common property resource management; institutional support for land registration and titling, and land administration services. Given that rural areas in general and rural roads infrastructure in particular have suffered through lack of adequate and sustained investment, the government should provide funding for the construction and rehabilitation of rural infrastructure like feeder roads and bridges in order to facilitate increased marketing and commercial activities in rural communities. Investments in rural infrastructure will help to improve access to land for agricultural production. In livestock production, land tenure insecurity affects livestock production. That is, lack of confidence in secure title to rangeland (especially on communal lands) has been shown to reduce the incentive to manage the land sustainably. To prevent livestock disease transmission, overgrazing and soil compaction, livestock policy and strategies should ensure that pastoralists and livestock managers/farmers have secure tenure rights. 3. Improve Credit Services There has been a gap in the provision of credit services in the rural areas. This limited and often complete lack of access to rural financial services hampers smallholder's efforts to improve or expand their farm activities so as to earn income. The other challenge is the need to find solutions to the problem of access to credit by small‐scale farmers who lack collateral assets. The Government has attempted to fill the vacuum of lack of access by providing subsidized input credit to farmers under the Fertilizer Support Programme and the Food Security Pack Programme. Although these programmes were originally conceived as livelihoods development strategies to shift farmers from subsistence to surplus production, in actual fact they have become a core part of Zambia’s safety net. This intervention is not without its critics. There has been considerable debate about the sustainability of input subsidies and its impact on the private sector. The challenge thus remains to find solutions to the problem of increasing access to credit by poor small‐scale farmers who lack collateral assets. The agricultural credit system requires restructuring to be accessible to the poor. Credit has also been shown to be closely associated with high agricultural productivity and movement out of poverty. Therefore, there is a need for government to facilitate the development of rural financial institutions like commercial banks, credit unions, and credit cooperatives to enhance access to credit by poor small‐scale farmers. There is also a need to provide technical assistance and training to new Rural Financial Institutions (RFIs), especially small‐scale credit unions and credit cooperatives.

86
4. Increase Extension to Livestock The transition to a more commercially‐oriented and more productive livestock production system within the traditional sector necessitates a change in the attitude of livestock keepers. The stimulation of extension, veterinary and other support services, and most critically those associated with input supply and marketing infrastructure is imperative. To date, the public sector has struggled to provide effective services in such a vast country with a scattered livestock and human population. The low population density means that service provision is inevitably very expensive. Consequently, livestock keepers do not receive sufficient technical messages through veterinary and extension workers and thus lack sufficient support services. There is therefore a need for the government to invest and support public extension and veterinary services in order to assist farmers improve their productivity. Several studies confirm that investment in agricultural R&D offers the greatest potential for enhancing productivity and reducing poverty in developing countries in Zambia. 5. Improve Road Systems and other Rural Infrastructure Improving productivity in small‐scale agriculture depends on the adequacy and quality of rural infrastructure like roads and bridges. The main problems facing Zambia’s rural roads are poor planning, lack of funding and severe neglect of rehabilitation and maintenance. These problems have serious implications on the agricultural sector. For instance, many places have become inaccessible to motor vehicles and productive activities have been hampered. It has also resulted in high operational costs for agricultural traders and transport businesses. Most private transporters shun rural areas in preference for urban sites, which have relatively better infrastructure. Many private traders are unable to reach parts of rural areas to collect agricultural produce due to poor conditions of the rural road network and lack of appropriate means of rural transport. In a number of cases, rural populations are denied access to agricultural inputs, educational materials, and health services among others because of inadequate rural transport infrastructure and means of travel. Therefore, there is a need for government to heavily invest in construction and maintenance of both permanent and feeder roads in rural areas. Investment in rural feeder roads, in particular, can have large poverty reduction effects per unit of investment. Roads enable farmers to participate in higher value‐added market chains, in turn significantly contributing to poverty reduction.
4.3 Recommendations for Information Collection in Future ILUA Surveys The main aim of Integrated Land Use Assessment was to collect information that will be used for planning and policy formulation and implementation. The analyses carried out has indicated that gaps do exist in the collected information and there is need to improve on the data collection and analysis in relation to the agricultural and forest policy objectives. The tables in Annexes 2, 3 & 4 present some of the indicators which can be used to monitor or guide policy implementation that could be derived from the available ILUA data. The tables also give an indication of some of the gaps or weaknesses of the ILUA data. Future ILUA surveys need to address these gaps. Some of the proposed data or information that needs to be collected and included in future ILUA surveys include:
87
1) Livestock Production Activities – Livestock production is important due to the numerous goods and services offered both to rural households and the national economy and the society. One of the main constraints to increased livestock production in Zambia is the problem of diseases. Disease outbreaks particularly those affecting cattle are of economic importance given the high losses that the country incurs when they occur. There was therefore a need to capture detailed information about this and the ILUA assessment presented this opportunity. However, this was not done. Livestock and other data should be collected with modeling in mind – so that the most can be got out of the survey. 2) Private Sector Involvement ‐ The current agricultural policy emphasizes the involvement of the private sector in the provision of services such as extension, credit and veterinary services in the development of the sector. This was not fully covered in the ILUA data collected as there was need to assess the extent to which the private sector is providing these services to crop and livestock producers. 3) Forest Resources ‐ There is need to collect more data on forest resources (stocks) and utilization at the various stages from extraction and production to processing, marketing and distribution and final consumption. Data on wood and non‐wood forest products should capture production for subsistence use and for cash income. This data will enable more in‐depth analysis of the link between forestry and poverty reduction especially at the rural level. 4) Land Use Planning ‐ Currently, Zambia lacks systematic and comprehensive land use management plans. The ILUA data does provide useful information to enable policymakers and other stakeholders to formulate and implement optimal national land allocation systems, but the data is not comprehensive enough to lead to concrete policy decisions regarding land use planning and allocation across sectors (i.e., mining, agriculture, wildlife, forestry, urban development etc). It is therefore recommended that future ILUA type surveys should also capture detailed information on land use by sector so that analyses of optimal land allocation and land use options across sectors can be undertaken.

88
REFERENCES
Bwalya S. M., 2000. Demand for wood fuel and substitution possibilities in urban Zambia, paper presented at the Oxford Conference on micro‐evidence, Oxford UK. Central Statistical Office (CSO), 2005. Living Conditions Monitoring Survey Report 2004. Lusaka: Central Statistical Office.
Chidumayo Emmanuel C., 1994. Inventory of wood used in charcoal production in Zambia, A report for the biodiversity support program, world wildlife fund, Washington DC Chidumayo Emmanuel C., 1994. Miombo ecology and management. An introduction. IT publication/Stockholm environmental institute, Stockholm Sweden. FAO, 2004. Manual for environmental and economic accounts for forestry: a tool for cross‐ sectoral policy analysis. Forestry Department, FAO. Government of the Republic of Zambia (GRZ), 2006b. Fifth National Development Plan: 2006‐2010, Lusaka: Ministry of Finance and National Planning. Government of the Republic of Zambia (GRZ), 2002. Poverty Reduction Strategy Paper, Lusaka: Ministry of Finance and National Planning. Government of the Republic of Zambia, 2004c. National Agricultural Policy. Lusaka: Ministry of Agriculture and Cooperatives. Government of the Republic of Zambia, Agricultural Statistical Bulletin, various issues, Ministry of Agriculture and Co‐operatives, Lusaka. Government of the Republic of Zambia, 1999. The Zambia Forest Bill, 1994. Government printers, Lusaka. Hecht, J. E., 1999. 'Environmental Accounting ‐ Where we are now, Where we are heading', Resources, Issue 135, p14‐17. Hibajene S. H., 1994. ‘Woodfuel transportation in Zambia’, Energy, environmental and development series, no. 28; Stockholm environmental institute, Stockholm, Sweden. Hichaambwa, M. and C. Chomba, 2005. The National Agricultural Policy: The Way Forward‐An Overview of existing National and Sub‐sector Policies and their Linkages to the Agriculture Sector. Report prepared for the Ministry of Agriculture and Cooperatives, and the Agriculture Consultative Forum. August 2005 International Monetary Fund (IMF). 2007. Zambia: Poverty Reduction Strategy Paper—Joint Staff Advisory Note. Washington, D.C. IMF Country Report No. 07/277. http://www.imf.org (last accessed in March 2008)

89
Jumbe, C., S. Bwalya and M. Husselman, 2008. "Contribution of Dry Forests to Rural Livelihoods and the National Economy in Zambia." Presented at "Governing Shared Resources: Connecting Local Experience to Global Challenges," 12th Biennial Conference of the International Association for the Study of Commons, Cheltenham, England, July 14‐18, 2008. Mabugu R and Chitiga M., 2002. “Accounting for forest resources in Zimbabwe.” CEEPA Discussion Paper No 7, CEEPA. University of Pretoria, Pretoria, South Africa. Oskamen, T and Mersmann, C., 2003. Forests in Poverty reduction strategies: An assessment of PRSP processes in Sub‐Saharan Afrin. In Forests in Poverty Reduction Strategies: Capturing the Potential. EFI Proceedings No. 47 (121‐158). European Forest Institute, Finland. Puustjarvi, E., G. Mickels‐Kokwe and M. Chakanga, 2005. The contribution of the forest sector to the national economy and poverty reduction in Zambia. SAVCOR. Forestry Department, Zambia and Ministry for Foreign Affairs of Finland, Lusaka, Zambia. Robinson, T., W. Wint and A. Tatem, 2008. Integrated Land Use Assessment of Zambia: The Geography of the Livestock Sector and Sustainable Pro‐Poor Growth. Report Prepared for the Forest Management and Planning Unit of the Forestry Department, FAO http://ergodd.zoo.ox.ac.uk/download/zambia/faozambiailualivestockvfin.pdf UNDP/ESMP, 1990. Urban household energy strategy report, No. 121/90 World bank. Washington DC. Vincent J. R., 1998. Theoretical Aspects of Forest Accounting. Harvard Institute for International Development, Discussion Paper No. 625. Harvard University, Massachusetts. World Bank, 2007. Zambia: Poverty and Vulnerability Assessment. Poverty Reduction and Economic Management, Southern Africa, Africa Region Report No Report No. 32573‐ZM www‐wds.worldbank.org/.../WDSP/IB/2007/ (last accessed in March 2008) Zahabu, Eliakimu, 2006. ‘Kitungalo Forest area, Tanzania case study’, in Murdiyarso Daniel and Skutsch Margaret (editors), Community forest management as a carbon mitigation option, CIFOR, Bogor, Indonesia. ZPAF, 2000. The Zambia provincial forest action plan, Ministry of tourism, environment and natural resources, Lusaka.

104
ANNEX 2 ILUA Data which can be used to monitor or guide Agricultural Sector Policy implementation
Policy Objective Indicators for policy implementation and inter‐sectoral harmonization which could be derived from ILUA data
Other data needs (What is in the Policies that is not in the data)
Agricultural Sector Objectives To assure national and household food security.
Number of hectare of cropland per farmer including production of cereals, legumes, roots and tubers, tress Percentage of CROPLAND used for permanent (tree) crops Area planted under tree crops, and horticultural crops, Percentage of agricultural land used for livestock Farming Intensity: ratio of actual cultivated land and potential cultivable land Percentage irrigated area to crop area. Distance to markets and marketing incentives exist Increase in the intensity of agricultural land use Percentage of farmers without access to cultivable land and High percentage of land to high income group
Lack of data on storage facilities, both public and on farm Food surplus to deficit areas Area covered under fisheries activities level of income from their production
To ensure that the existing agricultural resource base is maintained and improved upon
Percentage of farmers accessing extension services Accessibility of extension service is to the households Number of hectares of agricultural land per farmer Number of hectares of cropland per farmer

105
Rural population density Persons per (Km square) by arable land Farming Intensity: ratio of actual cultivated land per capita and potential cultivable land per capita Percentage of farmers cultivating on steep slopes or river deltas Percentage of resources owned by WOMEN, MEN, CHILDREN Relative percentages of CROPLAND for which the use of organic fertilizer (code 142) has been recorded Relative percentages of WOODED GRASSLANDS and GRASSLANDS for which an environmental problem (code 84 – 8) has been recorded
To generate income and employment to maximum feasible levels
Relative percentage area reported for each power source (e.g. MANUAL ANIMAL, MECHANISED)
Percentage of the population engaged in employment in the agriculture sector Level of income per household in the rural areas compared to urban areas Percentage Share of income generated from the agricultural sector per household
To contribute to sustainable industrial development and to expand significantly the sectors’ contribution to the national balance of payments
Production of agricultural products. Percentage of the population using traditional fuels Relative percentage of WOODED GRASSLANDS and GRASSLANDS diversified farm output, Percentage of farmers accessing extension services
• Lack of data to differentiate between urban and rural economic activities Value‐addition and processing at farm level. Percentage share of

106
Accessibility of extension service is to the households Accessibility to the closest permanent road
income generated from the agricultural sector per household
Sub‐Sector Strategies ‐ Crop‐Production Increased agricultural production and productivity and diversification of crop production and utilization.
Value of inputs that have been used for agricultural purposes Relative percentage of CROPLAND for which the use of organic fertilizer (code 142) has been recorded Percentage irrigated area to cropland area Farming Intensity: Ratio of actual cultivated land potential cultivable land Ratio of cultivated land to fallow land Prevalence of improved techniques for intensive production (crop rotation, multiple cropping)
Increased utilization of agricultural inputs like quality seed and fertilizer for intensification.
Percentage of farmers accessing extension services Accessibility of extension service is to the households Distance to markets and marketing incentives exist Relative percentages of persons making decisions for crop and livestock management in the household Relative percentages of persons who buy improved seeds and fertilizers Accessibility to the closest permanent road
Value of inputs that have been used for agricultural purposes
Improved water and soil management.
Extent of environmental problems like poor water quality

107
Availability of water resources Percentage irrigated area to cropland area Percentage of farmers using sustainable agricultural practices Percentage of farmers using environmentally friendly farming systems such as conservation farming Relative percentages of CROPLANDS for which the use of organic fertilizer (code 142) has been recorded
Increased conservation, processing and transformation of agricultural products.
Accessibility to processing facilities (e.g. milling, and cold storage) Percentage of the population using traditional fuels for processing, agricultural products.
Value‐addition and processing at farm level.
Facilitate the transfer of and improvements in on farm crop handling and storage technologies in order to minimize post harvest losses.
Percentage of farmers using improved storage facilities Distance to markets and marketing incentives exist Accessibility of extension service is to the households Relative percentage area on which grazing activities have been reported/observed (within the ILUA land use sections) by agro‐ecological zone Relative percentages of WOODED GRASSLANDS and GRASSLANDS by agro‐ecological zone Extent of environmental problems like overgrazing
Improved quantity and quality of traditional export crops, such as cotton, coffee and tobacco in order to
Accessibility of extension service is to the households Density of road network (in kilometres per hectare of agricultural land)
Lack of data for on the market potential for export crops

108
improve their competitiveness on international markets.
Distance to markets and marketing incentives exist Percentage of agricultural land used for export crops (Cotton, Coffee and tobacco)
Encouragement of the private sector to invest in production, processing and marketing of inputs and agricultural produce.
Accessibility to the closest permanent road Access to credit for the purchase of inputs
Extent of private sector involvement in the market Distance to banking facilities
Fisheries Development To promote community based resource management of capture fisheries.
Percentage of farmers with fish ponds Accessibility of extension service is to the households Percentage of farmers accessing fisheries extension services Accessibility of fingerings for fish stocking per household Percentage of farmers accessing loans for fish ponds Accessibility to the water bodies Extent of environmental problems like poor water quality
Lack of data on fisheries and fish stocks reported by households
To enhance fish production and productivity.
Percentage of farmers accessing fisheries extension services Relative percentages of persons making decisions for fisheries management in the household Relative percentages of persons who use sustainable fishing methods Percentage of farmers accessing extension services on fisheries
Lack of data on fish stocks reported by households

109
Extent of environmental problems like poor water quality Percentage of the population using traditional fuels for processing, and curing fish.

110
ANNEX 3
ILUA Data which can be used to monitor or guide Livestock Policy implementation
Policy Objective Indicators for policy implementation and inter‐sectoral harmonization which could be derived from ILUA data
Other data needs (What is in the Policies that is not in the data)
Animal Production and Extension To enhance the productivity of livestock through prevention of livestock diseases, pests, parasite, and promotion of appropriate husbandry practices including sustainable range management.
• Percentage of agricultural land used for livestock • Relative percentage area on which grazing activities have been reported/observed (within the ILUA land use sections) • Relative percentage area for which GRAZING has been reported under 'Forest Service and Benefit') • Relative percentages of households indicating GRAZING as an activity • Relative percentages of WOODED GRASSLANDS and GRASSLANDS • Percentage of farmers accessing veterinary services • Percentage of farmers accessing veterinary drugs
• Lack of data on specific livestock diseases, pests, and parasites reported by households, etc.
To provide and harmonize an efficient livestock extension system as a means of transferring proven technologies and empowering small scale farmers with better management skills.
• Percentage of farmers accessing extension services • Percentage of farmers accessing veterinary drugs • Percentage of livestock owned by WOMEN, MEN, CHILDREN • Relative percentage area reported for each power source (e.g. MANUAL ANIMAL, MECHANISED) • Relative percentages of CROPLAND for which the use of organic fertilizer (code 142) has been recorded • Relative percentages of WOODED GRASSLANDS and GRASSLANDS for which an environmental problem (code 84 ‐ 8) has been recorded
To promote the conservation of environment and indigenous farm animal genetic resources for sustainable livestock
• Relative percentages of LIVESTOCK TYPES • Percentage Share of local breeds by livestock type

111
production. To promote, facilitate and enhance the participation of the private sector in the provision of livestock services.
• Percentage of farmers accessing extension services • Accessibility of extension service is to the households • Percentage of farmers accessing veterinary services and drugs • Accessibility to the closest permanent road
• Lack of data to differentiate between private and public livestock extension service provision
To design, develop and transfer improved livestock housing and handling facilities.
• Percentages of households providing livestock housing by livestock type
• Lack of data on livestock handling facilities
To monitor the quality of livestock products.
• Total sales of livestock, poultry and bee‐keeping products, etc. • sales of livestock, poultry products • Ranking of sales of livestock, poultry and bee‐keeping products • Income source from livestock other than through sale of products
• Lack of data on livestock quality issues
Livestock Research To adapt relevant and sustainable diagnostic techniques to support the control and eradication of diseases and vectors of national importance.
• Value of inputs that have been used for veterinary fees, vaccinations, drugs or services by region
To develop and improve disease surveillance and outbreak investigation methodologies.
• persons making decisions for livestock management in the household • persons who look after the animals • Extent of environmental problems like poor water quality
To facilitate private sector involvement in providing complementary diagnostic services to farmers.
• Accessibility to the closest permanent road
To conduct investigations on the nutritional status of livestock in the traditional sector and recommend appropriate mitigation measures and use of crop residues/agro‐industrial by‐products for enhanced crop production.
• Relative percentages of feed supply used for the livestock • Relative percentages of grazing (COMMUNAL, FENCED ‐ IMPROVED PASTURES, FENCED ‐ UNIMPROVED PASTURES, TETHERED, PADDOCKED)
To conduct range and • Percentage of agricultural land used

112
pasture management surveys in agro‐ecological zones of Zambia.
for livestock by agro‐ecological zone • area on which grazing activities have been reported/observed (within the ILUA land use sections) • area GRAZING has been reported under 'Forest Service and Benefit') by agro‐ecological zone • households indicating GRAZING • WOODED GRASSLANDS and GRASSLANDS • Extent of environmental problems
To conduct characterization of indigenous livestock breeds and promote their conservation.
Percentage Share of local breeds by livestock type
• Lack of data for specific names of livestock breeds
To facilitate the development of private sector participation in livestock production and health research.
• Accessibility to the closest permanent road
Animal Health To control diseases of national economic importance.
• farmers accessing extension services • Accessibility of extension service is to the households • farmers accessing veterinary services • Accessibility of vet. service to household • farmers accessing veterinary drugs • Accessibility to veterinary drugs • Accessibility to the closest permanent road • Extent of environmental problems like poor water quality
• Lack of data on livestock diseases reported by households
To facilitate sustainable community intervention/participation in disease and vector control programmes.
•persons making decisions for livestock management in the household •persons who look after the animals in the household • farmers accessing extension services • farmers accessing veterinary services • farmers accessing veterinary drugs • Extent of environmental problems like poor water quality
• Lack of data on livestock diseases reported by households
To strengthen the capacity of dealing with emerging and current public health issues as the industry
• Accessibility to the closest permanent road
• Lack of data on livestock diseases reported by households

113
develops.
To ensure safe and wholesome food of animal origin.
• Accessibility to water resources • Extent of environmental problems like poor water quality
To promote and facilitate private sector participation in disease and vector control programmes.
• Accessibility to the closest permanent road

114
ANNEX 4 ILUA Data which can be used to Monitor or Guide Forestry Policy Implementation
Policy Objective
Indicators for Policy Implementation and Inter‐sectoral harmonization which could be derived from ILUA data
Other data needs (What is in the policies that is not in the Data
To enhance the quantitative and qualitative contributions of the sector towards the nation’s socio‐economic development in a sustainable manner.
Percentage of forestry contribution to national and social economy of the country Percentage of population of people employed in the forestry industry
Percentage of Forestry Sector Contribution to Poverty Reduction and HIV/AIDS
1. To ensure the integrity, productivity and the development potential of the forest reserves,
Number of Hectares under protected forests
Growing stock of forests in forest reserve
The rate of deforestation in forest reserves
2.To ensure adequate protection of forests, by empowering local communities and promoting the development and use of forest and non‐wood forest products
Number of forests under individuals management
Percentage of forests owned or managed by Local Communities and Government
Number of hectares of forests under management agreement
Number of Forests which are under management plans
3. To promote investment in plantation forestry;
Number of Private Companies involved in Plantation Forestry
Total Hectares of Plantation Forestry
4. To ensure sustainable management of forest ecosystems and biodiversity application through scientific and indigenous technical knowledge;
Number of species in the forest and under forest management plan
Number of silviculture systems applied Areas of species of biodiversity that need classification as protected areas.
Absence of Research in ILUA
5. To promote the growth of forest‐based industries by ensuring raw material supply, facilitating capital formation and ensuring the enhancement of new investments in forest based industries and small scale enterprise;
Status of growing stock for timber species
Percentage of exploitation and technology used
Total number wood based industries and small scale enterprises Total investment in forest based industries

115
6. To ensure sustainable management of forest resources for wood fuel production
Percentage of management systems under wood fuel production Number of management plans for wood fuel production
7.To recognize and support the development of non‐wood forest products;
Percentage of non‐wood forest products marketed and contribute households livelihood
8.To develop research expertise, facilities and create an enabling environment to meet forestry research needs;
Number of Facilities/Institutions that support research activities
Inventory for Research facilities and type research carried out
9.To strengthen and develop extension skills and service delivery to effectively and efficiently reach stakeholders;
Percentage of capacities of Extension staff involved in extension
Data for Extension skills in Extension Staff not provided
10.To develop and broaden skills of forestry personnel and strengthen existing forestry training institutions;
Number of staff and their skills involved in forestry training
Needs Assessment for staff in forestry training
11.To regulate exploitation and ensure efficient use of forest resources and products;
Percentage of forest areas exploited under sustainable forest management system
12. To ensure the contribution of the forest sector to national economy and the generation of foreign exchange for the capitalization of the forestry industry;
Percentage of forest sector contribution to National Economy
Percentage of foreign exchange earnings from forest products
Relatively not covered
13.To ensure gender equity in all aspects of forestry management, production and utilization of forest products, extension training and education
Number of women and men involved in forest management activities such as production and utilization, training, extension
Employment and involvement of men and women in forest activities not covered

116
ANNEX 5
AGRICULTURAL SECTOR POLICY BRIEF Background Although the Central Statistical Office of Zambia (CSO) has been routinely collecting data from surveys, very little effort has been made to look at the data system in an integrated format. An integrated system of data serves as an effective tool for planning both at the national and local level. Food Security analysis may require a diverse system of measurement and could not be effectively analyzed through the Crop Forecast Survey, Post Harvest Survey and the Living Conditions Survey. An integrated instrument that looks at all issues such as land use systems, the environment, and other biophysical characteristics of the environment could help to understand the poverty and food security concerns in Zambia. Therefore, the Government of Zambia, through the Ministry of Tourism, Environment and Natural Resources, with technical and financial assistance from FAO designed and implemented an integrated land use assessment (ILUA) survey. FAO’s Forestry and Agriculture Departments collaborated in the design and planning of the ILUA, building upon an approach developed for National Forest Assessments (NFA). Variables related to sectors beyond forestry (cropping, livestock, and environment) were included, and field manuals and survey forms were developed. The Integrated Land‐Use Assessment (ILUA) compiled a wide array of data on the land‐use situation in Zambia. This integrated system of data has been used for policy analysis in this study. The ILUA database serves as a valuable source of data for establishing a national database on Zambia’s land use resources and hence contributing to sustainable natural resource management. The analysis of ILUA data and linking it to ancillary and other geo‐spatial data with special attention to pertinent agricultural issues in Zambia can also be useful in informing policy decision making/formulation as well as in monitoring and evaluating policy impacts. The ILUA survey data present a valuable resource that with careful filtering and analysis can provide a wealth of information about land use patterns within Zambia. Country researchers were commissioned to identify and generate policy related information from the basic ILUA survey data. The aim of this assignment was to generate information on indicators from the statistical ILUA data sets which have the potential to support, inform and enhance policy formulation and implementation on land use. To meet these objectives the study aimed to shed light on several questions, one of them being: What is the current status of agriculture (crop and livestock) as a source of livelihood? To address this, a number of policy‐relevant questions such as: What crops and livestock are people producing and how much income is generated from these activities? Other questions such as what are the levels of access to agricultural services and input utilization were addressed.

117
Major Conclusions • Agriculture in Zambia has great potential for enhancing economic growth and reducing
poverty. A vibrant agriculture sector generates significant improvements in the country’s GDP, contributes to employment creation and broadens the country’s tax base. To the extent that the livelihoods of more than 60% of the Zambian population depend on agriculture related activities, development of the sector should generate significant welfare improvements among a large proportion of the Zambian population.
• The main food and cash crop is maize, which is cultivated by the majority of the surveyed
households and accounts for 25% of the cultivated area. Other important crops are groundnuts, taking 15% of the cultivated area; Cassava (14%), beans (10%), Millet (8%) Sweet potatoes (7%) and others. The dominance of maize cultivation has policy implications in terms of promoting appropriate land use, diversification of crops and the provision of research and extension services. Government can consider promotion of crop diversification in order to improve food security especially in marginal areas which fail to support maize production.
• Households keep livestock, especially small ruminants and poultry, in addition to their
crop production activities as a livelihood and risk management strategy. The farm households in the sample own cattle and most keep some combination of small livestock like goats, pigs, chickens, ducks, turkeys, and other poultry. Cattle are the most important livestock species owned by the households especially in Central, Lusaka, Eastern, Southern and Western provinces where they account for more than 75% of the total Livestock Units (LU).
• The majority of farm households in Zambia rely on traditional land tenure system to
acquire farm land. The predominance of the customary tenure system in the country is an indication of the importance of the use value rather than the commodity value of land among the small‐scale farm households. However, this should not obscure the fact that land is increasingly gaining commodity value in parts of the country as indicated by the growing number of land disputes, purchases and registrations to convert land held under customary tenure to leasehold tenure. In terms of livestock production under communal systems, improving management and providing adequate nutrition are critical factors to increase livestock productivity. However, ineffective disease treatment and vaccination programmes, free movement of stock in communal land causing easy transmission of diseases have resulted in high mortality rates and low productivity of the communal livestock system.
• Use of improved inputs is low among small‐scale farmers in Zambia. Use of improved
inputs is one of the strategies for increasing productivity. The low use of fertiliser is explained by lack/poor access due to high cost, poor infrastructure resulting in poor supply in remote rural areas, inability to afford, weak technology development and dissemination, among others. Use of other improved inputs e.g. seed, be it in the crop, livestock or fisheries sub‐sector face similar constraints.
118
• Access to extension and veterinary services is one of the major constraints to increased productivity. The government institutions mandated to spearhead technology dissemination face serious challenges in their operations. Challenges have included high staff turnover and inadequate funding for operations. In addition, the link between research, extension and the farmer has at most times been weak.
• There are some gaps in the provision of credit services in the rural areas. The limited and
often complete lack of access to rural financial services hampers smallholder's efforts to improve or expand their farm activities so as to earn income. The challenge thus remains to find solutions to the problem of increasing access to credit by poor small‐scale farmers who lack collateral assets.
• Most farmers in Zambia’s rural areas face serious constraints in accessing input and
output markets because of poor infrastructure. The terrain they live in lacks permanent and well maintained roads. The conditions of the roads in most rural areas are usually seasonal dirt roads which are rarely maintained and they lack permanent transportation services. Due to limited investments in infrastructure development, ILUA data shows that the average rural householder has to travel an average of about 7.5 km to reach the nearest permanent road. Such conditions make it very difficult for farmers to get access to essential services such as health, education, markets and extension provision thus negatively affecting the development of the rural and agricultural sector.
Recommendations • High poverty levels are predominantly found in Zambia’s rural areas. The country’s poor
and non‐poor are closely associated with agriculture and therefore the greatest gains on poverty reduction can be achieved through stimulating an efficient agricultural sector. Therefore there is need to design poverty reduction programmes that favour improving the efficiency and yield of the agricultural sector. It has been noted that Zambia’s prioritization/allocation of public expenditure within the sector is a source of concern as more funds are allocated to expenditures for subsidies for interventions such as the Fertilizer Support Programme and operations of the Food Reserve Agency at the expense of public goods such as research and technology development and dissemination, extension and infrastructure development which are productivity enhancing investments. Therefore there is need to realign actual spending to prioritize expenditures to benefit important interventions such as agricultural research, extension, and infrastructure which are critical in improving productivity
• In the area of land policy, the government needs to address the following priority areas:
formulation and implementation of land tenure policies to improve access to land by disadvantaged groups, especially the poor; modifications of land tenure systems to promote rural development under indigenous and common property resource management; institutional support for land registration and titling, and land administration services. In livestock production, land tenure insecurity affects livestock production. That is, lack of confidence in secure title to rangeland (especially on communal lands) has been shown to reduce the incentive to manage the land sustainably. To prevent livestock disease transmission, overgrazing and soil compaction,

119
livestock policy and strategies should ensure that pastoralists and livestock managers/farmers have secure tenure rights.
• The Government has attempted to fill the vacuum of lack of access to credit by providing
subsidized input credit to farmers under the Fertilizer Support Programme and the Food Security Pack Programme. There has been considerable debate about the sustainability of input subsidies and its impact on the private sector. The challenge thus remains to find solutions to the problem of increasing access to credit by poor small‐scale farmers who lack collateral assets. The agricultural credit system requires restructuring to be accessible to the poor. Therefore, there is a need for government to facilitate the development of rural financial institutions like commercial banks, credit unions, and credit cooperatives to enhance access to credit by poor small‐scale farmers. There is also a need to provide technical assistance and training to new Rural Financial Institutions (RFIs), especially small‐scale credit unions and credit cooperatives.
• The transition to a more commercially‐oriented and more productive crop and livestock
production system within the traditional sector necessitates a change in the attitude of livestock keepers. The stimulation of extension, veterinary and other support services, and most critically those associated with input supply and marketing infrastructure is imperative. There is therefore a need for the government to invest and support public extension and veterinary services in order to assist farmers improve their productivity. Several studies confirm that investment in agricultural R&D offers the greatest potential for enhancing productivity and reducing poverty in developing countries in Zambia.
• Improving productivity in small‐scale agriculture depends on the adequacy and quality of
rural infrastructure like roads and bridges. In a number of cases, rural populations are denied access to agricultural inputs, educational materials, and health services among others because of inadequate rural transport infrastructure and means of travel. Investment in rural feeder roads, in particular, can have large poverty reduction effects per unit of investment. Roads enable farmers to participate in higher value‐added market chains, in turn significantly contributing to poverty reduction

120
ANNEX 6
FORESTRY SECTOR POLICY BRIEF Background Although the Central Statistical Office of Zambia (CSO) has been routinely collecting data from surveys, very little effort has been made to look at the data system in an integrated format. An integrated system of data serves as an effective tool for planning both at the national and local level. Food Security analysis may require a diverse system of measurement and could not be effectively analyzed through the Crop Forecast Survey, Post Harvest Survey and the Living Conditions Survey. An integrated instrument that looks at all issues such as land use systems, the environment, and other biophysical characteristics of the environment could help to understand the poverty and food security concerns in Zambia. Therefore, the Government of Zambia, through the Ministry of Tourism, Environment and Natural Resources, with technical and financial assistance from FAO designed and implemented an integrated land use assessment (ILUA) survey. FAO’s Forestry and Agriculture Departments collaborated in the design and planning of the ILUA, building upon an approach developed for National Forest Assessments (NFA). Variables related to sectors beyond forestry (cropping, livestock, and environment) were included, and field manuals and survey forms were developed. The Integrated Land‐Use Assessment (ILUA) compiled a wide array of data on the land‐use situation in Zambia. This integrated system of data has been used for policy analysis in this study. The ILUA database serves as a valuable source of data for establishing a national database on Zambia’s land use resources and hence contributing to sustainable natural resource management. The analysis of ILUA data and linking it to ancillary and other geo‐spatial data with special attention to pertinent agricultural issues in Zambia can also be useful in informing policy decision making/formulation as well as in monitoring and evaluating policy impacts. The ILUA survey data present a valuable resource that with careful filtering and analysis can provide a wealth of information about land use patterns within Zambia. Country researchers were commissioned to identify and generate policy related information from the basic ILUA survey data. The aim of this assignment was to generate information on indicators from the statistical ILUA data sets which have the potential to support, inform and enhance policy formulation and implementation on land use. To meet these objectives the study aimed to shed light on several questions, one of them being: What is the condition of forests and woodland resources in the country? To address this, an attempt was made to provide fresh estimates of the forest stock and identify critical policies and institutional arrangements for maximizing benefits from forest management. Other questions such as the extent to which people are dependent on forests for their livelihoods were addressed.

121
Major Conclusions • The analysis of the forest sector using the comprehensive ILUA data indicates that the
country has substantial forests resources which can be managed and properly utilized to further the country’s development prospects, and indeed to help promote poverty reduction in the rural areas. The ILUA socio‐economic data indicates that forests and woodland resources are critical to household food security especially during stressful conditions (drought and floods) and they are an “ice‐box”, “drug store” and ‘insurance” for the rural poor. Over two thirds of all Zambia’s forests are located on customary land.
• Zambia’s forests are extensive and occupy 67 percent of the total land area with 2.95
billion cubic metres of wood stocking and an additional 600 million cubic meters of biomass in forest re‐growth. The total standing wood stock is estimated at 3 billion cubic metres with 17.5 million cubic metres being the total annual maximum allowable cut, of which 1.6 million cubic metres representing annual maximum allowable cut of commercially valuable tree species.
• The data indicates that the current wood stocking is estimated at 2.95 billion cubic
metres and if properly managed, is sufficient to meet the country’s current and future demand for forest products. The forest policy and legal framework is quite enabling, and most critical policy measures have been identified and summarized in the country’s forest policies, action plans and legal documents. The critical challenge lies in developing institutional capacity and mobilizing sufficient resource to ensure successful long‐term management of the country’s forest resources.
• In addition, evidence from the analysis of the ILUA data indicates that most of the
country’s forests are in good condition and the rates of deforestation are quite modest. For instance, the data indicates that only 5% of the total forests are severely degraded and over 69% of the forests are in good condition. This contrasts sharply with previous estimates which indicate annual rates of deforestation of as much as 500,000 hectares mainly derived from historical and small sample information. Again the ILUA data has enabled new insights to be distilled for forest management decision‐making.
• At present, investment in forest development activities and in general forest
management and conservation is suboptimal and more public and private investment is needed to stir sustainable forest management and enhance its contribution to the national economy and poverty reduction. There is tremendous potential to develop the wood processing industry and increase value addition to the country’s forest resources for employment and income generation.
• Zambia’s forests are also critical sources of a variety of local and global environmental
services. The ILUA data permitted analysis of carbon sequestration and conservation opportunities in the forest sector. The analysis indicates that these forests store significant amounts of carbon and continues to sequester or absorb considerable amounts of carbon‐dioxide from the atmosphere, thereby reducing greenhouse gases. Further, these forests provide critical climate change adaptation strategies at the local

122
level. There is great potential to attract carbon money into the forests sector through afforestation and reforestation programs especially under the proposed Reduction of Emissions Deforestation (RED) initiative under the Kyoto Protocol. These resources if tapped could enhance the financial incentives from community or joint forest management and government should revise its forest policies and strategies to position itself to benefit from Carbon Development Mechanism especially through voluntary carbon markets and in future through the proposed RED initiative.
Recommendations • Given that more than two‐thirds of all forests are located in customary land and are not
formally managed, there is need to increase proportion of forests that are formally managed, both through decentralization and provision of forest extension services. Therefore, government should bring more forests under formal management and more importantly devolve and share some forest rights and responsibilities over public forests with local communities, user‐groups and the private sector. This effort is well articulated in the FNDP plan, but needs greater political will to support the decentralization process.
• Government needs to undertake a countrywide forest reclassification exercise and
ensure that production and conservation forests and indeed other forest types are properly located and boundaries determined in full consultation with traditional authorities, local communities (and user groups) themselves since most of these forests are located on customary land.
• There is need for a second wave of the ILUA survey that would incorporate and address
some of the gaps in the current survey and data to specifically capture forest utilization information to enable detailed analysis of the contribution of the forest sector to poverty reduction, employment and to the national economy.
• There is need to undertake a comprehensive land use study that would enable the
development of a comprehensive land use information system that will continuously be updated to provide policy‐relevant information for land use planning, allocation. Such a database would also support optimal allocation of land across sectors and ensure optimal return from land to primary and secondary land owners.
• A mechanism for sharing benefits from forest conservation and management captured
by downstream sectors (energy, wildlife, tourism, agriculture, etc) with the Forest Department should be developed and implemented to support optimal and sustainable supply of forest conservation benefits to the economy and also to strengthen sectoral synergies in the economy.
• The government, working with international stakeholders, should increase public
investment in forest conservation and management to ensure optimal and sustainable supply of global environmental goods and services through sustainable forest management. There is need for government to exploit the potential benefit from CDM funds by accumulating and documenting carbon credits and selling them in the voluntary carbon credit markets, and further to begin to reposition itself to fully benefit from the

123
proposed RED initiatives once it is adopted and operationalized. These funds can bolster the financial flows and incentivize local communities and user‐groups to participate in community based forest management.
• Furthermore, the government needs to increase investments in the forest sector both by
increasing budgetary allocation to the forestry agency and provide market incentives to attract private sector investment and participation in sustainable management of forests.
• Finally, government needs to further strengthen and streamline the role of the forest
sector in poverty reduction beyond what is currently reflected in the Poverty Reduction Strategy Paper and the Fifth National Development Plan. And more importantly, linkages between the Forest Department and the Department of Energy should further be strengthened to ensure optimal intervention in the management of wood fuel supply and utilization, and in managing the transition from wood fuel to other renewable energy sources.
![SOUTH AUSTRALIAN INDIGENOUS LAND USE AGREEMENT (ILUA ... ILUA... · [ SA ILUA Statewide Negotiations ] Strategic Plan 2006 - 2009 ILUA 2006 artwork 6.3 28/3/06 12:17 PM Page 6. STRATEGY](https://img.pdfslide.us/doc/110x75/5f8a0a48c564c57c6f293bf8/south-australian-indigenous-land-use-agreement-ilua-ilua-sa-ilua-statewide.jpg)