Embed Size (px)
Citation preview

Use of Factor... 91JKAU: Earth Sci., vol. 14, pp. 91-112 (2002-2003 A.D. / 1423-1424 A.H.)
91
Use of Factor Analysis to Identify Sources ControllingGroundwater Chemistry in The Shallow Coastal
Plain Aquifer, Western Saudi Arabia
TARIQ H. BAYUMI and MAHMOUD S. ALYAMANI
Department of Hydrogeology, Faculty of Earth Sciences,King Abdulaziz University, Jeddah, Saudi Arabia
Received: 28/12/2002 Revised: 26/1/2003 Accepted: 28/6/2003
ABSTRACT. R-mode Factor analysis was used to interpret collected dataconcerning the groundwater chemistry from the shallow coastal plainaquifer and relating them to specific factors that brought about chang-es in the water quality. Five factors, accounting for nearly 81% of thetotal variance, were identified. These factors reflect different chemicalprocesses that control the groundwater chemistry. Factor 1 reflects themost important process; namely the intensive evaporation which re-sulted in the highly mineralized water. Other processes that could beassociated with this factor include the chemical weathering of silicateminerals, ion exchange reactions and mixing processes. Factor 2 rep-resents the precipitation and dissolution of carbonate minerals (calciteand dolomite). Factors 1 and 2 could be considered the major factorscontrolling the chemical composition of the groundwater since theyaccount for 50% of the total variance and together, they produce achemical population ranging from low to extremely high saline water,which is confirmed by the chemical analysis results. The other threefactors, which dominate the chemical processes, include oxidation ofpyrite, groundwater pollution and solubility of silica. They could,therefore, be considered as contributor factors to the groundwaterchemistry in an overall scale. Distribution score maps of the first fourfactors were constructed to delineate their relative spatial impact.
Introduction
In Jeddah city, groundwater salinity is extremely high and is characterized byspatial variations of the concentration of major and minor ions. In some areas,
Tariq H. Bayumi and Mahmoud S. Alyamani92
the groundwater salinity may exceed that of the Red Sea water. The occurrenceof the highly mineralization shallow groundwater in the city often createsserious problems to various constructions. Such problems will continue as longas these constructions have contact with the groundwater. Bayumi et al. (2000)introduced a comprehensive study on the shallow coastal plain aquifer. Severalconclusions as well as possible factors affecting groundwater quality were pro-posed to explain the hydrogeological and hydrochemical aspects that control thepresent conditions of the aquifer. Similar results that concern the groundwaterchemistry have been reported by Basamed (2001), who also outlined the com-plexity of the chemical evolution of the groundwater in the northern part of thecity. The wide variation in the groundwater chemistry, suggests that more than asingle source might be operative to control the groundwater quality. Such sourc-es include the high rate of evaporation, irrigation practices, subsurface flowsfrom the eastern wadis and probably salt water intrusion in areas closer to thecoast. Additional recharge of this aquifer in populated region will involveindirect supply from domestic usage. This source of recharge may be significantsince large areas, especially in the central parts, have not been covered bysewage water networks. Instead septic tanks are used. Consideration of thesevarious possible factors could cause rather complexity and confusion whilestudying the chemical evolution of the existing system.
In the presence of substantially large amount of base information concerningthe groundwater chemistry, and the limitation associated with the classicalgraphical approaches, which often allow using a finite number of variables(Ashley and Lloyd, 1978; Dalton and Upchurch, 1978; and Lawrence and Up-church, 1982), multivariate techniques may be useful and come into considera-tion as an essential tool because the relative importance combinations of chem-ical and non-chemical variables can be evaluated.
In the present study factor analysis was adopted to inter-relate the availablechemical elements in order to define the possible potential process(es) thatmight have an influence on groundwater chemistry as well as to delineate areasthat are affected by them.
Area Description
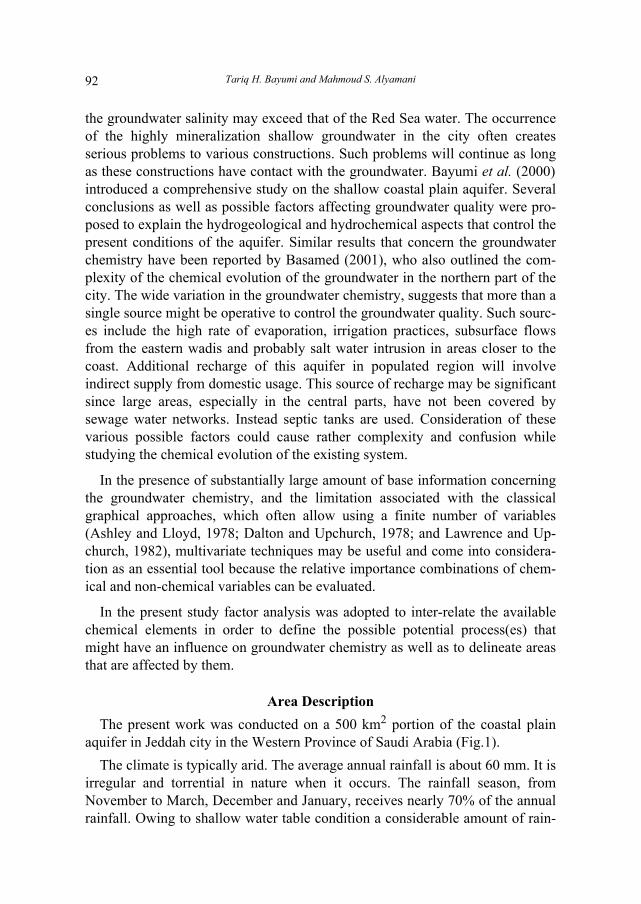
The present work was conducted on a 500 km2 portion of the coastal plainaquifer in Jeddah city in the Western Province of Saudi Arabia (Fig.1).
The climate is typically arid. The average annual rainfall is about 60 mm. It isirregular and torrential in nature when it occurs. The rainfall season, fromNovember to March, December and January, receives nearly 70% of the annualrainfall. Owing to shallow water table condition a considerable amount of rain-
Use of Factor... 93
0 5 10
Km
R o a d N e t w o r k s
J E D D A H
R E
D S
E A
21º45'21 21º30'
30'
39º15'39º05'
S A U D I A R A B I A
FIG. 1. Location map of the study area.
Tariq H. Bayumi and Mahmoud S. Alyamani94
fall is channeled into surface water. Flash floods which generate in the easternwadis drain into the plain and occasionally cause heavy destruction in the city.Temperatures are usually high; the mean maximum temperature is about 38ºCin July. This gives rise to important evaporation processes both qualitativelyand quantitatively, which affects the water balance as well as the water qualityin an overall scale.
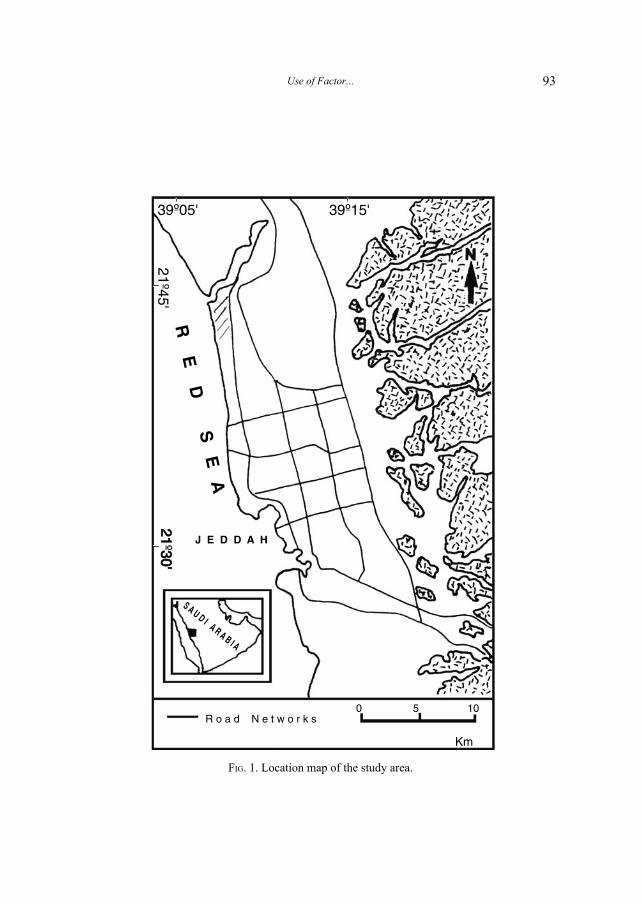
The plain is bounded on its eastern edge by elevated basement outcrops. Gen-erally, the ground elevation decreases toward the western direction from in ex-cess of 300 m.a.s.l to about 4 m.a.s.l. Two topographic regions are recognized;the coastal lowlands and the eastern highlands. The coastal plain aquifer is rath-er shallow, and the groundwater occurs within highly permeable formations;these are surficial soil, sandy gravel and coralline limestone. Solution cavitiesare observed in the limestone. In the coastal lowlands, the water-bearing forma-tion is thin and may be discontinuous, whereas towards the eastern part the al-luvium deposits are rather thick and continuous. Clay layers act as confiningbeds, whereas sandy silt beds serve as aquitards. Shallow water table usuallyexists above clay beds, which prevents deep percolation of groundwater. Theaquifer is mainly unconfined and the water level depth ranges from less thanone meter to 7 meters. Groundwater flows (Fig.2) toward the west under steephydraulic gradient with an average of about 0.03 (Bayumi et al. 2000).
The general chemical character of the groundwater shows higher concentra-tions for most of the major ions. Some of the wells that are located in the north,northwest and southwest yielded extremely high saline water, which almost ex-ceeds the salinity of the Red Sea water (Fig.3). Comparing the water table mapwith The Total Dissolved Solids (TDS) distribution map shows the degree ofmineralization does not increase generally in a down-gradient direction, con-firming that localized effects that previously mentioned are taking place in thearea.
Based on the previous investigations carried out by Hacker et al. (1984), Mooreand Al-Rehaili (1989) and Al-Quahtani (1998) two main lithology units exist:
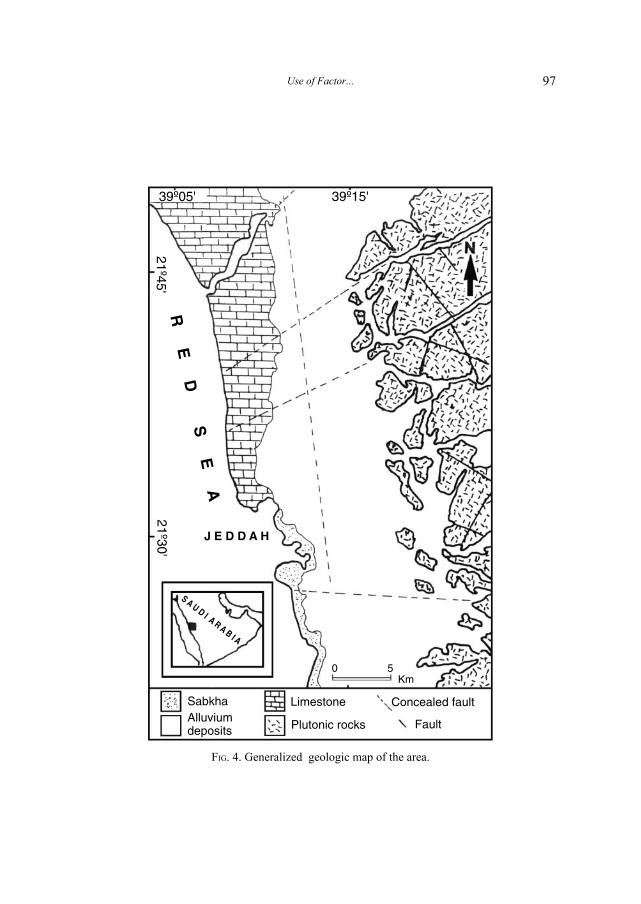
� Quaternary sedimentary formations in the central, western and northernparts. They comprise mainly clastic alluvial sand and gravel in the central andsouthern regions and coralline limestone rocks together with sabkha soils in thewestern and northwestern parts (Fig. 4). These deposits bound and overlie thePrecambrian rocks from the west. They are of continental origin while on the al-luvial plain, start to overlap and mix with marine rocks and soil in the coastalzone. The sabkha soil was deposited in marine environment. It forms a narrowstrip extending less than 1 km, with common salt brine potholes. Clay seems orlenses may be found in this soil at various depths. On the other hand, the lime-stone rocks are found as flat extensive (>10 km wide) plateau, with few
Use of Factor... 95
00 5 10
Km
4
S A U D I A R A B I A
J E D D A H
Watertable line (masl)Data point
R E
D S
E A
21º30'21º45'
39º05' 39º15'
FIG. 2. Water table map.

Tariq H. Bayumi and Mahmoud S. Alyamani96
FIG. 3. Total Dissolved Solids (TDS) distribution map.
Km
0 5 10T D S countour line (mg/l)Data point
Note Contour value × 103
S A U D I A R A B I A
J E D D A H
R E
D S
E A
21º30'21º45'
39º05' 39º15'
Use of Factor... 97
FIG. 4. Generalized geologic map of the area.
SabkhaAlluviumdeposits
Concealed fault
FaultPlutonic rocks
Limestone
0 5Km
S A U D I A R A B I A
J E D D A H
R E
D S
E A
21º30'21º45'
39º05' 39º15'
Tariq H. Bayumi and Mahmoud S. Alyamani98
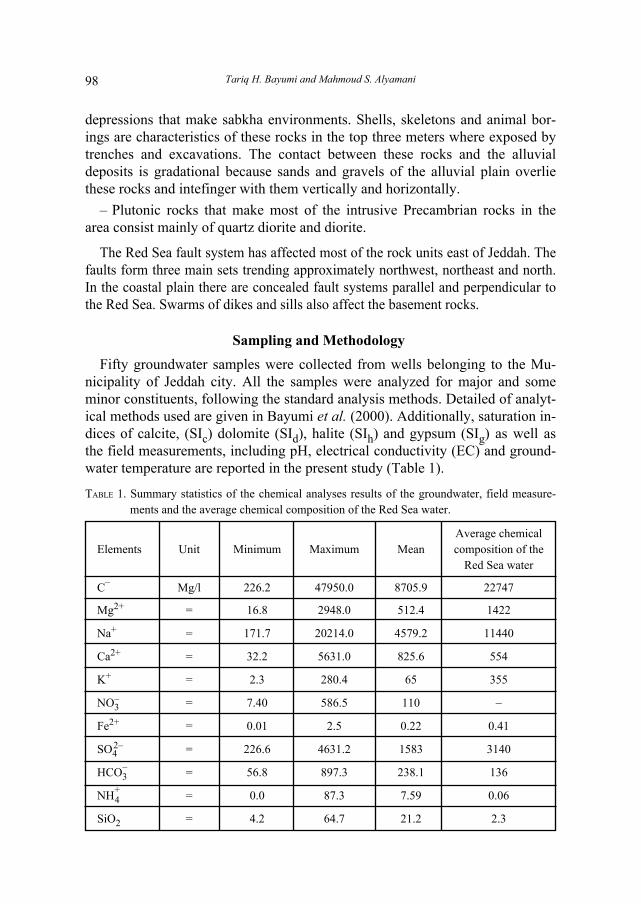
TABLE 1. Summary statistics of the chemical analyses results of the groundwater, field measure-ments and the average chemical composition of the Red Sea water.
Average chemical Elements Unit Minimum Maximum Mean composition of the
Red Sea water
C� Mg/l 226.2 47950.0 8705.9 22747
Mg2+ = 16.8 2948.0 512.4 1422
Na+ = 171.7 20214.0 4579.2 11440
Ca2+ = 32.2 5631.0 825.6 554
K+ = 2.3 280.4 65 355
NO� 3 = 7.40 586.5 110 �
Fe2+ = 0.01 2.5 0.22 0.41
SO42� = 226.6 4631.2 1583 3140
HCO�3 = 56.8 897.3 238.1 136
NH+4 = 0.0 87.3 7.59 0.06
SiO2 = 4.2 64.7 21.2 2.3
depressions that make sabkha environments. Shells, skeletons and animal bor-ings are characteristics of these rocks in the top three meters where exposed bytrenches and excavations. The contact between these rocks and the alluvialdeposits is gradational because sands and gravels of the alluvial plain overliethese rocks and intefinger with them vertically and horizontally.
� Plutonic rocks that make most of the intrusive Precambrian rocks in thearea consist mainly of quartz diorite and diorite.
The Red Sea fault system has affected most of the rock units east of Jeddah. Thefaults form three main sets trending approximately northwest, northeast and north.In the coastal plain there are concealed fault systems parallel and perpendicular tothe Red Sea. Swarms of dikes and sills also affect the basement rocks.
Sampling and Methodology
Fifty groundwater samples were collected from wells belonging to the Mu-nicipality of Jeddah city. All the samples were analyzed for major and someminor constituents, following the standard analysis methods. Detailed of analyt-ical methods used are given in Bayumi et al. (2000). Additionally, saturation in-dices of calcite, (SIc) dolomite (SId), halite (SIh) and gypsum (SIg) as well asthe field measurements, including pH, electrical conductivity (EC) and ground-water temperature are reported in the present study (Table 1).

Use of Factor... 99
On the other hand, the X-Ray Diffraction analysis (XRD) was run on soilsamples obtained from encrustations existing in the sabkha soils as well as innorthwestern area, where the water table is rather shallow or at the ground sur-face. The XRD results indicate that calcite, dolomite and gypsum with smallamount of halite are very common evaporitic salts in surficial soils. However,calculation of saturation indices show that most of the groundwater samplestend to precipitate calcite, dolomite and partly gypsum, but capable of dis-solving gypsum and halite. Precipitation of halite, however, cannot be ruled outalthough this mineral has not reached the equilibrium phase.
A summary statistics of these components and the average chemical composi-tion of the Red Sea water are presented in Table 1.
Factor Analysis (R-mode)
Over the past 30 years, Factor analysis (FA) has been successfully used to sortout the hydrochemical processes and relationships of collected groundwater data(Morin et al., 1979, Lawrence and Upchurch, 1982; Saad and Turgeon, 1988; andDeverel 1989). The goal of FA is to simplify the quantitative description of a sys-tem by determining the minimum number of new variables necessary to reproducevarious attributes of the data. These procedures reduce the original data matrixfrom one having (n) variables necessary to describe the (N) samples to a matrixwith (m) factors (m < n) for each of the (N) samples. Furthermore, the objective of
PO43� = 0.002 7.20 0.217 0.07
Temp. ºC 28.1 38.4 30.2 �
EC µS/cm 1355.0 94000 23104.0 �
TDS Mg/l 1279 78763 16647.0 39797
SId � �0.49 3.76 1.01 �
SIc � �0.23 1.40 0.45 �
SIg � �2.2 0.18 �0.63 �
SIh � �5.61 �1.82 �3.98 �
PH � 6.67 8.50 7.53 �
SId = Saturation index of dolomite, SIc = Saturation index of calcite, SIg = Saturation index of gypsum, SIh = Saturation index of halite.
TABLE 1. Contd.
Average chemical Elements Unit Minimum Maximum Mean composition of the
Red Sea water
Tariq H. Bayumi and Mahmoud S. Alyamani100
factor analysis is to transform the variables so that the axes become orthogonal,which then allows the definition of new independent variables. In doing so, thefirst factor is chosen to explain as much as possible of the total variance of the ob-servations, the second factor to explain as much as possible of the residual var-iance, and so forth. In other words, the first factor is determined such that thesum of squares of the projections of the points on the factor is maximum (factorloadings). Next, to define the second factor, the points are projected on a planeorthogonal to the first factor and so on for the other factors, each explaining lessand less of the total variance. On the other hand, the sum of squares of the fac-tor loadings for each variable is the communality and reflects the proportion ofthe total variability of each variable accounted for by the factoring.
The FA subsumes a fairly large variety of procedures. It follows three mainsteps, namely: extraction initial factors, rotation of factors and calculation ofeach factor scores. In the present work, factor extraction was done by principalcomponents; whereas, varimax rotation with Kaiser normalization was used fororthogonal rotation and results in factors that are uncorrelated (Usunoff andGuzman, 1989). The factor scores that are computed for each observation(Kloven, 1975; and Johnston, 1980) indicate the importance of each factor atthat observation site. Dalton and Upchurch (1978) outlined the importance offactor scores and their relations to potential of the processes described by eachfactor. Negative scores reflect areas essentially unaffected by the processes andpositive scores reflect regions most affected. On the other hand, zero values in-dicate an average degree of influence by the factor. R-mode procedure was ap-plied for finding a comparison of the relations among the variables in terms ofthe samples.
Prior to FA, the data was standardized in order to remove the effects of usingdifferent metrics in describing the various variables as well as to avoid the widerange occurring in their values. The standardized values have a mean value ofzero and standard deviation of one. A detailed mathematical treatment of FAcan be found in several reference books (e.g. Johnston, 1980; and Davis, 1984).The FA is performed with the help of SPSS package (1990).
Results and Discussion
The FA results are summarized in Table 2. Generally the FA gives factors inan equal number of variables employed. In practice, there are no rules to selectthe proper number of factors to retain. In the present study, however, the criteriafor selecting the number of factors essentially depends on the scree-plot test(Johnston, 1980). It starts by plotting the eigenvalues in descending order ofmagnitude, is shown on Fig. 5. The diagram shows a distinct break between thesteepness of the high eigenvalues and the gradual trailing off of the rest of the
Use of Factor... 101
factors. In Fig. 5 , it appears that five factors might be assumed to represent, ad-equately, the overall variance of the data set. However, the five factors retainedaccount for 81.4% of the total variance, while the remaining 14 factors togetheraccount for only 18.6% of the total variance. On the other hand, the high com-munalities indicate that most of the variance of each variable is explained by thefactors extracted. Loadings less than 0.2 have been omitted from the table, sincethey are corresponding, approximately, to less than 5% of a variable.
TABLE 2. Factor loadings and communalities for the groundwater chemistry.
Factor loading
Variables
F1 F2 F3 F4 F5Communality
Ca2+ �0.819 0.410 0.880
Mg2+ 0.933 0.958
Na+ 0.904 0211 0.899
K+ �0.770 0.642
HCO�3 �0.320 0.69 �0.490 0.873
SO42� 0.422 0.680 0.681
Cl� 0.939 0.944
NO�3 0.869 0.830
PH �0.360 0.831 �0.220 0.882
Fe2+ 0.546 �0.418 �0.611 0.880
NH+4 �0.590 �0.430 0.590
PO43� 0.651 �0.461 0.684
SiO2 0.235 0.849 0.805
SIh �0.830 0.740
SIc 0.942 0.925
SId 0.955 0.937
SIg 0.483 0.837 0.977
Temp. �0.227 �0.290 0.832 0.844
EC 0.921 0.939
Eigenvalues 6.06 3.06 2.31 1.97 1.65
Percent of variance 34.0 16.1 12.16 10.37 8.70
Cumulative percent of variance 34.0 50.10 62.30 72.7 81.4

Tariq H. Bayumi and Mahmoud S. Alyamani102
FIG. 5. Screen plot test.
The nature of the factors extracted for the system is discussed below:
Factor 1 accounts for 34% of the total variance. It is characterized by highpositive loadings for Cl�, Mg2+, salinity and Na+ and high negative loading forCa2+, K+ and SIh. On the other hand, Fe2+, SO4
2�, HCO�3 and SIg have moderate
loadings. Examination of these variable loadings indicates that different chem-ical controls might be operating either individually and/or collectively to causean increase in the ionic concentrations of the groundwater. Therefore, the com-bination of these elements shows that factor 1 is most likely associated with thedegree of overall mineralization of groundwater which is effectively derivedfrom high rates evaporation and dissolution processes. The importance of theevaporation process is indicated by the dominance of Cl� ion concentrations (Ta-ble 1). This process could concentrate certain ions to the point that can be pre-cipitated as solid phase minerals. This conclusion is of great importance, sincethe abundance of Cl� ions cannot be justified by the weathering of the rock-forming minerals. Moreover, the XRD analysis of the soil samples indicated thatcalcite, dolomite and gypsum with small amount of halite are very commonevaporitic salts in surficial soils. Although, evaporation process has probably thegreatest influence in determining the groundwater salinity, other processes arealso believed to be influencing the actual chemical composition but the high con-centration of ions could mask such processes. These include the net addition ofK+, Ca2+, Mg2+ and HCO�
3 . The moderate loadings of these elements could beattributed to their release into the groundwater by weathering of silicate minerals.
The diorite rocks, which are the dominant rock unit in the area, could be con-sidered as major contributor of Ca2+, Mg2+, K+ and Fe2+, since these rockscommonly contain hornblende and biotite as the major rock-forming minerals.It is not surprising; therefore, that as groundwater travels through these rocks as
Factor no.
Eig
en v
alue
s
10
1
2
3
4
5
6
7
2 3 4 5 6 7 8 9 10 11 12 13 14 15 16 17 18 19

Use of Factor... 103
well as sediments derived from these rocks dissolves the chemically-alteredproducts. The chemical weathering process may also be considered as a suppliersource of HCO�
3 and SiO2 which are released into solution due to the weather-ing reactions. Surprisingly, SiO2 is not significantly loaded on this factor but isprimarily associated with factor 5. However, Fe2+ and HCO�
3 ions appear inother factors (Table 2), which implies multiple controls. On the other hand, thehigh concentrations of Na+ and Ca2+ in the groundwater (Table 1), and their op-posite loadings on this factor are probably best explained through cation ex-change reactions. There is little evidence of salt water intrusion, nevertheless,its influence cannot be ruled out, especially in areas adjacent to the sea coast.Few samples taken from these areas have a chemical composition similar or ex-ceeding that of the Red Sea water (see Fig.3).
Factor 2 represents 16.1 % of the total variance. Saturation indices of calciteand dolomite, HCO�
3 as well as pH show high loadings in this factor. These ele-ments most likely control and reflect dissolution and precipitation of carbonateminerals.
Factor 3 accounts for 12.2%. It has high positive loadings for SIg and SO42�
with a relatively high negative loading of HCO�3 , Fe2+, and Ca2+ are also load-
ed in this factor. The opposition between SO42� and HCO�
3 probably reflects acompetition between these two anions in reacting with Ca2+; namely pre-cipitating and/or dissolving gypsum and calcite minerals. The appearance ofFe2+ in this factor may indicate oxidation of pyrite (FeS2), which is a very com-mon accessory mineral in the igneous rocks. This may contribute to the re-leasing of Fe2+ and SO4
2� into the groundwater. The moderate negative loadingof NH+
4 in this factor may indicate less oxygenated pathway owing to oxidationof pyrite (Lawrence and Upchurch 1982).
Factor 4 includes relatively high negative loadings of NO�3 and Fe2+ and
moderate positive loadings for PO43� and NH+
4. Most of these elements have nosignificant lithologic sources in the study area and are often associated withgroundwater pollution. The appearance of NH+
4 in this factor has probably af-fected the NO�
3 concentration by reducing nitrogen compound.
Factor 5 represents 8.7% of the total variance. SiO2 and groundwater tem-perature were highly loaded in this factor with moderate loading of PO4
3�. Thisfactor indicates that groundwater temperature is possibly controlling the SiO2solubility (Hem, 1970). The appearance of PO4
3� in this factor is rather difficultto explain.
The relationships among the chemical variables (Fig. 6) show the location ofthe variables loadings in the space defined by F1 with F2, F3, F4 and F5 for thevarimax rotation.

Tariq H. Bayumi and Mahmoud S. Alyamani104
FIG. 6
. Geo
met
rica
l rep
rese
ntat
ion
show
ing
the
rela
tions
hip
betw
een
F1 lo
adin
g w
ith F
2, F
3, F
4 an
d F5
load
ings
.
Use of Factor... 105
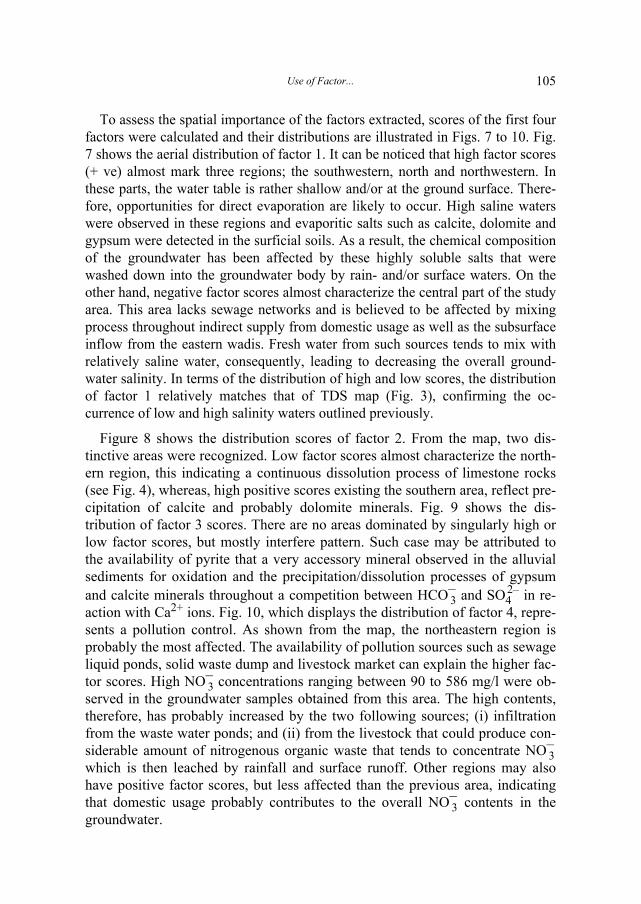
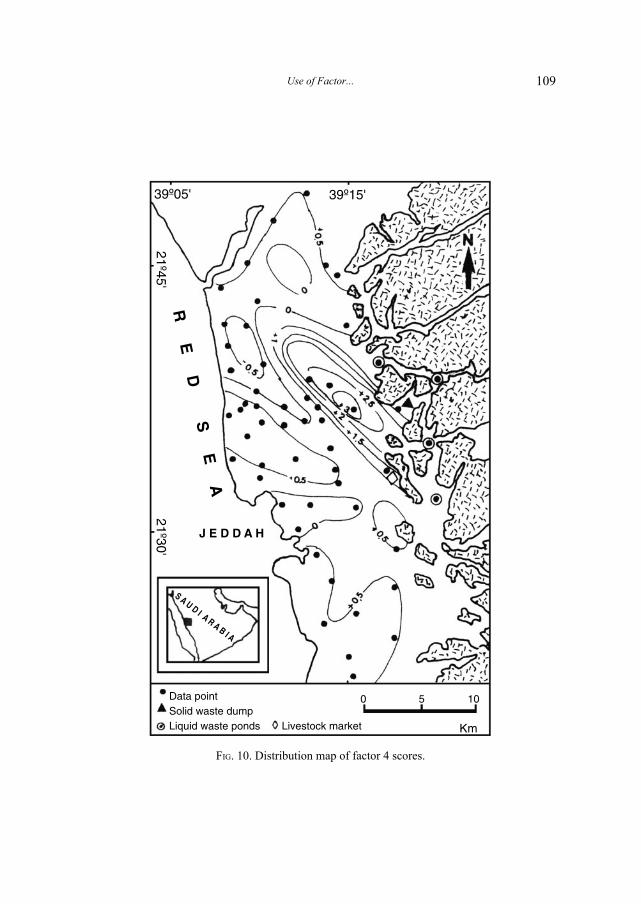
To assess the spatial importance of the factors extracted, scores of the first fourfactors were calculated and their distributions are illustrated in Figs. 7 to 10. Fig.7 shows the aerial distribution of factor 1. It can be noticed that high factor scores(+ ve) almost mark three regions; the southwestern, north and northwestern. Inthese parts, the water table is rather shallow and/or at the ground surface. There-fore, opportunities for direct evaporation are likely to occur. High saline waterswere observed in these regions and evaporitic salts such as calcite, dolomite andgypsum were detected in the surficial soils. As a result, the chemical compositionof the groundwater has been affected by these highly soluble salts that werewashed down into the groundwater body by rain- and/or surface waters. On theother hand, negative factor scores almost characterize the central part of the studyarea. This area lacks sewage networks and is believed to be affected by mixingprocess throughout indirect supply from domestic usage as well as the subsurfaceinflow from the eastern wadis. Fresh water from such sources tends to mix withrelatively saline water, consequently, leading to decreasing the overall ground-water salinity. In terms of the distribution of high and low scores, the distributionof factor 1 relatively matches that of TDS map (Fig. 3), confirming the oc-currence of low and high salinity waters outlined previously.
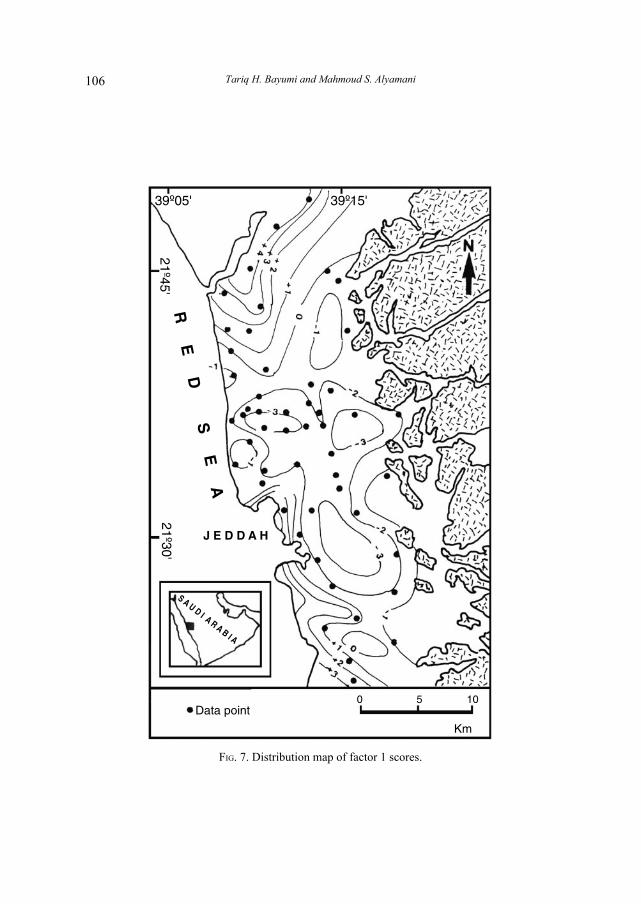
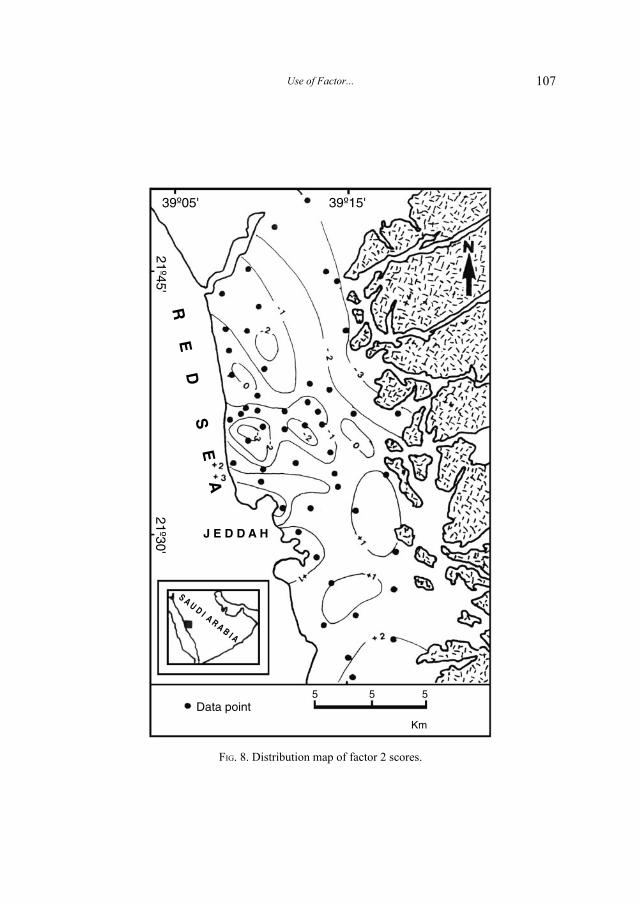
Figure 8 shows the distribution scores of factor 2. From the map, two dis-tinctive areas were recognized. Low factor scores almost characterize the north-ern region, this indicating a continuous dissolution process of limestone rocks(see Fig. 4), whereas, high positive scores existing the southern area, reflect pre-cipitation of calcite and probably dolomite minerals. Fig. 9 shows the dis-tribution of factor 3 scores. There are no areas dominated by singularly high orlow factor scores, but mostly interfere pattern. Such case may be attributed tothe availability of pyrite that a very accessory mineral observed in the alluvialsediments for oxidation and the precipitation/dissolution processes of gypsumand calcite minerals throughout a competition between HCO�
3 and SO42� in re-
action with Ca2+ ions. Fig. 10, which displays the distribution of factor 4, repre-sents a pollution control. As shown from the map, the northeastern region isprobably the most affected. The availability of pollution sources such as sewageliquid ponds, solid waste dump and livestock market can explain the higher fac-tor scores. High NO�
3 concentrations ranging between 90 to 586 mg/l were ob-served in the groundwater samples obtained from this area. The high contents,therefore, has probably increased by the two following sources; (i) infiltrationfrom the waste water ponds; and (ii) from the livestock that could produce con-siderable amount of nitrogenous organic waste that tends to concentrate NO�
3which is then leached by rainfall and surface runoff. Other regions may alsohave positive factor scores, but less affected than the previous area, indicatingthat domestic usage probably contributes to the overall NO�
3 contents in thegroundwater.
Tariq H. Bayumi and Mahmoud S. Alyamani106
FIG. 7. Distribution map of factor 1 scores.
Data point0 5 10
Km
S A U D I A R A B I A
J E D D A H
R E
D S
E A
21º30'21º45'
39º05' 39º15'
Use of Factor... 107
FIG. 8. Distribution map of factor 2 scores.
Data point5 5 5
Km
S A U D I A R A B I A
J E D D A H
R E
D S
E A
21º30'21º45'
39º05' 39º15'
Tariq H. Bayumi and Mahmoud S. Alyamani108
FIG. 9. Distribution map of factor 3 scores.
Data point0 5 15
Km
S A U D I A R A B I A
J E D D A H
R E
D S
E A
21º30'21º45'
39º05' 39º15'
Use of Factor... 109
FIG. 10. Distribution map of factor 4 scores.
Data pointSolid waste dumpLiquid waste ponds Livestock market
0 5 10
Km
S A U D I A R A B I A
J E D D A H
R E
D S
E A
21º30'21º45'
39º05' 39º15'

Tariq H. Bayumi and Mahmoud S. Alyamani110
Conclusions
The FA results show that factor 1 is basically associated with high degree ofgroundwater mineralization, which resulted from evaporation process, which isthe most effective factor causing the groundwater salinity. Chemical weatheringof silicate minerals, dilution due to mixing process between fresh water fromdomestic usage and the sub-surface inflow with high mineralized groundwatertogether with redistribution of Na+ and Ca2+ contents throughout ion exchangereactions contribute to the overall chemical composition of the groundwater.Factor 2 is dominated by precipitation and dissolution of carbonate mineralsprocesses (calcite and dolomite) caused by ground- and surface waters. It alsoaccounts for controlling the relative proportions of Ca2+, Mg2+ and HCO�
3 inthe groundwater. However, both factors 1 and 2 may be considered the majorfactors affecting groundwater chemistry. Oxidation of pyrite may be regardedas a contributor source for SO4
2� and Fe2+. Factor 4 may reflect the groundwaterpollution within the study area. The FA results show the strong effect ofgroundwater temperature on the solubility of silica. The appearance of Ca2+,Fe2+, SO4
2� and HCO�3 in different factors indicates that multi-chemical pro-
cesses are controlling these ions. Factor scores distribution maps provide a gen-eral picture of highly affected areas by these factors.
References
Al-Quahtani, M.B. (1998) Engineering geology of Jeddah metropolitan. Ph.D Thesis, Faculty ofEarth Sci., King Abdulaziz Univ., Jeddah, Saudi Arabia, 335 p.
Ashley, R.P. and Lloyd, J.W. (1978) An Example of the Use of Factor and Cluster Analysis inGroundwater Chemistry Interpretation. J. Hyd. 39: 355-364.
Basamed, A.S. (2001) Hydrochemical Study and Bacteriological Effects on Groundwater in TheNorthern Part of Jeddah District. Unpublished M.Sc. Thesis. Faculty of Earth Sci., KingAbdulaziz Univ., Jeddah, Saudi Arabia, 234 p.
Bayumi, T.H, Alyamani, M.S, Alsubyani, A.M, Aldakheel, A.M. and Alahamadi, M.E.(2000) Analytical Study of Flood Problem and Groundwater Rise in the Jeddah District.Project No. 606/418, Final report Scientific Res. Council, King Abdulaziz Univ., Jeddah,Saudi Arabia, 229 p.
Dalton, M.G. and Upchurch, S.B. (1978) Interpretation of Hydrochemical Facies by FactorAnalysis. Groundwater, 16(4): 228-233.
Davis, J.C. (1984) Statistics and Data Analysis in Geology. 2nd ed., John Wiley and Sons., Inc.,New York, 646 p.
Deverel, S.J. (1989) Geostatistical and Principal Components Analysis of Groundwater Chem-istry and Soil Salinity Data. San Joaquin Valley, California. Proceeding of the BaltimoreSymposium. Regional Characterisation of Water Quality.
Hacker, P., Hotzel, H., Moser, H., Rauret, W., Ronner, F. and Zotal, J.G. (1984) Regionaround Jeddah and its hinterland. In: Jado, A. and Zotal, J.G., (eds.). Quaternary period ofSaudi Arabia, Vol.2. Springer-Verlag, Wien New York: 107-141.
Hem, J.D. (1970) Study and Interpretation of the Chemical Characteristics of Natural Water. 2edEd. USGS Water Supply paper 1473, Washington, 363 p.
Use of Factor... 111
Johnston, R.K. (1980) Multivariate Statistical Analysis in Geography. Longman Inc., New York,280 p.
Klovan, J.E. (1975) R-mode and Q-mode factor Analysis, in: McCammon, R.B. (ed) Conceptsin Geostatistics, Springer-Verlag, New York, 168 p.
Lawrence, F.W. and Upchurch, S.B. (1982) Identification of Recharge Areas Using Geo-chemical Factor Analysis. Groundwater, 20(6): 680-687.
Moore, T.G. and Al-Rehaili, M.H. (1989) Geologic map of the Makkah quadrangle, Sheet 21D,Kingdom of Saudi Arabia: Saudi Arabian Dir. Gen. Min. Res. Geoscience map GM-107C.
Morin, G., Fortin, J.P., Sochanska, W., Lardeau, J.P. and Charbonneau, R. (1979) Use ofPrincipal Component Analysis to Identify Homogeneous Precipitation Stations for OptimalInterpretation. Water Resour. Res., 15(6): 1841-1850.
Saad, M. and Turgeon, A. (1988) Application of Principal Component Analysis to Long-TermReservoir Management. Water Resour. Res., 24(7): 907-912.
SPSS Inc. (1990) SPSS/PC+, Advance Statistics, Marketing Department, Chicago, IL60611.Usunoff, E.J. and Guzman, A. (1989) Multivariate Analysis in Hydrochemistry: An Example of
the Use of Factor and Correspondence analysis. Groundwater, 27(1): 27-34.

Tariq H. Bayumi and Mahmoud S. Alyamani112
w� rJ��� w��« ��UB*« vK� ·dF��« w� q�«uF�« qOK% «b���«qN��« w� q�C�« w�u'« wzU*« Ê«e)« w� WO�u'« ÁUO*« ¡UOLO�
W��uF��« WO�dF�« WJKL*« »d� ,wK�U��«
w�ULO�« bOF� �uL�� Ë w�uO� s�� ��U�e�eF�«b�� pK*« WF�U� ,÷�_« ÂuK� WOK� ,ÁUO*« UO�u�uO� r��
W��uF��« WO�dF�« WJKL*« − �b����
U�UO� dO?�H�� (R) j/ q�«uF�« qOK% WI�d� «b?���« - ÆhK���*«Èb�Ë q�?C�« w�u'« wzU*« Ê«e?)« w� ÁUO*« UMO?F� WOzUO?LOJ�« qO�U?���«- Æ �b?�«u?�*« ÁU?O*« W?O??�u� w� «d?O?G� X�?�?� W?O?�u� q?�«u?F� U?N�U?���«q�«u?F�« Ác� ÆwKJ�« s?�U?��?�« s� % ∏± q�9 q�«u?� fL?� vK� ·d?F?��«u�Ë �Ë_« q�UF�« ÆWO?�u'« ÁUO*« ¡UOLO?� w� rJ��� WOzUOLO?� UOKL� q�9Ê�U?F*« w� e?O�d?��« ��U�� v�≈ È�√ Íc?�« b�bA?�« d�?��« w� q�?L?��Ë r�_«UNM�Ë Èd?�_« UOKLF�« iF� U?N��U?B� b� WOKL?F�« Ác� Æ¡U*« w� W�z«c�«w�u�_« ��U?�?�?�« ö?�U?H� Ë W?O�UJKO?�?�« Ê�U?F?LK� W?OzU?O?L?OJ?�« W�u?�?��«Ê�UFLK� W�«�ù« Ë VO?�d��« UOKL� q�1 w�U��« q�U?F�« ÆjK)« UOKL�ËÊö?�1 w�U��«Ë �Ë_« 5K�U?F�« ö� Æ © XO?�u�Ë� − XO?��U� ® W?O�U�u�dJ�«5O�Ozd�« 5K�UF�« UL��U��?�« sJ1 t�√ Í√ wKJ�« s�U���« s� % µ∞ t���� U�s�c?N� W?�?O?�� Æ W?O?�u?'« ÁU?OLK?� wzU?OL?OJ?�« VO?�d�?�U� ÊU?LJ�?�� s�cK�«w� ÕË«d?�� W?M�U?�?�?� h?zU?B?� «� ÁU?O*« s� U??O?�u� X�uJ� 5?K�U?F�«qOK�?��« ZzU?�� U�b�R� w��«Ë W?�uK*« �b�b?� v�≈ W?CH?�M� s� U?N�?�uK�qL?A� ÁU?O*« ¡UO?L?O?� w� d�R� w��« Èd?�_« Àö?��« q�«uF?�« Æ wzUO?L?OJ�«¡U?A�≈ - ÆU?JOK��« Êb?F??� ÊU�Ë�Ë ÁU?O*« ÀuK�Ë X�d??O?��« Êb?F??� �b?�?�√w�UJ*« dO�Q�?�« b�b��� v�Ë_« WF��_« q�«uF�« ZzU?�� l��u� `{u� jz«d�
Æq�«uF�« pK�� w��M�«