Embed Size (px)
Citation preview

RNAseq Analyses Identify Tumor Necrosis Factor-mediated Inflammation
as a Major Abnormality in ALS Spinal Cord
David G. Brohawn1,2, Laura C. O’Brien1,3, James P. Bennett, Jr.1,3,4,5
1Parkinson’s Disease Research Center, Departments of 2Human Genetics,
3Physiology and Biophysics, and 4Neurology; Virginia Commonwealth University,
Richmond, VA.
5Neurodegeneration Therapeutics, Inc. Charlottesville, VA
Correspondence:
James P. Bennett, Jr. M.D., Ph.D.
Neurodegeneration Therapeutics, Inc.
3050A Berkmar Drive
Charlottesville, VA 22901

Abstract
ALS is a rapidly progressive, devastating neurodegenerative illness of
adults that produces disabling weakness and spasticity that arise from death of
lower and upper motor neurons. No meaningful therapies exist to slow ALS
progression, and molecular insights into pathogenesis and progression are sorely
needed. In that context, we used high-depth, next generation RNA sequencing
(RNAseq, Illumina) to define gene network abnormalities in RNA samples
depleted of rRNA and isolated from cervical spinal cord sections of 7 ALS and 8
CTL samples. We aligned >50 million 2X150 bp paired-end sequences/sample to
the hg19 human genome and applied three different algorithms (Cuffdiff2,
DEseq2, EdgeR) for identification of differentially expressed genes (DEG’s).
Ingenuity Pathways Analysis (IPA) and Weighted Gene Co-expression Network
Analysis (WGCNA) identified inflammatory processes as significantly elevated in
our ALS samples, with tumor necrosis factor (TNF) found to be a major pathway
regulator (IPA) and TNFα-induced protein 2 (TNFAIP2) as a major network “hub”
gene (WGCNA). Transient expression in these neurons of TNFAIP2 (also a DEG
identified by all three algorithms) reduced cell viability and caspase 3/7
activation, signs suggestive of cell death. Using high-density RNAseq, multiple
algorithms for DEG identification, and an unsupervised gene co-expression
network approach, we identified significant elevation of inflammatory processes
in ALS spinal cord with TNF as a major regulatory molecule. Overexpression of
the DEG TNFAIP2 in human motor neurons, the population most vulnerable to
die in ALS, increased cell death and caspase 3/7 activation. We propose that

therapies targeted to reduce inflammatory TNFα signaling may be helpful in ALS
patients. (255 words)

Amyotrophic lateral sclerosis (ALS) is a disease characterized by
degeneration of upper and lower motor neurons (MNs) in the brainstem and
spinal cord. Average life expectancy after diagnosis is between 2-5 years, and
current treatment (riluzole) extends life by only a few months.
~5% of ALS occurs in families (fALS), with 68% of European fALS cases
explained by mutations in 9 loci (as of 2014). However, only 11% of European
sporadic ALS (sALS) patients are accounted for by mutations in these loci (1).
Sporadically occurring ALS (sALS) represents ~95% of all ALS cases (2) and is
widely thought to have both polygenic and environmental contributions (3-4).
“Agnostic” exploratory association studies have been adopted to elucidate the
genetic contributions to sALS (1,5-6).
Gene expression studies identify differentially expressed genes (DEG’s),
which are genes with statistically significantly changed expression values
between groups. Over-representation analyses can be used to infer their likely
biological relevance. These analyses detect statistically significant associations
between an input list of genes compared to predefined groups of genes known to
influence various cellular processes
Shaw et al (6) published a comprehensive review of ALS gene expression
studies dating back to 2001. Tissue types compared between ALS and control
samples included: human bicep, human lymphocytes, rodent gastrocnemius,
human or rodent spinal tissue containing disease-vulnerable MNs, and isolated
spinal MNs. There was a broad range in the number (14 to 1,182) and identity of

ALS group-specific DEG’s discovered in each study.
Interestingly, a recurrent set of associated cellular processes emerged
across over-representation analyses using these sets of DEGs. These included
oxidative stress, mitochondrial dysfunction, apoptosis, cytoskeletal architecture,
inflammation, RNA processing, and protein aggregation. Separate molecular
biology assays revealed increased oxidative damage (7-11), abnormal
mitochondrial morphology (12-18), and elevated inflammation (19-33) in various
ALS tissues from human patients and fALS rodents. Increased inflammatory
tumor necrosis factor (TNF) signaling (28-33) in ALS tissues may have
therapeutic relevance, as it known to carry out cell fate decisions that may
contribute to MN death (34). Taken together, it is likely aberrations in these
processes contribute to ALS onset, progression, and symptoms.
Exploratory gene expression studies comparing disease and control
groups allow us to form novel hypotheses about what genes may functionally
impact disease pathology. Candidate gene selection for downstream molecular
biology experiments is rarely trivial, as these high throughput experiments often
yield considerable options. Commonly, researchers select a candidate gene that
1) was identified as a DEG, 2) was in a group of DEG’s associated with cellular
processes relevant to disease pathology, and 3) has known structural or
functional properties plausibly connecting it to disease features.
Systems-level gene co-expression network analyses provide separate
criteria for candidate gene selection that can be used in conjunction with DEG

analysis results. These analyses typically follow a step-wise process that
involves 1) prediction of interconnected gene networks using all samples’ gene
expression measurements, 2) identification of networks statistically associated
with phenotypic traits (i.e. disease status), 3) over-representation analyses to
identify cellular processes associated with these networks, and 4) identification of
highly connected “hub” genes predicted to organize each prioritized network’s
activity.
This approach has identified networks associated with a polygenic trait
and plausibly related cellular processes, and several of these networks’ hub
genes were already associated with the trait studied using separate molecular
biology techniques (35-36). Arguably more compelling, Horvath et al showed
reducing expression of ASPM (a hub gene identified in a network associated with
glioblastoma and mitosis) via siRNA significantly reduced proliferation rates in
glioblastoma tumor cells in vitro (37).
In this study, we gathered >50 million 2X150 RNA-Sequencing reads in 15
postmortem spinal section tissues (7 ALS patients and 8 neurologically healthy
controls) to characterize transcriptome-wide gene expression differences specific
to our ALS group. We aligned reads to the hg19 reference genome using
Bowtie2/Tophat2 (38). We next performed three DEG analyses, a weighted gene
co-expression network analysis, over-representation analyses of prioritized gene
sets, and molecular assays testing a candidate hub gene’s potential to increase
motor neuron death.

74 DEGs (56 up-regulated and 18 down-regulated) were identified in common
across three analyses (Cuffdiff2, EdgeR, and DeSeq2, 39-41) at an FDR of 0.10.
Our gene network analysis (WGCNA, 42) identified 37 different gene networks,
and 2 were positively correlated with disease status at a p-value <0.01.
QIAGEN’s Ingenuity Pathway Analysis (IPA®, QIAGEN Redwood City,
www.qiagen.com/ingenuity), an over-representation analysis tool, revealed the
56 DEG’s up-regulated in the ALS group and genes comprising the gene network
most strongly correlated to disease status were both associated with numerous
inflammatory processes. Additionally, tumor necrosis factor (TNF) was identified
as an "activated" upstream regulator in both gene groups. We prioritized this
gene network for candidate gene selection, as 1) it was associated with disease
status and 2) inflammatory processes and TNF signaling were recurrently
associated with ALS pathology in previous literature (19-33).
To identify “hub” genes, we used three WGCNA metrics calculated for
every gene within this network. We identified 12 “hub” genes (out of 495 total
network genes) with scores in the top quartile for all three metrics. 9 of these
genes were separately identified as up-regulated DEG’s in the ALS group across
the three DEG analyses. TNFAIP2, a gene that encodes an intracellular protein
of the tumor necrosis factor family, was one of them.
Based on these findings and previous literature, we hypothesized
TNFAIP2 functionally mediates motor neuron death via TNF signaling in motor
neurons. To test this, we compared cell viability and activated caspase 3/7 levels
in human iPSC-derived motor neurons that overexpressed TNFAIP2-GFP or

GFP for 24 hours. We show motor neurons that overexpressed TNFAIP2-GFP
had decreased cell viability and increased activated caspase 3/7 levels
compared to those overexpressing GFP alone. Taken together, these results
suggest TNF signaling may play an important role in ALS pathology and reducing
its activity could be of therapeutic relevance.
Results
Sequencing Metrics
We collected >50 million 2X150 RNA-Sequencing reads per sample in 15
postmortem spinal cord samples (7 ALS and 8 neurologically healthy controls).
The following are averaged metrics compiled using Picard’s
CollectRNASeqMetrics (http://picard.sourceforge.net): 68,613,940 2X150 raw
sequencing read pairs, 20,584,182,060 total sequencing bases, 65.62% of bases
that passed filter and aligned to the hg19 reference genome, 29.01% of aligned
bases to rRNA/tRNA/mitochondrial RNA species, 33.23% of aligned bases to
mRNA species, and 37.76% of aligned bases to intronic/intergenic species.
Individual samples metrics can be found in Supplementary Figure 1.
Presence of known ALS mutations and SOD1 transcription
As of 2014, 11% of sALS in Caucasians were explained by causal
mutations in 9 different loci. Causal fALS mutations have been identified in at
least 13 other genes, and may account for additional sALS cases (1, 43).

Genome Analysis Toolkit (GATK, 44) provides a bioinformatics pipeline
(https://www.broadinstitute.org/gatk/guide/article?id=3891) that identifies
sequencing variants in the form of single nucleotide variants (SNVs), insertions,
and deletions using input sequencing reads (45, 46).
We used GATK to identify variants genome-wide in each of our ALS
samples, then extracted each sample’s variants located within the boundaries of
the 21 genes in Figure 1 (Supplementary Tables 1-7). We next assessed
whether our ALS samples carried any of 471 “pathogenic” coding variants
previously identified in these 21 genes (Supplementary Table 8). We compiled
this list of mutations by gathering all coding (promoters, UTRs, and exons)
variants classified as “pathogenic” in relation to ALS in at least one of three
separate databanks (the databank
http://alsod.iop.kcl.ac.uk/Statistics/pathogenicity.aspx referenced in 43, 47-48).
We discovered an ALS sample (ALS4) carried a “pathogenic” variant from
this list. This variant is a missense mutation (A4V) in the superoxide dismutase 1
(SOD1) locus, and was found in nearly half of ALS4’s sequencing reads
(754/1576) aligning to SOD1. This likely suggests there was no transcriptional
preference for the wildtype or mutant DNA sequence. No other pathogenic
variants were found in ALS4 or the remaining ALS samples. None of these 21
genes were differentially expressed between our patient and control samples.
Differential Gene Expression Testing and Associated Cellular Processes
We elected to identify ALS group-specific DEG’s using Cufflinks/Cuffdiff2,

DESeq2, and EdgeR. Each tool shows strengths and weaknesses in DEG calling
that vary depending on experimental conditions (49), so we ran all three to
minimize biases. Samples averaged 18,750,634 paired-end reads uniquely
assigned to known hg19 genes (excluding rRNA/tRNA/mtRNA genes) for EdgeR
and DESeq2 analyses (Supplementary Figure 2).
At an FDR of .10, Cuffdiff2 identified 425 DEG’s, DESeq2 identified 175
DEG’s, and EdgeR identified 103 DEG’s (Supplementary Tables 9-11). There
were 74 DEG’s identified in common (56 upregulated and 18 downregulated)
across all three analyses (Fig 2).
We next used QIAGEN’s Ingenuity Pathway Analysis (IPA®, QIAGEN
Redwood City, www.qiagen.com/ingenuity) to identify cellular processes and
upstream regulators associated with the up- and down- regulated DEG’s
identified in our ALS samples relative to controls. Downregulated DEGs were
associated with various cholesterol biosynthesis and inflammatory processes
(Supplementary Figure 3). Interestingly, the 56 up-regulated DEG’s were
associated with multiple inflammatory processes (Fig 5), and tumor necrosis
factor (TNF) was identified as a significant upstream regulator.
Weighted Gene Co-Expression Analysis (WGCNA) and the “Black”
Module
We used WGCNA to identify gene “modules”, or networks, from our
dataset. This unsupervised technique identified 37 interconnected gene modules
(arbitrarily assigned to different colors) from a filtered list of 13,301 genes (Fig 3)

without using 1) information about what genes have been shown to interact in
previous literature, or 2) information about which samples were cases or controls.
Two of these modules (“black” and “sienna4”) were positively correlated with
disease status at an uncorrected p-value <.01 (Fig 4).
Interestingly, IPA revealed the 495 genes comprising the module
(Supplementary Table 12) most strongly correlated to disease status (MEblack,
R=0.68, p=0.006) were associated with inflammatory processes and TNF was a
predicted upstream regulator (Fig 5). As these IPA results were highly similar to
those for up-regulated DEGs in our ALS tissues, we next tested whether any of
those DEG’s were found in this module. Intriguingly, we found 64% (42/65) of our
up-regulated DEG’s were contained in this module (Supplementary Figure 4).
We decided to prioritize identified hub genes in this module for candidate
gene selection. We found it compelling that genes in this disease-associated
module and our sALS-group specific up-regulated DEG’s shared associations to
inflammatory processes and up-regulated TNF signaling, despite discovery of
both gene sets using independent exploratory approaches. These findings are
consistent with prior proposals that inflammatory processes and TNF signaling
play a role in ALS pathology (19-33).
WGCNA Hub Gene Identification
A user can identify module hub genes using either WGCNA’s “intramodular
connectivity” score or “modular membership” score calculated for every gene in a
module of interest. The intramodular connectivity score reflects the cumulative

connection strength a given module gene has with all other module genes. The
modular membership score reflects how representative that gene’s expression
values are of the module as a whole.
Hub genes typically have large values for both of these metrics. To further
prioritize one hub gene over another, the authors of WGCNA recommend using
the “gene significance” score. This score reflects how strongly a single gene’s
expression values correlate with disease status across samples.
12 genes in the “black” module had scores in the top quartile for
intramodular connectivity, modular membership, and gene significance metrics
(Supplementary Table 12). 9 of these genes were separately identified as up-
regulated DEG’s in the ALS group (Fig 6). TNFAIP2, a gene encoding an
intracellular protein of the tumor necrosis factor family, was one of these nine.
Figure 7 shows all “black” module genes’ modular membership vs. gene
significance scores, and TNFAIP2 is highlighted in green (MM=0.79, GS=0.81).
Selection of TNFAIP2
We selected TNFAIP2 as our candidate gene for molecular testing as a
result of data-driven findings in our study. First, TNFAIP2 belonged to the “black”
module associated with ALS disease status, inflammatory processes, and TNF
signaling. Second, TNFAIP2 was identified as one of twelve module hub genes
with scores in the top quartile for intramodular connectivity, modular membership,
and gene significance metrics. Third, TNFAIP2 was separately identified as an
up-regulated DEG in our ALS samples using all three DEG-seeking algorithms.

We also considered previous research findings. TNFAIP2 is an
intracellular protein component of the exocyst, and a member of the tumor
necrosis factor family. TNF signaling and inflammation have long been suspected
in ALS pathology (19-33). To our knowledge, TNFAIP2’s cellular functions in
motor neurons have not been studied. TNFAIP2 is known to increase in
response to extracellular TNF (50-52), and has been separately associated with
increased apoptosis (53-55). We hypothesized TNFAIP2 functionally mediates
motor neuron death via TNF signaling in motor neurons.
Molecular Testing of TNFAIP2
To test our hypothesis, we assessed cell viability and activated caspase
3/7 levels in human motor neurons differentiated from induced pluripotential stem
cells (56-58) that either 1) overexpressed a plasmid encoding TNFAIP2 tagged
with an N-terminal GFP (Supplementary Figure 5) or 2) overexpressed the same
plasmid encoding GFP alone (empty vector). These motor neurons had a ~15-22
fold increase in expression of motor neuron specific markers HB9 and ISL1 at
day 21, suggesting successful differentiation (58). qPCR data (Supplementary
Table 13) showed TNFAIP2 expression increased >300-fold in motor neurons
transfected with TNFAIP2-GFP relative to GFP alone.
The MTT cell viability assay showed motor neurons that overexpressed
TNFAIP2-GFP were significantly less viable, and a caspase 3/7 assay revealed
these motor neurons had significantly increased levels of activated caspase 3/7
compared to motor neurons that overexpressed GFP alone (Figure 8). Taken

together, these results suggest overexpression of TNFAIP2 results in motor
neuron death, and may play a functional role in ALS pathology.
Discussion
sALS is a complex trait without a viable treatment, and its polygenic
contributions remain poorly understood. In this study, we combined deep RNA-
Sequencing, systems biology analyses, and molecular biology assays to
elucidate ALS group-specific differences in postmortem spinal tissue that may be
relevant to disease pathology. To our knowledge, this is the only study that
exploits the benefits of next generation RNA-Sequencing (59-60) to measure
gene expression changes in postmortem cervical spinal tissue containing
disease-vulnerable motor neurons from sALS patients. We chose to study gene
expression changes in human postmortem sALS tissue over fALS rodent tissue,
as recent findings suggest the majority of sALS cases do not carry a known
monogenic causal mutation (1) and this tissue is inaccessible at earlier stages of
the disease. The only other RNA-Sequencing study in human postmortem sALS
tissues we are aware of used cerebellar and prefrontal cortex tissues (61), and
also found sALS-group specific DEGs were associated with inflammatory
processes.
Previous ALS studies have used gene network analyses to unveil disease-
associated cellular processes. Those using gene co-expression network
analyses identified ALS tissue networks associated with innate immune
response, stress response, post-translational modifications, inflammatory
disease, and neurological disorders (62-63). Other ALS studies used gene

network analyses that model gene-gene interactions using different criteria.
These criteria include only connecting genes with known interactions in previous
literature, or using information theoretics to eliminate indirect connections
between genes inferred to be connected based on the strength of their co-
expression value alone. These studies identified ALS-specific networks
associated with organismal injury, immune response, post-translational
modification, regulation of the actin cytoskeleton, and extracellular matrix repair
(64-65). Ikiz et al applied the MARINa algorithm to identify major regulators (such
as transcription factors) within a gene network identified in motor neurons in an in
vitro ALS model characterized by MN death (66). They identified 8 genes as
drivers of motor neuron death including NFKB1, a pleiotropic transcription factor
with important roles in innate immune response. Taken together, these findings
support the use of systems-level gene network analyses to identify perturbed
cellular processes in ALS tissues, and hold potential to unveil therapeutic target
genes.
In this study, we discovered only one of our ALS samples carried a known
causal ALS mutation out of 471 mutations surveyed. We found inflammatory
processes and TNF signaling were significantly associated with sALS group-
specific gene expression changes (IPA) using independent exploratory DEG
tests (Cuffdiff2, DESeq2, and EdgeR) and an unsupervised gene network
analysis (WGCNA). Finally, we demonstrated overexpression of the hub gene
TNFAIP2 in motor neurons differentiated from human iPSCs in vitro led to
decreased cell viability and elevated levels of caspase 3/7, findings suggestive of

increased cell death. Taken together, these results corroborate previous reports
that most instances of sALS have polygenic contributions (1), and inflammatory
TNF signaling plays an important role in sALS pathology (19-33).
Modulating TNF signaling activity may be effective in slowing disease
progression. TNF is a potent inflammatory cytokine that plays an instrumental
role in cell fate decisions. TNF-mediated pro-survival processes are largely
effected via upregulation of the transcription factors NFKB1 and JUN (67-68),
whereas its cell death processes are ultimately carried out by initiator and
effector caspases. Bioactive forms of TNF commence these processes via two
cell surface receptors, TNFR1 and TNFR2. TNFR1 directs cell survival or death,
whereas TNFR2 is only known to promote pro-survival effects (34). The
extracellular domains of TNFR1 and TNFR2 are shed into general circulation
after interacting with bioactive forms of TNF, and function in a negative feedback
loop as they retain their ability to bind TNF (69). Intriguingly, elevated levels of
TNF-alpha and extracellular domains of TNFR1 and TNFR2 have been found in
the blood (28) and serum (29,30) of human ALS patients compared to controls.
We propose novel therapies to reduce TNF synthesis in human sALS
patients, monitoring blood levels of TNF and these extracellular TNFR domains
as biomarkers throughout treatment. Two potential therapeutic agents are
Bupropion and curcumin. Bupropion, a drug commonly used to treat clinical
depression, decreased TNF serum levels in mice likely via increasing intracellular
cAMP signaling after binding beta-adrenergic and/or D1 receptors (70).
Curcumin, an anti-inflammatory compound in turmeric, reduced TNF transcription

in human cancer cells (71,72) and lipopolysachharide (LPS)-stimulated murine
microglia (73). This likely occurs via inhibition of NFKB1, a transcription factor
that is upregulated by TNF signaling and known to induce TNF and other
inflammatory cytokines (74). Curcumin is also predicted to bind and inhibit
caspase-3 (75), an activator caspase with a known role in TNF-mediated
apoptosis. Curcumin oral bioavailability and brain penetration were substantially
increased by micellular formulation (76), setting the stage for clinical testing of it
and bupropion separately and together to reduce TNFα signaling.
Although we focused on TNFα signaling and modulated the hub gene
TNFAIP2 in an ALS-vulnerable cell type (human motor neurons) in our analyses,
we do not claim aberrant inflammatory TNFα signaling as the sole factor in ALS
pathogenesis. Downregulated DEGs in the ALS group and genes in the other
disease-associated module were associated with other cellular processes
(Supplementary Figures 3 and 6). We also identified 8 hub genes that were
upregulated DEGs within the “black” module. These genes are involved in
different gene families and could serve as foci for additional mechanistic studies
and therapeutic interventions.
Genetic variants in APOE (Apoliprotein E), a gene encoding a protein
important for transporting cholesterol and other lipids between cells, alter its
function and are associated with an accumulation of amyloid-Β peptides in the
brain and an increased Alzheimer’s risk. These variants modify ALS age of onset
and features of disease progression (77), warranting investigation into whether
aberrant expression of APOE could also influence ALS pathology.

BMF (Bcl2-modifying factor) binds to Bcl2 and related anti-apoptotic
proteins and promotes apoptosis. Its expression is increased in human motor
neurons exposed to TNFα protein (data not shown), and could play an important
role in motor neuron death.
CD37, a leukocyte-specific protein belonging to the tetraspanin
superfamily, is integral to T cell proliferation (78). Aberrant expression of this
gene may influence T cell activities during innate immune responses implicated
in ALS.
CXCL16 (Chemokine ligand 16), a transmembrane chemokine produced
by reactive astroglial cells, is increased by TNFα (79) and induced by
neurodegeneration. It promotes CXCR6-positive glial cell invasion that favors
astrogliosis (80), a feature seen in ALS CNS tissues.
GPNMB (Glycoprotein NMB) was previously identified as an upregulated
DEG in the spinal cords of fALS rodents. Interestingly, extracellular fragments of
GPNMB released by activated astrocytes lessened the neurotoxicity of mutant
SOD1, suggesting it may play protective role against neurodegeneration (81).
ITGAX (Integrin Alpha X), a leukocyte-specific integrin, was found as an
upregulated DEG in leukocytes that invaded the spinal cords of fALS rodents at
different stages of disease progression (82). ITGAX plays a known role in cell-
cell interactions during immune responses, warranting further research into its
therapeutic potential in halting such processes that precede neurodegeneration.
LILRB4 (Leukocyte Immunoglobulin-Like Receptor Subfamily B Member
4), a cell surface receptor in immune cells, binds MHC class 1 molecules to

inhibit immune responses. While not directly studied in ALS tissues, LILRB4
expression negatively correlates with pathologic inflammation in a mouse model
of allergic pulmonary inflammation (83).
To our knowledge, no study has investigated the function of WDR91 (WD
Repeat Domain 91), so it is impossible to speculate on its possible connection to
ALS pathology.
Our study has several important limitations:
First, we examined a small number of postmortem cervical spinal cord
sections for gene expression. There are ~35,000 persons with ALS in the US.
The cost of RNA-seq analysis limited the numbers of cases we could examine at
the sequencing depth employed. As a result, it is impossible to state to what
degree our findings can be generalized to thousands of patients.
Second, we used postmortem tissue. As a result, we are examining gene
expression of cells (mainly astrocytes) that are “survivors” of the
neurodegenerative process. To what extent ALS modifies cellular gene
expression over time is not known, and it is not possible presently to examine
human CNS tissues across disease progression. It is unclear whether the
“young” motor or other neurons produced by iPSC approaches will approximate
changes seen in spinal motorneurons present for many years as ALS
progresses.
Third, RNA-Seq aligners have built-in biases that influence results in
different ways, and our alignments are subject to those conferred by Tophat2 and
STAR (for the point mutation analyses). Engstrom et al (84) compared alignment

results from 26 mapping protocols on 4 common RNA-Seq datasets. Tophat2
reported a smaller number of alignments due to its low tolerance for mismatches,
but a higher number of splice sites when used with a guide annotation. STAR
reported a larger number of primary alignments as it retains portions of a read
when unable to align the entire sequence, but also a greater number of false
exon junctions. It remains unclear which tools are best suited for different
downstream analyses. As RNA-seq technology continues to mature, future
algorithms should improve in terms of these biases and it will become more clear
which tools are best to use for a given purpose.
Fourth, we did not yet explore novel transcripts, indels, or selective exon
usage specific to our sALS group in this dataset. We also wish to investigate
expression of smaller non-coding RNA’s, particularly microRNA’s, that regulate
mRNA stability in a future study. We did find substantial presence of mtDNA
gene deletions with variable deletion burdens across mtDNA-encoded respiratory
genes (data not shown) that we will present in a subsequent paper.
We anticipate future exploratory sALS studies will continue to uncover
polygenic contributions and identify potential therapeutic targets. Genome-wide
Association Studies (GWAS) comparing sALS cases vs. neurologically healthy
controls were instrumental in the discovery of excess pathogenic non-coding
repeats in C9orf72 found in 7% of Caucasian sALS patients (1). Chesi et al (5)
identified excess de novo mutations in chromatin regulator genes using exome
sequencing, comparing sALS offspring with their neurologically healthy parents.
This ALS gene expression study joins those preceding it in identifying perturbed

cellular processes and corroborating them using separate molecular biology
assays (1, 19-33). Recent findings suggest considerable clinical heterogeneity
between sALS patients (3, 85). As sequencing costs decrease, larger sample
sizes conferring greater statistical detection power will become feasible. These
data sets will likely enable stratification of sALS by its varied molecular
phenotypes as has been seen in other diseases like breast cancer (86). These
approaches may ultimately lead to therapies against pathways that are
universally beneficial to sALS patients, such as TNF signaling, as well as those
specifically tailored to an individual patient’s pathophysiology.
Author Contributions.
JPB and DGB designed experiments. DGB and LCO carried out experiments and
derived primary data. DGB analyzed RNA seq data. DGB, JPB and LCO wrote
the paper. All authors have read and agree with the final version.
Acknowledgements.
This research was supported by ALS Worldwide and the VCU Parkinson’s
Disease Research Center. We acknowledge the use of tissues procured by the
National Disease Research Interchange (NDRI) with support from NIH grant 2
U42 OD011158. The authors thank colleagues at CoFactor Genomics® for
carrying out the Illumina RNA sequencing. Each sample’s raw paired end
sequencing fastq files are deposited at NCBI’s Sequence Read Archive (SRA)
under the study accession number SRP064478. None of the authors have any

conflicts of interest. Sponsors had no role in experimental design, data analysis
or manuscript preparation.
METHODS
Sample Demographics
Each sample’s age, ethnicity, and gender information can be found in
Supplementary Figure 7. ALS Samples: 67.71 +/- 7.99 years of age, 7
Caucasian, 4 Male 3 Female. Control Samples: 69.75 +/- 11.29 years of age, 6
Caucasian 2 African American, 4 Male 4 Female.
Sample Preparation and Sequencing
Frozen cervical spinal cord specimens from all 15 samples were procured via the
National Disease Research Interchange, Philadelphia, PA (http://www.ndri-
resource.org). Total RNA was extracted from twenty 20-µm frozen cross sections
cut using a Cryostat. We used the miRNeasy Mini (Qiagen) RNA extraction kit,
including the optional on-column DNAse step to prevent reads derived from DNA
in downstream analysis. We further purified this RNA using the Qiagen RNeasy
Micro kit to remove organic contaminants.
RNA for all samples was quantified using a Nanodrop 2000c spectrophotometer
(Thermo Scientific) and quality was assessed using the Experion® automated
electrophoresis system (Bio-Rad). Bio-Rad’s Experion® calculated an RNA
Quality Index (RQI) score via comparing three portions of a sample’s
electrophoretic profile to a manufactured standard of degraded RNAs. RNA
Quality Index (RQI) values range between 1-10, with increasing values
representing higher quality RNA. 500 ng of RNA from each sample with an RQI
score ≥7 was used for library construction.
The Illumina Truseq Stranded Total RNA HT Sample Prep Kit ® instructions were
followed to generate barcoded RNA-Sequencing libraries for all eligible samples.
We confirmed libraries had the expected sized band (~260 bp) using the
Experion automated electrophoresis system (Bio-Rad). We then quantified
libraries using the KAPA library quantification kit (Kapa Biosystems, Wilmington,
MA). Barcoded RNA-Sequencing libraries were equimolar pooled and added to
the Illumina Nextseq 500 lane for multiplex sequencing at Cofactor Genomics
(Saint Louis, MO). Data was processed using the standard Illumina processing
pipeline to segregate each multiplexed sample’s reads, and raw fastq files for
each sample were sent to us for further processing.
Data Pre-Processing and Alignment with Tophat
FastQ files for each individual sample were input to FastQC
(http://www.bioinformatics.babraham.ac.uk/projects/fastqc/) for quality
assessments. This software identifies any data quality issues across metrics
including: base quality per position across reads, overall GC content, sequence
length distribution, and duplicate read frequency. All samples passed this QC
check (data not shown).
Samples were next processed using Trimmomatic (1). Trimmomatic removed all
Illumina adaptor sequences and bases with a Phred quality score less than 20

from the 3’ end of our reads. A Phred score of 20 indicates a 99% probability the
base is correctly identified. Fragments > or = to 50 bp were retained after that
step. We took these filtering steps to ensure high quality reads were used for
alignment, as the average PHRED score in bases towards the 3’ end of reads
across samples decreased (data not shown).
We next used the Burrows-Wheeler Aligner (BWA, 2) to calculate insert size
metrics for each sample (including average size and standard deviation) to
improve Tophat2 alignment. Once these metrics were obtained, we aligned each
sample’s reads to the hg19 human reference transcriptome then genome using
Tophat2 (3). The hg19 reference transcriptome and genome were derived from
Illumina iGenomes UCSC hg19 directory downloaded from the Tophat webpage
(https://ccb.jhu.edu/software/tophat/igenomes.shtml). Examples for these
commands can be found in Supplementary Note 1.
Calculation of Sequencing Alignment Metrics
We used Picard Tool’s (http://picard.sourceforge.net) CollectRNASeqMetrics
command to gather alignment data for each sample. We input each sample’s
Tophat2 aligned reads file and the “refFlat.txt.gz” file provided in the
aforementioned Illumina iGenomes directory into each command. We created a
“ribosomal intervals file” containing rRNA, tRNA, and mitochondrial RNA species
as we wished to know how many reads aligned to these regions collectively. An
example of this command can be found in Supplementary Note 1.
Identification of sequencing variants in each sample

We downloaded STAR (4) and used it along with other necessary
software (GATK, PicardTools) to complete the GATK pipeline
(https://www.broadinstitute.org/gatk/guide/article?id=3891) for identifying
sequencing variants using RNA-Sequencing reads. The genome.fa file from the
aforementioned Illumina iGenomes directory was used along with each sample’s
Trimmomatic-processed fastq files for STAR alignment. We bypassed the
optional indel realignment step, and used default settings for all steps. We
downloaded the dbsnp_138.hg19.vcf (variant call file) for use in several
commands from ftp://ftp.broadinstitute.org/bundle/2.8/hg19/, as detailed on this
GATK webpage (https://www.broadinstitute.org/gatk/guide/article?id=1215).
We created a file containing all 21 fALS genes’ exon boundaries from the
genes.gtf file in the aforementioned Illumina iGenomes directory. We then
excluded each sample’s variants discovered outside of these exon boundaries.
We next checked whether any of the remaining variants corresponded to one of
the “pathogenic” ALS mutations catalogued in at least one of three databases
queried (the databank http://alsod.iop.kcl.ac.uk/Statistics/pathogenicity.aspx
referenced in 5, 6-7).
An example of the GATK pipeline commands used for each sample can be found
in Supplementary Note 1.
HTSeq count to produce individual sample count matrices for DeSeq2 and
EdgeR
We next generated individual sample count matrices using HTSeq-Count

(8) that reported the number of aligned read pairs that uniquely map to known
genes in the hg19 genome. We used our Tophat2 mapped reads and the hg19
genes.gtf file provided in the aforementioned Illumina igenomes directory to
accomplish this. The counting procedure this software uses is described on their
website (http://www-huber.embl.de/users/anders/HTSeq/doc/count.html).
An example command for each sample can be found in Supplementary
Note 1.
Cufflinks/Cuffdiff DEG Analysis
Gene and transcript abundances for all samples were estimated using Cufflinks
v2.2.1 (http://cufflinks.cbcb.umd.edu/howitworks.html, 9). We opted to mask all
rRNA, tRNA, and mitochondrial RNA mapped reads from FPKM calculations, as
these RNA species accounted for different proportions of total mapped reads in
each sample (Supplementary Figure 1). We only considered reads aligning to
known genes (compatible hits norm flag) in our FPKM calculations, as we
suspected the number of novel transcripts varies across samples. We also used
the genome bias and multi-hits correction flags, as recommended by the Tuxedo
Suite developers.
We used Cuffmerge to merge all samples’ transcripts.gtf files prior to running
Cuffdiff2. We then ran Cuffdiff2 to test for differential expression of known genes
in the hg19 genome. Again, we opted to use the genome bias and multi hits
correction flags, and masked out all rRNA, tRNA, and mitochondrial RNA
mapped reads from for differential testing.

We calculated Benjamini-Hochberg corrected p-values using input Cuffdiff
reported p-values for each gene via the R function p.adjust. We considered
DEGs significant if their Benjamini-Hochberg corrected p-value was < 0.10.
Examples of these commands are in Supplementary Note 1.
DESeq2 DEG Analysis
HTSeq count files for each sample were placed into a created DESeq2 directory
prior to DESeq2 (10) analysis in R.
We performed the DEG analysis using input HTSeq count matrices as prescribed
in the DESeq2 vignette. We considered DEG’s significant if their adjusted p
values were <.10. These commands are included in Supplementary Note 1.
EdgeR DEG Analysis
HTSeq count files for each sample were placed into a created EdgeR directory
prior to EdgeR (11) analysis in R. We then created a file containing all samples’
count information for all genes prior to following the prescribed EdgeR analysis.
We decided to filter out genes with a cpm (counts per million) value <1 in 7
samples. We chose a cpm value of 1 as smaller values more likely reflect noise.
We chose 7 for our sample threshold as genes that were only expressed in the
disease or control group could play an important role in disease pathology.
We calculated Benjamini-Hochberg corrected p-values using EdgeR
reported p-values for each gene via the R function p.adjust. We considered
DEG’s significant if their Benjamini-Hochberg corrected p-value was < 0.10.

Examples of these commands are in Supplementary Note 1.
Weighted Gene Co-Expression Network Identification and Association
Testing
WGCNA (12) follows a 6-step process to predict which genes are
connected to each other, cluster them into gene networks, test which gene
networks are associated with disease status, and aid user selection of hub
genes. The mathematical formulas used in each step are not included in this
description, but can be found in an earlier publication (13).
First, WGCNA calculates an “adjacency matrix” (a gene network) that
reports a correlation value between every pair of genes’ expression
measurements across all 15 samples. An underlying assumption is the higher the
correlation value between a pair of genes, the more likely it is they are
functionally connected. Once the adjacency matrix is constructed, summation of
any individual gene’s correlation values to all other genes reflects its level of
overall connectedness.
Second, the adjacency matrix is raised to a software-determined
exponential power, thereby reducing noise by pushing weaker pairwise
connection values closer to zero relative to stronger values. The exponential
power used is the lowest value needed to ensure the network approximates
scale-free topology. In this context, scale-free topology is satisfied when a small
number of genes (hub genes) are highly connected to other genes, whereas the
majority of genes are weakly connected to other genes. Many biological

(including gene co-expression) networks demonstrate scale-free topology (13),
and their network functions are more likely disrupted by specifically targeting
highly connected members (14-15). This step lays the foundation for
identification of hub genes within smaller modules (networks) of interest later in
this analysis.
Third, the adjacency matrix is transformed into a “topological overlap”
matrix by calculating topological overlap (TOM) scores for each gene. This score
accounts for each pair of genes’ connection strength (adjacency value) to each
other as well as their connection strengths (adjacency values) to every other
gene in the adjacency matrix. Higher TOM scores indicate a pair of genes is
more likely connected to each other and a shared set of other genes.
Fourth, WGCNA identifies gene co-expression networks via average
linkage hierarchical clustering using a TOM-based dissimilarity measure (1-TOM
score for every gene) as a measure of distance. The resultant dendrogram of
clustered genes is segregated into individual modules with at least 30 genes
using WGCNA’s dynamic tree-cutting algorithm (12).
Fifth, WGCNA calculates each module’s “eigengene”, or first principle
component, using all samples’ gene expression values for all genes in that
module. A module eigengene is considered a summarized expression profile
representative of that module for all samples. Each module eigengene is then
correlated against every other module eigengene. If two or more modules’
eigengenes have a correlation value >.75, those modules are merged together

generating a larger module. Module eigengenes are re-calculated at this stage
and the process is repeated until there are no module eigengenes that correlate
to each other with a value >.75.
Finally, each module eigengene is tested for statistical association to user-
provided continuous or binary phenotypic traits, including disease status.
Correlation test p-values based on the student test are reported, and are
equivalent to a Wald test in a linear regression.
Weighted Gene Co-Expression Network Analysis
We first generated a filtered list of 13,301 genes and their Cufflinks FPKM
values for all samples to analyze in WGCNA. All of these genes had an FPKM
value >2 in at least 7 samples. We chose an FPKM of 2 as smaller values more
likely reflect noise. We chose 7 for our sample threshold as genes that are only
expressed in the disease or control group could play an important role in disease
pathology. We log-transformed these FPKM values using log2 (FPKM value +1)
as recommended on the WGCNA FAQ’s page
(http://labs.genetics.ucla.edu/horvath/CoexpressionNetwork/Rpackages/WGCNA
/faq.html) prior to analysis.
Our analysis was guided by steps 1, 2b, and 3 in the R Tutorial listed
under “I. Network analysis of liver expression data from female mice: finding
modules related to body weight” from their website
(http://labs.genetics.ucla.edu/horvath/CoexpressionNetwork/Rpackages/WGCNA
/Tutorials/).

We deviated from the tutorial several times. We generated a “signed
weighted” adjacency matrix for downstream analyses as opposed to the default
“unsigned weighted” network. We chose this option to preserve the direction of a
pair of genes’ correlation, as a positive correlation may indicate “activation”
whereas a negative correlation may indicate “repression”. The unsigned
networks do not preserve the direction of correlation. We used the “bicor”
(biweight midcorrelation) correlation in place of the pearson correlation to
construct our adjacency matrix and determine the exponential value necessary to
approximate scale-free topology (Supplementary Figure 8). We chose this option
as we had a small sample size, and biweight midcorrelations are more robust to
outliers compared to pearson correlations (16). We added the flag
“corOptions=list(maxPOutliers=0.1))” to further reduce outlier effects.
Commands used after loading the sample data expression matrix
(Supplementary Table 14) and phenotypic data (Supplementary Table 15) as
instructed in part 1 of the tutorial are detailed in Supplementary Note 1.
iPSC generation and Neural Induction
Integration-free iPSCs were generated from peripheral blood mononuclear cells
(MNC) from a healthy male donor, aged 62, using a previously described
protocol (17), with modifications (19). Briefly, the pEB-C5 and pEB-Tg plasmids
(Addgene) were electroporated into cells using an Amaxa Nucleofector 4D
system (Lonza, Allendale, NJ). After three weeks, viable colonies were

expanded in mTeSR medium on Geltrex (Life Technologies) coated plates.
Neuralization of iPSCs was accomplished using PSC Neural Induction Medium
(Life Technologies) according to the protocol with modifications (18). All cultures
were maintained at 37°C in a humidified CO2 incubator with the oxygen level
held at 5%.
Motor Neuron Differentiation
After neural induction, iPSCs were differentiated as described previously (18),
with some modifications (19). Briefly, adherent cells were grown in neural
induction media containing DMEM/F12 with 0.2 µM LDN-193189 (LDN;
Stemgent), 10 µM SB431542 (SB; Stemgent), 10 ng/ml BDNF (R&D systems),
0.4 ug/ml L-ascorbic acid (Sigma), 2 mM GlutaMAX-I supplement, 1% N-2
supplement, and 1% nonessential amino acids (NEAA). Two days later 1 µM RA
was added. On day four LDN/SB was stopped and 1 µM smoothened agonist
(SAG; Calbiochem or Santa Cruz) and 0.5 µM PM were added. On day 14 cells
were switched to neurobasal media containing 2 mM GlutaMAX-I, 2% B-27, 1%
NEAA, 0.4 ug/ml AA, 10 ng/ml GDNF (R&D), 10 ng/ml CNTF (R&D). Media was
replaced every 2-3 days. Unless otherwise specified, all cell culture materials
were purchased from Life Technologies. All cultures were grown at 37°C in 5%
oxygen and 5% CO2 conditions.

MTT/Caspase 3/7 Assays
On day 21 of differentiation cells were treated with 10 ng/ml TNFα (Sigma) or
transfected with TNFAIP2 plasmid or empty vector control (Origene) using
FuGENE HD Transfection Reagent (Promega). For transfection, 100 ng plasmid
DNA was added per well of a 96-well plate and the Fugene:DNA ratio was 4:1.
After 24 hours of treatment, cell viability was measured using the In Vitro
Toxicology Assay Kit, MTT based (Sigma, TOX1) according to manufacturer
instructions. For detection of activated caspase 3/7, the FLICA® 660 Caspase
3/7 Assay Kit (ImmunoChemistry Technologies) was used according to
manufacturer instructions. For quantification, cells were fixed and 5-10
representative fields were taken with an Olympus FV1000 confocal microscope.
Images were analyzed using MetaMorph image analysis software (Molecular
Devices) and pixel intensity was normalized to the number of cells per image,
identified by DAPI nuclear staining.
Real-time quantitative PCR (qPCR)
For qPCR analysis, RNA was extracted with the RNeasy Plus Micro Kit (Qiagen)
according to manufacturer instructions. Quantification of isolated RNA was
performed using a Nanodrop 2000c spectrophotometer (Thermo Scientific). RNA
was reverse transcribed into cDNA using the iScript cDNA synthesis kit (BioRad).
For qPCR, 50 ng cDNA per well was loaded into a 96-well plate and analyzed
with the CFX96 Real Time PCR Detection System (BioRad). All samples were
analyzed in triplicate. Data was normalized to the geometric mean of two
reference genes determined to have the greatest stability using the software

qbasePLUS-GeNorm (BioGazelle; 14.3.3.Z and CYC1). Primer sets are available
upon request. Statistics were calculated using unpaired t-test in Prism software
(GraphPad, Prism). Error bars represent standard error of the mean.

References
1. Bolger, AM., Lohse, M., Usadel, B. Trimmomatic: a flexible trimmer for Illumina sequence data. Bioinformatics 30(15), 2114-20 (2014).
2. Li, H., Durbin, R. Fast and accurate long-read alignment with Burrows-Wheeler transform. Bioinformatics 26(5), 589-95 (2010).
3. Kim, D. et al. TopHat2: accurate alignment of transcriptomes in the presence of insertions, deletions and gene fusions. Genome Biol. 14, R36 (2013).
4. Dobin, A. et al. STAR: ultrafast universal RNA-seq aligner. Bioinformatics 29(1), 15-21 (2013).
5. Abel, O., Powell, JF. Andersen, PM., Al-Chalabi, A. Credibility analysis of putative disease-causing genes using bioinformatics. PLoS One 8(6), e64899 (2013).
6. Landrum, MJ. et al. ClinVar: public archive of relationships among sequence variation and human phenotype. Nucleic Acids Res. 42(Database issue), D980-5 (2014).
7. Stenson, PD. et al. The Human Gene Mutation Database: building a comprehensive mutation repository for clinical and molecular genetics, diagnostic testing and personalized genomic medicine. Hum Genet. 133(1), 1-9 (2014).
8. Anders, S., Pyl, PT., Huber, W. HTSeq--a Python framework to work with high-throughput sequencing data. Bioinformatics 31(2), 166-9 (2015).
9. Trapnell, C. et al. Differential analysis of gene regulation at transcript resolution with RNA-seq. Nat Biotechnol. 1, 46-53 (2013).
10. Love, MI., Huber, W., Anders, S. Moderated estimation of fold change and dispersion for RNA-seq data with DESeq2. Genome Biol. 15(12), 550 (2014).
11. Robinson, MD., McCarthy, DJ., Smyth, GK. edgeR: a Bioconductor package for differential expression analysis of digital gene expression data. Bioinformatics 26(1), 139-40 (2010).
12. Langfelder, P., Horvath, S. WGCNA: an R package for weighted correlation network analysis. BMC Bioinformatics 9, 559 (2008).
13. Zhang, B., Horvath, S. A general framework for weighted gene co-expression network analysis. Stat Appl Genet Mol Biol. 4, Article17 (2005).
14. Jeong, H., Mason, SP., Barabasi, AL., Oltvai, ZN. Lethality and centrality in protein networks. Nature 411(6833), 41-2 (2001).
15. Carter, SL., Brechbuhler, CM., Griffin, M., Bond, AT. Gene co-expression network topology provides a framework for molecular characterization of cellular state. Bioinformatics 20(14), 2242-50 (2004).
16. Langfelder, P., Horvath, S. Fast R Functions for Robust Correlations and Heirarchical Clustering. Journal of Statistical Software 46, 1-17 (2012).

17. Dowey, SN., X, Huang., BK, Chou., Z, Ye., L, Cheng. Generation of integration-free human induced pluripotent stem cells from postnatal blood mononuclear cells by plasmid vector expression. Nature Protocol 7, 2013-21 (2012).
18. Amoroso, MW. et al. Accelerated high-yield generation of limb-innervating motor neurons from human stem cells. The Journal of neuroscience: the official journal of the society for neuroscience 33, 574-86 (2013).
19. O'Brien, LC., Keeney, PM., Bennett, JP,Jr. Differentiation of Human Neural Stem Cells into Motor Neurons Stimulates Mitochondrial Biogenesis and Decreases Glycolytic Flux. Stem Cells Dev. 24(17), 1984-94 (2015).

References
1. Renton, AE., Chio, A., Traynor, BJ. State of play in amyotrophic lateral sclerosis genetics. Nat Neurosci. 1, 17-23 (2014).
2. Byrne, S. et al. Rate of familial amyotrophic lateral sclerosis: a systematic review and meta-analysis. J Neurol Neurosurg Psychiatry 82(6), 623-7 (2011).
3. Al-Chalabi, A., Hardiman, O. The epidemiology of ALS: a conspiracy of genes, environment and time. Nat Rev Neurol. 11, 617-28 (2013).
4. Hardiman, O., Greenway, M. The complex genetics of amyotrophic lateral sclerosis. Lancet Neurol. 4, 291-2 (2007).
5. Chesi, A. et al. Exome sequencing to identify de novo mutations in sporadic ALS trios. Nat Neurosci. 7, 851-5 (2013).
6. Heath, PR., Kirby, J., Shaw, PJ. Investigating cell death mechanisms in amyotrophic lateral sclerosis using transcriptomics. Front Cell Neurosci. 7, 259 (2013).
7. Ferrante, RJ. et al. Evidence of increased oxidative damage in both sporadic and familial amyotrophic lateral sclerosis. J Neurochem. 69(5), 2064-74 (1997).
8. Andrus, PK., Fleck, TJ., Gurney, ME., Hall, ED. Protein oxidative damage in a transgenic mouse model of familial amyotrophic lateral sclerosis. J Neurochem. 71(5), 2041-8 (1998).
9. Hall, ED., Andrus, PK., Oostveen, JA., Fleck, TJ., Gurney, ME. Relationship of oxygen radical-induced lipid peroxidative damage to disease onset and progression in a transgenic model of familial ALS. J Neurosci Res. 53(1), 66-77 (1998).
10. Liu, D., Wen, J., Liu, J., Li, L. The roles of free radicals in amyotrophic lateral sclerosis: reactive oxygen species and elevated oxidation of protein, DNA, and membrane phospholipids. FASEB J. 15, 2318-28 (1999).
11. Chang, Y. et al. Messenger RNA oxidation occurs early in disease pathogenesis and promotes motor neuron degeneration in ALS. PLoS One. 3(8), e2849 (2008).
12. Sasaki, S., Iwata, M. Mitochondrial alterations in the spinal cord of patients with sporadic amyotrophic lateral sclerosis. J Neuropathol Exp Neurol. 66(1), 10-6 (2007).
13. Sasaki, S., Iwata, M. Dendritic synapses of anterior horn neurons in amyotrophic lateral sclerosis: an ultrastructural study. Acta Neuropathol. 91(3), 278-83 (1996).
14. Hirano, A., Donnenfeld, H., Sasaki, S., Nakano, I. Fine structural observations of neurofilamentous changes in amyotrophic lateral sclerosis. J Neuropathol Exp Neurol. 43(5), 461-70 (1984).
15. Higgins, CM., Jung, C., Xu, Z. ALS-associated mutant SOD1G93A causes mitochondrial vacuolation by expansion of the intermembrane space and by involvement of SOD1 aggregation and peroxisomes. BMC Neurosci. 4, 16 (2003).
16. Kong, J., Xu, Z. Massive mitochondrial degeneration in motor neurons triggers the onset of amyotrophic lateral sclerosis in mice expressing a mutant SOD1. J Neurosci. 18(9), 3241-50 (1998).

17. Damiano, M. et al. Neural mitochondrial Ca2+ capacity impairment precedes the onset of motor symptoms in G93A Cu/Zn-superoxide dismutase mutant mice. J Neurochem. 96(5), 1349-61 (2006).
18. Mattiazzi, M. et al. Mutated human SOD1 causes dysfunction of oxidative phosphorylation in mitochondria of transgenic mice. J Biol Chem. 277(33), 29626-33 (2002).
19. Schiffer, D., Cordera, S., Cavalla, P., Migheli, A. Reactive astrogliosis of the spinal cord in amyotrophic lateral sclerosis. J Neurol Sci. 139, 27-33 (1996).
20. Nagy, D., Kato, T., Kushner, PD. Reactive astrocytes are widespread in the cortical gray matter of amyotrophic lateral sclerosis. J Neurosci Res. 38(3), 336-47 (1994).
21. Zhao, W., Beers, DR., Appel, SH. Immune-mediated mechanisms in the pathoprogression of amyotrophic lateral sclerosis. J Neuroimmune Pharmacol. 4, 888-99 (2013).
22. Turner, MR. et al. Evidence of widespread cerebral microglial activation in amyotrophic lateral sclerosis: an [11C](R)-PK11195 positron emission tomography study. Neurobiol Dis. 3, 601-9 (2004).
23. Corcia, P. et al. Molecular imaging of microglial activation in amyotrophic lateral sclerosis. PLoS One. 7(12), e52941 (2012).
24. Henkel, JS. et al. Presence of dendritic cells, MCP-1, and activated microglia/macrophages in amyotrophic lateral sclerosis spinal cord tissue. Ann Neurol. 55(2), 221-35 (2004).
25. Lewis, KE. et al. Microglia and motor neurons during disease progression in the SOD1G93A mouse model of amyotrophic lateral sclerosis: changes in arginase1 and inducible nitric oxide synthase. J Neuroinflammation 11, 55 (2014).
26. Alexianu, ME., Kozovska, M., Appel, SH. Immune reactivity in a mouse model of familial ALS correlates with disease progression. Neurology. 57(7), 1282-9 (2001).
27. Henkel, JS., Beers, DR., Siklos, L., Appel, SH. The chemokine MCP-1 and the dendritic and myeloid cells it attracts are increased in the mSOD1 mouse model of ALS. Mol Cell Neurosci. 3, 427-37 (2006).
28. Poloni, M. et al. Circulating levels of tumour necrosis factor-alpha and its soluble receptors are increased in the blood of patients with amyotrophic lateral sclerosis. Neurosci Lett. 287(3), 211-4 (2000).
29. Babu, GN. et al. Elevated inflammatory markers in a group of amyotrophic lateral sclerosis patients from northern India. Neurochem Res. 6, 1145-9 (2008).
30. Cereda, C. et al. TNF and sTNFR1/2 plasma levels in ALS patients. J Neuroimmunol. 194(1-2), 123-31 (2008).
31. Elliott, JL. Cytokine upregulation in a murine model of familial amyotrophic lateral sclerosis. Brain Res Mol Brain Res. 95(1-2), 172-8 (2001).
32. Hensley, K. et al. Temporal patterns of cytokine and apoptosis-related gene expression in spinal cords of the G93A-SOD1 mouse model of amyotrophic lateral sclerosis. J Neurochem. 82(2), 365-74 (2002).

33. Yoshihara, T. et al. Differential expression of inflammation- and apoptosis-related genes in spinal cords of a mutant SOD1 transgenic mouse model of familial amyotrophic lateral sclerosis. J Neurochem. 80(1), 158-67 (2002).
34. Probert, L. TNF and its receptors in the CNS: The essential, the desirable and the deleterious effects. Neuroscience 302, 2-22 (2015).
35. Maschietto, M. et al. Co-expression network of neural-differentiation genes shows specific pattern in schizophrenia. BMC Med Genomics 8, 23 (2015).
36. Kogelman, LJ. et al. Identification of co-expression gene networks, regulatory genes and pathways for obesity based on adipose tissue RNA Sequencing in a porcine model. BMC Med Genomics 7, 57 (2014).
37. Horvath, S. et al. Analysis of oncogenic signaling networks in glioblastoma identifies ASPM as a molecular target. Proc Natl Acad Sci U S A 103(46), 17402-7 (2006).
38. Kim, D. et al. TopHat2: accurate alignment of transcriptomes in the presence of insertions, deletions and gene fusions. Genome Biol. 14, R36 (2013).
39. Trapnell, C. et al. Differential analysis of gene regulation at transcript resolution with RNA-seq. Nat Biotechnol. 1, 46-53 (2013).
40. Love, MI., Huber, W., Anders, S. Moderated estimation of fold change and dispersion for RNA-seq data with DESeq2. Genome Biol. 15(12), 550 (2014).
41. Robinson, MD., McCarthy, DJ., Smyth, GK. edgeR: a Bioconductor package for differential expression analysis of digital gene expression data. Bioinformatics. 26(1), 139-40 (2010).
42. Langfelder, P., Horvath, S. WGCNA: an R package for weighted correlation network analysis. BMC Bioinformatics. 9, 559 (2008).
43. Abel, O., Powell, JF., Andersen, PM., Al-Chalabi, A. Credibility analysis of putative disease-causing genes using bioinformatics. PLoS One 8(6), e64899 (2013).
44. McKenna, A. et al. The Genome Analysis Toolkit: a MapReduce framework for analyzing next-generation DNA sequencing data. Genome Res. 20(9), 1297-303 (2010).
45. DePristo, MA. et al. A framework for variation discovery and genotyping using next-generation DNA sequencing data. Nat Genet. 43(5), 491-8 (2011).
46. Van der Auwera, GA. et al. From FastQ data to high confidence variant calls: the Genome Analysis Toolkit best practices pipeline. Curr Protoc Bioinformatics. 11(1110), 11.10.1,11.10.33 (2013).
47. Landrum, MJ. et al. ClinVar: public archive of relationships among sequence variation and human phenotype. Nucleic Acids Res. 42(Database issue), D980-5 (2014).
48. Stenson, PD. et al. The Human Gene Mutation Database: building a comprehensive mutation repository for clinical and molecular genetics, diagnostic testing and personalized genomic medicine. Hum Genet. 133(1), 1-9 (2014).
49. Zhang, ZH. et al. A comparative study of techniques for differential expression analysis on RNA-Seq data. PLoS One 9(8), e103207 (2014).

50. Saito, A. et al. An integrated expression profiling reveals target genes of TGF-beta and TNF-alpha possibly mediated by microRNAs in lung cancer cells. PLoS One 8(2), e56587 (2013).
51. Zhou, A., Scoggin, S., Gaynor, RB., Williams, NS. Identification of NF-kappa B-regulated genes induced by TNFalpha utilizing expression profiling and RNA interference. Oncogene 22(13), 2054-64 (2003).
52. Tian, B., Nowak, DE., Jamaluddin, M., Wang, S., Brasier, AR. Identification of direct genomic targets downstream of the nuclear factor-kappaB transcription factor mediating tumor necrosis factor signaling. J Biol Chem. 280(17), 17435-48 (2005).
53. Park, DJ., Vuong, PT., de Vos, S., Douer, D., Koeffler, HP. Comparative analysis of genes regulated by PML/RAR alpha and PLZF/RAR alpha in response to retinoic acid using oligonucleotide arrays. Blood 102(10), 3727-36 (2003).
54. Rusiniak, ME., Yu, M., Ross, DT., Tolhurst, EC., Slack, JL. Identification of B94 (TNFAIP2) as a potential retinoic acid target gene in acute promyelocytic leukemia. Cancer Res. 60(7), 1824-9 (2000).
55. Ma, Y. et al. Microarray analysis uncovers retinoid targets in human bronchial epithelial cells. Oncogene 22(31), 4924-32 (2003).
56. Dowey, SN., X, Huang., BK, Chou., Z, Ye., L, Cheng. Generation of integration-free human induced pluripotent stem cells from postnatal blood mononuclear cells by plasmid vector expression. Nature Protocol 7, 2013-21 (2012).
57. Amoroso, MW. et al. Accelerated high-yield generation of limb-innervating motor neurons from human stem cells. The Journal of neuroscience: the official journal of the society for neuroscience 33, 574-86 (2013).
58. O'Brien, LC., Keeney, PM., Bennett, JP,Jr. Differentiation of Human Neural Stem Cells into Motor Neurons Stimulates Mitochondrial Biogenesis and Decreases Glycolytic Flux. Stem Cells Dev. 24(17), 1984-94 (2015).
59. Kratz, A., Carninci, P. The devil in the details of RNA-seq. Nature biotechnology 32(9), 882-4 (2014).
60. Wang, Z., Gerstein, M., Snyder, M. RNA-Seq: a revolutionary tool for transcriptomics. Nature reviews Genetics 10(1), 57-63 (2009).
61. Pavlou, MP., Dimitromanolakis, A., Diamandis, EP. Coupling proteomics and transcriptomics in the quest of subtype-specific proteins in breast cancer. Proteomics 7, 1083-95 (2013).
62. Holtman, IR. et al. Induction of a common microglia gene expression signature by aging and neurodegenerative conditions: a co-expression meta-analysis. Acta Neuropathol Commun. 3, 31 (2015).
63. Saris, CG. et al. Weighted gene co-expression network analysis of the peripheral blood from Amyotrophic Lateral Sclerosis patients. BMC Genomics. 10, 405 (2009).
64. Satoh, J. et al. Molecular network analysis suggests a logical hypothesis for the pathological role of c9orf72 in amyotrophic lateral sclerosis/frontotemporal dementia. J Cent Nerv Syst Dis. 6, 69-78 (2014).
65. Figueroa-Romero, C. et al. Identification of epigenetically altered genes in sporadic amyotrophic lateral sclerosis. PLoS One 7(12), e52672 (2012).

66. Ikiz, B. et al. The Regulatory Machinery of Neurodegeneration in In Vitro Models of Amyotrophic Lateral Sclerosis. Cell Rep. 12(2), 335-45 (2015).
67. Micheau, O., Tschopp, J. Induction of TNF receptor I-mediated apoptosis via two sequential signaling complexes. Cell 114(2), 181-90 (2003). 68. Walczak, H. TNF and ubiquitin at the crossroads of gene activation, cell death, inflammation, and cancer. Immunol Rev. 244(1), 9-28 (2011). 69. Mohler, KM. et al. Soluble tumor necrosis factor (TNF) receptors are effective therapeutic agents in lethal endotoxemia and function simultaneously as both TNF carriers and TNF antagonists. J Immunol. 151(3), 1548-61 (1993). 70. Brustolim, D., Ribeiro-dos-Santos, R., Kast, RE., Altschuler, EL., Soares, MB. A new chapter opens in anti-inflammatory treatments: the antidepressant bupropion lowers production of tumor necrosis factor-alpha and interferon-gamma in mice. Int Immunopharmacol. 6(6), 903-7 (2006). 71. Han, SS., Keum, YS., Seo, HJ., Surh, YJ. Curcumin suppresses activation of NF-kappaB and AP-1 induced by phorbol ester in cultured human promyelocytic leukemia cells. J Biochem Mol Biol. 35(3), 337-42 (2002). 72. Surh, YJ. et al. Molecular mechanisms underlying chemopreventive activities of anti-inflammatory phytochemicals: down-regulation of COX-2 and iNOS through suppression of NF-kappa B activation. Mutat Res. 480, 243-68 (2001). 73. Jin, CY., Lee, JD., Park, C., Choi, YH., Kim, GY. Curcumin attenuates the release of pro-inflammatory cytokines in lipopolysaccharide-stimulated BV2 microglia. Acta Pharmacol Sin. 10, 1645-51 (2007). 74. Hoesel, B., Schmid, JA. The complexity of NF-kappaB signaling in inflammation and cancer. Mol Cancer 12, 86 (2013). 75. Khan, S. et al. Implication of Caspase-3 as a Common Therapeutic Target for Multineurodegenerative Disorders and Its Inhibition Using Nonpeptidyl Natural Compounds. Biomed Res Int. 2015, 379817 (2015). 76. Hagl, S et al. Curcumin micelles improve mitochondrial function in neuronal PC12 cells and brains of NMRI mice - Impact on bioavailability. Neurochem Int. doi: 10.1016/j.neuint.2015.07.026 (2015). 77. Verghese, PB., Castellano, JM., Holtzman, DM. Apolipoprotein E in Alzheimer's disease and other neurological disorders. Lancet Neurol. 10(3), 241-52 (2011). 78. van Spriel, AB. et al. A regulatory role for CD37 in T cell proliferation. J Immunol. 172(5), 2953-61 (2004). 79. Abel, S. et al. The transmembrane CXC-chemokine ligand 16 is induced by IFN-gamma and TNF-alpha and shed by the activity of the disintegrin-like metalloproteinase ADAM10. J Immunol. 172(10), 6362-72 (2004).
80. Hattermann, K., Ludwig, A., Gieselmann, V., Held-Feindt, J., Mentlein, R. The chemokine CXCL16 induces migration and invasion of glial precursor cells via its receptor CXCR6. Mol Cell Neurosci. 39(1), 133-41 (2008).
81. Tanaka, H. et al. The potential of GPNMB as novel neuroprotective factor in amyotrophic lateral sclerosis. Sci Rep. 2, 573 (2012).

82. Chiu, IM. et al. T lymphocytes potentiate endogenous neuroprotective inflammation in a mouse model of ALS. Proc Natl Acad Sci U S A. 105(46), 17913-8 (2008).
83. Fanning, LB., Buckley, CC., Xing, W., Breslow, RG., Katz, HR. Downregulation of key early events in the mobilization of antigen-bearing dendritic cells by leukocyte immunoglobulin-like Receptor B4 in a mouse model of allergic pulmonary inflammation. PLoS One 8(2), e57007 (2013).
84. Engstrom, PG. et al. Systematic evaluation of spliced alignment programs for RNA-seq data. Nat Methods 12, 1185-91 (2013).
85. Ganesalingam, J. et al. Latent cluster analysis of ALS phenotypes identifies prognostically differing groups. PLoS One 4(9), e7107 (2009).
86. Cancer Genome Atlas Network. Comprehensive molecular portraits of human breast tumours. Nature 490(7418), 61-70 (2012).

Figure 1
Gene Chromosomal Position # of Known Pathogenic Coding Mutations
ALS2 2q33 15 ANG 14q11 36
ATXN2 12q24 3 C9orf72 9p21 1*
CHMP2B 3p11 5 DCTN1 2p13 6
FIG4 6q21 5 FUS 16p11 66
HNRNPA1 12q13 2 HNRNPA2B1 7p15 1*
NEFH 22q12 9 OPTN 10p13 19 PFN1 17p13 8 SETX 9q34 10 SOD1 21q22 199 SPG11 15q14 1
SQSTM1 5q35 16 TARDBP 1p36 44 UBQLN2 Xp11 12
VAPB 20q13 3 VCP 9p13 10
Figure 1 lists genes with known causal ALS mutations, along with their chromosomal position and number of "pathogenic" ALS variants reported in at least one of three databanks queried. C9orf72 and HNRNPA2B1 only had "potentially" pathogenic variants listed, and ELP3 was excluded, as it did not have any reported mutations in these databanks.

Figure 2
Upregulated Genes Fold Change
Downregulated Genes
Fold Change
HTRA4 5.63 CXCL8 -5.90 PLA2G7 5.59 WNT16 -4.83 GPNMB 5.39 FGF10 -3.40 OTOA 4.78 DCN -3.17
APOC1 4.61 PTGS2 -3.05 LILRA4 4.61 LIPG -2.72
SIGLEC8 4.40 CFH -2.58 CHAC1 4.30 FHL2 -2.44
HLA-DRB1 4.10 COL12A1 -2.42 KLHL6 3.99 KDR -2.26 DPEP2 3.96 MSMO1 -2.23 LILRA2 3.59 EPHA3 -2.05 CPVL 3.40 NRP1 -2.04
CEBPA 3.29 HMGCS1 -2.02 SLC37A2 3.28 PPP1R3C -1.99
APOE 3.25 SQLE -1.92 SLC7A7 3.01 ITGA8 -1.90 CAPG 2.99 ABCA8 -1.74 LILRB4 2.97
FCGR2B 2.97 HPSE 2.96
SELPLG 2.81 HLA-DMB 2.76
BMF 2.73 KCNA5 2.71
THEMIS2 2.71 ITGAX 2.68 CD37 2.66
GK 2.64 FPR3 2.59
ZMYND15 2.56 CD226 2.51
ADAMTS14 2.49 KCNJ5 2.42
CXCL16 2.39 CTSS 2.36 CTSD 2.35 CPM 2.32
HLA-DOA 2.32 TNFAIP2 2.29 ABCG1 2.18 TBXAS1 2.12 HAVCR2 2.07
CD86 2.01 OSBPL11 1.98
CD84 1.98 IL18 1.97
PIK3IP1 1.94

DNASE2 1.89 ASAH1 1.85 GPRIN3 1.84 OTUD1 1.79 CECR1 1.72 WDR91 1.72 LTA4H 1.65 GNB4 1.61
Figure 2 lists common DEGs identified as “upregulated” (left) and “downregulated” (right) in the ALS group relative to controls across all three DEG analyses. Fold change values from Cuffdiff2 are listed.

Figure 3
Figure 3 shows all 13,301 genes (individual black lines at top) clustered by their topological overlap dissimilarity scores. The multi-colored panel next to “Dynamic Tree Cut” shows 122 identified modules using the Dynamic Tree Cut algorithm. The second multi-colored panel shows 37 larger modules identified after highly correlated smaller modules were merged together.

Figure 4
Figure 4 shows each module eigengene’s correlation values with disease status, gender, and age. The correlation score is listed above an associated p-value.

Figure 5
Upregulated DEGs Black Module Genes
Top Canonical Pathways p-Value Top Canonical Pathways p-Value
Graft-versus-Host Disease
Signaling 1.98E-07 Antigen Presentation Pathway 3.31E-10
T Helper Cell Differentiation 1.43E-06 TREM1 Signaling 1.11E-09
B Cell Development 2.17E-06 Altered T and B Cell
Signaling in Rheumatoid Arthritis
9.72E-09
Altered T and B Cell Signaling in Rheumatoid Arthritis 4.16E-06 Role of NFAT in Regulation
of the Immune Response 6.30E-08
Role of NFAT in Regulation of the Immune Response 7.07E-06 CD28 Signaling in T Helper
Cells 6.54E-08
Top Diseases and Disorders p-Value Top Diseases and Disorders p-Value
Endocrine System Disorders 5.45E-03-1.81E-11 Inflammatory Response 1.13E-04-
9.32E-25
Gastrointestinal Disease 5.45E-03-1.81E-11 Immunological Disease 1.35E-04-
2.33E-19
Immunological Disease 5.45E-03-1.81E-11 Connective Tissue Disorders 7.33E-05-
2.79E-19
Metabolic Disease 5.45E-03-1.81E-11 Inflammatory Disease 7.80E-05-
2.79E-19
Inflammatory Response 5.45E-03-5.61E-09 Skeletal and Muscular
Disorders 7.33E-05-2.79E-19
“Activated” Upstream Regulators p-Value “Activated” Upstream
Regulators p-Value
IFNG 4.45E-10 lipopolysaccharide 1.98E-20
Rosiglitazone 6.61E-06 IFNG 2.98E-19 IL2 7.04E-03 Genistein 2.82E-18
TNF 1.12E-03 TNF 4.85E-12
Figure 5 Select IPA Core Analysis Results are displayed for DEGs (56) identified as upregulated in the ALS group by all three analyses (left) and genes (495) comprising the black module (right).

Figure 6 Figure 7
Figure 6 shows all black module hub genes and which was an upregulated DEG in the ALS
group. Figure 7 shows each black module gene’s module membership vs. gene significance
scores.

Figure 8
Figure 8 shows absorbance readings reflecting MTT metabolism (a function viable cells perform)
and activated caspase 3/7 levels measured using fluorescently labeled antibodies. Day 21 motor
neurons that overexpressed TNFAIP2-GFP (TNFAIP2) compared to GFP alone (EV) were
significantly less viable and has significantly more caspase 3/7 staining 24 hours after
introduction of the TNFAIP2 vector.

Supplementary Note 1 Pre-Processing and Alignment Commands
Trimmomatic Command java -jar trimmomatic-0.32.jar PE -threads 15 -phred33 /Volumes/Drobo_Storage/Raw_Data_and_Trimmomatic_Files/First_Six_Samples_Raw_Data/Raw_Seq_Files/ALS1_1_sequence.txt.gz /Volumes/Drobo_Storage/Raw_Data_and_Trimmomatic_Files/First_Six_Samples_Raw_Data/Raw_Seq_Files/ALS1_2_sequence.txt.gz /Volumes/Drobo_Storage/Raw_Data_and_Trimmomatic_Files/Processed_Samples/Postmortem_Spinal_Samples/ALS1/ALS1_forward_paired.fq /Volumes/Drobo_Storage/Raw_Data_and_Trimmomatic_Files/Processed_Samples/Postmortem_Spinal_Samples/ALS1/ALS1_forward_unpaired.fq /Volumes/Drobo_Storage/Raw_Data_and_Trimmomatic_Files/Processed_Samples/Postmortem_Spinal_Samples/ALS1/ALS1_reverse_paired.fq /Volumes/Drobo_Storage/Raw_Data_and_Trimmomatic_Files/Processed_Samples/Postmortem_Spinal_Samples/ALS1/ALS1_reverse_unpaired.fq ILLUMINACLIP:TruSeq3-PE-2.fa:2:30:10:8:true TRAILING:20 MINLEN:50 BWA Commands head -5000000 ALS1_forward_paired.fq > 1.txt head -5000000 ALS1_reverse_paired.fq > 2.txt bwa aln hg19tr.fa 1.txt > 1.sai bwa aln hg19tr.fa 2.txt > 2.sai bwa sampe hg19tr.fa 1.sai 2.sai 1.txt 2.txt > aln.sam samtools view -Sb aln.sam > aln.bam samtools sort aln.bam aln_sorted java -jar picard.jar CollectInsertSizeMetrics I=aln_sorted.bam O=out.metrics HISTOGRAM_FILE=chartoutput.pdf VALIDATION_STRINGENCY=LENIENT # This command will generate a file called “out.metrics” in the picard folder containing mean_insert size and standard deviation values # Subtract the total length of your reads (in our case 2X150, so 300 total) from the mean_insert size – i.e 198-300 = -102 for the Tophat r value. Tophat Command tophat -p 2 -o /Volumes/Drobo_Storage/Tophat_Output/ALS1_150_ARemoved_AllReads -G /Users/Bennett_Lab/Desktop/Tuxedo_Suite/Homo_sapiens_UCSC_hg19/Homo_sapiens/UCSC/hg19/Annotation/Genes/genes.gtf --library-type fr-firststrand -r -102 --mate-std-dev 49 --transcriptome-index=hg19.transcriptome/hg19tr genome /Volumes/Drobo_Storage/Raw_Data_and_Trimmomatic_Files/Processed_Samples/Postmortem_Spinal_Samples/ALS1/ALS1_forward_paired.fq /Volumes/Drobo_Storage/Raw_Data_and_Trimmomatic_Files/Processed_Samples/Postmortem_Spinal_Samples/ALS1/ALS1_reverse_paired.fq

Collect RNA-Seq Metrics Command java -jar picard.jar CollectRnaSeqMetrics REF_FLAT=/Volumes/Drobo_Storage/Homo_sapiens_UCSC_hg19/Homo_sapiens/UCSC/hg19/Annotation/Genes/refFlat.txt.gz RIBOSOMAL_INTERVALS= intervallist.txt STRAND_SPECIFICITY=SECOND_READ_TRANSCRIPTION_STRAND INPUT=accepted_hits.bam OUTPUT=Stats GATK Point Mutation Analysis Commands STAR --runMode genomeGenerate --genomeDir /Volumes/Drobo_Storage/STARgenome --genomeFastaFiles /Volumes/Drobo_Storage/Homo_sapiens_UCSC_hg19/Homo_sapiens/UCSC/hg19/Sequence/Bowtie2Index/genome.fa --runThreadN 10 STAR --genomeDir /Volumes/Drobo_Storage/STARgenome/ --readFilesIn /Volumes/Drobo_Storage/Raw_Data_and_Trimmomatic_Files/Processed_Samples/ALS1/150Bp_AllReads_Adaptors_Removed/ALS1_forward_paired.fq /Volumes/Drobo_Storage/Raw_Data_and_Trimmomatic_Files/Processed_Samples/ALS1/150Bp_AllReads_Adaptors_Removed/ALS1_reverse_paired.fq --runThreadN 15 STAR --runMode genomeGenerate --genomeDir /Volumes/Drobo_Storage/STARgenome_2ndpass/ --genomeFastaFiles /Volumes/Drobo_Storage/Homo_sapiens_UCSC_hg19/Homo_sapiens/UCSC/hg19/Sequence/Bowtie2Index/genome.fa --sjdbFileChrStartEnd /Volumes/Drobo_Storage/STAR_Alignments/PAT_ALS1/SJ.out.tab --sjdbOverhang 75 --runThreadN 15 STAR --genomeDir /Volumes/Drobo_Storage/STARgenome_2ndpass/ --readFilesIn /Volumes/Drobo_Storage/Raw_Data_and_Trimmomatic_Files/Processed_Samples/ALS1/150Bp_AllReads_Adaptors_Removed/ALS1_forward_paired.fq /Volumes/Drobo_Storage/Raw_Data_and_Trimmomatic_Files/Processed_Samples/ALS1/150Bp_AllReads_Adaptors_Removed/ALS1_reverse_paired.fq --runThreadN 15 java -jar picard.jar AddOrReplaceReadGroups I=Aligned.out.sam O=rg_added_sorted.bam SO=coordinate RGID=ALS1 RGLB=ALS1 RGPL=ILLUMINA RGPU=NextSeq500 RGSM=ALS1 java -Xmx50g -jar picard.jar MarkDuplicates I=rg_added_sorted.bam O=deduped.bam CREATE_INDEX=true VALIDATION_STRINGENCY=SILENT M=output.metrics java -jar GenomeAnalysisTK.jar -T SplitNCigarReads -R /Volumes/Drobo_Storage/Homo_sapiens_UCSC_hg19/Homo_sapiens/UCSC/hg19/Sequence/Bowtie2Index/genome.fa -I deduped.bam -o split.bam -rf ReassignOneMappingQuality -RMQF 255 -RMQT 60 -U ALLOW_N_CIGAR_READS java -jar GenomeAnalysisTK.jar -T BaseRecalibrator -R /Volumes/Drobo_Storage/Homo_sapiens_UCSC_hg19/Homo_sapiens/UCSC/hg19/Sequence/Bowtie2Index/genome.fa -I split.bam -knownSites /Volumes/Drobo_Storage/Homo_sapiens_UCSC_hg19/Homo_sapiens/UCSC/hg19/Annotation/Everything_Else/Variation/dbsnp_138.hg19.vcf -nct 14 -o recal_data.table java -jar GenomeAnalysisTK.jar -T BaseRecalibrator -R /Volumes/Drobo_Storage/Homo_sapiens_UCSC_hg19/Homo_sapiens/UCSC/hg19/Sequence/Bo

wtie2Index/genome.fa -I split.bam -knownSites /Volumes/Drobo_Storage/Homo_sapiens_UCSC_hg19/Homo_sapiens/UCSC/hg19/Annotation/Everything_Else/Variation/dbsnp_138.hg19.vcf -BQSR recal_data.table -nct 14 -o Final_recal_data.table java -jar GenomeAnalysisTK.jar -T PrintReads -R /Volumes/Drobo_Storage/Homo_sapiens_UCSC_hg19/Homo_sapiens/UCSC/hg19/Sequence/Bowtie2Index/genome.fa -I split.bam -BQSR Final_recal_data.table -o Recal_split.bam java -jar GenomeAnalysisTK.jar -T HaplotypeCaller -D /Volumes/Drobo_Storage/Homo_sapiens_UCSC_hg19/Homo_sapiens/UCSC/hg19/Annotation/Everything_Else/Variation/dbsnp_138.hg19.vcf -R /Volumes/Drobo_Storage/Homo_sapiens_UCSC_hg19/Homo_sapiens/UCSC/hg19/Sequence/Bowtie2Index/genome.fa -I Recal_split.bam -dontUseSoftClippedBases -stand_call_conf 20.0 -stand_emit_conf 20.0 -o output.vcf java -jar GenomeAnalysisTK.jar -T VariantFiltration -R /Volumes/Drobo_Storage/Homo_sapiens_UCSC_hg19/Homo_sapiens/UCSC/hg19/Sequence/Bowtie2Index/genome.fa -V output.vcf -window 35 -cluster 3 -filterName FS -filter "FS >30.0" -filterName QD -filter "QD <2.0" -o final_output.vcf HTSeq Count Command # From within a Tophat Output Folder # samtools sort -n accepted_hits.bam accepted_hits.sorted samtools view accepted_hits.sorted.bam | htseq-count -s reverse - /Volumes/Drobo_Storage/Homo_sapiens_UCSC_hg19/Homo_sapiens/UCSC/hg19/Annotation/Genes/genes.gtf > PAT_ALS1_Count.txt Cufflinks, Cuffmerge, and Cuffdiff Commands Cufflinks Command cufflinks -o /Volumes/Drobo_Storage/Cufflinks_Cuffdiff_Output/Postmortem_Spinals_Cufflinks_Output_No_M/PAT_ALS1_no_novel_highdata1 --library-type fr-firststrand -p 1 -G /Users/Bennett_Lab/Desktop/Tuxedo_Suite/Homo_sapiens_UCSC_hg19/Homo_sapiens/UCSC/hg19/Annotation/Genes/genes.gtf -b /Users/Bennett_Lab/Desktop/Tuxedo_Suite/Homo_sapiens_UCSC_hg19/Homo_sapiens/UCSC/hg19/Sequence/Bowtie2Index/genome.fa -M /Users/Bennett_Lab/Desktop/Tuxedo_Suite/Homo_sapiens_UCSC_hg19/Homo_sapiens/UCSC/hg19/Sequence/Bowtie2Index/rRNA.tRNA.Mt.gtf -u --compatible-hits-norm --max-bundle-frags 999999999 /Volumes/Drobo_Storage/Tophat_Output/Postmortem_Spinal_Samples/PAT_ALS1_150_ARemoved_AllReads/accepted_hits.bam Cuffmerge Command cuffmerge -p 14 -o CTLvPAT_M -g /Users/Bennett_Lab/Desktop/Tuxedo_Suite/Homo_sapiens_UCSC_hg19/Homo_sapiens/UCSC/hg19/Annotation/Genes/genes.gtf -s

/Users/Bennett_Lab/Desktop/Tuxedo_Suite/Homo_sapiens_UCSC_hg19/Homo_sapiens/UCSC/hg19/Sequence/WholeGenomeFasta/genome.fa assemblies.txt Cuffdiff2 Command cuffdiff --library-type fr-firststrand -o /Volumes/Drobo_Storage/PATvCTL_No_M_compared -p 14 -b /Users/Bennett_Lab/Desktop/Tuxedo_Suite/Homo_sapiens_UCSC_hg19/Homo_sapiens/UCSC/hg19/Sequence/Bowtie2Index/genome.fa -u -L CTL,PAT -M /Users/Bennett_Lab/Desktop/Tuxedo_Suite/Homo_sapiens_UCSC_hg19/Homo_sapiens/UCSC/hg19/Sequence/Bowtie2Index/rRNA.tRNA.Mt.gtf -max-bundle-frags 999999999 -v /Volumes/Drobo_Storage/CTLvPAT_No_M/merged.gtf /Volumes/Drobo_Storage/Tophat_Output/CTL_ALS6_150_ARemoved_AllReads/accepted_hits.bam,/Volumes/Drobo_Storage/Tophat_Output/CTL_ALS8_150_ARemoved_AllReads/accepted_hits.bam,/Volumes/Drobo_Storage/Tophat_Output/CTL_ALS16_150_ARemoved_AllReads/accepted_hits.bam,/Volumes/Drobo_Storage/Tophat_Output/CTL_ALS22_150_ARemoved_AllReads/accepted_hits.bam,/Volumes/Drobo_Storage/Tophat_Output/CTL_ALS23_150_ARemoved_AllReads/accepted_hits.bam,/Volumes/Drobo_Storage/Tophat_Output/CTL_ALS24_150_ARemoved_AllReads/accepted_hits.bam,/Volumes/Drobo_Storage/Tophat_Output/CTL_ALS25_150_ARemoved_AllReads/accepted_hits.bam,/Volumes/Drobo_Storage/Tophat_Output/CTL_ALS27_150_ARemoved_AllReads/accepted_hits.bam /Volumes/Drobo_Storage/Tophat_Output/PAT_ALS1_150_ARemoved_AllReads/accepted_hits.bam,/Volumes/Drobo_Storage/Tophat_Output/PAT_ALS2_150_ARemoved_AllReads/accepted_hits.bam,/Volumes/Drobo_Storage/Tophat_Output/PAT_ALS3_150_ARemoved_AllReads/accepted_hits.bam,/Volumes/Drobo_Storage/Tophat_Output/PAT_ALS4_150_ARemoved_AllReads/accepted_hits.bam,/Volumes/Drobo_Storage/Tophat_Output/PAT_ALS9_150_ARemoved_AllReads/accepted_hits.bam,/Volumes/Drobo_Storage/Tophat_Output/PAT_ALS10_150_ARemoved_AllReads/accepted_hits.bam,/Volumes/Drobo_Storage/Tophat_Output/PAT_ALS14_150_ARemoved_AllReads/accepted_hits.bam Calculating p-values using Benjamini-Hochberg correction #Copy the p-value column in gene_exp.diff output file. Paste them into first column of Excel file, and save as “All_P.csv”. Open R, then…# Data <- read.csv(file="All_P.csv",header=TRUE,stringsAsFactors=FALSE) FDR <- p.adjust(Data[,1],method="BH") write.csv(FDR, file="FDR.csv") #Paste these values back into the gene_exp.diff file. These are FDR corrected p values. DeSeq2 Commands
source("http://bioconductor.org/biocLite.R") biocLite("DESeq2") biocLite("pasilla") library(DESeq2) library(pasilla) library(Biobase) setwd("/Users/Bennett_Lab/Desktop/DESeq2/Individual_Count_Files_Postmortem") getwd() directory = "/Users/Bennett_Lab/Desktop/DESeq2/Individual_Count_Files_Postmortem/" sampleFiles <- grep("PAT",list.files(directory),value=TRUE)

sampleCondition <- sub("(.*PAT).*","\\1",sampleFiles) sampleTable <- data.frame(sampleName = sampleFiles, fileName = sampleFiles, condition = sampleCondition) ddsHTSeq <- DESeqDataSetFromHTSeqCount(sampleTable = sampleTable, directory = directory, design = ~ condition) dds <- DESeq(ddsHTSeq) res <- results(dds) write.csv(res, file="Res.csv") edgeR Commands setwd("/Users/Bennett_Lab/Desktop/EdgeR/Postmortem Spinal Samples/") source("http://bioconductor.org/biocLite.R") biocLite("edgeR") library(edgeR) x <- read.delim("EdgeR.txt",row.names="Symbol") group <- factor(c(2,2,2,2,2,2,2,1,1,1,1,1,1,1,1)) y <- DGEList(counts=x,group=group) keep <- rowSums(cpm(y)>1) >= 7 y <- y[keep,] y$samples$lib.size <- colSums(y$counts) y$samples y <- calcNormFactors(y) y <- estimateCommonDisp(y) y <- estimateTagwiseDisp(y) et <- exactTest(y) topTags(et) et$table write.csv(et$table, "DEGList.csv") #Copy the Pvalue column in the DEGList.csv output file. Paste them into first column of Excel file, and save as “All_P.csv”. Open R, then…# Data <- read.csv(file="All_P.csv",header=TRUE,stringsAsFactors=FALSE) FDR <- p.adjust(Data[,1],method="BH") write.csv(FDR, file="FDR.csv") #Paste these adjusted p values back into the DEGList.csv file. These are FDR corrected p values. WGCNA Commands
setwd("/Users/Bennett_Lab/Desktop/WGCNA") getwd() source("http://bioconductor.org/biocLite.R") biocLite("impute") install.packages("WGCNA") library(WGCNA); options(stringsAsFactors = FALSE) ALLOW_WGCNA_THREADS=6

lnames=load(file="AllSubjects-data.input.Rdata") # This loads the variables datExpr (including information from “All_Sample_Data.csv”) and datTraits (including information from datTraits.csv). #### powers = c(c(1:10), seq(from = 12, to=24, by=2)) datExpr[, c(1:13301)] <- sapply(datExpr[, c(1:13301)], as.numeric) sft= pickSoftThreshold(datExpr, powerVector = powers, verbose = 5, networkType ="signed", corFnc= "bicor", corOptions=list(maxPOutliers=0.1)) sizeGrWindow(9, 5) par(mfrow = c(1,2)); cex1 = 0.9; plot(sft$fitIndices[,1], -sign(sft$fitIndices[,3])*sft$fitIndices[,2], xlab="Soft Threshold (power)",ylab="Scale Free Topology Model Fit,signed R^2",type="n", main = paste("Scale independence")); text(sft$fitIndices[,1], -sign(sft$fitIndices[,3])*sft$fitIndices[,2], labels=powers,cex=cex1,col="red"); abline(h=0.80,col="red") plot(sft$fitIndices[,1], sft$fitIndices[,5], xlab="Soft Threshold (power)",ylab="Mean Connectivity", type="n", main = paste("Mean connectivity")) text(sft$fitIndices[,1], sft$fitIndices[,5], labels=powers, cex=cex1,col="red") adjacency = adjacency(datExpr, power=24, corFnc="bicor", type="signed", corOptions = "use = 'p', maxPOutliers = 0.1") TOM= TOMsimilarity(adjacency) dissTOM = 1-TOM geneTree = hclust(as.dist(dissTOM), method = "average"); sizeGrWindow(12,9) plot(geneTree, xlab="", sub="", main = "Gene clustering on TOM-based dissimilarity", labels = FALSE, hang = 0.04); minModuleSize = 30; dynamicMods = cutreeDynamic(dendro = geneTree, distM = dissTOM, deepSplit = 2, pamRespectsDendro = FALSE, minClusterSize = minModuleSize); table(dynamicMods) dynamicColors = labels2colors(dynamicMods) table(dynamicColors) sizeGrWindow(8,6) plotDendroAndColors(geneTree, dynamicColors, "Dynamic Tree Cut", dendroLabels = FALSE, hang = 0.03, addGuide = TRUE, guideHang = 0.05, main = "Gene dendrogram and module colors") MEList = moduleEigengenes(datExpr, colors = dynamicColors) MEs = MEList$eigengenes MEDiss = 1-cor(MEs); METree = hclust(as.dist(MEDiss), method = "average");
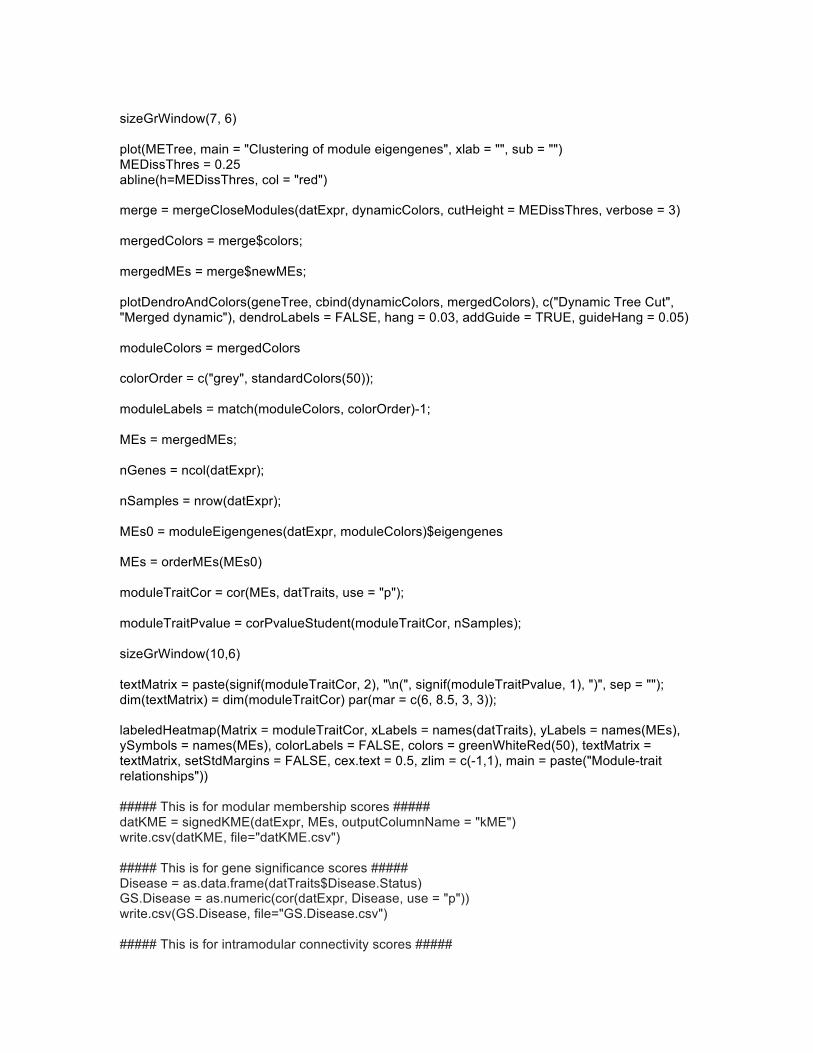
sizeGrWindow(7, 6) plot(METree, main = "Clustering of module eigengenes", xlab = "", sub = "") MEDissThres = 0.25 abline(h=MEDissThres, col = "red") merge = mergeCloseModules(datExpr, dynamicColors, cutHeight = MEDissThres, verbose = 3) mergedColors = merge$colors; mergedMEs = merge$newMEs; plotDendroAndColors(geneTree, cbind(dynamicColors, mergedColors), c("Dynamic Tree Cut", "Merged dynamic"), dendroLabels = FALSE, hang = 0.03, addGuide = TRUE, guideHang = 0.05) moduleColors = mergedColors colorOrder = c("grey", standardColors(50)); moduleLabels = match(moduleColors, colorOrder)-1; MEs = mergedMEs; nGenes = ncol(datExpr); nSamples = nrow(datExpr); MEs0 = moduleEigengenes(datExpr, moduleColors)$eigengenes MEs = orderMEs(MEs0) moduleTraitCor = cor(MEs, datTraits, use = "p"); moduleTraitPvalue = corPvalueStudent(moduleTraitCor, nSamples); sizeGrWindow(10,6) textMatrix = paste(signif(moduleTraitCor, 2), "\n(", signif(moduleTraitPvalue, 1), ")", sep = ""); dim(textMatrix) = dim(moduleTraitCor) par(mar = c(6, 8.5, 3, 3)); labeledHeatmap(Matrix = moduleTraitCor, xLabels = names(datTraits), yLabels = names(MEs), ySymbols = names(MEs), colorLabels = FALSE, colors = greenWhiteRed(50), textMatrix = textMatrix, setStdMargins = FALSE, cex.text = 0.5, zlim = c(-1,1), main = paste("Module-trait relationships")) ##### This is for modular membership scores ##### datKME = signedKME(datExpr, MEs, outputColumnName = "kME") write.csv(datKME, file="datKME.csv") ##### This is for gene significance scores ##### Disease = as.data.frame(datTraits$Disease.Status) GS.Disease = as.numeric(cor(datExpr, Disease, use = "p")) write.csv(GS.Disease, file="GS.Disease.csv") ##### This is for intramodular connectivity scores #####

IMConnectivity = intramodularConnectivity(adjacency, moduleColors, scaleByMax = FALSE) write.csv(IMConnectivity, file="IMConnectivity.csv") To retrieve module genes for IPA Core Analyses: module = "black" probes = names(datExpr) inModule = (moduleColors==module); modProbes = probes[inModule];

Supplementary Figure 1
Supplementary Figure 1: Sample metrics collected using Picard’s CollectRNASeqMetrics command. PF = Passed Filter
Bases
Sequenced
PF Bases Aligned to
hg19 genome
% Bases that PF and Aligned
to hg19 genome
% PF Bases aligned to
mRNA
% PF Bases aligned to
rRNA/tRNA/mtRNA
% PF Bases aligned to
intronic regions
% PF Bases aligned to intergenic
regions Sample ID ALS1 21,525,372,600 13,482,235,967 62.6 30.3 24.1 30.8 14.8 ALS2 17,620,068,900 11,688,557,657 66.3 25.4 39.7 22.8 12.2 ALS3 23,518,969,200 15,062,468,598 64.0 35.8 24.1 24.8 15.3 ALS4 19,429,933,500 12,750,324,647 65.6 37.1 25.8 22.4 14.7 ALS9 25,847,743,800 15,956,695,398 61.7 36.7 21.4 27.4 14.4 ALS10 18,557,838,300 12,691,363,772 68.4 31.8 25.7 27.8 14.7 ALS14 18,327,581,100 12,410,814,921 67.7 43.7 19.7 25.6 11.0 CTL6 25,560,552,300 15,739,588,406 61.6 37.3 19.7 26.5 16.5 CTL8 24,262,752,600 15,323,900,550 63.2 33.1 22.7 27.9 16.3 CTL16 22,605,558,600 14,017,986,644 62.0 28.7 30.1 26.9 14.3 CTL22 16,823,823,300 11,171,823,684 66.4 30.2 32.4 25.0 12.4 CTL23 18,963,078,300 13,009,938,471 68.6 30.1 43.4 16.3 10.2 CTL24 18,073,171,500 12,555,674,242 69.5 30.4 38.4 17.8 13.5 CTL25 19,274,686,800 13,257,578,863 68.8 35.5 34.3 17.8 12.4 CTL27 18,371,600,100 12,471,242,885 67.9 32.5 33.7 21.3 12.5

Supplementary Figure 2
Supplementary Figure 2 details the number of paired end reads that aligned either uniquely or multiply to hg19 genes. Uniquely aligned reads were used for DeSeq2 and EdgeR analyses.
Paired End Reads uniquely aligned to hg19 genes
Paired End Reads Multiply aligned to
hg19 genes Sample ID
ALS1 17,079,872
13,923,290
ALS2 12,142,430
14,946,592
ALS3 22,456,944
20,252,817
ALS4 20,074,506
29,925,873
ALS9 25,147,130
18,710,778
ALS10 16,567,040
22,428,047
ALS14 22,785,166
15,660,804
CTL6 24,978,566
32,026,378
CTL8 21,336,355
31,498,430
CTL16 17,091,970
21,962,757
CTL22 14,265,193
21,672,506
CTL23 16,029,151
16,133,502
CTL24 15,524,378
25,106,385
CTL25 18,959,037
21,189,291
CTL27 16,821,773
20,867,799

Supplementary Figure 3 Downregulated DEGs
Top Canonical Pathways p-‐Value
Superpathway of Cholesterol Biosynthesis 1.83E-‐06
Cholesterol Biosynthesis I 5.64E-‐05
Cholesterol Biosynthesis II 5.64E-‐05
Cholesterol Biosynthesis III 5.64E-‐05
Hepatic Fibrosis 5.16E-‐04
Top Diseases and Disorders p-‐Value
Inflammatory Disease 2.63E-‐03-‐3.17E-‐08
Inflammatory Response 1.91E-‐03-‐3.17E-‐08
Organismal Injury and Abnormalities 2.63E-‐03-‐3.17E-‐08
Renal and Urological Disease 2.63E-‐03-‐3.17E-‐08
Dermatological Diseases and Conditions 1.75E-‐03-‐1.07E-‐07
“Activated” Upstream Regulators p-‐Value
Arsenic trioxide 4.36E-‐08 Beta-‐estradiol 1.23E-‐07
DICER1 1.80E-‐07 cholesterol 2.94E-‐07
Lysophosphatidic acid 3.02E-‐07 Supplementary Figure 3 shows IPA Core Analysis Results for DEGs (18) identified as downregulated in the ALS group by all three analyses.
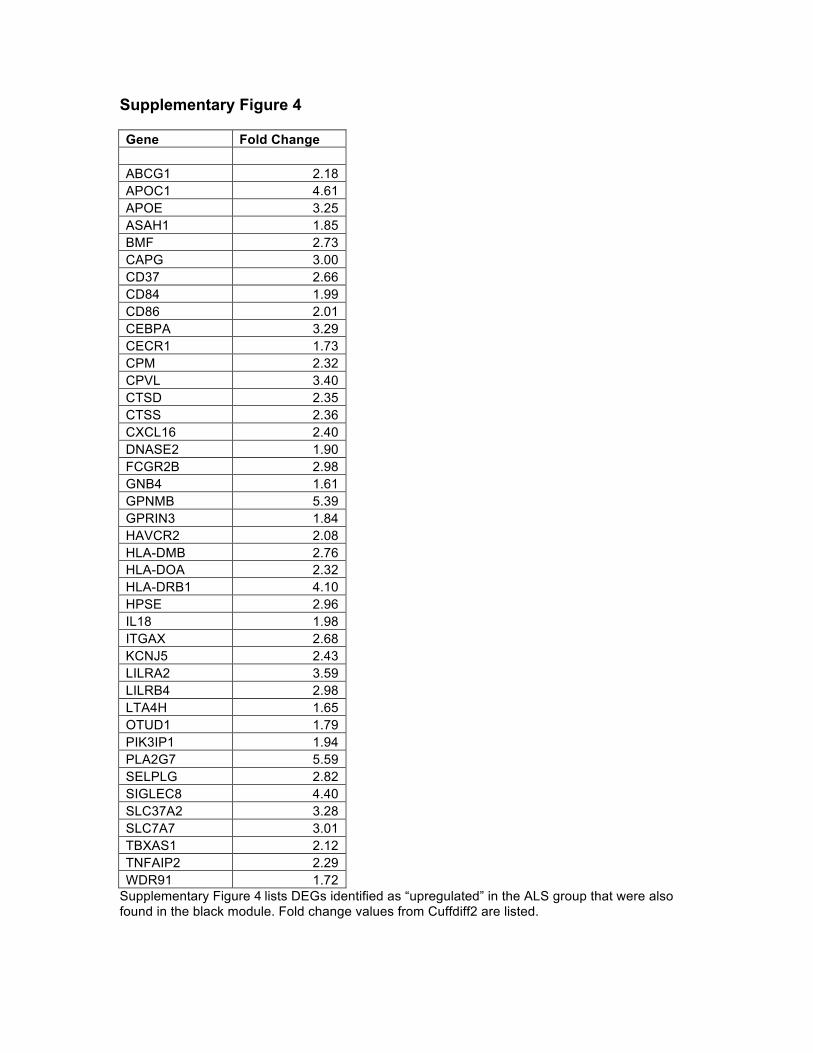
Supplementary Figure 4
Gene Fold Change ABCG1 2.18 APOC1 4.61 APOE 3.25 ASAH1 1.85 BMF 2.73 CAPG 3.00 CD37 2.66 CD84 1.99 CD86 2.01 CEBPA 3.29 CECR1 1.73 CPM 2.32 CPVL 3.40 CTSD 2.35 CTSS 2.36 CXCL16 2.40 DNASE2 1.90 FCGR2B 2.98 GNB4 1.61 GPNMB 5.39 GPRIN3 1.84 HAVCR2 2.08 HLA-DMB 2.76 HLA-DOA 2.32 HLA-DRB1 4.10 HPSE 2.96 IL18 1.98 ITGAX 2.68 KCNJ5 2.43 LILRA2 3.59 LILRB4 2.98 LTA4H 1.65 OTUD1 1.79 PIK3IP1 1.94 PLA2G7 5.59 SELPLG 2.82 SIGLEC8 4.40 SLC37A2 3.28 SLC7A7 3.01 TBXAS1 2.12 TNFAIP2 2.29 WDR91 1.72
Supplementary Figure 4 lists DEGs identified as “upregulated” in the ALS group that were also found in the black module. Fold change values from Cuffdiff2 are listed.

Supplementary Figure 5
Supplementary Figure 5 shows the TNFAIP2-GFP plasmid used in this experiment. The empty vector used for the EV group was the same plasmid with TNFAIP2 CDS taken out.

Supplementary Figure 6 Sienna 4 Module Genes
Top Canonical Pathways p-‐Value
Methylglyoxal Degradation VI 2.78E-‐03
Phosphatidylethanolamine Biosynthesis III 2.78E-‐03
NGF Signaling 3.29E-‐03
Branched-‐chain –keto acid Dehydrogenase Complex 1.11E-‐02
Phenylethylamine Degradation I 1.11E-‐02
Top Diseases and Disorders p-‐Value
Developmental Disorder 3.28E-‐02-‐7.55E-‐05
Hereditary Disorder 3.28E-‐02-‐7.55E-‐05
Metabolic Disease 2.44E-‐02-‐7.55E-‐05
Organismal Injury and Abnormalities 4.14E-‐02-‐7.55E-‐05
Renal and Urological Disease 5.55E-‐03-‐7.55E-‐05
“Activated” Upstream Regulators p-‐Value STAT6 5.19E-‐04 STAT3/5 5.10E-‐03
Butylbenzyl phthalate 5.10E-‐03 Folic acid 6.16E-‐03 WHSC1L1 7.64E-‐03
Supplementary Figure 6 shows IPA Core Analysis Results for genes (67) comprising the
sienna4 module.

Supplementary Figure 7
Age Ethnicity Gender Patients
ALS1 70 Caucasian Male ALS2 67 Caucasian Male ALS3 80 Caucasian Female ALS4 57 Caucasian Male ALS9 75 Caucasian Female
ALS10 64 Caucasian Female ALS14 61 Caucasian Male
Controls
CTL6 80 African-American Male CTL8 67 Caucasian Female
CTL16 66 Caucasian Female CTL22 54 Caucasian Male CTL23 65 African-American Female CTL24 83 Caucasian Male CTL25 59 Caucasian Male CTL27 84 Caucasian Female
Supplementary Figure 7 shows all sample’s age, ethnicity, and gender information.

Supplementary Figure 8
Supplementary Figure 8 shows raising the adjacency matrix to the power of 24 approximates scale free topology at .80.