Embed Size (px)
Citation preview
8/8/2019 Use of DNA Barcodes to Identify Flowering Plants
http://slidepdf.com/reader/full/use-of-dna-barcodes-to-identify-flowering-plants 1/6
Use of DNA barcodes to identify flowering plantsW. John Kress* † , Kenneth J. Wurdack* ‡ , Elizabeth A. Zimmer*, Lee A. Weigt ‡ , and Daniel H. Janzen §
*Department of Botany and ‡Laboratories of Analytical Biology, National Museum of Natural History, Smithsonian Institution, P.O. Box 37012, Washington,DC 20013-7012; and §Department of Biology, University of Pennsylvania, Philadelphia, PA 19104
Contributed by Daniel H. Janzen, April 15, 2005
Methods for identifying species by using short orthologous DNAsequences, known as ‘‘DNA barcodes,’’ have been proposed andinitiated to facilitate biodiversity studies, identify juveniles, asso-ciate sexes, and enhance forensic analyses. The cytochrome c oxidase 1 sequence, which has been found to be widely applicablein animal barcoding, is not appropriate for most species of plantsbecause of a much slower rate of cytochrome c oxidase 1 geneevolution in higher plants than in animals. We therefore proposethe nuclear internal transcribed spacer region and the plastidtrnH-psbA intergenic spacer as potentially usable DNA regions forapplying barcoding to owering plants. The internal transcribedspacer is the most commonly sequenced locus used in plantphylogenetic investigations at the species level and shows highlevels of interspecic divergence. The trnH-psbA spacer, althoughshort ( 450-bp), is the most variable plastid regionin angiospermsand is easily amplied across a broad range of land plants.Comparison of the total plastid genomes of tobacco and deadlynightshade enhanced with trials on widely divergent angiospermtaxa, including closely related species in seven plant families anda group of species sampled from a local ora encompassing 50plant families (for a total of 99 species, 80 genera, and 53 families),suggest that the sequences in this pair of loci have the potential todiscriminate among the largest number of plant species for bar-coding purposes.
angiosperm internal transcribed spacer Plummers Island speciesidentication trnH-psbA
The identification of animal biological diversity by usingmolecular markers has recently been proposed and demon-
strated on a large scale through the use of a short DNA sequencein the cytochrome c oxidase 1 (CO1) gene (1–5). These ‘‘DNAbarcodes’’ show promise in providing a practical, standardized,species-level identification tool that can be used for biodiversityassessment, life history and ecological studies, and forensicanalysis. Engineered DNA sequences also have been suggestedas exact identifiers and intellectual property tags for transgenicorganisms (6). A Consortium for the Barcode of Life (www.barcoding.si.edu) has been established to stimulate the creationof a database of documented and vouchered reference sequencesto serve as a universal library to which comparisons of uniden-tified taxa can be made. Here, we propose two DNA regions forbarcoding plants and provide an initial test of their utility.
DNA barcoding follows the same principle as does the basictaxonomic practice of associating a name with a specific refer-ence collection in conjunction with a functional understandingof species concepts (i.e., interpreting discontinuities in interspe-cific variation). Presently, some controversy exists over the valueof DNA barcoding (7), largely because of theperception that thisnew identification method would diminish rather than enhancetraditional morphology-based taxonomy, that species determi-nations based solely on the amount of genetic divergence couldresult in incorrect species recognition, and that DNA barcodingis a means to reconstruct phylogenies when it is actually a toolto be used largely for identification purposes (8–10). In supportof barcoding as a species identification process, Besansky et al.(11), Janzen (12, 13), Hebert et al. (1–4), and Kress (14) haveoffered arguments for the utility of DNA barcoding as a pow-erful framework for identifying specimens. Our objective in this
paper is not to debate the validity of using barcodes for plantidentification, but rather to determine appropriate DNA regionsfor use in flowering plants.
A portion of the mitochondrial CO1 gene was deliberatelychosen for use in animalidentification when DNA barcoding wasproposed (1), and its broad utility in animal systems has beendemonstrated in subsequent pilot studies (1–5). The taxonomiclimits of CO1 barcoding in animals are not fully known, but it hasproven useful to discriminate among species in most groupstested (2). The choice of a DNA region usable for barcoding hasbeen little investigated in other eukaryotes, whereas in pro-karyotes, rRNA genes are favored for identifications (e.g., ref.15). Among plants, especially angiosperms, DNA-based identi-fications, although not strictly through the use of DNA barcodes,have been creatively used to reconstruct extinct herbivore diets
(16, 17), to identify species of wood (18), to correlate rootsgrowing in Texas caves with the surface flora (19), and todetermine species used in herbal supplements (20). However,some of these identifications have not been entirely successful atthe species level, and DNA barcoding per se has not yet beenapplied to plants. The primary reason that barcoding has notbeen applied to plants by the emerging initiative is that plantmitochondrial genes, because of their low rate of sequencechange, are poor candidates for species-level discrimination. Thedivergence of CO1 coding regions among families of floweringplants has been documented to be only a few base pairs across1.4 kb of sequence (21, 22). Furthermore, plants rapidly changetheir mitochondrial genome structure (23), thereby precludingthe existence of universal intergenic spacers that otherwise would be appropriately variable unique identifiers at the species
level (e.g., ref. 24).For plant molecular systematic investigations at the specieslevel, the internal transcribed spacer (ITS) region of the nuclearribosomal cistron (18S-5.8S-26S) is the most commonly se-quenced locus (25). This region has shown broad utility acrossphotosynthetic eukaryotes (with the exception of ferns) andfungi and has been suggested as a possible plant barcode locus(26). Species-level discrimination and technical ease have been validated in most phylogenetic studies that employ ITS, and alarge body of sequence data already exists for this region( 36,000 angiosperm sequences were available in GenBank inDecember 2004, although these sequences have not been filteredfor taxa, so it is not certain how many species are represented).However, the limitations of this nuclear region in some taxa are well established. ITS has reduced species-level variability incertain groups (especially recently diverged taxa on islands),divergent paralogues that require cloning of multiple copies, andsecondary structure problems resulting in poor-quality sequencedata (25, 27). In some cases, the preferential amplification of endophytic or contaminating fungi may occur, although this canbe eliminated with plant-specific primer design (28, 29).
Freely available online through the PNAS open access option.
Abbreviations: ITS, internal transcribed spacer; CO1, cytochrome c oxidase 1.
Datadeposition:Thesequencesreportedin thispaperhavebeen depositedin theGenBankdatabase (accession nos. DQ005959 –DQ006232).†To whom correspondence should be addressed. E-mail: [email protected].
© 2005 by The National Academy of Sciences of the USA
www.pnas.org cgi doi 10.1073 pnas.0503123102 PNAS June 7, 2005 vol. 102 no. 23 8369–8374
8/8/2019 Use of DNA Barcodes to Identify Flowering Plants
http://slidepdf.com/reader/full/use-of-dna-barcodes-to-identify-flowering-plants 2/6
An advantage of the ITS region is that it can be amplified intwo smaller fragments (ITS1 and ITS2) adjoining the 5.8S locus, which has proven especially useful for degraded samples. Thequite conserved 5.8S region in fact contains enough phylogeneticsignal for discrimination at the level of orders and phyla (29),although identification at this taxonomic level is not the concernof barcoding. Alignments are trivial to optimize for 5.8S due tothe few indels found in plants and fungi (30). In contrast forphylogenetic reconstruction, ITS or any rapidly evolving non-
coding region can require complex sequence alignment forhomology assessments. Thus, the 5.8S locus can serve as a criticalalignment-free anchor point for search algorithms that makesequence comparisons for both phylogenetic and barcodingpurposes. The utility of conserved regions such as 5.8S togenerate a pool of nearest neighbors forrefined comparisons willbe critical for effective database searches, especially when com-paring a sequence that has no identical match in a sequencelibrary. GenBank BLAST searches with our ITS data (see below)returned correct matches for the sequences in GenBank. Thissuccess suggests that despite alignment concerns, current searchalgorithms will be fast and effective at using ITS for species-levelidentifications, given an adequate database for comparison. Forall of these reasons, ITS, even with its recognized limitations, isa prime candidate as an effective locus for DNA barcoding inplants.
However, the recognition that ITS has certain functionallimitations for DNA barcoding of plants is a compelling argu-ment that a search for additional loci is warranted. For phylo-genetic investigations, the plastid genome has been more readilyexploited than the nuclear genome and may offer for plantbarcoding what the mitochondrial genome does for animals. Itis a uniparentally inherited, nonrecombining, and, in general,structurally stable genome. Universal primers are available for anumber of loci and intergenic spacers that are evolving at a variety of rates. The plastid locus most commonly sequenced byplant systematists for phylogenetic purposes is rbcL , followed bythe trnL-F intergenic spacer, matK , ndhF , and atpB (e.g., refs.31–33) . rbcL has been suggested as a candidate for plantbarcoding (34), even though it has generally been used todetermine evolutionary relationships at the generic level andabove. Besides rbcL and atpB , all of the latter plastid loci havebeen used at the species level with various degrees of success.Most of them (except the trnL-F spacer) require full-lengthsequences of 1 kb to yield enough sequence length to discrim-inate species. Most relevant to plant barcoding, no region of theplastid genome has been found to have the high level of variationseen in most animal CO1 barcodes, although a few intergenicspacers have shown more promise than any plastid locus now ingeneral use (33).
When evaluating other genetic loci appropriate for plant DNAbarcoding, three criteria must be satisfied: ( i) significant species-level genetic variability and divergence, ( ii) an appropriately
short sequence length so as to facilitate DNA extraction andamplification, and ( iii) the presence of conserved flanking sitesfor developing universal primers. With regard to sequencelength, we note that in CO1 barcoding systems, the 600- to700-bp length fortuitously matches high-quality sequence datafrom average capillary sequencer reads, although it is expectedthat routine read length will improve with new technology. Animportant rationale for using short sequences also resides in theneed to obtain useful data from potentially degraded samplesfound in museum specimens. Amplicon size and gene copynumber have been shown to account for much of the variabilityof amplification success: smaller sizes and increased copy num-ber promote greater success with PCR, presumably by increasingthe likelihood that a desired sequence has been preserved (18).
Materials and MethodsDetermining Suitable Regions of the Genome. To screen for appro-priate levels of sequence divergence in the plastid genome, wechose two closely related f lowering plant species for comparison, Atropa belladonna and Nicotiana tabacum (Solanaceae). Bothspecies have complete sequence data available for their plastidgenomes (35–37). Twenty-nine additional complete plastid ge-nomes spread across a wide range of plant groups are alsoavailable for comparison: algae (five genera in various families),
mosses and liverworts (three genera in different families), fernsand relatives (three genera in different families), gymnosperms(two species in the genus Pinus ), and angiosperms (eight generain eight different families, two genera in the Fabaceae, and fourgenera and several cultivars in the Poaceae). We selected Nicotiana and Atropa , even though they belong to differentsubfamilies of Solanaceae (38), because they represent the mostclosely related taxa among the genomes available in the angio-sperms. The complete plastid genomes of the taxa in theFabaceae and the Poaceae include cultivars, hybrids, and moredistantly related genera. We aligned the Nicotiana and Atropagenomes, and raw divergence levels (i.e., number of base-pairdiscordances divided by length of sequence under consideration) were individually estimated across all genes, introns, and inter-genic spacers (Fig. 1). Plastid regions with raw sequence differ-ences 2% (Table 1) were categorized as the most variablesegments, and therefore the most promising of the plastidgenome for DNA barcoding when normalized for length. Thenuclear ITS region and plastid rbcL gene were used as baselinecomparisons for these chloroplast test regions (Table 1). Tofurther narrow down the number of remaining regions usable forbarcoding purposes, we applied a sequence criterion of 300 –800bp and a stable presence across multiple plastid genomes of bothmonocots and dicots.
Selecting Taxa for Testing. To empirically test the regions identi-fied as most appropriate for barcoding in our comparison of theplastid genomes of Atropa and Nicotiana (Table 1), we selectedtwo sets of flowering plant taxa. The first taxon set consisted of
2 or 3 species in each of eight genera spread across seven familiesof plants for a total of 19 species (Table 2 and Table 3, which ispublished as supporting information on the PNAS web site). Thesecond taxon set included a geographically circumscribed floracomprised of taxa that are not closely related but represent abroad range of angiosperms in 50 plant families, including 83species in 72 genera (Table 3). Theselection of thetwo taxon sets was made so as to test each locus for appropriate sequence lengthand divergence, primer success across a wide taxonomic spec-trum, and the viability of routinely extracting DNA from driedherbarium specimens, compared w ith fresh or silica-dried tissue.The species in the first taxon set were selected because theyrepresent a diverse set of species pairs across the angiosperms(including monocots and dicots) with various levels of phyloge-netic distance as previously shown in research by the authors
using other genetic markers (W.J.K. and K.J.W., unpublisheddata). In addition, high-quality DNA extractions f rom livingplants, silica-dried tissue, and or herbarium specimens werereadily available for these taxa. The genera were not selectedrandomly and were not biased a priori toward low or high levelsof interspecific divergence. The second taxon set was selected torepresent a f loristic sample that would be used in a typical plantDNA barcoding project. The samples were taken from Plum-mers Island, MD, a National Park Service habitat reserve in thePotomac River that has been studied and inventoried by biolo-gists in the Washington, DC, area for 100 years, making it anappropriate test site for barcoding trials. For the PlummersIsland taxa, tissue samples were taken f rom dried leaves only onherbarium specimens located in the U.S. National Herbarium
8370 www.pnas.org cgi doi 10.1073 pnas.0503123102 Kress et al.
8/8/2019 Use of DNA Barcodes to Identify Flowering Plants
http://slidepdf.com/reader/full/use-of-dna-barcodes-to-identify-flowering-plants 3/6
(Smithsonian Institution) collected between 1960 and 2000(Table 3). These samples were used to compare ITS and rbcL asstandards to the best plastid regions identified in the tests of taxon set one. A smaller set of older herbarium collections of Erysimum cheiranthoides (Brassicaceae) prepared as early as1897 were compared with more recent collections made asrecently as 1997 from the same populations to empirically testthe relationship between specimen preservation status, age, and
DNA quality (see Fig. 2, which is published as supporting
information on the PNAS web site).DNA Analysis. New DNA extractions were performed with theDNeasy Plant Mini kit (Qiagen, Valencia, CA) after tissuedisruption of 0.5–1 cm 2 of leaf tissue in a FastPrep FP-120 beadmill (Qbiogene, Carlsbad, CA). DNA extractions followed man-ufacturer’s protocols with the modification of buffer AP1 lysisconditions by the addition of 0.4 mg of proteinase, 15 mg of DTT,and incubation at 42°C for 12 h on a rocking platform. Thismethod can easily be scaled up to a 96-well format for large-scale(high-throughput) barcoding purposes. Amplification by PCRused puReTaq Ready-To-Go PCR beads (Amersham Pharma-cia Biosciences) and direct sequencing of purified PCR productsused BIGDYE 3.1 software on a 3100 sequencer, both from Applied Biosystems. Universal primers for selected genes and
intergenic spacers were taken from investigations described inrefs. 39 –41 and Table 4, which is published as supportinginformation on the PNAS web site. Comparative rbcL data weregenerated for the Plummers Island flora by splitting the geneinto two overlapping fragments (1f-724r and 636f-1368r), be-cause test amplifications on a portion of the samples netted only31% success as a full-length fragment vs. 94% as two pieces.
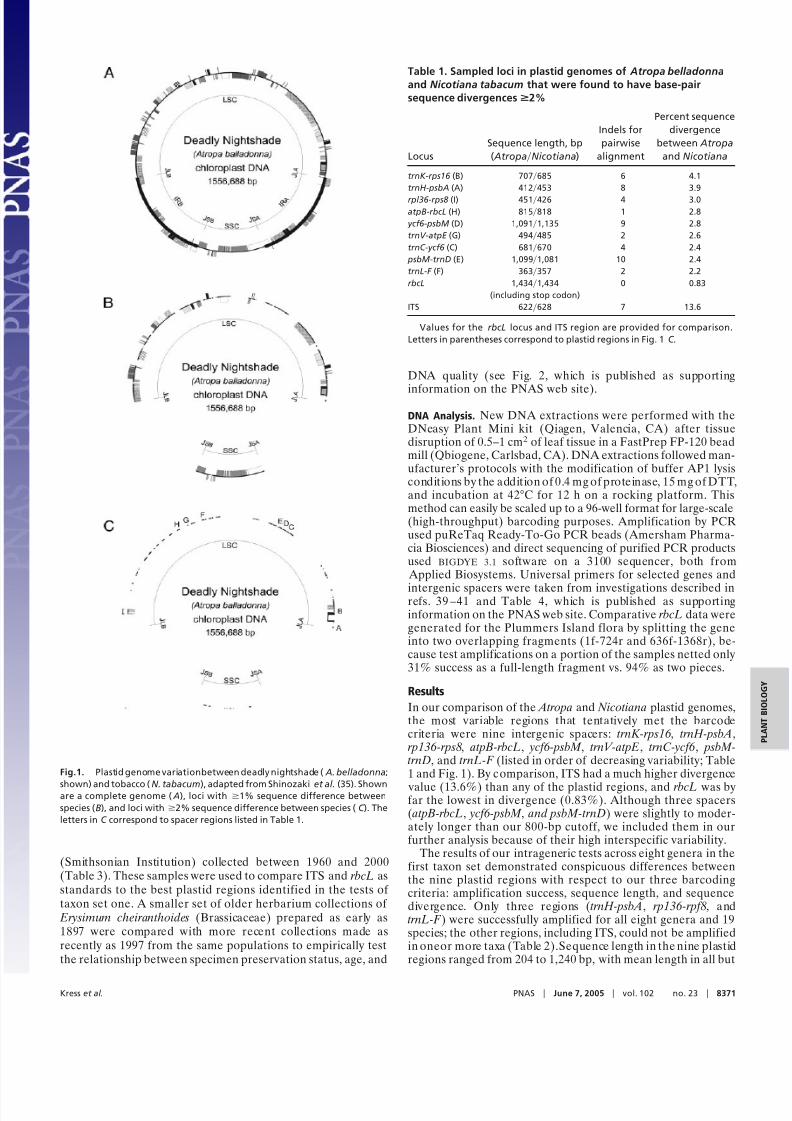
ResultsIn our comparison of the Atropa and Nicotiana plastid genomes,the most variable regions that tentatively met the barcodecriteria were nine intergenic spacers: trnK-rps16 , trnH-psbA , rp136-rps8, atpB-rbcL , ycf6-psbM , trnV-atpE , trnC-ycf6 , psbM-trnD , and trnL-F (listed in order of decreasing variability; Table1 and Fig. 1). By comparison, ITS had a much higher divergence value (13.6%) than any of the plastid regions, and rbcL was byfar the lowest in divergence (0.83%). Although three spacers( atpB-rbcL , ycf6-psbM , and psbM-trnD ) were slightly to moder-ately longer than our 800-bp cutoff, we included them in ourfurther analysis because of their high interspecific variability.
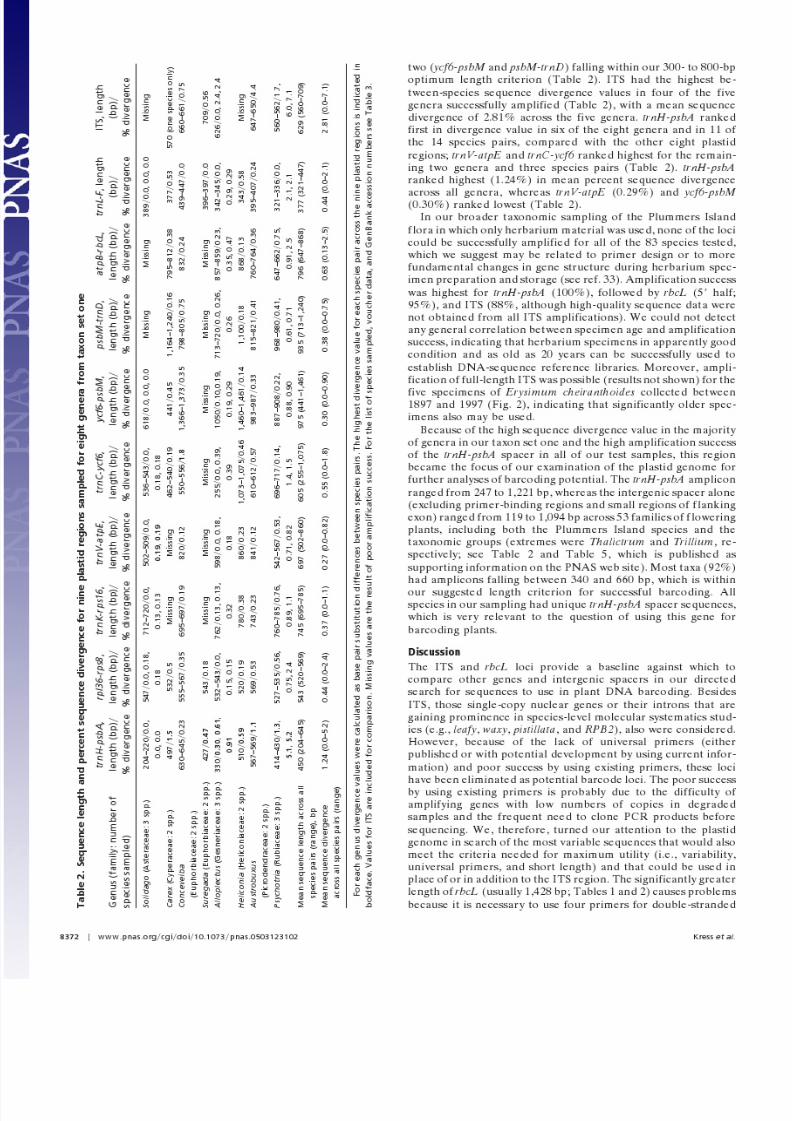
The results of our intrageneric tests across eight genera in thefirst taxon set demonstrated conspicuous differences betweenthe nine plastid regions with respect to our three barcodingcriteria: amplification success, sequence length, and sequencedivergence. Only three regions ( trnH-psbA , rp136-rpf8 , andtrnL-F ) were successfully amplified for all eight genera and 19species; the other regions, including ITS, could not be amplifiedin oneor more taxa (Table 2).Sequence length in the nine plastidregions ranged from 204 to 1,240 bp, with mean length in all but
Table 1. Sampled loci in plastid genomes of Atropa belladonnaand Nicotiana tabacum that were found to have base-pairsequence divergences > 2%
LocusSequence length, bp( Atropa Nicotiana )
Indels forpairwise
alignment
Percent sequencedivergence
between Atropaand Nicotiana
trnK-rps16 (B) 707 685 6 4.1trnH-psbA (A) 412 453 8 3.9rpl36-rps8 (I) 451 426 4 3.0atpB-rbcL (H) 815 818 1 2.8 ycf6-psbM (D) 1,091 1,135 9 2.8trnV-atpE (G) 494 485 2 2.6trnC-ycf6 (C) 681 670 4 2.4 psbM-trnD (E) 1,099 1,081 10 2.4trnL-F (F) 363 357 2 2.2rbcL 1,434 1,434 0 0.83
(including stop codon)ITS 622 628 7 13.6
Values for the rbcL locus and ITS region are provided for comparison.Letters in parentheses correspond to plastid regions in Fig. 1 C.
Fig.1. Plastid genome variationbetween deadly nightshade ( A. belladonna ;
shown) and tobacco ( N. tabacum ), adapted from Shinozaki et al. (35). Shownare a complete genome ( A), loci with 1% sequence difference betweenspecies ( B), and loci with 2% sequence difference between species ( C ). Theletters in C correspond to spacer regions listed in Table 1.
Kress et al. PNAS June 7, 2005 vol. 102 no. 23 8371
8/8/2019 Use of DNA Barcodes to Identify Flowering Plants
http://slidepdf.com/reader/full/use-of-dna-barcodes-to-identify-flowering-plants 4/6
8/8/2019 Use of DNA Barcodes to Identify Flowering Plants
http://slidepdf.com/reader/full/use-of-dna-barcodes-to-identify-flowering-plants 5/6
sequencing of the entire gene. Although this number of primersis equivalent to that needed if a two-loci system is used forbarcoding purposes, the level of interspecific variation we ob-served in rbcL is less than the variation detected in either ITS ortrnH-psbA alone (Table 2). Furthermore, this gene has beenpreviously discounted for discrimination at the species level (e.g.,refs. 31, 42, and 43).
We suggest that the trnH-psbA intergenic spacer is thebest plastidoption for a DNA barcode sequence that has good priming sites,
length, and interspecific variation. In our trials across a diverse setof genera in seven plant families, three plastid regions ( trnH-psbA , rp136-rpf8 , and trnL-F ) rankedhighestwith respect to amplificationsuccess and appropriate sequence length, but trnH-psbA demon-strated nearly 3 times the percentage sequence divergence of theseother two regions (1.24% in trnH-psbA vs. 0.44% in both rp136-rpf8and trnL-F ; Table 2). The two spacers with the next highest meansequence divergence after trnH-psbA ( atpB-rbcL at 0.63% andtrnC-ycf6 at 0.55%) couldnotbe amplified in one ormore of thetestgenera. In only one genus ( Solidago ; Asteraceae), exceptionally lowsequence divergence in trnH-psbA prevented discrimination amongthethree species tested, although insertion deletion differences stillallowed us to distinguish among the species. This lack of sequencedivergence between taxa was true for one or more species pairs inITS and all other plastid spacers, except atpB-rbcL , in our test
sample. In only 2% of our samples did homopolymer regionsadversely affect sequence quality in trnH-psbA .For a number of reasons, we refrained from a statistical test
of differences among mean sequence divergences of the ninespacer regions. First, the sample size in our survey was toorestricted to provide a meaningful statistical test (although thestandard error of the mean of trnH-psbA does not directlyoverlap with the means of any of the other spacers). Moreimportantly, as pointed out by Shaw et al. (33), genera within andbetween families of plants are phylogenetically nonequivalent,i.e., lineages recognized as genera may have quite differentdivergence rates depending on the various life history traits of the included species. Therefore, statistical comparisons betweengenera with respect to genetic distance arenot valid or warrantedat this time. Our intent in calculating these mean percent
divergences across loci is to provide a qualitative evaluation of each spacer region for barcoding purposes. In this respect, weconsider the high divergence value of trnH-psbA , which permitsspecies discrimination in the largest number of taxa we tested (sixof the eight genera and 11 of the 14 species pairs), as strongsupport for its use as a plant barcode.
The universality of trnH-psbA for differentiating among allflowering plant species clearly needs further investigation (seebelow), especially in taxa with extremely short spacers that maynot contain enough sequence variation for species-level discrim-ination (e.g., Thalictrum and Solidago in our study and Minuartiain ref. 33). This spacer region also is present in other nonflow-ering land plants. In a search of GenBank, we found that thetrnH-psbA spacer has been successfully amplified in angio-sperms, gymnosperms, ferns, mosses, and liverworts, although we do not know at this time the degree of between-speciesdivergence. Further study is needed to determine whether thisplastid region is as variable in the nonflowering plants as we haveshown for our test angiosperms, and therefore whether it is of broad utility as a barcode across the total spectrum of landplants.
Our findings on the properties of trnH-psbA agree with Shaw et al. (33) in their extensive survey of noncoding plastid DNA forphylogenetic purposes. By applying our barcode criteria (i.e.,length considerations and universality) to the framework of theirstudy, we conclude that trnH-psbA has greater potential forspecies-level discrimination than any other locus they analyzed.Similar to our results, they demonstrated that trnH-psbA ampli-fied and sequenced easily with an average length of 465 bp across
the 30 taxa they surveyed. Although this region was the secondmost variable of the 21 spacers they tested in terms of potentiallyinformative characters, they ranked its utility for phylogeneticpurposes as low (tier 3) because of its short length. Our analysisof the number of nucleotide substitutions within genera across alltaxa in the 21 plastid regions presented by Shaw et al. (33)indicates that the trnH-psbA spacer has the highest percentagenucleotide difference (0.0135 difference per base pair), eventhough at least 8 of the 21 other regions showed a greater total
number of nucleotide substitutions because of their longerlength. The interspecific nucleotide differences in trnH-psbAranged from 18% to 105% higher than that of the other eightmost variable plastid regions. Because short sequence length isan important criterion for barcoding, the high frequency of nucleotide differences of trnH-psbA , in combination with itsrelatively short length, is a significant advantage. Other studiesalso have shown a high percentage of interspecific divergence fortrnH-psbA , and in most cases, the highest in all plastid regionstested (e.g., refs. 44–48).
Despite this high level of interspecific variation, trnH-psbA hasfound only limited use in species-level phylogenetic reconstruc-tion because of the short length as well as the difficulty of alignments resulting from a high number of indels (e.g., refs.49–51). In contrast with the problems of indels for phylogenetic
construction, we suspect that indels will ultimately enhance theinformation needed for species identifications, once the appro-priate informatics tools for barcoding are developed. In the setof species we sampled, sequences were alignable within genera,but problematic above that rank. In the one case ( Solidago ) where sequence divergence was not sufficient to separate spe-cies, the presence of unique indels allowed easy discriminationamong the taxa. Blaxter (34) advocates ease of alignment as acriterion when evaluating the utility of barcode loci. We do notconsider difficulty of alignment to be a major obstacle to theapplicability of either ITS or trnH-psbA for the primary purposeof DNA barcoding, i.e., identification. Although ease of align-ment is desirable, it is not necessary for barcoding. Searches inGenBank by using our data from both loci with a BLAST searchreturned correct identities at both the gene and species level.BLAST searches are anchored and canalized by conserved regionsin both loci, 5.8S in ITS and the small region of f lanking exon fortrnH-psbA . Intraspecific variation in both ITS and trnH-psbA isknown to be relatively low, compared with interspecific variation(27, 52), although in the present study, our intraspecific sampling was insufficient to address this issue.
The extraction of DNA from specimens in herbarium collec-tions was highly successful. This success may be due to thespecimens having been air-dried and in a good state of preser- vation as evidenced by the generally green appearance of theleaves selected for extraction (Fig. 2). Plant voucher specimens vary in how and when they are dried after being pressed. If specimen-drying facilities are not immediately available, espe-cially in humid tropical climates, botanists often treat pressedspecimens with ethanol to temporarily preserve them againstfungal attack and degradation. Alcohol has been shown to bedetrimental to recovering high-quality DNA (53), although howit will affect the short sequences needed for barcoding isunknown. We are encouraged by the fact that museum speci-mens of insects dried from ethanol storage readily yield CO1sequences. A more thorough investigation and optimization of methods to extract high-quality barcode DNA from herbariumcollections in a high-throughput format will be critical to effi-ciently build a sequence-database library for plant DNA bar-codes. Our positive results by using well preserved specimensindicate that the a priori selection of apparently undegradedplant samples will be an important determinant of success.Fortunately, herbaria often have more than one specimen perspecies among which to select for successful DNA barcoding.
Kress et al. PNAS June 7, 2005 vol. 102 no. 23 8373
8/8/2019 Use of DNA Barcodes to Identify Flowering Plants
http://slidepdf.com/reader/full/use-of-dna-barcodes-to-identify-flowering-plants 6/6
We have shown here that there are gene sequences suitable forDNA barcoding of flowering plants. It may be necessary toemploy more than one locus to attain species-level discrimina-tion across all f lowering plant species. Algorithms for combiningbarcoding sequences from two or more DNA regions to yieldspecies-level unique identifiers are now needed. We believe thatITS and trnH-psbA serve as good starting points for large-scaletesting of DNA barcoding across a large sample of angiosperms. A good test would be to expand taxon sampling through the
application of both ITS and trnH-psbA to barcode the estimated8,000 species of flowering plants of Costa Rica (54).
We thank P. Hebert and R. Olmstead for comments on the manuscriptand I. Lopez for help with the illustrations. This work was supported bythe Department of Botany, the Laboratories of Analytical Biology, andthe office of the Associate Director for Research and Collections at theSmithsonian National Museum of Natural History, and National ScienceFoundation Biotic Surveys and Inventories Grant DEB-0072730 (toD.H.J.).
1. Hebert, P. D. N., Cywinska, A., Ball, S. L. & deWaard, J. R. (2003) Proc. R.Soc. London Ser. B 270, 313–321.
2. Hebert, P. D. N., Ratnasingham, S. & deWaard, J. R. (2003) Proc. R. Soc. London Ser. B 270, Suppl. 1, S96–S99.
3. Hebert, P. D. N., Stoeckle, M. Y., Zemlak, T. S. & Francis, C. M. (2004) PLoS Biol. 2, e312.
4. Hebert, P. D. N., Penton, E. H., Burns, J. M., Janzen, D. H. & Hallwachs, W.(2004) Proc. Natl. Acad. Sci. USA 101, 14812–14817.
5. Hogg, I. D. & Hebert, P. D. N. (2004) Can. J. Zool. 82, 1–6.6. Gressel, J. & Ehrlich, G. (2002) Trends Plant Sci. 7, 642–644.7. Holmes, R. (2004) New Sci. 2453, 32–35.8. Scotland, R., Hughes, C., Bailey, D. & Wortley, A. (2003) Syst. Biodiv. 1,
139–143.9. Seberg, O., Humphries, C. J., Knapp, S., Stevenson, D. W., Peterson, G.,
Scharff, N. & Andersen, N. M. (2003) Trends Ecol. Evol. 18, 63–65.10. Will, K. W. & Rubinoff, D. (2004) Cladistics 20, 47–55.11. Besansky, N. J., Severson, D. W. & Ferdig, M. T. (2003) Trends Parasitol. 19,
545–546.12. Janzen, D. H. (2004) Philos. Trans. R. Soc. London B 359, 731–732.13. Janzen, D. H. (2005) in Plant Conservation: A Natural History Approach , eds.
Krupnick, G. A. & Kress, W. J. (Univ. Chicago Press, Chicago), pp. ix–xiii.14. Kress, W. J. (2004) Am. J. Bot. 91, 2124–2127.15. Barns, S. M., Delwiche, C. F., Palmer, J. D. & Pace, N. R. (1996) Proc. Natl.
Acad. Sci. USA 93, 9188–9193.16. Poinar, H. N., Hofreiter, M., Spaulding, W. G., Martin, P. S., Stankiewicz,
B. A., Bland, H., Evershed, R. P., Possnert, G. & Pa ¨abo, S. (1998) Science 281,402–406.
17. Hofreiter, M., Poinar, H. N., Spaulding, W. G., Bauer, K., Martin, P. S.,Possnert, G. & Pa abo, S. (2000) Mol. Ecol. 9, 1975–1984.
18. Deguilloux, M.-F., Pemonge, M.-H. & Petit, R. J. (2002) Proc. R. Soc. LondonSer. B 269, 1039–1046.
19. Jackson, R. B., Moore, L. A., Hoffmann, W. A., Pockman, W. T. & Linder,C. R. (1999) Proc. Natl. Acad. Sci. USA 96, 11387–11392.
20. Zerega, N. J. C., Mori, S., Lindqvist, C., Zheng, Q. & Motley, T. J. (2002) Eco. Bot. 56, 154–164.21. Cho, Y., Mower, J. P., Qiu, Y.-L. & Palmer, J. D. (2004) Proc. Natl. Acad. Sci.
USA 101, 17741–17746.22. Cho, Y., Qiu, Y.-L., Kuhlman, P. & Palmer, J. D. (1998) Proc. Natl. Acad. Sci.
USA 95, 14244–14249.23. Adams, K. L. & Palmer, J. D. (2003) Mol. Phylogenet. Evol. 29, 380–395.24. Luo, H., van Coppenolle, B., Seguin, M. & Boutry, M. (1995) Mol. Breed. 1,
51–63.25. Alvarez, I. & Wendel, J. F. (2003) Mol. Phylogenet. Evol. 29, 417–434.26. Stoeckle, M. (2003) Bioscience 53, 2–3.27. Baldwin, B. G., Sanderson, M. J., Porter, J. M., Wojciechowski, M. F.,
Campbell, C. S. & Donoghue, M. J. (1995) Ann. Mo. Bot. Gard. 82, 247–277.
28. Zhang, W., Wendel, J. F. & Clark, L. G. (1997) Mol. Phylogenet. Evol. 8,205–217.
29. Cullings, K. W. & Vogler, D. R. (1998) Mol. Ecol. 7, 919–923.30. Hershkovitz, M. A. & Lewis, L. A. (1996) Mol. Biol. Evol. 13, 1276–1295.31. Gielly, L. & Taberlet, P. (1994) Mol. Biol. Evol. 11, 769–777.32. Soltis, D. E., Kuzoff, R. K., Mort, M. E., Zanis, M., Fishbein, M., Hufford, L.,
Koontz, J. & Orroyo, M. K. (2001) Ann. Mo. Bot. Gard. 88, 669–693.33. Shaw, J., Lickey, E. B., Beck, J. T., Farmer, S. B., Liu, W., Miller, J., Siripun,
K. C., Winder, C. T., Schilling, E. E. & Small, R. L. (2005) Am. J. Bot. 92,142–166.
34. Blaxter, M. L. (2004) Proc. R. Soc. London Ser. B 359, 669–679.35. Shinozaki, K., Ohme, M., Tanaka, M., Wakasugi, T., Hayashida, N., Matsuba-
yashi, T., Zaita, N., Chunwongse, J., Obokata, J., Yamaguchi-Shinozaki, K., et al. (1986) EMBO J. 5, 2043–2049.
36. Wakasugi, T., Sugita, M., Tsudzuki, T. & Sugiura, M. (1998) Plant Mol. Biol. Rep. 16, 231–241.
37. Schmitz-Linneweber, C., Regel, R., Du, T. G., Hupfer, H., Herrmann, R. G.& Maier, R. M. (2002) Mol. Biol. Evol. 19, 1602–1612.
38. Olmstead, R. G., Sweere, J. A., Spangler, R. E., Bohs, L. & Palmer, J. D. (1999)in Solanaceae IV , eds. Nee, M., Lester, R. N. & Hawks, J. G. (Royal BotanicGardens, London), pp. 111–137.
39. White, T. J., Bruns, T., Lee, S. & Taylor, J. (1990) in PCR Protocols: A Guideto Methods and Applications , eds. Innis, M., Gelfand, D., Sninsky, J. & White,T. (Academic, San Diego), pp. 315–322.
40. Sang, T., Crawford, D. J. & Stuessy, T. F. (1997) Am. J. Bot. 84, 1120–1136.41. Tate, J. A. & Simpson, B. B. (2003) Syst. Bot. 28, 723–737.42. Renner, S. S. (1999) Am. J. Bot. 86, 1301–1315.43. Salazar, G. A., Chase, M. W., Arenas, M. A. S. & Ingrouille, M. (2003) Am. J.
Bot. 90, 777–795.44. Azuma, H., Garcı a-Franco, J. G., Rico-Gray, V. & Thien, L. B. (2001) Am. J.
Bot . 88, 2275–2285.45. Chandler, G. T., Bayer, R. J. & Crisp, M. D. (2001) Am. J. Bot. 88, 1675–1687.46. Mast, A. R. & Givnish, T. J. (2002) Am. J. Bot. 89, 1311–1323.
47. Fukuda, T., Yokoyama, J. & Tsukaya, H. (2003) Int. J. Plant Sci. 164, 13–24.48. Miller, J. T., Grimes, J. W., Murphy, D. J., Bayer, R. J. & Ladiges, P. Y. (2003)Syst. Bot. 28, 558–566.
49. Ackerfield, J. & Wen, J. (2003) Int. J. Plant Sci. 164, 593–602.50. Hamilton, M. B., Braverman, J. M. & Soria-Hernanz, D. F. (2003) Mol. Biol.
Evol. 20, 1710–1721.51. Yamashiro, T., Fukuda, T., Yokoyama, J. & Maki, M. (2004) Mol. Phylogenet.
Evol. 31, 689–700.52. Holdregger, R. & Abbott, R. J. (2003) Am. J. Bot. 90, 931–936.53. Flournoy, L. E., Adams, R. P. & Pandy, R. N. (1996) BioTechniques 20,
657–660.54. Hammel, B. E., Grayum, M. H., Herrer, C. & Zamora, N., eds. (2003, 2004)
Manual de Plantas de Costa Rica (Mo. Bot. Gard. Press, St. Louis), Vol. 1–3.
8374 www.pnas.org cgi doi 10.1073 pnas.0503123102 Kress et al.