Embed Size (px)
Citation preview

8/22/2019 USDA Report re SNAP & Food Security 08/2013
http://slidepdf.com/reader/full/usda-report-re-snap-food-security-082013 1/355
Measuring the Effect of Supplemental Nutrition Assistance Program (SNAP)
Participation on Food Security
Nutrition Assistance Program Report August 2013Food and Nutrition Service Office of Policy Support
8/22/2019 USDA Report re SNAP & Food Security 08/2013
http://slidepdf.com/reader/full/usda-report-re-snap-food-security-082013 2/355
Non-Discrimination Policy
The U.S. Department of Agriculture (USDA) prohibits discrimination in all of its programs and
activities on the basis of race, color, national origin, age, disability, and where applicable, sex(including gender identity and expression), marital status, familial status, parental status,
religion, sexual orientation, political beliefs, genetic information, reprisal, or because all or part
of an individual's income is derived from any public assistance program. (Not all prohibited bases apply to all programs.) Persons with disabilities who require alternative means for
communication of program information (Braille, large print, audiotape, etc.) should contact
USDA's TARGET Center at (202) 720-2600 (voice and TDD).
To file a complaint of discrimination, write to USDA, Assistant Secretary for Civil Rights,
Office of the Assistant Secretary for Civil Rights, 1400 Independence Avenue, S.W., Stop
9410, Washington, DC 20250-9410; or call toll-free at (866) 632-9992 (English) or (800) 877-8339 (TDD) or (866) 377-8642 (English Federal-relay) or (800) 845-6136 (Spanish Federal-
relay). USDA is an equal opportunity provider and employer.
8/22/2019 USDA Report re SNAP & Food Security 08/2013
http://slidepdf.com/reader/full/usda-report-re-snap-food-security-082013 3/355
Measuring the Effect of Supplemental
Nutrition Assistance Program (SNAP)
Participation on Food Security
Authors:
James Mabli
Jim Ohls
Lisa Dragoset
Laura Castner
Betsy Santos
Submitted by:
Mathematica Policy Research
955 Massachusetts AvenueSuite 801
Cambridge, MA 02139
Project Directors: Jim Ohls
James Mabli
Survey Director: Betsy Santos
Submitted to:
Office of Policy Support
Food and Nutrition Service 3101 Park Center Drive
Alexandria, VA 22302-1500
Project Officer:
Sarah Zapolsky
This study was conducted under Contract number GS-10F-0050L with the Food and NutritionService, United States Department of Agriculture.
This report is available on the Food and Nutrition website: http://www.fns.usda.gov
Suggested Citation:Mabli, James, Jim Ohls, Lisa Dragoset, Laura Castner, and Betsy Santos. Measuring the Effect
of Supplemental Nutrition Assistance Program (SNAP) Participation on Food Security.
Prepared by Mathematica Policy Research for the U.S. Department of Agriculture, Food and Nutrition Service, August 2013.
Food and N utr ition Service, Office of Policy Support Augu st 2013

8/22/2019 USDA Report re SNAP & Food Security 08/2013
http://slidepdf.com/reader/full/usda-report-re-snap-food-security-082013 4/355
8/22/2019 USDA Report re SNAP & Food Security 08/2013
http://slidepdf.com/reader/full/usda-report-re-snap-food-security-082013 5/355
iii
ACKNOWLEDGEMENTS
This report was prepared for the U.S. Department of Agriculture, Food and Nutrition Service(FNS), Office of Research and Analysis by James Mabli, Jim Ohls, Lisa Dragoset, Laura Castner,and Betsy Santos of Mathematica Policy Research. Many individuals made important contributionsto this study. The authors thank Dawn Nelson and Betsy Santos for designing, pre-testing, anddirecting the telephone surveys; Margie Rosa for overseeing the administration of the telephonesurvey; Lauren Greczyn for leading the locating component of the data collection; Barbara Kolln forleading the Information Services team that programmed the computer assisted interview and thesample management system; John Hall, assisted by Thomas Decker, for designing and implementing the sampling methodology and developing sampling weights; Bryan Bernecker and Aaron Mardenfor expert programming in creating analysis variables and generating study findings; Allen Schirm forreviewing the report; Autumn Parker for preparing the manuscript; and many staff at Mathematica’sSurvey Operations Center. The authors also thank Sarah Zapolsky of FNS for her guidance andsupport throughout the entire study, as well as Anita Singh and Kathryn Law of FNS and Mark Nord of the Economic Research Service for their thoughtful review and critique.
Mathematica Project Directors: Jim Ohls and James MabliMathematica Project Number: 06801.710
.

8/22/2019 USDA Report re SNAP & Food Security 08/2013
http://slidepdf.com/reader/full/usda-report-re-snap-food-security-082013 6/355
This page has been left blank for double-sided copying.
8/22/2019 USDA Report re SNAP & Food Security 08/2013
http://slidepdf.com/reader/full/usda-report-re-snap-food-security-082013 7/355
v
CONTENTS
ACKNOWLEDGEMENTS ................................................................................................. III
EXECUTIVE SUMMARY ................................................................................................ XIX
I. INTRODUCTION ............................................................................................. 1
A. Research Objectives and Analytic Approach ............................................. 2
B. Layout of the Report ................................................................................ 2
II. DATA AND METHODOLOGY ........................................................................... 5
A. Study Design ........................................................................................... 5
B. Data Collection and Response Rates ........................................................ 7
C. Outcome Measures and Explanatory Variables ......................................... 8
1. Outcome Measures for the Food Security Analyses ............................ 82. Outcome Measures for the Food Expenditure Analyses ...................... 93. Explanatory Variables ...................................................................... 10
D. Analysis Methods .................................................................................. 11
1. Multivariate Analysis of Food Security .............................................. 112. Multivariate Analysis of Food Expenditures ...................................... 113. Standard Errors ............................................................................... 124. Subgroup Analysis........................................................................... 12
E. Weight Construction .............................................................................. 12
F. Limitations ............................................................................................ 13
III. CHARACTERISTICS AND CIRCUMSTANCES OF SNAP HOUSEHOLDS ................ 15
A. Food Security Status of Six- Month and New- EntrantHouseholds ........................................................................................... 15
B. Food Security Status of Children in Six- Month and New- EntrantHouseholds with Children ...................................................................... 16
C. Food Spending of Six- Month and New- Entrant Households ................... 17
D. Explanatory Variables Used in Multivariate Analysis ............................... 18
1. Characteristics of Survey Respondents ............................................ 182. Overview of Differences Between New Entrants and Each of
the Two Samples of Six- Month Households ..................................... 23

8/22/2019 USDA Report re SNAP & Food Security 08/2013
http://slidepdf.com/reader/full/usda-report-re-snap-food-security-082013 8/355
Contents Mathematica Policy Research
vi
IV. SNAP AND HOUSEHOLD FOOD SECURITY ...................................................... 25
A. Associations Between SNAP and Household Food Security ..................... 25
B. Associations Between SNAP and Children’s Food Security ...................... 27
C. Associations Between SNAP and Household Food Security, bySubgroup .............................................................................................. 29
1. Differences in Associations, by Household Composition .................. 302. Differences in Associations, by Household Income .......................... 323. Differences in Associations, by SNAP Benefit Amount ...................... 324. Summary of Subgroup Findings ....................................................... 35
V. SNAP AND HOUSEHOLD FOOD EXPENDITURES .............................................. 37
A. Associations Between SNAP and Usual Food Expenditures ..................... 37
B. Associations Between SNAP and Usual Food ExpendituresRelative to the Cost of the TFP ............................................................... 38
C. Associations Between SNAP and Household Food Spending, bySubgroup .............................................................................................. 39
1. Differences in Associations, by Household Composition .................. 392. Differences in Associations, by Household Income .......................... 413. Differences in Associations, by SNAP Benefit Amount ...................... 414. Summary of Subgroup Findings ....................................................... 44
D. Additional Results ................................................................................. 44
E. The Relationship between the SNAP Benefit Amount and FoodExpenditures ......................................................................................... 45
F. Summary ............................................................................................... 46
VI. CONCLUSIONS AND IMPLICATIONS FOR FUTURE RESEARCH .......................... 47
A. Key Findings .......................................................................................... 47
B. Comparison of Findings to Related Studies ............................................ 48
C. Implications for Future Research ........................................................... 50
D. Implications for Research Methods ........................................................ 50
REFERENCES ................................................................................................. 53
APPENDIX A: DATA AND METHODOLOGY
APPENDIX B: EXPANDED SET OF CHARACTERISTICS OF NEW-ENTRANT AND SIX- MONTH SNAP HOUSEHOLDS

8/22/2019 USDA Report re SNAP & Food Security 08/2013
http://slidepdf.com/reader/full/usda-report-re-snap-food-security-082013 9/355
Contents Mathematica Policy Research
vii
APPENDIX C: DETAILS FOR FOOD SECURITY REGRESSIONS
APPENDIX D: SENSITIVITY ANALYSES FOR FOOD SECURITYREGRESSIONS
APPENDIX E: ASSOCIATIONS BETWEEN SNAP AND FOOD INSECURITY,
BY SUBGROUP
APPENDIX F: DETAILS FOR FOOD EXPENDITURES REGRESSIONS
APPENDIX G: SENSITIVITY ANALYSES OF FOOD EXPENDITURES
APPENDIX H: SUBGROUP SAMPLE SIZES
APPENDIX I: BASELINE CHARACTERISTICS OF NEW- ENTRANTHOUSEHOLDS WITH AND WITHOUT A FOLLOW- UP INTERVIEW
APPENDIX J: SURVEY INSTRUMENTS

8/22/2019 USDA Report re SNAP & Food Security 08/2013
http://slidepdf.com/reader/full/usda-report-re-snap-food-security-082013 10/355
This page has been left blank for double-sided copying.

8/22/2019 USDA Report re SNAP & Food Security 08/2013
http://slidepdf.com/reader/full/usda-report-re-snap-food-security-082013 11/355
ix
TABLES
1 Median Household Food Spending in Six- Month and New- EntrantSNAP Households, in Absolute Terms and Relative to the Cost of the Thrifty Food Plan ................................................................................. xxx
III.1 Median Household Food Spending in Six- Month and New- EntrantSNAP Households, in Absolute Terms and Normalized by the Costof the TFP .................................................................................................... 18
III.2 Demographic Characteristics, Household Size, and Composition of Six- Month and New- Entrant SNAP Households ............................................ 19
III.3 Employment Status, Monthly Income as Percentage of the PovertyLine, and Income Sources of Six- Month and New- Entrant SNAPHouseholds ................................................................................................. 20
III.4 Prior SNAP Participation and Changes in Household Size, Housing
Status, or Employment, Pay, or Hours Worked in Past Six MonthsExperienced by Six- Month and New- Entrant SNAP Households .................... 21
III.5 Well- Being, Language of Interview, and Region of Residence of Six-Month and New- Entrant SNAP Households .................................................. 22
III.6 Mean State Characteristics Associated with Six- Month and New-Entrant SNAP Households ............................................................................ 23
IV.1 Percentage of Households That Are Food Insecure and Percentageof Households That Have Very Low Food Security, by Six- Month andNew- Entrant SNAP Participation Status and by Household
Composition ................................................................................................ 31
IV.2 Percentage of Households That Are Food Insecure and Percentageof Households That Have Very Low Food Security, by Six- Month andNew- Entrant SNAP Participation Status and by Household Income................ 33
IV.3 Percentage of Households That Are Food Insecure and Percentageof Households That Have Very Low Food Security, by Six- Month andNew- Entrant SNAP Participation Status and by SNAP Benefit Amount ........... 34
V.1 Regression- Adjusted Average Usual Weekly Household FoodSpending and Food Spending Relative to the Cost of the TFP, by
Six- Month and New- Entrant SNAP Participation Status and byHousehold Composition .............................................................................. 40
V.2 Regression- Adjusted Average Usual Weekly Household FoodSpending and Food Spending Relative to the Cost of the TFP, bySix- Month and New- Entrant SNAP Participation Status and byHousehold Income ....................................................................................... 42
V.3 Regression- Adjusted Average Usual Weekly Household FoodSpending and Food Spending Relative to the Cost of the TFP, by

8/22/2019 USDA Report re SNAP & Food Security 08/2013
http://slidepdf.com/reader/full/usda-report-re-snap-food-security-082013 12/355
Tables Mathematica Policy Research
x
Six- Month and New-Entrant SNAP Participation Status and by SNAPBenefit Amount ............................................................................................ 43
A.1 SNAPFS Survey Outcome Rates ................................................................... A- 7
A.2 Definitions of Weighting Classes for New-Entrant Baseline
(Completing)............................................................................................ A- 19
A.3 Definitions of Weighting Classes for New-Entrant Baseline(Eligibility Determination) ........................................................................ A- 20
A.4 Definitions of Weighting Classes for New-Entrant Baseline(Contacting) ............................................................................................. A- 21
A.5 Definitions of Weighting Classes for Six- Month Baseline(Completing)............................................................................................ A- 22
A.6 Definitions of Weighting Classes for Six- Month Baseline (Eligibility
Determination) ........................................................................................ A- 22
A.7 Definitions of Weighting Classes for Six- Month Baseline(Contacting) ............................................................................................. A- 23
A.8 Definitions of Weighting Classes for New- Entrant Follow- Up(Completing)............................................................................................ A- 24
A.9 Definitions of Weighting Classes for New- Entrant Follow- Up(Eligibility Determination) ........................................................................ A- 24
A.10 Definitions of Weighting Classes for New- Entrant Follow- Up
(Contacting) ............................................................................................. A- 25
B.1 Variables for Which There is at Least a 5 Percentage PointDifference between New- Entrant and Six- Month HouseholdPercentages For at Least One of the Cross- Sectional or LongitudinalSamples ..................................................................................................... B- 3
B.2 Demographic Characteristics, Language of Interview, and Region of Residence of Six- Month and New- Entrant SNAP Households ...................... B- 4
B.3 Household Size and Composition of Six- Month and New- EntrantSNAP Households ...................................................................................... B- 5
B.4 Employment Status, Monthly Income as Percentage of the PovertyLine, and Earned and Unearned Income of Six- Month and New-Entrant SNAP Households .......................................................................... B- 6
B.5 Income Sources and Average Monthly Income Amounts of Six-Month and New- Entrant SNAP Households ................................................ B- 7
B.6 Household Income, Earnings, and Unearned Income of Six- Monthand New- Entrant SNAP Households, Among Households withIncome ...................................................................................................... B- 8
8/22/2019 USDA Report re SNAP & Food Security 08/2013
http://slidepdf.com/reader/full/usda-report-re-snap-food-security-082013 13/355
Tables Mathematica Policy Research
xi
B.7 Household Resources Other than Income of Six- Month and New-Entrant SNAP Households .......................................................................... B- 9
B.8 Changes in Household Size, Housing Status, or Employment, Pay, orHours Worked in Past Six Months Experienced by Six- Month andNew- Entrant SNAP Households ................................................................ B- 10
B.9 SNAP Participation Characteristics of Six- Month and New-EntrantSNAP Households .................................................................................... B- 11
B.10 Participation in Non- SNAP Food Assistance Programs in Past 30Days of Six- Month and New- Entrant SNAP Households ............................ B- 12
B.11 Food Purchase Behavior of Six- Month and New-Entrant SNAPHouseholds ............................................................................................. B- 13
B.12 EBT Usage, Timing of Receipt of SNAP Benefit Relative to InterviewDate, and Money Saving Techniques for Food Spending of Six-
Month and New- Entrant SNAP Households .............................................. B- 14
B.13 Self- Reported Health Status and Body Mass Index of Six- Month andNew- Entrant SNAP Households ................................................................ B- 15
B.14 Self- Reported Mental Health and Well- Being of Six- Month andNew- Entrant SNAP Households ................................................................ B- 16
B.15 State Characteristics Associated with Six- Month and New-EntrantSNAP Households .................................................................................... B- 17
C.1 Coefficients and Standard Errors for Food Insecurity Logistic
Regressions ............................................................................................... C- 4
C.2 Regression Coefficients of the Effects of SNAP Participation andHousehold Characteristics on a Household’s Likelihood of HavingVery Low Food Security .............................................................................. C- 6
C.3 Regression Coefficients of the Effects of SNAP Participation andHousehold Characteristics on a Household with Children’sLikelihood being Food Insecure ................................................................. C- 8
C.4 Regression Coefficients of the Effects of SNAP Participation andHousehold Characteristics on a Household with Children’s
Likelihood of Having Very Low Food Security ........................................... C- 10
D.1 Regression- Adjusted Percentage of Households That Are FoodInsecure or That Have Very Low Food Security, by Six- Month andNew- Entrant SNAP Participation Status and by Model Specification ........... D- 4
D.2 Regression- Adjusted Percentage of Households That Are FoodInsecure or That Have Very Low Food Security, by Six- Month andNew- Entrant SNAP Participation Status and by Whether Smaller Setof Explanatory Variables Is Used ............................................................... D- 5
8/22/2019 USDA Report re SNAP & Food Security 08/2013
http://slidepdf.com/reader/full/usda-report-re-snap-food-security-082013 14/355
Tables Mathematica Policy Research
xii
D.3 Regression- Adjusted Percentage of Households That Are FoodInsecure or That Have Very Low Food Security, by Six- Month andNew-Entrant SNAP Participation Status and by Whether Fixed-Effects Model Is Used in the Longitudinal Analysis .................................... D- 6
D.4 Length of Time Between Interview Date and Reported SNAP Benefit
Receipt ..................................................................................................... D- 7
D.5 Regression- Adjusted Percentage of Households That Are FoodInsecure or That Have Very Low Food Security, by Six- Month andNew- Entrant SNAP Participation Status and by Whether ModelIncludes “Days Since SNAP Benefit Receipt” Variable .................................. D- 8
D.6 Regression- Adjusted Percentage of Households That Are FoodInsecure or That Have Very Low Food Security, by Six- Month andNew-Entrant SNAP Participation Status and by Whether SNAPBenefits Had Been Received Before the Interview and by Number of Days Since SNAP Benefit Receipt for New- Entrant Households .................. D- 9
D.7 Regression- Adjusted Percentage of Households That Are FoodInsecure and Regression- Adjusted Percentage of Households ThatHave Very Low Food Security, by Six- Month and New- Entrant SNAPParticipation Status and by Whether New- Entrant Sample IsRestricted to Those Households Still on SNAP Six Months Later............... D- 11
E.1 Regression- Adjusted Percentage of Households That Are FoodInsecure, by Six Month and New Entrant SNAP Participation Statusand by Age, Education, Race and Ethnicity, and Employment Statusof Household Head .................................................................................... E- 3
E.2 Regression- Adjusted Percentage of Households That Are FoodInsecure, by Six Month and New Entrant SNAP Participation Statusand by Household Composition and Region of Residence .......................... E- 4
E.3 Regression- Adjusted Percentage of Households That are FoodInsecure, by Six Month and New Entrant SNAP Participation Statusand by Household Income and Sources of Household Income .................... E- 5
E.4 Regression- Adjusted Percentage of Households That Are FoodInsecure, by Six Month and New Entrant SNAP Participation Statusand by SNAP Benefit Amount, Expedited Service Receipt, and PriorSNAP Participation Status ........................................................................... E- 6
E.5 Regression- Adjusted Percentage of Households That Are FoodInsecure, by Six Month and New Entrant SNAP Participation Statusand by Health Status and Body Mass Index of Household Head .................. E- 7
E.6 Regression- Adjusted Percentage of Households That Are FoodInsecure, by Six Month and New Entrant SNAP Participation Statusand by Household Residential and Ownership Status ................................. E- 8
E.7 Regression- Adjusted Percentage of Households That Are FoodInsecure, by Six Month and New Entrant SNAP Participation Status
8/22/2019 USDA Report re SNAP & Food Security 08/2013
http://slidepdf.com/reader/full/usda-report-re-snap-food-security-082013 15/355
Tables Mathematica Policy Research
xiii
and by Household Resources and Food Preparation and StorageCapabilities ............................................................................................... E- 9
E.8 Regression- Adjusted Percentage of Households That are FoodInsecure, by Six Month and New Entrant SNAP Participation Statusand by Participation in Nutrition and Community Food Programs ............. E- 10
E.9 Regression- Adjusted Percentage of Households That Are FoodInsecure, by Six Month and New Entrant SNAP Participation Statusand by Mental Health and Well- Being of Household Head ........................ E- 11
E.10 Regression- Adjusted Percentage of Households That Have Very LowFood Security, by Six Month and New Entrant SNAP ParticipationStatus and by Age, Education, Race and Ethnicity, and EmploymentStatus of Household Head ........................................................................ E- 12
E.11 Regression- Adjusted Percentage of Households That Have Very LowFood Security, by Six Month and New Entrant SNAP Participation
Status and by Household Composition and Region of Residence .............. E- 13
E.12 Regression- Adjusted Percentage of Households That Have Very LowFood Security, by Six Month and New Entrant SNAP ParticipationStatus and by Household Income and Sources of Household Income ........ E- 14
E.13 Regression- Adjusted Percentage of Households That Have Very LowFood Security, by Six Month and New Entrant SNAP ParticipationStatus and by SNAP Benefit Amount, Expedited Service Receipt, andPrior SNAP Participation Status ................................................................. E- 15
E.14 Regression- Adjusted Percentage of Households That Have Very Low
Food Security, by Six Month and New Entrant SNAP ParticipationStatus and by Health Status and Body Mass Index of HouseholdHead........................................................................................................ E- 16
E.15 Regression- Adjusted Percentage of Households That Have Very LowFood Security, by Six Month and New Entrant SNAP ParticipationStatus and by Household Residential and Ownership Status ..................... E- 17
E.16 Regression- Adjusted Percentage of Households That Have Very LowFood Security, by Six Month and New Entrant SNAP ParticipationStatus and by Household Resources and Food Preparation andStorage Capabilities ................................................................................. E- 18
E.17 Regression- Adjusted Percentage of Households That Have Very LowFood Security, by Six Month and New Entrant SNAP ParticipationStatus and by Participation in Nutrition and Community FoodPrograms ................................................................................................. E- 19
E.18 Regression- Adjusted Percentage of Households That Have Very LowFood Security, by Six Month and New Entrant SNAP ParticipationStatus and by Mental Health and Well- Being of Household Head .............. E- 20
8/22/2019 USDA Report re SNAP & Food Security 08/2013
http://slidepdf.com/reader/full/usda-report-re-snap-food-security-082013 16/355
Tables Mathematica Policy Research
xiv
F.1 Regression Coefficients of the Effects of SNAP Participation andHousehold Characteristics on Household Usual Weekly FoodSpending ................................................................................................... F- 4
F.2 Regression Coefficients of the Effects of SNAP Participation andHousehold Characteristics on Usual Weekly Food Spending Relative
to the Cost of the Thrifty Food Plan ........................................................... F- 6
G.1 Median Household Food Spending in Six- Month and New- EntrantSNAP Households ...................................................................................... G-4
G.2 Distribution of Usual Weekly Food Expenditures and Usual WeeklyFood Expenditures Relative to the Cost of the TFP in Six- Month andNew- Entrant SNAP Households .................................................................. G- 5
G.3 Median Household Food Spending in Six- Month and New- EntrantSNAP Households, by Household Size and Presence of Children inthe Household ........................................................................................... G- 6
G.4 Associations Between SNAP Participation and Household FoodSpending Relative to the Cost of the TFP, by Alternative SampleDefinitions ................................................................................................. G-8
G.5 Associations Between SNAP Participation and Household FoodSpending Relative to the Cost of the TFP, by Alternative ModelSpecifications ............................................................................................ G-9
G.6 Associations Between SNAP Participation and Household FoodSpending Relative to the Cost of the TFP, by Alternative ModelSpecifications .......................................................................................... G- 10
G.7 Associations Between SNAP Participation and Household FoodSpending Relative to the Cost of the TFP, by Whether Fixed- EffectsEstimator Is Used ..................................................................................... G- 11
G.8 Length of Time Between Interview Date and Reported SNAP BenefitReceipt .................................................................................................... G- 12
G.9 Associations Between SNAP Participation and Household FoodSpending Relative to the Cost of the TFP, by Six- Month and New-Entrant SNAP Participation Status and by Whether Model Includes“Days Since SNAP Benefit Receipt” Variable .............................................. G- 12
G.10 Associations Between SNAP Participation and Usual FoodExpenditures Relative to the Cost of the TFP, by Six- Month andNew- Entrant SNAP Participation Status and by Number of DaysSince SNAP Benefit Receipt for New- Entrant Householdsa......................... G-13
G.11 Regression- Adjusted Household Food Spending and HouseholdFood Spending Relative to the Cost of the TFP, by Six- Month andNew- Entrant SNAP Participation Status and by Whether New-EntrantSample Is Restricted to Those Households Still on SNAP Six MonthsLater ........................................................................................................ G-14

8/22/2019 USDA Report re SNAP & Food Security 08/2013
http://slidepdf.com/reader/full/usda-report-re-snap-food-security-082013 17/355
Tables Mathematica Policy Research
xv
G.12 Associations Between SNAP Benefit Amount and Household FoodSpending, Conducted Separately for Six- Month and New- EntrantHouseholds ............................................................................................. G- 16
H.1 Sample Sizes for Subgroups Used in Multivariate Analysis of FoodInsecurity and Very Low Food Security Regressionsa ................................... H-3
I.1 Demographic Characteristics, Language of Interview, and Region of Residence of Six- Month and New-Entrant SNAP Households ....................... I- 4
I.2 Household Size and Composition of Six- Month and New- EntrantSNAP Households ....................................................................................... I- 5
I.3 Employment Status, Monthly Income as Percentage of the PovertyLine, and Earned and Unearned Income of Six- Month and New-Entrant SNAP Households ........................................................................... I- 6
I.4 Income Sources and Average Monthly Income Amounts of Six-
Month and New- Entrant SNAP Households ................................................. I- 7
I.5 Household Income, Earnings, and Unearned Income of Six- Monthand New- Entrant SNAP Households, Among Households withIncome ....................................................................................................... I- 8
I.6 Household Resources Other than Income of Six- Month and New-Entrant SNAP Households ........................................................................... I- 9
I.7 Changes in Household Size, Housing Status, or Employment, Pay, orHours Worked in Past Six Months Experienced by Six- Month andNew- Entrant SNAP Households ................................................................. I- 10
I.8 SNAP Participation Characteristics of Six- Month and New- EntrantSNAP Households ..................................................................................... I- 11
I.9 Participation in Non- SNAP Food Assistance Programs in Past 30Days of Six- Month and New- Entrant SNAP Households ............................. I- 12
I.10 Food Purchase Behavior of Six- Month and New-Entrant SNAPHouseholds .............................................................................................. I- 13
I.11 EBT Usage, Timing of Receipt of SNAP Benefit Relative to InterviewDate, and Money Saving Techniques for Food Spending of Six-
Month and New- Entrant SNAP Households ............................................... I- 14
I.12 Self- Reported Health Status and Body Mass Index of Six- Month andNew- Entrant SNAP Households ................................................................. I- 15
I.13 Self- Reported Mental Health and Well- Being of Six- Month andNew- Entrant SNAP Households ................................................................. I- 16
I.14 State Characteristics Associated with Six- Month and New-EntrantSNAP Households ..................................................................................... I- 17

8/22/2019 USDA Report re SNAP & Food Security 08/2013
http://slidepdf.com/reader/full/usda-report-re-snap-food-security-082013 18/355
This page has been left blank for double-sided copying.

8/22/2019 USDA Report re SNAP & Food Security 08/2013
http://slidepdf.com/reader/full/usda-report-re-snap-food-security-082013 19/355
xvii
FIGURES
1 Study Design .............................................................................................. xxi
2 Household Food Security Status in New- Entrant and Six- MonthSNAP Householdsa .................................................................................... xxiii
3 Children’s Food Security Status in New- Entrant and Six- MonthSNAP Households with Childrena............................................................... xxiv
4 Participating in SNAP for Six Months was Associated with aDecrease in the Percentage of Households That Were Food Insecure .......... xxv
5 Participating in SNAP for Six Months was Associated with aDecrease in the Percentage of Households That had Very Low FoodSecurity .................................................................................................... xxvi
6 Participating in SNAP for Six Months was Associated with a
Decrease in the Percentage of Households with Children with FoodInsecurity Among Children ...................................................................... xxvii
7 The Evidence was Mixed as to Whether Participating in SNAP for SixMonths was Associated with a Decrease in the Percentage of Households with Children with Very Low Food Security AmongChildren ................................................................................................. xxviii
8 Participating in SNAP for Six Months was Not Associated with aChange in Mean Usual Weekly Household Food Spending ......................... xxxi
9 The Evidence was Mixed as to Whether Participating in SNAP for Six
Months was Associated with a Change in Usual Weekly HouseholdFood Spending Relative to the Cost of the TFP ......................................... xxxii
II.1 Study Design ................................................................................................. 6
III.1 Household Food Security Status in New- Entrant and Six- MonthSNAP Households ........................................................................................ 16
III.2 Children’s Food Security Status in New- Entrant and Six- MonthSNAP Households with Children ................................................................... 17
IV.1 Participating in SNAP for Six Months was Associated with a
Decrease in the Percentage of Households That Were Food Insecure ............ 26
IV.2 Participating in SNAP for Six Months was Associated with aDecrease in the Percentage of Households That had Very Low FoodSecurity ....................................................................................................... 27
IV.3 Participating in SNAP for Six Months was Associated with aDecrease in the Percentage of Households with Children with FoodInsecurity Among Children .......................................................................... 28
8/22/2019 USDA Report re SNAP & Food Security 08/2013
http://slidepdf.com/reader/full/usda-report-re-snap-food-security-082013 20/355
Figures Mathematica Policy Research
xviii
IV.4 The Evidence was Mixed as to Whether Participating in SNAP for SixMonths was Associated with a Decrease in the Percentage of Households with Children with Very Low Food Security AmongChildren ...................................................................................................... 29
V.1 Participating in SNAP for Six Months was Not Associated with a
Change in Usual Weekly Household Food Spending ...................................... 37
V.2 The Evidence was Mixed as to Whether Participating in SNAP for SixMonths was Associated with a Change in Usual Weekly HouseholdFood Spending Relative to the Cost of the TFP ............................................. 38
8/22/2019 USDA Report re SNAP & Food Security 08/2013
http://slidepdf.com/reader/full/usda-report-re-snap-food-security-082013 21/355
Executive Summary Mathematica Policy Research
xix
EXECUTIVE SUMMARY
A. What Are the Objectives?
The Supplemental Nutrition Assistance Program (SNAP) provides nutrition assistance benefitsto low-income individuals and families in an effort to reduce hunger and improve the health and well-being of low-income people nationwide. Although SNAP has long been one of the largest andmost important nutrition assistance programs for low-income households, its significance has growneven larger in recent years as it experienced record-high levels of participation. In Fiscal Year 2012,the program provided benefits to more than 46 million Americans on average per month. 1
The Food and Nutrition Service (FNS) of the United States Department of Agriculture(USDA), which administers SNAP, targets benefits to the neediest households; poorer householdsreceive greater SNAP benefits than households with more income. To counter rising food pricesand provide SNAP participants with enough resources to purchase food, the American Recovery and Reinvestment Act (ARRA), enacted in February 2009, raised the maximum SNAP benefit by 13.6 percent, effective April 2009. Because the benefit amount for all households is determined by
reducing the maximum benefit according to each household’s income net of certain housing,medical, work, and child care expenses, the benefit allotment for households not receiving themaximum increased by the same dollar amount as that for households of the same size that receivedthe maximum benefit. On average, household benefits increased by approximately $41 under ARRA(Leftin et al. 2010). In fiscal year 2011, the average household benefit was $281.
Policymakers, advocates, and those administering SNAP have long hypothesized that SNAPreduces food insecurity, which is a measure of whether a household experiences food accesslimitations due to lack of money or other resources. Estimating the effect of SNAP on foodinsecurity using household survey data has been challenging, however, because households thatparticipate in SNAP can differ in systematic ways from households that do not (commonly referredto as selection bias). For example, households that are more food-needy and have lower levels of food security are more likely to participate in SNAP. Therefore, initial differences in food insecurity between participants and nonparticipants may be greater than the ameliorative effects of theprogram (Nord and Golla 2009). Most research studies, using a variety of data and empiricalmethods, have attempted to isolate SNAP’s effect on food insecurity from the compositionaldifferences between participants and nonparticipants, but the evidence supporting the hypothesishas been mixed.2
Mathematica Policy Research conducted the SNAP Food Security (SNAPFS) survey for FNSbetween October 2011 and September 2012, to assess the effect of SNAP participation on foodsecurity and food spending in the post-ARRA environment of higher SNAP allotments. SNAPFS was the largest survey of food security and food spending among SNAP participants to date, with
9,811 households interviewed in 30 States. This report presents the evaluation findings, which arebased on a quasi-experimental design intended to minimize selection bias by comparing information
1 Data were obtained from http://www.fns.usda.gov/pd/SNAPsummary.htm.
2 Recent reviews of the literature of the effects of SNAP on food security can be found in Nord and Golla (2009);Ratcliffe and McKernan (2011); Wilde (2007); and Fox et al. (2004).
8/22/2019 USDA Report re SNAP & Food Security 08/2013
http://slidepdf.com/reader/full/usda-report-re-snap-food-security-082013 22/355
Executive Summary Mathematica Policy Research
xx
collected from SNAP households within days of entering the program to information obtained afterabout six months of participation to control for factors unrelated to SNAP.
The main objectives of the study were to:
• Assess how household food security and food expenditures vary with SNAPparticipation
• Examine how the relationships between SNAP and food security and between SNAPand food expenditures vary by key household characteristics and circumstances
• Examine in more depth what factors may distinguish between food secure and foodinsecure SNAP households with children
This report contains the research findings for the first and second objectives. The thirdobjective was based on a qualitative component of the study and was addressed in a separate report. 3
B. How Was the Study Conducted?
1. Study Design
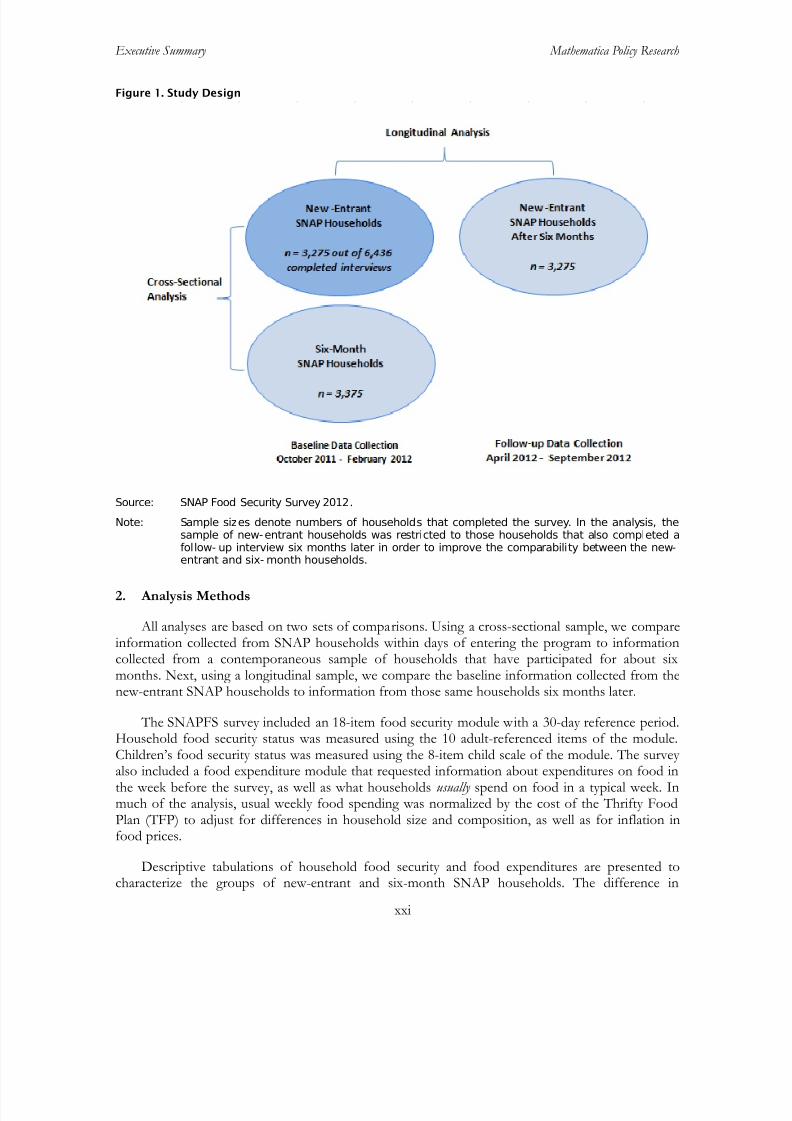
SNAPFS survey data were collected from October 2011 through September 2012 using computer-assisted telephone interviewing (CATI). As presented in Figure 1, data for the cross-sectional analysis come from 9,811 SNAP households interviewed in a nationally representativesample of 30 States from October 2011 through February 2012: 6,436 new-entrant households and3,375 households that had participated for about six months (“six-month” households). Data for thelongitudinal analysis come from the 3,275 households that were interviewed as new-entranthouseholds from October 2011 through February 2012 that were still participating in the programabout six months later. These households were interviewed between April and September 2012. The
analysis samples differed from the initial survey samples. The findings presented in this report arebased on analyses in which the sample of new-entrant households was restricted to those thatcontinued to participate six months later, at the time of the follow-up interview. This restrictionincreased the comparability of new-entrant and six-month households and helped decrease bias incomparing the food security (or food expenditures) of six-month and new-entrant households.
3 Edin, Kathryn, Melody Boyd, James Mabli, Jim Ohls, Julie Worthington, Sara Greene, Nicholas Redel, andSwetha Sridharan. “SNAP Food Security: In-Depth Interview Study Final Report.” Washington DC: Mathematica Policy Research, March 2013.
8/22/2019 USDA Report re SNAP & Food Security 08/2013
http://slidepdf.com/reader/full/usda-report-re-snap-food-security-082013 23/355
Executive Summary Mathematica Policy Research
xxi
Figure 1. Study Design
Source: SNAP Food Security Survey 2012.
Note: Sample sizes denote numbers of households that completed the survey. In the analysis, thesample of new-entrant households was restricted to those households that also completed a
follow- up interview six months later in order to improve the comparability between the new-entrant and six- month households.
2. Analysis Methods
All analyses are based on two sets of comparisons. Using a cross-sectional sample, we compareinformation collected from SNAP households within days of entering the program to informationcollected from a contemporaneous sample of households that have participated for about sixmonths. Next, using a longitudinal sample, we compare the baseline information collected from thenew-entrant SNAP households to information from those same households six months later.
The SNAPFS survey included an 18-item food security module with a 30-day reference period.
Household food security status was measured using the 10 adult-referenced items of the module.Children’s food security status was measured using the 8-item child scale of the module. The survey also included a food expenditure module that requested information about expenditures on food inthe week before the survey, as well as what households usually spend on food in a typical week. Inmuch of the analysis, usual weekly food spending was normalized by the cost of the Thrifty FoodPlan (TFP) to adjust for differences in household size and composition, as well as for inflation infood prices.
Descriptive tabulations of household food security and food expenditures are presented tocharacterize the groups of new-entrant and six-month SNAP households. The difference in
8/22/2019 USDA Report re SNAP & Food Security 08/2013
http://slidepdf.com/reader/full/usda-report-re-snap-food-security-082013 24/355
Executive Summary Mathematica Policy Research
xxii
prevalence of food insecurity among new-entrant and six-month households can be attributable todifferences in SNAP participation as well as differences in characteristics and circumstances of new-entrant and six-month households. For this reason, descriptively comparing the prevalence of foodinsecurity across the two groups does not measure the association between SNAP and food security. To estimate this association, multivariate regression analysis was used that accounted for observed
differences in demographic and household characteristics and economic circumstances.
4
C. What Did the Study Find?
All analysesused weights to account for the survey’s multistage sampling design and for nonresponse.
1. Food Security
a. The Prevalence of Food Insecurity and Very Low Food Security in Households and inHouseholds with Children
Simple, descriptive tabulations of the data on key outcome variables, with no adjustment forother household characteristics, show that six-month households were less likely than new-entrant
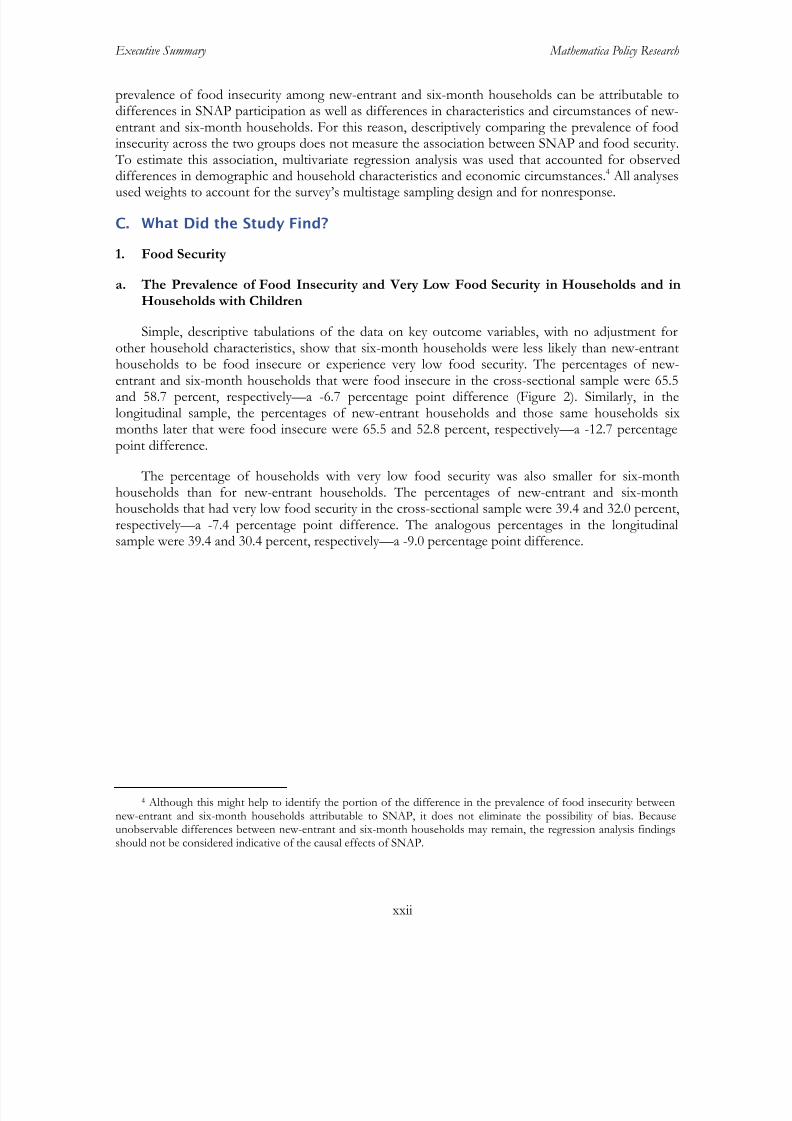
households to be food insecure or experience very low food security. The percentages of new-entrant and six-month households that were food insecure in the cross-sectional sample were 65.5and 58.7 percent, respectively—a -6.7 percentage point difference (Figure 2). Similarly, in thelongitudinal sample, the percentages of new-entrant households and those same households sixmonths later that were food insecure were 65.5 and 52.8 percent, respectively—a -12.7 percentagepoint difference.
The percentage of households with very low food security was also smaller for six-monthhouseholds than for new-entrant households. The percentages of new-entrant and six-monthhouseholds that had very low food security in the cross-sectional sample were 39.4 and 32.0 percent,respectively—a -7.4 percentage point difference. The analogous percentages in the longitudinalsample were 39.4 and 30.4 percent, respectively—a -9.0 percentage point difference.
4 Although this might help to identify the portion of the difference in the prevalence of food insecurity betweennew-entrant and six-month households attributable to SNAP, it does not eliminate the possibility of bias. Becauseunobservable differences between new-entrant and six-month households may remain, the regression analysis findingsshould not be considered indicative of the causal effects of SNAP.
8/22/2019 USDA Report re SNAP & Food Security 08/2013
http://slidepdf.com/reader/full/usda-report-re-snap-food-security-082013 25/355
Executive Summary Mathematica Policy Research
xxiii
Figure 2. Household Food Security Status in New- Entrant and Six- Month SNAP Householdsa
Source: SNAP Food Security Survey 2012.
Note: The cross- sectional estimates compare new SNAP participants to a contemporaneous set of participants who have been receiving SNAP for about six months. The longitudinal estimatescompare new SNAP participants to the same participants about six months later.
Cross- sectional estimates are based on a data set with 6,650 households (3,275 new- entrant
households and 3,375 six- month households). Longitudinal estimates are based on a data setwith 3,275 new- entrant households observed at baseline and again at follow- up six monthslater.
a Percentages of food insecurity and very low food security have not been adjusted for differences incharacteristics across households.
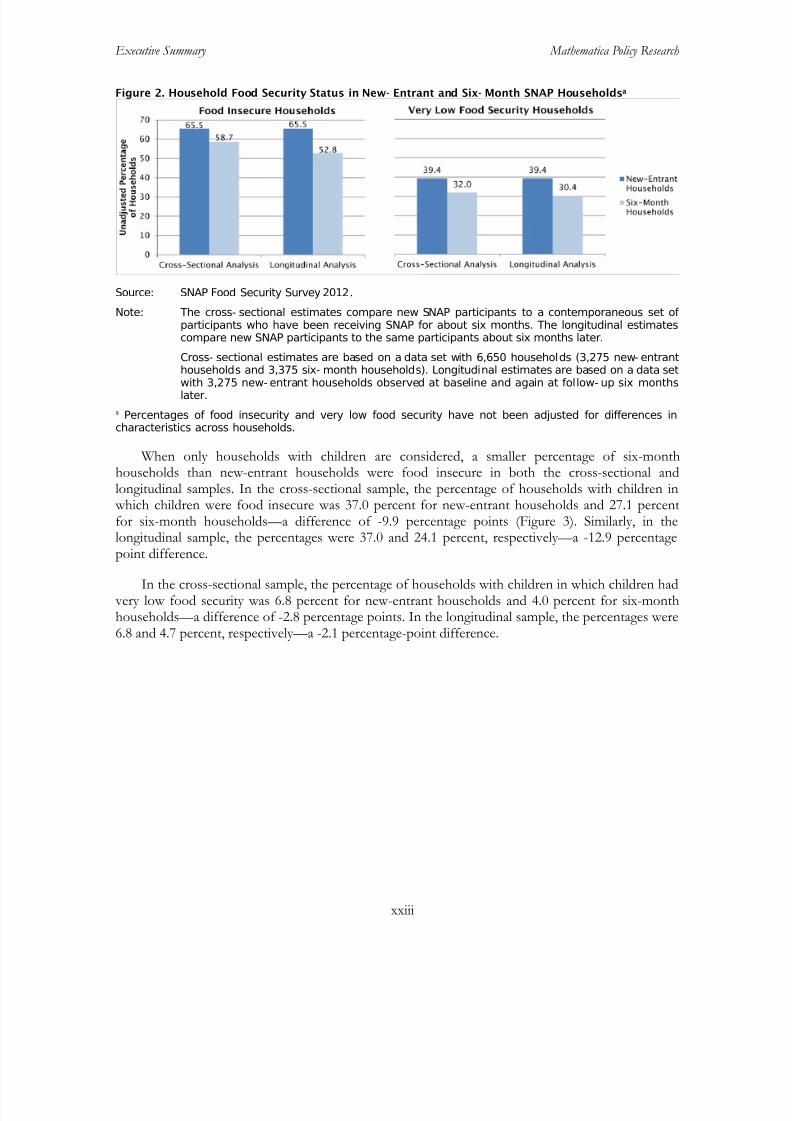
When only households with children are considered, a smaller percentage of six-monthhouseholds than new-entrant households were food insecure in both the cross-sectional andlongitudinal samples. In the cross-sectional sample, the percentage of households with children in which children were food insecure was 37.0 percent for new-entrant households and 27.1 percentfor six-month households—a difference of -9.9 percentage points (Figure 3). Similarly, in thelongitudinal sample, the percentages were 37.0 and 24.1 percent, respectively—a -12.9 percentage
point difference.
In the cross-sectional sample, the percentage of households with children in which children had very low food security was 6.8 percent for new-entrant households and 4.0 percent for six-monthhouseholds—a difference of -2.8 percentage points. In the longitudinal sample, the percentages were6.8 and 4.7 percent, respectively—a -2.1 percentage-point difference.

8/22/2019 USDA Report re SNAP & Food Security 08/2013
http://slidepdf.com/reader/full/usda-report-re-snap-food-security-082013 26/355
Executive Summary Mathematica Policy Research
xxiv
Figure 3. Children’s Food Security Status in New- Entrant and Six- Month SNAP Households withChildrena
Source: SNAP Food Security Survey 2012.
Note: The cross- sectional estimates compare new SNAP participants to a contemporaneous set of participants who have been receiving SNAP for about six months. The longitudinal estimates
compare new SNAP participants to the same participants about six months later.Cross- sectional estimates are based on a data set with 2,796 households with children (1,274new- entrant households and 1,522 six- month households). Longitudinal estimates are basedon a data set with 1,274 new- entrant households with children observed at baseline and1,295 households with children observed at follow- up six months later.
a Percentages of food insecurity and very low food security have not been adjusted for differences incharacteristics across households.
b. Associations Between SNAP and Household Food Security
While the descriptive tabulations of the prevalence of food insecurity in the previous sectionshow the total change in food security status due to SNAP participation as well as non-SNAP
changes in household characteristics and circumstances, regression analysis that accounts forobserved differences between new-entrant and six-month households was used to estimate thechange in food security status associated with SNAP participation only. We refer to these findings as“regression-adjusted” in the figures. Although the same set of new-entrant households are used inthe cross-sectional and longitudinal analyses, the regression-adjusted percentages of food insecurenew-entrant households differ across the two analyses because they are generated using modelparameters specific to the samples being examined.
Participating in SNAP for about six months was associated with a decrease in the percentage of households that were food insecure by 4.6 percentage points in the cross-sectional sample. Thereduction was from 65.4 percent of new-entrant households to 60.8 percent of six-month
households (Figure 4). In the longitudinal sample, SNAP was associated with a decrease in thepercentage of households that were food insecure by 10.6 percentage points, from 65.1 percent of new-entrant households to 54.5 percent of those same households six months later.

8/22/2019 USDA Report re SNAP & Food Security 08/2013
http://slidepdf.com/reader/full/usda-report-re-snap-food-security-082013 27/355
Executive Summary Mathematica Policy Research
xxv
Figure 4. Participating in SNAP for Six Months was Associated with a Decrease in the Percentage of Households That Were Food Insecure
Source: SNAP Food Security Survey 2012.
Note: Percentages were regression- adjusted for differences between new- entrant and six- monthhouseholds in demographic and economic characteristics, current and prior participation inFederal and State programs, and State economies and SNAP policies. Chapter II lists the fullset of variables.
The cross- sectional estimates compare new SNAP participants to a contemporaneous set of participants who have been receiving SNAP for about six months. The longitudinal estimatescompare new SNAP participants to the same participants about six months later.
Cross- sectional estimates are based on a data set with 6,650 households (3,275 new- entranthouseholds and 3,375 six- month households). Longitudinal estimates are based on a data setwith 3,275 new- entrant households observed at baseline and again at follow- up six monthslater.
*, **, *** Significantly different from zero at the 0.10, 0.05, and 0.01 level, respectively.
Participating in SNAP for about six months was also associated with a decrease in thepercentage of households that experienced particularly severe levels of food insecurity—designated“very low food security.” Participating in SNAP was associated with a decrease in the percentage of households that experienced very low food security of 5.0 percentage points in the cross-sectionalsample, from 36.4 percent of new-entrant households to 31.4 percent of six-month households, andof 6.3 percentage points in the longitudinal sample, from 35.9 to 29.6 percent (Figure 5).
65.4 65.160.8 ***
54.5 ***
0
10
20
30
40
50
60
70
80
Cross- Sectional Analysis Longitudinal Analysis
P e r c e n t a g e o f H o u s e
h o l d s
F o o d I n s e c u r e New- EntrantHouseholds
Six- MonthHouseholds

8/22/2019 USDA Report re SNAP & Food Security 08/2013
http://slidepdf.com/reader/full/usda-report-re-snap-food-security-082013 28/355
Executive Summary Mathematica Policy Research
xxvi
Figure 5. Participating in SNAP for Six Months was Associated with a Decrease in the Percentage of Households That had Very Low Food Security
Source: SNAP Food Security Survey 2012.
Note: Percentages were regression- adjusted for differences between new- entrant and six- monthhouseholds in demographic and economic characteristics, current and prior participation inFederal and State programs, and State economies and SNAP policies. Chapter II lists the fullset of variables.
The cross- sectional estimates compare new SNAP participants to a contemporaneous set of participants who have been receiving SNAP for about six months. The longitudinal estimatescompare new SNAP participants to the same participants about six months later.
Cross- sectional estimates are based on a data set with 6,650 households (3,275 new- entranthouseholds and 3,375 six- month households). Longitudinal estimates are based on a data setwith 3,275 new- entrant households observed at baseline and again at follow- up six monthslater.
*, **, *** Significantly different from zero at the 0.10, 0.05, and 0.01 level, respectively.
c. Associations Between SNAP and Children’s Food Security
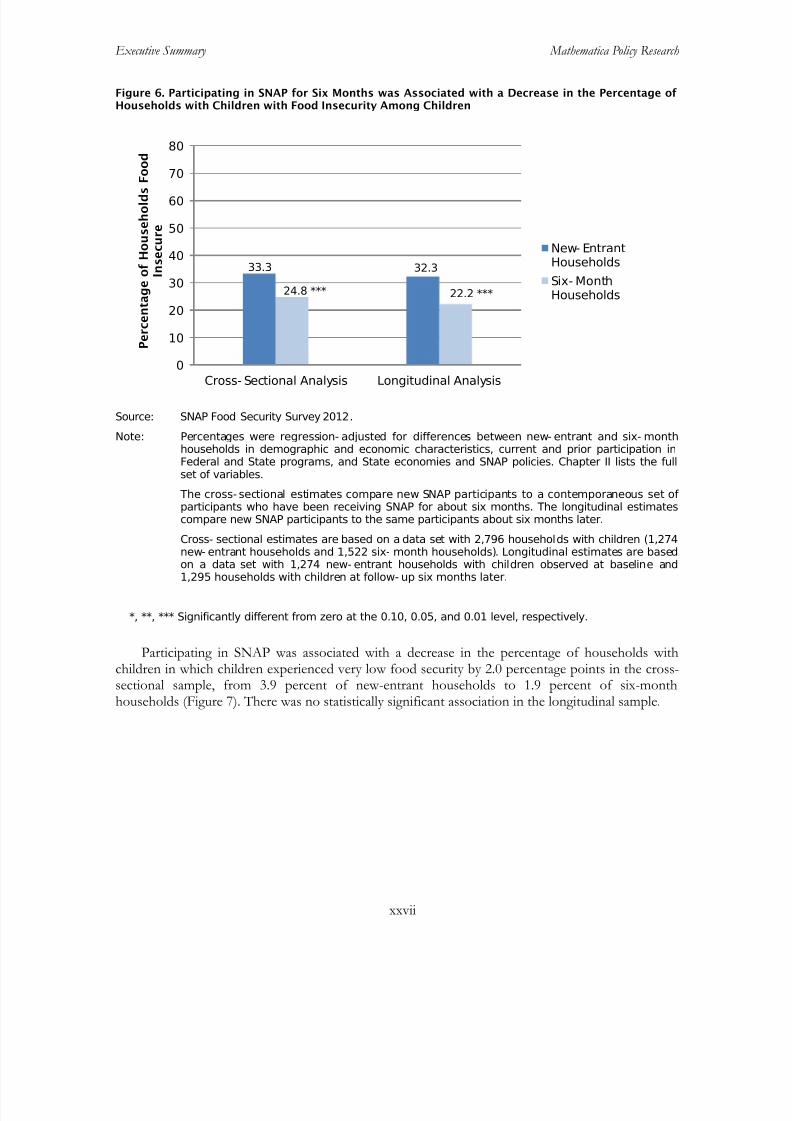
Participating in SNAP for about six months was associated with a decrease in the percentage of households with children in which children were food insecure by 8.6 percentage points in the cross-sectional sample, from 33.3 percent of new-entrant households to 24.8 percent of six-monthhouseholds (Figure 6). In the longitudinal sample, SNAP was associated with a decrease in the
percentage of households with children in which children were food insecure by 10.1 percentagepoints, from 32.3 percent of new-entrant households to 22.2 percent of those same households sixmonths later.
36.4 35.931.4 *** 29.6 ***
0
10
20
30
40
50
60
70
80
Cross- Sectional Analysis Longitudinal Analysis
P e r c e n t a g e o f H o u s e h o l d s
w i t h
V e r y L o w F
o o d S e c u r i t y
New- EntrantHouseholds
Six- MonthHouseholds
8/22/2019 USDA Report re SNAP & Food Security 08/2013
http://slidepdf.com/reader/full/usda-report-re-snap-food-security-082013 29/355
Executive Summary Mathematica Policy Research
xxvii
Figure 6. Participating in SNAP for Six Months was Associated with a Decrease in the Percentage of Households with Children with Food Insecurity Among Children
Source: SNAP Food Security Survey 2012.
Note: Percentages were regression- adjusted for differences between new- entrant and six- monthhouseholds in demographic and economic characteristics, current and prior participation inFederal and State programs, and State economies and SNAP policies. Chapter II lists the fullset of variables.
The cross- sectional estimates compare new SNAP participants to a contemporaneous set of participants who have been receiving SNAP for about six months. The longitudinal estimatescompare new SNAP participants to the same participants about six months later.
Cross- sectional estimates are based on a data set with 2,796 households with children (1,274
new- entrant households and 1,522 six- month households). Longitudinal estimates are basedon a data set with 1,274 new- entrant households with children observed at baseline and1,295 households with children at follow- up six months later.
*, **, *** Significantly different from zero at the 0.10, 0.05, and 0.01 level, respectively.
Participating in SNAP was associated with a decrease in the percentage of households withchildren in which children experienced very low food security by 2.0 percentage points in the cross-sectional sample, from 3.9 percent of new-entrant households to 1.9 percent of six-monthhouseholds (Figure 7). There was no statistically significant association in the longitudinal sample.
33.3 32.3
24.8 *** 22.2 ***
0
10
20
30
40
50
60
70
80
Cross- Sectional Analysis Longitudinal Analysis
P e r c e n t a g e o f H o u s e h o l d s F o o d
I n s e c u r e
New- EntrantHouseholds
Six- MonthHouseholds

8/22/2019 USDA Report re SNAP & Food Security 08/2013
http://slidepdf.com/reader/full/usda-report-re-snap-food-security-082013 30/355
Executive Summary Mathematica Policy Research
xxviii
Figure 7. The Evidence was Mixed as to Whether Participating in SNAP for Six Months wasAssociated with a Decrease in the Percentage of Households with Children with Very Low FoodSecurity Among Children
Source: SNAP Food Security Survey 2012.
Note: Percentages were regression- adjusted for differences between new- entrant and six- monthhouseholds in demographic and economic characteristics, current and prior participation inFederal and State programs, and State economies and SNAP policies. Chapter II lists the fullset of variables.
The cross- sectional estimates compare new SNAP participants to a contemporaneous set of participants who have been receiving SNAP for about six months. The longitudinal estimatescompare new SNAP participants to the same participants about six months later.
Cross- sectional estimates are based on a data set with 2,796 households with children (1,274
new- entrant households and 1,522 six- month households). Longitudinal estimates are basedon a data set with 1,274 new- entrant households with children observed at baseline and1,295 households with children at follow- up six months later.
*, **, *** Significantly different from zero at the 0.10, 0.05, and 0.01 level, respectively.
d. Associations Between SNAP and Household Food Security, by Subgroup
Estimates of the association between SNAP and household food security for the full survey sample might conceal important differences in associations across subgroups. If an association existsoverall, it might be heavily concentrated in, or much larger for, some subgroups. Conversely, if anassociation does not exist for the entire survey sample of households, it might still exist for somesubgroups. Estimates of associations for subgroups can help policymakers identify the householdsfor which the program might be most effective and better target the program or tailor its services. Inthis report, we focus on subgroups defined by household composition, household income, andSNAP benefit amount.5
5 Due to statistical considerations the subgroup analyses should be regarded as exploratory, and the results should
be interpreted as suggestive of potential associations between SNAP participation and food security.
3.9 3.41.9 ** 2.8
0
10
20
30
40
50
60
70
80
Cross- Sectional Analysis Longitudinal Analysis
P e r c e n t a g e o f H o u s e h o l d s w
i t h
V e r y L o w F
o o d S e c u r i t y
New- EntrantHouseholds
Six- MonthHouseholds
8/22/2019 USDA Report re SNAP & Food Security 08/2013
http://slidepdf.com/reader/full/usda-report-re-snap-food-security-082013 31/355
Executive Summary Mathematica Policy Research
xxix
We assessed whether SNAP was associated with improved food security for each subgroup. The following summarize these findings:
• Household composition. SNAP was associated with an improvement in food security for most household composition subgroups, including households with and without
children, households without an elderly member, and households with and without adisabled member. There were generally no associations for households with an elderly member.
• Household income. SNAP was associated with an improvement in food security formost household income subgroups in the longitudinal sample, but only for somehouseholds with income below 100 percent of poverty in the cross-sectional sample.
• SNAP benefit amount. SNAP was associated with an improvement in food security for most subgroups defined by SNAP benefit amount (as a percentage of the maximumbenefit). There were no associations for the lowest benefit amount subgroup in thecross-sectional sample.
The above discussion summarized which associations were statistically significant for eachhousehold subgroup. Next, we examine whether the differences across subgroups in the sizes of theestimated associations are statistically significant. We summarize these findings here:
• Household composition. Although the association between SNAP and food security were generally similar for households with and without children as well as forhouseholds with and without a disabled member, there were significant differencesbetween households with and without an elderly member.
• Household income. The association between SNAP and food security was similar forhouseholds with different levels of income as a percentage of the Federal poverty line.
• SNAP benefit amount. The association between SNAP and food security differed ingeneral according to the amount of SNAP benefits households received. In both thecross-sectional and longitudinal samples, SNAP was associated with a larger decrease in very low food security for households with large SNAP benefits (exceeding about 80percent of the maximum benefit for household size). In the cross-sectional sample,SNAP was associated with a larger decrease in food insecurity for households withlarger SNAP benefits.
e. Summary of the Analysis of Food Security
The study found that participating in SNAP for about six months was associated with an
improvement in food security. SNAP was associated with a decrease in both the percentage of households that were food insecure and the percentage of households that experienced very low food security. This generally holds for child food security as well.
We also assessed whether SNAP was associated with improved food security for householddemographic and economic subgroups. For the most part, the results are consistent with thefindings for the full sample. SNAP was associated with an improvement in food security for mosthousehold composition subgroups, including households with and without children, households without an elderly member, and households with and without a disabled member. When subgroupsdefined by income relative to poverty are examined, the estimated associations between SNAP and
8/22/2019 USDA Report re SNAP & Food Security 08/2013
http://slidepdf.com/reader/full/usda-report-re-snap-food-security-082013 32/355
Executive Summary Mathematica Policy Research
xxx
food security vary. Although most reflect improvements in food security, many of the estimatedassociations are not statistically significant. For SNAP benefit amount subgroups, the estimatedassociations show significant improvements in food security in the longitudinal sample, but few significant improvements in the cross-sectional sample.
2. Food Spending
The SNAPFS survey asked respondents what they spent on food in the prior week and thenasked what they usually spent on food in a typical week. Past data on usual expenditures collectedusing this module have been shown to be consistent with estimates from the Consumer ExpenditureSurvey, the principal source of data on U.S. household expenditures for goods and services (Nord2009). Therefore, we focused on usual weekly food expenditures, rather than expenditures theprevious week, as our main outcome measure.
a. Descriptive Tabulations of Household Food Spending
Simple, descriptive tabulations of the data on household spending variables, with no adjustment
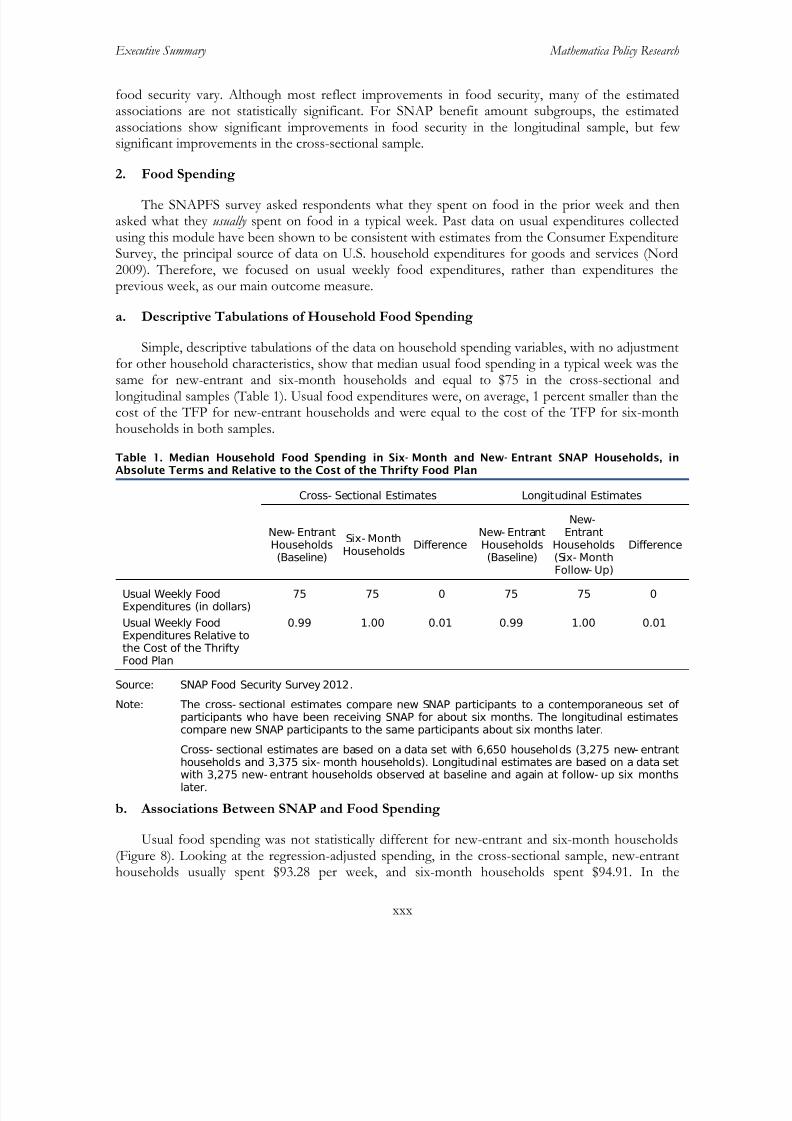
for other household characteristics, show that median usual food spending in a typical week was thesame for new-entrant and six-month households and equal to $75 in the cross-sectional andlongitudinal samples (Table 1). Usual food expenditures were, on average, 1 percent smaller than thecost of the TFP for new-entrant households and were equal to the cost of the TFP for six-monthhouseholds in both samples.
Table 1. Median Household Food Spending in Six- Month and New- Entrant SNAP Households, inAbsolute Terms and Relative to the Cost of the Thrifty Food Plan
Cross- Sectional Estimates Longitudinal Estimates
New- EntrantHouseholds(Baseline)
Six- Month
HouseholdsDifference
New- EntrantHouseholds(Baseline)
New-Entrant
Households(Six- MonthFollow- Up)
Difference
Usual Weekly FoodExpenditures (in dollars)
75 75 0 75 75 0
Usual Weekly FoodExpenditures Relative tothe Cost of the ThriftyFood Plan
0.99 1.00 0.01 0.99 1.00 0.01
Source: SNAP Food Security Survey 2012.
Note: The cross- sectional estimates compare new SNAP participants to a contemporaneous set of participants who have been receiving SNAP for about six months. The longitudinal estimates
compare new SNAP participants to the same participants about six months later.Cross- sectional estimates are based on a data set with 6,650 households (3,275 new- entranthouseholds and 3,375 six- month households). Longitudinal estimates are based on a data setwith 3,275 new- entrant households observed at baseline and again at follow- up six monthslater.
b. Associations Between SNAP and Food Spending
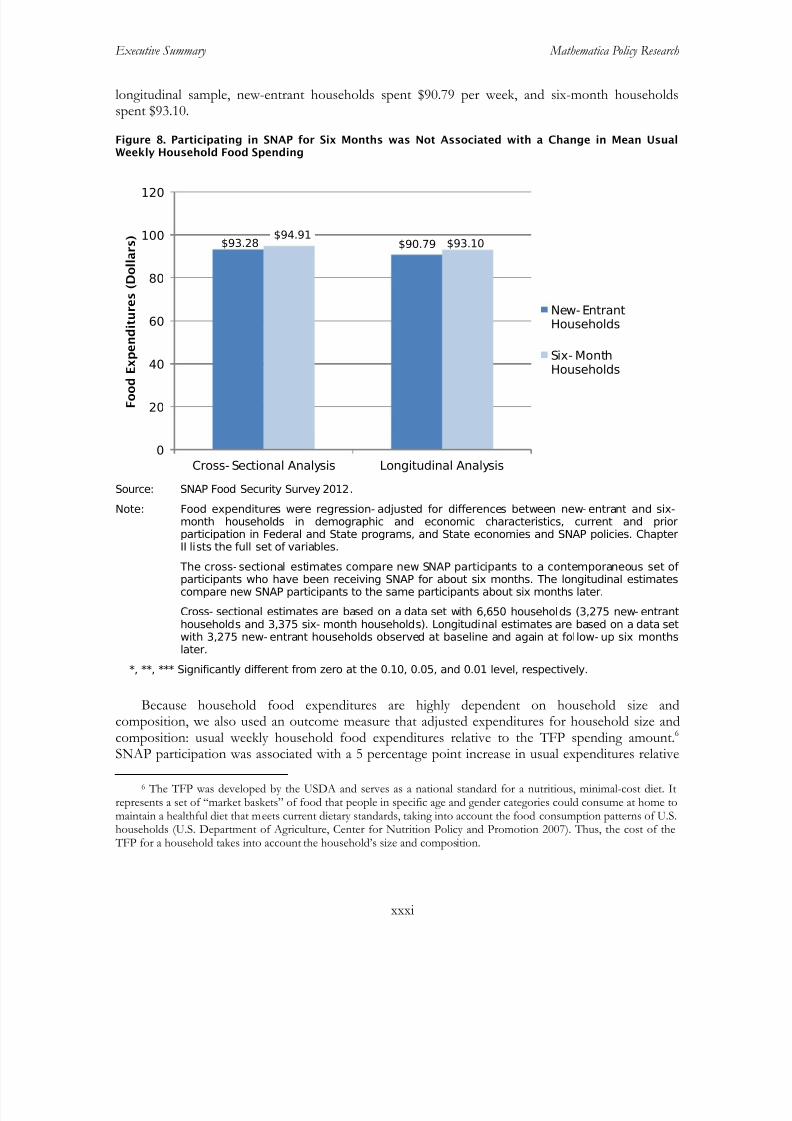
Usual food spending was not statistically different for new-entrant and six-month households(Figure 8). Looking at the regression-adjusted spending, in the cross-sectional sample, new-entranthouseholds usually spent $93.28 per week, and six-month households spent $94.91. In the
8/22/2019 USDA Report re SNAP & Food Security 08/2013
http://slidepdf.com/reader/full/usda-report-re-snap-food-security-082013 33/355
Executive Summary Mathematica Policy Research
xxxi
longitudinal sample, new-entrant households spent $90.79 per week, and six-month householdsspent $93.10.
Figure 8. Participating in SNAP for Six Months was Not Associated with a Change in Mean UsualWeekly Household Food Spending
Source: SNAP Food Security Survey 2012.
Note: Food expenditures were regression- adjusted for differences between new- entrant and six-month households in demographic and economic characteristics, current and priorparticipation in Federal and State programs, and State economies and SNAP policies. Chapter
II lists the full set of variables. The cross- sectional estimates compare new SNAP participants to a contemporaneous set of participants who have been receiving SNAP for about six months. The longitudinal estimatescompare new SNAP participants to the same participants about six months later.
Cross- sectional estimates are based on a data set with 6,650 households (3,275 new- entranthouseholds and 3,375 six- month households). Longitudinal estimates are based on a data setwith 3,275 new- entrant households observed at baseline and again at follow- up six monthslater.
*, **, *** Significantly different from zero at the 0.10, 0.05, and 0.01 level, respectively.
Because household food expenditures are highly dependent on household size andcomposition, we also used an outcome measure that adjusted expenditures for household size and
composition: usual weekly household food expenditures relative to the TFP spending amount.6
6 The TFP was developed by the USDA and serves as a national standard for a nutritious, minimal-cost diet. It
represents a set of “market baskets” of food that people in specific age and gender categories could consume at home tomaintain a healthful diet that meets current dietary standards, taking into account the food consumption patterns of U.S.households (U.S. Department of Agriculture, Center for Nutrition Policy and Promotion 2007). Thus, the cost of the TFP for a household takes into account the household’s size and composition.
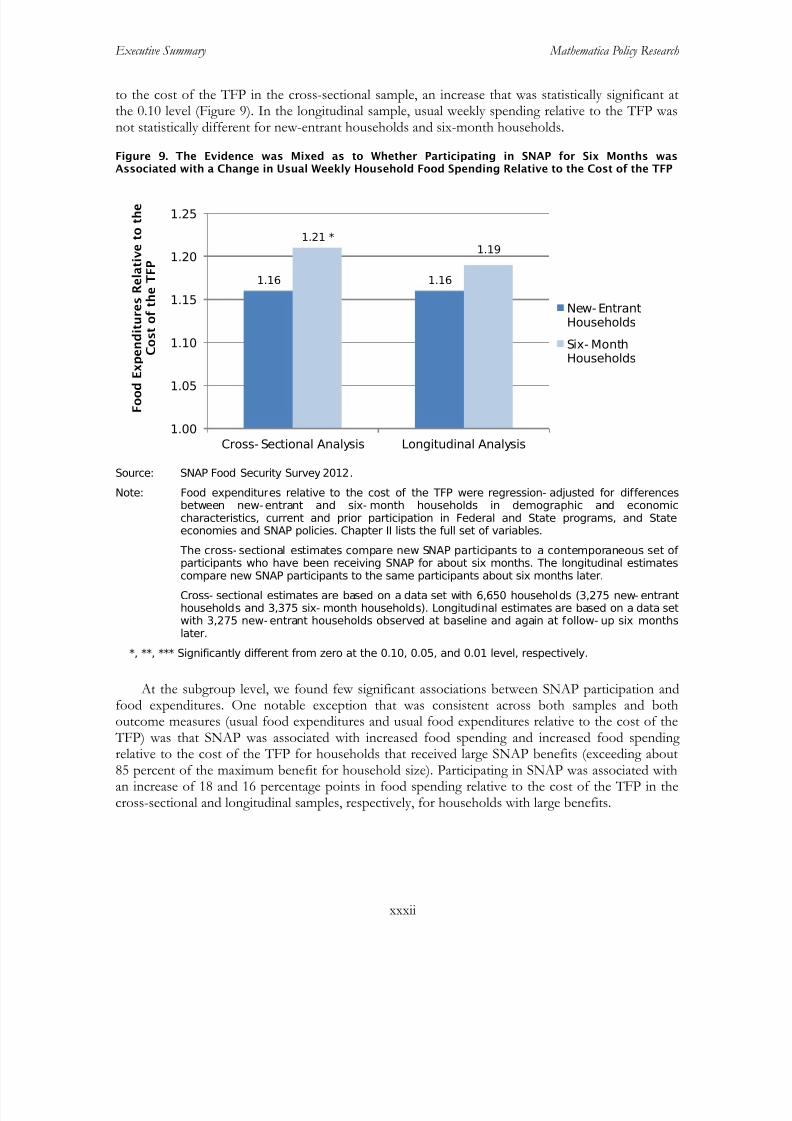
SNAP participation was associated with a 5 percentage point increase in usual expenditures relative
$93.28 $90.79$94.91
$93.10
0
20
40
60
80
100
120
Cross- Sectional Analysis Longitudinal Analysis
F o o d E x p e n d i t u r e s ( D o l l a r s )
New- EntrantHouseholds
Six- Month
Households
8/22/2019 USDA Report re SNAP & Food Security 08/2013
http://slidepdf.com/reader/full/usda-report-re-snap-food-security-082013 34/355
Executive Summary Mathematica Policy Research
xxxii
to the cost of the TFP in the cross-sectional sample, an increase that was statistically significant atthe 0.10 level (Figure 9). In the longitudinal sample, usual weekly spending relative to the TFP wasnot statistically different for new-entrant households and six-month households.
Figure 9. The Evidence was Mixed as to Whether Participating in SNAP for Six Months wasAssociated with a Change in Usual Weekly Household Food Spending Relative to the Cost of the TFP
Source: SNAP Food Security Survey 2012.
Note: Food expenditures relative to the cost of the TFP were regression- adjusted for differencesbetween new-entrant and six- month households in demographic and economiccharacteristics, current and prior participation in Federal and State programs, and Stateeconomies and SNAP policies. Chapter II lists the full set of variables.
The cross- sectional estimates compare new SNAP participants to a contemporaneous set of participants who have been receiving SNAP for about six months. The longitudinal estimatescompare new SNAP participants to the same participants about six months later.
Cross- sectional estimates are based on a data set with 6,650 households (3,275 new- entranthouseholds and 3,375 six- month households). Longitudinal estimates are based on a data setwith 3,275 new- entrant households observed at baseline and again at follow- up six monthslater.
*, **, *** Significantly different from zero at the 0.10, 0.05, and 0.01 level, respectively.
At the subgroup level, we found few significant associations between SNAP participation andfood expenditures. One notable exception that was consistent across both samples and bothoutcome measures (usual food expenditures and usual food expenditures relative to the cost of the
TFP) was that SNAP was associated with increased food spending and increased food spending relative to the cost of the TFP for households that received large SNAP benefits (exceeding about85 percent of the maximum benefit for household size). Participating in SNAP was associated withan increase of 18 and 16 percentage points in food spending relative to the cost of the TFP in thecross-sectional and longitudinal samples, respectively, for households with large benefits.
1.16 1.16
1.21 *1.19
1.00
1.05
1.10
1.15
1.20
1.25
Cross- Sectional Analysis Longitudinal Analysis
F o o d E x
p e n d i t u r e s R e l a t i v e t o t h e
C o s t o f t h e T F P
New- EntrantHouseholds
Six- MonthHouseholds

8/22/2019 USDA Report re SNAP & Food Security 08/2013
http://slidepdf.com/reader/full/usda-report-re-snap-food-security-082013 35/355
Executive Summary Mathematica Policy Research
xxxiii
c. Diagnostic Statistical Tests and Potential Limitations of the Baseline ExpendituresData
The limited evidence of a statistically significant association between SNAP and foodexpenditures was surprising, as economic theory suggests that, if a household is provided a benefitto be spent on food, then total expenditures on food will increase. To assess the robustness of ourfindings to alternative estimation methods, we conducted several auxiliary analyses. The results fromthese analyses were generally consistent with those presented above, providing limited evidence of asignificant association between SNAP participation and food expenditures (see Appendix G fordetails).
A potential explanation for the lack of a strong association between SNAP participation andfood expenditures may be the timing of the data collection. For logistical reasons, the baselineinterviews for most survey respondents (84 percent) were conducted several days after householdsreceived their initial SNAP benefits. While this does not appear to have had a substantial effect onthe food security data, which were collected for the 30 days prior to the interview, the timing may have influenced reported expenditures for new-entrant households, which were to report
expenditures from the seven days prior to the interview, as well as expenditures in a “typical” week.Because of the strong evidence in the literature that most recipients spend the bulk of their benefitsshortly after receiving them, it seems likely that many new-entrant households included food bought with benefits when reporting their expenditures in the previous week. The implication is that foodexpenditures would not change substantially between the two reporting periods because bothreports included food bought with benefits. It is important to note that even for households thatspent a substantial fraction of the first month’s SNAP benefit, we do not have direct evidence thatthey have revised their notion of usual monthly food expenditures.
d. An Alternative Approach to Measuring Associations Between Benefits and FoodExpenditures With the Survey Data
Because of the concerns about the data for new-entrant households, we drew on a differentapproach to analyze food expenditures. Specifically, we used the six-month household survey datafrom both the cross-sectional and longitudinal samples to examine associations between the amountof SNAP benefits and reported usual expenditures. While this does not allow us to exploit the quasi-experimental design of the study, it does allow us to assess the association between SNAP benefitamounts and reported usual food expenditures for ongoing SNAP cases. This approach reveals whether higher SNAP benefits are associated with higher food expenditures.
Drawing on techniques used extensively in the literature (Fraker 1990; Fox et al. 2004;Boonsaeng et al. 2012), we found that a one-dollar increase in SNAP benefits was associated with a34- to 48-cent increase in usual food expenditures among six-month households—estimates that are
in or around the range in Fraker (1990) of 17 to 47 cents and the range in Fox et al. (2004) of 26 to40 cents. The findings are statistically significant both in absolute dollars and after normalizing theoutcome measure by household size and composition using the cost of the TFP.
e. Summary of the Analysis of Food Spending
Under most statistical specifications in the original research design, there was no significantassociation between participating in SNAP and the amount of money spent on food in a typical week when examining the full sample of households. Although we obtained some statistically
8/22/2019 USDA Report re SNAP & Food Security 08/2013
http://slidepdf.com/reader/full/usda-report-re-snap-food-security-082013 36/355
Executive Summary Mathematica Policy Research
xxxiv
significant findings (for example, in our main model specification in the cross-sectional sample),these findings were not robust to changes in model specification and sample definitions.
There were few significant associations between SNAP participation and food expenditures atthe subgroup level. An exception was that participating in SNAP was associated with an increase infood spending and food spending relative to the cost of the TFP for households with large benefits(exceeding about 85 percent of the maximum benefit for household size) in both the cross-sectionaland longitudinal samples.
Further analysis of the timing of the baseline data collection suggested that having anunavoidably high fraction of the interviews take place after new-entrant households had already been receiving benefits might have affected the main findings in the food expenditure analysis if households very quickly adjust their notion of “usual” spending after receiving their initial SNAPbenefit. Excluding new-entrant households from the analysis in both the cross-sectional andlongitudinal samples, we found a positive association between the SNAP benefit amount and foodspending among households that had been on SNAP for six months.
8/22/2019 USDA Report re SNAP & Food Security 08/2013
http://slidepdf.com/reader/full/usda-report-re-snap-food-security-082013 37/355
Measuring the Effect of SNAP Participation on Food Security Mathematica Policy Research
1
I. INTRODUCTION
The Supplemental Nutrition Assistance Program (SNAP) provides nutrition assistance benefitsto low-income individuals and families in an effort to reduce hunger and improve the health and well-being of low-income people nationwide. Although SNAP has long been one of the largest andmost important nutrition assistance programs for low-income households, its significance has growneven larger in recent years as it experienced record-high levels of participation. In Fiscal Year 2012,the program provided benefits to more than 46 million Americans on average per month. 7
The Food and Nutrition Service (FNS) of the United States Department of Agriculture(USDA), which administers SNAP, targets benefits to the neediest households; poorer householdsreceive greater SNAP benefits than households with more income. To counter rising food pricesand provide SNAP participants with enough resources to purchase food, the American Recovery and Reinvestment Act (ARRA), enacted in February 2009, raised the maximum SNAP benefit by 13.6 percent, effective April 2009. Because the benefit amount for all households is determined by reducing the maximum benefit according to each household’s income net of certain housing,medical, work, and child care expenses, the benefit allotment for households not receiving the
maximum also increased under ARRA. On average, household benefits increased by approximately $41 under ARRA (Leftin et al 2010). In fiscal year 2011, the average household benefit was $281.
Policymakers, advocates, and those administering SNAP have long hypothesized that SNAPreduces food insecurity, which is a measure of whether a household experiences food accesslimitations due to lack of money or other resources. Estimating the effect of SNAP on foodinsecurity using household survey data has been challenging, however, because of differencesbetween households that participate in SNAP and households that do not—often referred to asselection bias. For example, if more food-needy households are more likely to enroll in SNAP andfood insecurity is more prevalent among food-needy households, then initial food insecurity differences between participants and nonparticipants may countervail the ameliorative effects of the
program (Nord and Golla 2009). Most research studies, using a variety of data and empiricalmethods, have attempted to isolate SNAP’s effect on food insecurity from the differences betweenparticipants and nonparticipants, but the evidence supporting the hypothesis has been mixed. 8
Mathematica Policy Research conducted the SNAP Food Security (SNAPFS) survey for FNSbetween October 2011 and September 2012, to assess the effect of SNAP participation on foodsecurity and food spending in the post-ARRA environment of higher SNAP allotments. TheSNAPFS survey was the largest survey of food security and food spending among SNAPparticipants to date, with 9,811 households interviewed in 30 States. This report presents theevaluation findings, which are based on a quasi-experimental design intended to minimize selectionbias by comparing information collected from SNAP households within days of entering theprogram and after about six months of participating to implicitly control for factors unrelated to
SNAP.
7 Data were obtained from http://www.fns.usda.gov/pd/SNAPsummary.htm.
8 Recent reviews of the literature of the effects of SNAP on food security can be found in Nord and Golla (2009);Ratcliffe and McKernan (2011); Wilde (2007); and Fox et al. (2004).

8/22/2019 USDA Report re SNAP & Food Security 08/2013
http://slidepdf.com/reader/full/usda-report-re-snap-food-security-082013 38/355
Measuring the Effect of SNAP Participation on Food Security Mathematica Policy Research
2
A. Research Objectives and Analytic Approach
The main objectives of this study were to:
• Assess how household food security and food expenditures vary with SNAPparticipation
• Examine how the relationships between SNAP and food security and between SNAPand food expenditures vary by key household characteristics and circumstances
• Examine in more depth what factors distinguish between food secure and food insecureSNAP households with children
To address the first and second research objectives, we use SNAPFS survey data and two basiccomparisons to infer how household food security status and food expenditures vary with SNAPparticipation. First, using data from October 2011 to February 2012, we compare the food security status (and food spending) of a sample of new SNAP participant households to that of acontemporaneous sample of participant households that have received SNAP for about six months.
We refer to this as a cross-sectional analysis. Next, we compare the food security status (and foodspending) of the sample of new SNAP participant households selected from October 2011 toFebruary 2012 to that of the same households after they have received benefits for about sixmonths, from April to September 2012. We refer to this as a longitudinal analysis.9
We addressed the third research objective in a separate component of this study, in which weconducted in-depth qualitative interviews with 90 SNAP households containing children whoparticipated in the SNAPFS survey. The interviews probed more deeply into households’
experiences managing their finances, as well as into how SNAP benefits fit into their overallresource and food management. The purpose of this formative, qualitative study was to provideinsights into the challenges low-income families face and their coping strategies to purchase all thefood they need with limited resources, and to inform the direction of future research on foodsecurity, including hypothesis generation and instrument design. The findings from the in-depthinterview component of the study are covered in a separate report.
We estimated theassociations between SNAP and food security and between SNAP and food expenditures using multivariate regression models and other econometric models. The details of the analysis aredescribed in more detail in Chapter II and Appendix A.
10
B. Layout of the Report
In the rest of this report, we discuss the methodology used in the analysis and present findings.Chapter II provides an overview of the study design and the data and methodology used in the
9 The sample of new-entrant households used in both analyses was considerably smaller than the initial survey samples. As discussed in Chapter II, the findings presented in this report are based on analyses in which the sample of new-entrant households was restricted to those that continued to participate six months later, at the time of the follow-up interview. This restriction increased the comparability of new-entrant and six-month households and helped decreasebias in comparing the food security (or food expenditures) of six-month and new-entrant households.
10 See Edin, Kathryn, Melody Boyd, James Mabli, Jim Ohls, Julie Worthington, Sara Greene, Nicholas Redel, andSwetha Sridharan. “SNAP Food Security: In-Depth Interview Study Final Report.” Washington DC: Mathematica Policy Research, March 2013.
8/22/2019 USDA Report re SNAP & Food Security 08/2013
http://slidepdf.com/reader/full/usda-report-re-snap-food-security-082013 39/355
Measuring the Effect of SNAP Participation on Food Security Mathematica Policy Research
3
analysis. In Chapter III, we describe the food security status and food spending, as well as thecharacteristics and circumstances, of samples of new-entrant and six-month households. ChaptersIV and V present the estimates of the associations between SNAP and food security and betweenSNAP and food expenditures, respectively. Finally, we conclude in Chapter VI by discussing implications for future research.
The appendices of the report provide supporting and additional tables. Appendix Asupplements Chapter II with a more detailed discussion of the study design and analysismethodology. Appendix B presents an expanded set of characteristics and circumstances of new-entrant and six-month SNAP households from Chapter III. Appendices C, D, and E containdetailed regression findings and sensitivity and subgroup analyses related to food security, and Appendices F and G contain detailed regression findings and sensitivity analyses related to foodspending. Appendix H contains sample sizes for subgroups. Appendix I compares the characteristicsof new-entrant households that had a follow-up interview with households that did not have afollow-up interview. Finally, Appendix J contains the SNAPFS survey instruments.

8/22/2019 USDA Report re SNAP & Food Security 08/2013
http://slidepdf.com/reader/full/usda-report-re-snap-food-security-082013 40/355
This page has been left blank for double-sided copying.
8/22/2019 USDA Report re SNAP & Food Security 08/2013
http://slidepdf.com/reader/full/usda-report-re-snap-food-security-082013 41/355
Measuring the Effect of SNAP Participation on Food Security Mathematica Policy Research
5
II. DATA AND METHODOLOGY
This chapter describes the study design and data collection methodology underlying theSNAPFS survey. It also describes the outcome measures, analysis methods used to estimate theeffect of SNAP on food security and food expenditures, and construction of survey weights.
A. Study Design
This study compares the food security levels of households that have applied for and beenaccepted into SNAP, but that are not yet receiving SNAP benefits, to the food security levels of households that have been receiving benefits for several (six to seven) months. This raises the issueof “self-selection”: the possibility that members of the two groups being compared may differ incharacteristics (such as underlying need) other than the defining characteristic—in this case, SNAPbenefit receipt. For example, if households that have been receiving benefits for six months aredifferent from a comparison group that has just entered the program in some unobserved aspectthat caused them to remain on the program for six months, the six-month group could possibly have lower food security, making it appear that SNAP decreased food security. This is not just a
theoretical possibility. Nord and Golla (2009), in their recent Economic Research Service (ERS)study using nationally representative Current Population Survey (CPS) data, present persuasiveevidence that this actually occurs.
The ideal solution to dealing with the possibility of selection bias is to conduct a “true”experiment, in which a set of households are randomly assigned to SNAP versus non-SNAP status.However, such experimentation is usually impossible in SNAP, which is an entitlement program.Both legal and ethical issues constrain the amount of experimentation that can be done, as discussedat length in Burstein et al. (2005) and Fox et al. (2004).
The study’s two research designs seek to solve this problem by replacing a randomized controlgroup with a set of carefully constructed comparison groups and using econometric techniques andanalytic controls to account for differences between households that have participated for six toseven months and households that have just entered the program (Figure II.1).11
11 Randomized designs that assign households to treatment versus control status represent the gold standard in
research methods, because they best enable researchers to make causal inferences about policy effects. However,extensive studies by FNS and private researchers have concluded that the possibilities for randomized experimentationof the impact of SNAP are highly limited because of the size of the program and its role in providing entitlementassistance (Fox et al. 2004). The current study was designed using a carefully developed nonrandom design that seeks tocontrol for observable differences between SNAP new entrants and ongoing participants in order to minimize selection
bias. However, there remain some risks that observed associations of variables could be due to differences acrosshouseholds that are not observable. For this reason, we refer to the relationships between SNAP and food security asassociations, rather than causal effects. The discussions in Appendices D and G describe the extensive steps taken toaddress selection bias. While multivariate modeling helps to minimize bias, it does not eliminate it altogether, due to theinability to account for unobservable factors that affect both SNAP participation and food security. These steps includeexamining multiple dependent variables, using an extensive data set to control for variables associated with both SNAPparticipation and food security or food expenditures, and using multiple statistical specifications to test the robustness of our findings. While multivariate modeling helps to minimize bias, it does not eliminate it altogether, due to the inability to account for unobservable factors that affect both SNAP participation and food security.
The first is a cross-sectional comparison group design that compares an outcome measure at a single point in timeacross a group of participants who have just entered SNAP (group 1) and a group of participants

8/22/2019 USDA Report re SNAP & Food Security 08/2013
http://slidepdf.com/reader/full/usda-report-re-snap-food-security-082013 42/355
Measuring the Effect of SNAP Participation on Food Security Mathematica Policy Research
6
who have participated in SNAP for the previous six to seven months (group 2). The second is alongitudinal comparison group design that compares an outcome measure over time for a set of participants who have just entered SNAP (group 1) and the same set of participants six to sevenmonths later (group 3).
Figure II.1. Study Design
Source: SNAP Food Security Survey 2012.
Note: Sample sizes denote numbers of households that completed the survey. In the analysis, thesample of new-entrant households was restricted to those households that also completed afollow- up interview six months later in order to improve the comparability between the new-entrant and six- month households.
By following the same group of households over time, the longitudinal design minimizes thebias associated with self-selection that exists when comparing different households at a point in time(as in the cross-sectional design). However, by evaluating the outcome measure at different points intime, the impact estimate produced in the longitudinal design may be measuring the combined effectof the true program impact and any external factors that changed over time, such as changes inhousehold characteristics or circumstances unrelated to SNAP, or shifts in the economy or the foodpurchase environment. This confounding is largely avoided in the cross-sectional design, because theoutcome measures are evaluated at a single point in time. However, the cross-sectional design isunable to control for unobserved differences between new-entrant and six-month households thatmight be correlated with the outcomes of interest. Thus, each design has both a distinct strength anda distinct weakness relative to the other. By using a set of econometric models to adjust forobservable and (to the extent possible) unobservable differences between groups and changes inexternal factors over the longitudinal survey period, we seek to address the weaknesses inherent in
8/22/2019 USDA Report re SNAP & Food Security 08/2013
http://slidepdf.com/reader/full/usda-report-re-snap-food-security-082013 43/355
Measuring the Effect of SNAP Participation on Food Security Mathematica Policy Research
7
each design to obtain the most definitive estimates of the impact of SNAP participation onhousehold food security, although biases may remain.
B. Data Collection and Response Rates
We drew the sample of SNAP participants in a two-stage process. First, we drew a sample of 30States, using probability-proportional-to-size (PPS) sampling.12
SNAPFS survey data were collected from October 2011 through September 2012 using computer-assisted telephone interviewing (CATI). Data available for the cross-sectional analysiscome from 9,811 SNAP households interviewed from October 2011 through February 2012: 6,436new-entrant households and 3,375 households that had participated for about six months (“six-month” households). Data available for the longitudinal analysis come from the 3,275 households
that were interviewed as new-entrant households from October 2011 through February 2012 that were still participating in the program and were interviewed about six months later. Thesehouseholds were interviewed between April and September 2012. As discussed later in this chapter, we restricted the samples of new-entrant households in the analysis to those that were still on theprogram six months later in order to increase comparability between new-entrant and six-monthhouseholds. That is, households that continue to participate in SNAP through six months havedifferent characteristics and circumstances than households that leave the program before this time.For example, households without any children, elderly, or disabled members generally stay on SNAPfor the shortest time (many of these individuals are subject to time limits on their SNAPparticipation), whereas elderly-only households and households without earnings generally havelonger participation spells (Mabli et al. 2011). The greater degree of similarity between the new-
entrant and six-month samples obtained by restricting the new-entrant sample in the analysis tothose still on SNAP six months later helps to reduce the chance that the association between SNAPand food security reflects some other factor related to both staying on SNAP and a household’sfood security status. As presented in Appendices D and G, the report’s main findings were robust tousing the unrestricted sample.
We selected States from the 48contiguous States and the District of Columbia and used the number of SNAP households in eachState as the measure of size. Second, we drew samples of participant households from caseload filesprovided by participating States. Appendix A contains additional details about the sampling methodology.
Both surveys were organized and directed by Mathematica. All interviews were completed by CATI using trained interview staff. Households were given a $2 upfront cash incentive (included inthe advance letter) and were offered the incentive of a $20 gift card to a local store for completing the telephone interview.
To best measure the prevalence and characteristics of food insecure households as they first
entered the program, new SNAP households had to be interviewed as soon as possible after SNAPcertification but before the household had adjusted its food purchasing and consumption behaviorbased on its SNAP allotments. Appendix A describes the steps we took to minimize the timebetween first receipt of benefits and completed interview for new-entrant households. The length of
12 We also selected 5 replacement states for a back-up sample to use if some of the originally selected statesultimately chose not to participate. In the end, the sample included 4 replacement states.
8/22/2019 USDA Report re SNAP & Food Security 08/2013
http://slidepdf.com/reader/full/usda-report-re-snap-food-security-082013 44/355
Measuring the Effect of SNAP Participation on Food Security Mathematica Policy Research
8
the baseline field period for each household was approximately two weeks for new-entranthouseholds and four weeks for six-month households. The start date for each State’s field period was staggered, making the interview period for the full set of baseline interviews last from October2011 to February 2012 and the follow-up interviews with new-entrant households six months laterlast from April to September 2012. The length of the field period for follow-up interviews with new-
entrant households six months later was about six weeks. Appendix A also summarizes the response rates obtained in the various parts of the data
collection. The response rates were 55.7 for the new-entrant households’ baseline interview and 55.0for the six-month sample interviewed at baseline. The response rate for the follow-up interview withthe new-entrant sample six months later was 66.6 percent. All response rates were calculated using the American Association for Public Opinion Research (AAPOR) response rate 3 (RR3) formula(American Association for Public Opinion Research 2009). The response rate was lower thananticipated because the State files obtained as sample frames had a much lower incidence of valid, working telephone numbers than expected. Another factor that contributed to the low response rate was the 14-day field period. This is much shorter than most field periods for standard surveys, but was critical in achieving quick turnaround in the survey so that interview responses reflect clients’
true baseline situations before entering SNAP or after six months of receiving SNAP benefits. Asdescribed in the weighting section of this chapter and in Appendix A, we adjusted survey weightsusing information obtained through our comprehensive nonresponse analysis to ensure thathousehold nonresponse did not bias the study findings.
C. Outcome Measures and Explanatory Variables
1. Outcome Measures for the Food Security Analyses
The SNAPFS survey included the 18-item food security module used in the Current PopulationSurvey Food Security Supplement (CPS-FSS). As in the CPS-FSS, we administered the 18 core itemsof the food security module for assessing the food security of households with children and 10 itemsfor households without children. The questionnaire was based on a 30-day recall period.
We defined four outcome measures for the food security analyses:
1. Household food insecurity. This is a binary variable indicating whether a household was food insecure. Household food security status can be measured using the 10 adult-referenced items for households without children and the full 18 items (the 10 adult-referenced items plus the 8 child-referenced items) for households with children. In thisstudy, we measured food security using the 10 adult-referenced items for all householdsto minimize any measurement effects associated with the presence and ages of children(Nord and Golla 2009; Nord and Bickel 2002). Households that affirmed three or more
items were classified as food insecure.2. Household very low food security. This is a binary variable indicating whether a
household experienced very low food security. This variable was measured using the 10-item adult scale of the food security module. Households that affirmed six or more items were classified as having very low food security.
3. Children’s food insecurity. For households with children, this is a binary variableindicating whether children in the household were food insecure. This variable wasmeasured using the 8-item child scale of the food security module (Nord and Bickel

8/22/2019 USDA Report re SNAP & Food Security 08/2013
http://slidepdf.com/reader/full/usda-report-re-snap-food-security-082013 45/355
Measuring the Effect of SNAP Participation on Food Security Mathematica Policy Research
9
2002). Households that affirmed two or more items were classified as having foodinsecurity among children.
4. Children’s very low food security. For households with children, this is a binary variable indicating whether children in the household experienced very low food security. This variable was measured using the 8-item child scale of the food security module
(Nord and Bickel 2002). Households that affirmed five or more items were classified ashaving very low food security among children.
2. Outcome Measures for the Food Expenditure Analyses
The SNAPFS survey included the food expenditure module used in the CPS-FSS.13 The modulefirst asked the respondent about the places where he or she bought food “last week.” Possiblelocations included supermarket or grocery store; meat market, produce stand, bakery, warehouseclub, or convenience store; restaurant, fast-food restaurant, cafeteria, or vending machine; and “any other place.” Next, the respondent was asked how much the household spent last week for each setof store types from which the respondent reported purchasing food. As in the CPS-FSS, therespondent was asked to include purchases made with SNAP benefits. The computer interviewing system calculated the total amount spent on food, and the interviewer confirmed with therespondent last week’s total food expenditures. 14
We used usual weekly food expenditures, rather than expenditures last week, as our mainoutcome measure, because research has shown that usual food expenditures estimated from datacollected using this module were consistent with estimates from the Consumer ExpenditureSurvey—the principal source of data on U.S. household expenditures for goods and services(Oliveira and Rose 1996; Nord 2009). This approach is also consistent with the ERS’s annualHousehold Food Security report (Coleman-Jensen et al. 2011).
Finally, the interviewer asked the respondent how much the household usually spends on food in a week.
We used two outcome measures of food expenditures. The first was “unadjusted” usual weekly household food expenditures. Because household food expenditures are highly dependent onhousehold size and composition, we included measures of household size and composition among the set of explanatory variables used in the regression. The second outcome measure adjustedexpenditures for household size and composition: usual weekly household food expendituresrelative to the Thrifty Food Plan (TFP) spending amount. We calculated this value by dividing eachhousehold’s usual weekly food expenditures by the estimated cost of the TFP for that household inthe interview month. The TFP was developed by the USDA and serves as a national standard for anutritious, minimal-cost diet. It represents a set of “market baskets” of food that people in specificage and gender categories could consume at home to maintain a healthful diet that meets currentdietary standards, taking into account the food consumption patterns of U.S. households (U.S.
Department of Agriculture, Center for Nutrition Policy and Promotion 2007). The cost of the TFP
13 The CPS-FSS instrument can be found at( http://www.ers.usda.gov/datafiles/Food_Security_in_the_United_States/Current_Population_Survey/2011/qn2011.pdf ).
14 For the first two categories of stores, respondents were also asked how much they spent on nonfood items (petfood, paper products, alcohol, detergents, or cleaning supplies). We excluded this amount from the total food spending amount.
8/22/2019 USDA Report re SNAP & Food Security 08/2013
http://slidepdf.com/reader/full/usda-report-re-snap-food-security-082013 46/355
Measuring the Effect of SNAP Participation on Food Security Mathematica Policy Research
10
for a household depends on the number of household members and the age and gender of eachperson. In addition to adjusting the usual weekly food spending amount by household size andcomposition, the TFP spending amount adjusts for inflation in food prices. This approach isimportant mostly in the longitudinal analysis, when comparing food expenditures from April toSeptember 2012 to expenditures that took place from October 2011 to February 2012.15
3. Explanatory Variables
The regression models for the food security and food expenditure analyses included thefollowing set of explanatory variables measuring household characteristics and circumstances: 16 17
• Gender of household head
• Race and ethnicity of household head
• Highest grade completed by household head
• Employment status of household head
• Depression status of household head
• Household income-to-poverty ratio
• Household size
• Household composition
• Prior SNAP participation status
• Participation in Federal or State programs
• Changes in household size, housing status, employment, pay, or hours worked
• Region of residence
• State wage and unemployment rate
• State SNAP policies
15 From October 2011 to July 2012 (the most currently available TFP data), the cost of the TFP for a family of four(two adults ages 19 to 50, one child age 2 to 3, and a second child age 4 to 5) increased by 0.6 percent, from $125.40 to$126.20.
16 The survey defined “household” as “the people who live with the respondent and share food with therespondent, including babies, small children, and people who are not related to the respondent.” Some of the analysis variables measure a characteristic or circumstance for the “household head.” This was the interview respondent whoaffirmed that (1) he or she was the person who did most of the planning or preparing of meals in his or her family, or (2)he or she was the adult in the household who did most of the shopping for food in his or her family.
17 There were two possible ways to define employment: (1) using employment of the household head, or (2) using employment of all household members. The data used for the first definition are likely more accurate than the data usedfor the second definition because the household head was sometimes the interview respondent, but the first definitiondoes not portray the full story of employment status for each household, as the second definition does. We used the firstdefinition in the regression analysis; we also conducted a sensitivity analysis in which we used the second definition, andthe results were unchanged.
8/22/2019 USDA Report re SNAP & Food Security 08/2013
http://slidepdf.com/reader/full/usda-report-re-snap-food-security-082013 47/355
Measuring the Effect of SNAP Participation on Food Security Mathematica Policy Research
11
In Appendix A, we describe how these variables were constructed.
D. Analysis Methods
We used descriptive, tabular analysis to examine the composition of the groups of new-entrantand six-month households, as well as to present summary statistics of the outcome measures of foodsecurity status and food expenditures used in the multivariate analysis. Next, we used multivariateregression analysis to estimate the association between SNAP and household food security and foodexpenditures while accounting for compositional and other differences between new-entrant andsix-month households. All analyses were weighted.
1. Multivariate Analysis of Food Security
Although comparing food insecurity rates across groups using descriptive, tabular analysisprovides valuable information about how the outcome measure differs across groups, multivariateregression analyses are needed to account for compositional differences across groups that mightbias the associations between SNAP and food security. In particular, many household characteristics
may be correlated with both continuing to participate in the SNAP program through six months anda household’s food insecurity status. To help address this concern, we used logistic regressionanalysis to estimate the association between SNAP and food security. 18
The main sample for the longitudinal analysis consisted of the new-entrant householdsinterviewed from October 2011 to February 2012 that responded to the follow-up interview approximately six months later, from April to September 2012. This is a balanced sample in that allhouseholds contributed the same number of observations (two) to the data file. The outcomemeasures were the same in the longitudinal and cross-sectional analysis, as were the set of explanatory variables.
Participation in SNAP wasdenoted using a binary variable equal to 1 if the household had been participating in SNAP forabout six months and equal to 0 if the household had just entered SNAP. We present estimatesmeasuring the association on both the logistic and percentage. The latter enable us to calculate thedifference between new-entrant and six-month households in the percentage that are food insecure. Appendix A discusses the step-by-step procedure used for obtaining regression-adjusted percentagesof households that are food insecure.
2. Multivariate Analysis of Food Expenditures
The methodology used to estimate the association between SNAP and household foodexpenditures closely resembled the methodology used to estimate the association between SNAPand household food security. Because both expenditure variables are continuous, we used ordinary least squares regression analysis to estimate the association between SNAP and each outcome
measure. The main independent variable and the set of explanatory variables were identical to thoseused in the food security regressions.
18 Although multivariate modeling helps minimize bias, it does not eliminate it completely, due to the inability toaccount for unobservable factors that affect both SNAP participation and food security.
8/22/2019 USDA Report re SNAP & Food Security 08/2013
http://slidepdf.com/reader/full/usda-report-re-snap-food-security-082013 48/355
Measuring the Effect of SNAP Participation on Food Security Mathematica Policy Research
12
3. Standard Errors
Standard errors were estimated using a variance estimator based on a first-order Taylor seriesapproximation. We accounted for the complex survey design of the SNAPFS survey whenestimating standard errors.19 As an approximation, the standard errors in the regression estimatesbased on the longitudinal sample do not account for multiple observations per household. 20
4. Subgroup Analysis
In addition to estimating the association between SNAP and food security and spending using the full sample of households, we estimated the regressions described above for several subgroups,such as households with children; households in which the household head was employed full-time,part-time, or not employed; households that received benefits of various amounts; and householdsthat participated in other food assistance and nutrition programs. Selected subgroup results arepresented in Chapters IV and V, and a full list of subgroups examined is in Appendix A. 21
E. Weight Construction
We used sampling weights for all analyses to account for the complex survey design and for thepossibility that some groups in the study population may have been over- or underrepresented.Sampling weights were constructed to correct for differences in households’ selection probabilitiesand propensities to respond. These weights restored the distribution of the responding sample to thesame proportions as the frame of SNAP participant households from which it was drawn.
Different sets of weights were constructed for the cross-sectional and longitudinal analysesdescribed above. Weights were also constructed separately for the samples of new-entrant and six-month households.
As described in detail in Appendix A, the weights are the products of several weighting factors
that fall into three groups:
1. State-level selection and replacement of noncooperating States
2. Adjustments for selection probabilities within sampled States
3. Nonresponse adjustments at the household level
Based on weighted data, the findings in this study are nationally representative of new-entrantand six-month SNAP households at the time of the baseline interviews. The findings are notrepresentative of all SNAP households.
19 We used the Stata software’s “svy” commands.
20 The findings presented in the main text of the report were robust to a sensitivity analysis that estimated a fixedeffects model that controls for time-invariant factors when estimating the association between SNAP and food security.
21 There are statistical risks associated with extensive subgroup analysis due to the substantial likelihood—often anear certainty—that spurious results are obtained. As we discuss in greater detail in Chapter IV, we attempt to strike acompromise between the need for subgroup analysis and the attendant statistical risks by highlighting findings fromthree sets of important subgroups in the text of the report and reporting results for additional subgroups in appendixtables to allow additional exploratory analysis, as desired.
8/22/2019 USDA Report re SNAP & Food Security 08/2013
http://slidepdf.com/reader/full/usda-report-re-snap-food-security-082013 49/355
Measuring the Effect of SNAP Participation on Food Security Mathematica Policy Research
13
F. Limitations
Several limitations are important to consider when interpreting the report’s findings:
• New-entrant household definitions. We identified new-entrant households using SNAP caseload files provided by State SNAP agencies. Among the sample of new-entrant households selected from these files, households that reported to interviewersthat they had participated in SNAP within in the past three months were classified asbeing ineligible to participate in the survey. Thus, the new-entrant sample is notrepresentative of all SNAP entrants. Households that were excluded consist of those who may have had short-term gaps in participation and were thus not necessarily “new”to SNAP.
• Response rates. The response rate was lower than expected. Although a nonresponseanalysis was conducted and survey weights were adjusted for nonresponse at thehousehold level, nonresponse bias may exist. That is, the samples may not be fully representative of the populations from which they were drawn.
• The date of the interview in relation to date of the receipt of SNAP benefits. Ideally, all new-entrants households would have been interviewed before receiving SNAP benefits. For logistical reasons, however, the baseline interviews for most survey respondents (84 percent) were conducted several days after households received theirSNAP benefits, with most being interviewed within two weeks. Some new-entrantrespondents may have reported food security and/or food spending informationpertaining to the time period just after receipt of benefits, which may bias the associationbetween SNAP and food security (or food spending). As presented in greater detail in Appendix D, we do not believe this to be the case for food security, as the food security index essentially identifies the worst conditions that a household has experienced in theprevious 30 days. Nonetheless, report findings should be interpreted with this potential
bias in mind.
• Interpretation of expenditure questions. As discussed in Chapter V and in greaterdetail in Appendix G, the unavoidably high fraction of the baseline interviews that took place after new-entrant households had already been receiving benefits might haveaffected the main findings in the food expenditure analysis if households very quickly adjust their notion of “usual” spending after receiving their initial SNAP benefit.

8/22/2019 USDA Report re SNAP & Food Security 08/2013
http://slidepdf.com/reader/full/usda-report-re-snap-food-security-082013 50/355
This page has been left blank for double-sided copying.

8/22/2019 USDA Report re SNAP & Food Security 08/2013
http://slidepdf.com/reader/full/usda-report-re-snap-food-security-082013 51/355
Measuring the Effect of SNAP Participation on Food Security Mathematica Policy Research
15
III. CHARACTERISTICS AND CIRCUMSTANCES OF SNAP HOUSEHOLDS
In this chapter, we use tabular methods to examine the characteristics of SNAP participants inthe study, including both new-entrant and six-month households. This is important backgroundinformation for the more formal multivariate analysis of how food security and food expenditures vary with SNAP participation presented in Chapters IV and V.
We have structured each table similarly throughout the chapter to focus on possible differencesbetween analysis samples. The tables begin with a set of columns that present descriptive statisticsfor the data used for the cross-sectional estimates. We first present characteristics of new-entrantSNAP households, compared to a contemporaneous set of participants who have been receiving SNAP benefits for about six months. These households were interviewed from October 2011 toFebruary 2012. The second set of columns presents longitudinal estimates that compare thecharacteristics of households that were new entrants in the baseline interview to the characteristicsof those same households about six months later, from April through September 2012. All statisticsin this chapter are descriptive and have not been regression-adjusted.
The tables restrict the sample of new-entrant households to those that continued to participatesix months later, at the time of the follow-up interview. All estimates are weighted.
Because our purpose here is largely descriptive, we do not report significance tests fordifferences between the estimates for new-entrant and six-month households. However, insubsequent chapters where the focus is on hypothesis testing, information on statistical significanceis fully reported.
A. Food Security Status of Six- Month and New- Entrant Households
We begin with simple tabulations of the data on key outcome variables, with no adjustment forother household characteristics. These tabulations show that six-month households are less likely
than new-entrant households to be food insecure or experience very low food security.
The percentages of new-entrant and six-month households that were food insecure in thecross-sectional sample were 65.5 and 58.7 percent, respectively—a -6.7 percentage point difference(Figure III.1). Similarly, in the longitudinal sample, the percentages of new-entrant households andthose same households six months later that were food insecure were 65.5 and 52.8 percent,respectively—a 12.7 percentage point decrease.
The percentage of households with very low food security was also smaller for six-monthhouseholds than for new-entrant households. The percentages of new-entrant and six-monthhouseholds that had very low food security in the cross-sectional sample were 39.4 and 32.0 percent,
respectively—a -7.4 percentage point difference. The analogous percentages in the longitudinalsample were 39.4 and 30.4 percent, respectively—a 9.0 percentage point decrease.

8/22/2019 USDA Report re SNAP & Food Security 08/2013
http://slidepdf.com/reader/full/usda-report-re-snap-food-security-082013 52/355
Measuring the Effect of SNAP Participation on Food Security Mathematica Policy Research
16
Figure III.1. Household Food Security Status in New- Entrant and Six- Month SNAP Households
Source: SNAP Food Security Survey 2012.
Note: The cross- sectional estimates compare new SNAP participants to a contemporaneous set of participants who have been receiving SNAP for about six months. The longitudinal estimatescompare new SNAP participants to the same participants about six months later.
Cross- sectional estimates are based on a data set with 6,650 households (3,275 new- entranthouseholds and 3,375 six- month households). Longitudinal estimates are based on a data setwith 3,275 new- entrant households observed at baseline and again at follow- up six monthslater.
B. Food Security Status of Children in Six- Month and New- EntrantHouseholds with Children
When only households with children are considered, six-month households had a smallerpercentage of households that were food insecure than new-entrant households in both the cross-sectional and longitudinal samples. In the cross-sectional sample, the percentage of households with
children in which children were food insecure was 37.0 percent for new-entrant households and 27.1percent for six-month households—a difference of -9.9 percentage points (Figure III.2). Similarly, inthe longitudinal sample, the percentages were 37.0 and 24.1 percent, respectively—a 12.9 percentagepoint decrease.
In the cross-sectional sample, the percentage of households with children in which children had very low food security was 6.8 percent for new-entrant households and 4.0 percent for six-monthhouseholds—a difference of -2.8 percentage points. In the longitudinal sample, the percentages were6.8 and 4.7 percent, respectively—a 2.1 percentage-point decrease.
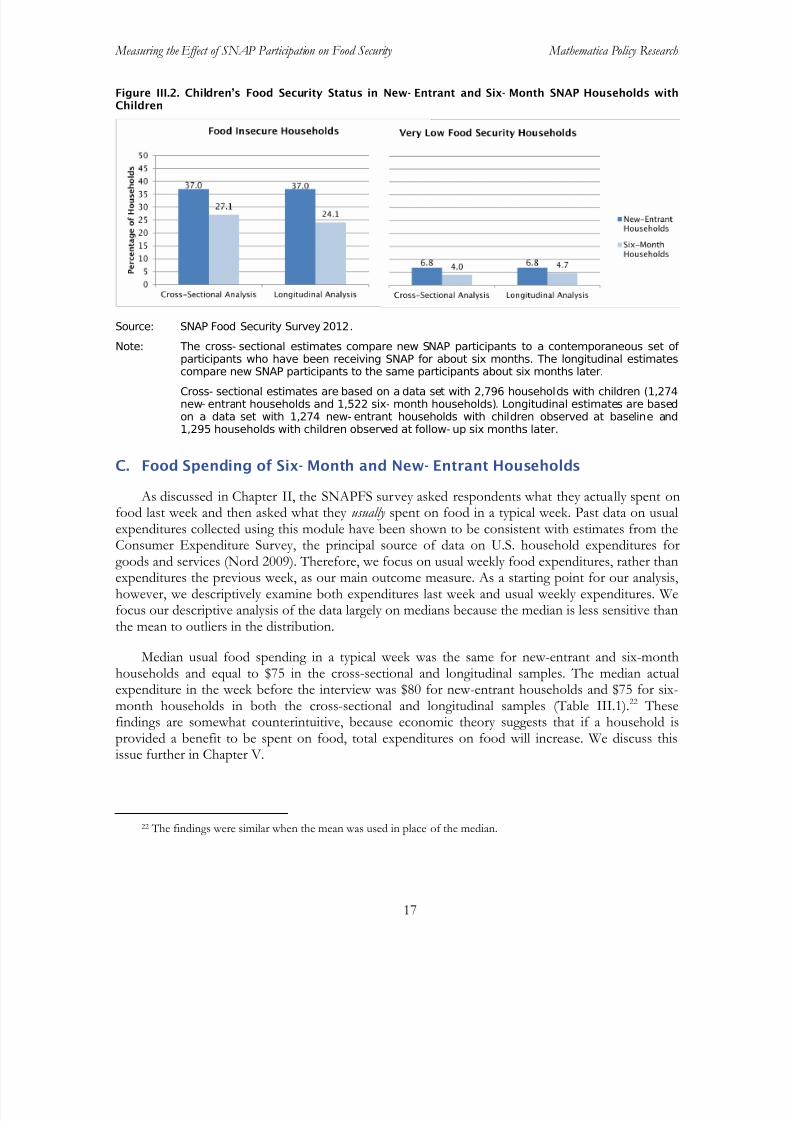
8/22/2019 USDA Report re SNAP & Food Security 08/2013
http://slidepdf.com/reader/full/usda-report-re-snap-food-security-082013 53/355
Measuring the Effect of SNAP Participation on Food Security Mathematica Policy Research
17
Figure III.2. Children’s Food Security Status in New- Entrant and Six- Month SNAP Households withChildren
Source: SNAP Food Security Survey 2012.
Note: The cross- sectional estimates compare new SNAP participants to a contemporaneous set of participants who have been receiving SNAP for about six months. The longitudinal estimatescompare new SNAP participants to the same participants about six months later.
Cross- sectional estimates are based on a data set with 2,796 households with children (1,274new- entrant households and 1,522 six- month households). Longitudinal estimates are basedon a data set with 1,274 new- entrant households with children observed at baseline and1,295 households with children observed at follow- up six months later.
C. Food Spending of Six- Month and New- Entrant Households
As discussed in Chapter II, the SNAPFS survey asked respondents what they actually spent onfood last week and then asked what they usually spent on food in a typical week. Past data on usualexpenditures collected using this module have been shown to be consistent with estimates from the
Consumer Expenditure Survey, the principal source of data on U.S. household expenditures forgoods and services (Nord 2009). Therefore, we focus on usual weekly food expenditures, rather thanexpenditures the previous week, as our main outcome measure. As a starting point for our analysis,however, we descriptively examine both expenditures last week and usual weekly expenditures. Wefocus our descriptive analysis of the data largely on medians because the median is less sensitive thanthe mean to outliers in the distribution.
Median usual food spending in a typical week was the same for new-entrant and six-monthhouseholds and equal to $75 in the cross-sectional and longitudinal samples. The median actualexpenditure in the week before the interview was $80 for new-entrant households and $75 for six-month households in both the cross-sectional and longitudinal samples (Table III.1). 22
22 The findings were similar when the mean was used in place of the median.
Thesefindings are somewhat counterintuitive, because economic theory suggests that if a household is
provided a benefit to be spent on food, total expenditures on food will increase. We discuss thisissue further in Chapter V.
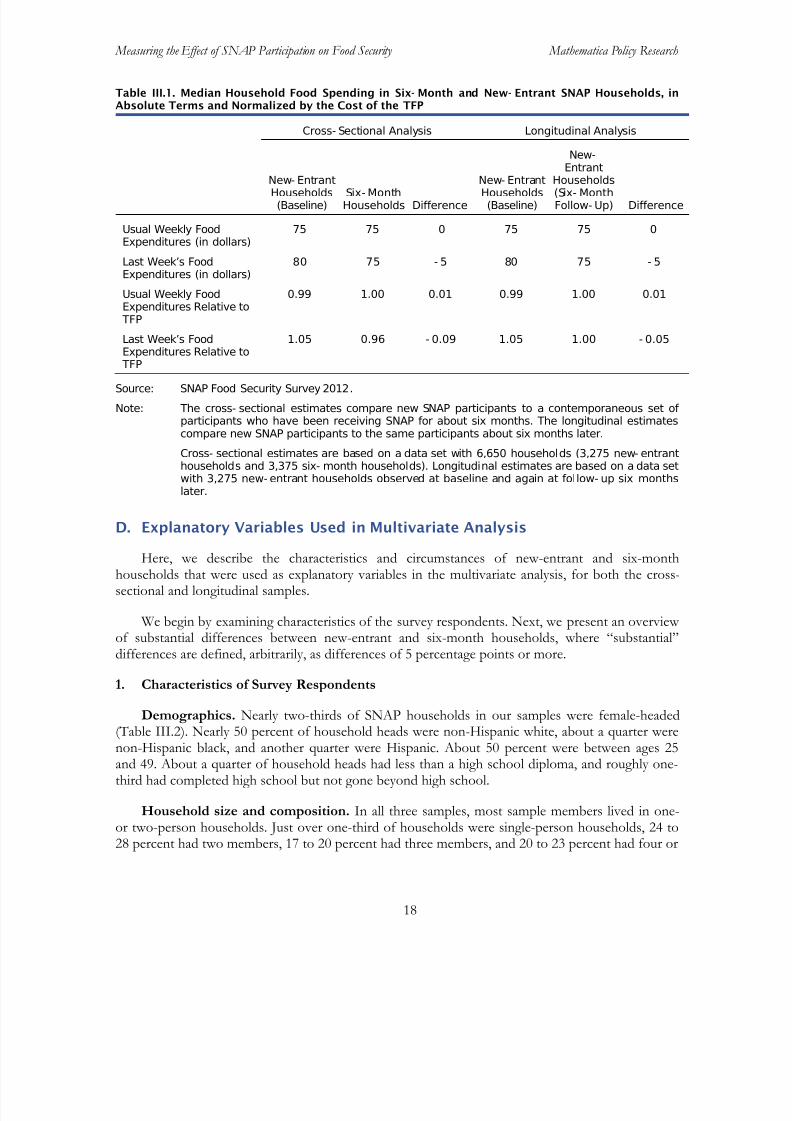
8/22/2019 USDA Report re SNAP & Food Security 08/2013
http://slidepdf.com/reader/full/usda-report-re-snap-food-security-082013 54/355
Measuring the Effect of SNAP Participation on Food Security Mathematica Policy Research
18
Table III.1. Median Household Food Spending in Six- Month and New- Entrant SNAP Households, inAbsolute Terms and Normalized by the Cost of the TFP
Cross- Sectional Analysis Longitudinal Analysis
New- EntrantHouseholds(Baseline)
Six- MonthHouseholds Difference
New- EntrantHouseholds(Baseline)
New-Entrant
Households(Six- MonthFollow- Up) Difference
Usual Weekly FoodExpenditures (in dollars)
75 75 0 75 75 0
Last Week’s FoodExpenditures (in dollars)
80 75 - 5 80 75 - 5
Usual Weekly FoodExpenditures Relative to TFP
0.99 1.00 0.01 0.99 1.00 0.01
Last Week’s FoodExpenditures Relative to
TFP
1.05 0.96 - 0.09 1.05 1.00 - 0.05
Source: SNAP Food Security Survey 2012.
Note: The cross- sectional estimates compare new SNAP participants to a contemporaneous set of participants who have been receiving SNAP for about six months. The longitudinal estimatescompare new SNAP participants to the same participants about six months later.
Cross- sectional estimates are based on a data set with 6,650 households (3,275 new- entranthouseholds and 3,375 six- month households). Longitudinal estimates are based on a data setwith 3,275 new- entrant households observed at baseline and again at follow- up six monthslater.
D. Explanatory Variables Used in Multivariate Analysis
Here, we describe the characteristics and circumstances of new-entrant and six-monthhouseholds that were used as explanatory variables in the multivariate analysis, for both the cross-sectional and longitudinal samples.
We begin by examining characteristics of the survey respondents. Next, we present an overview of substantial differences between new-entrant and six-month households, where “substantial”differences are defined, arbitrarily, as differences of 5 percentage points or more.
1. Characteristics of Survey Respondents
Demographics. Nearly two-thirds of SNAP households in our samples were female-headed
(Table III.2). Nearly 50 percent of household heads were non-Hispanic white, about a quarter werenon-Hispanic black, and another quarter were Hispanic. About 50 percent were between ages 25and 49. About a quarter of household heads had less than a high school diploma, and roughly one-third had completed high school but not gone beyond high school.
Household size and composition. In all three samples, most sample members lived in one-or two-person households. Just over one-third of households were single-person households, 24 to28 percent had two members, 17 to 20 percent had three members, and 20 to 23 percent had four or
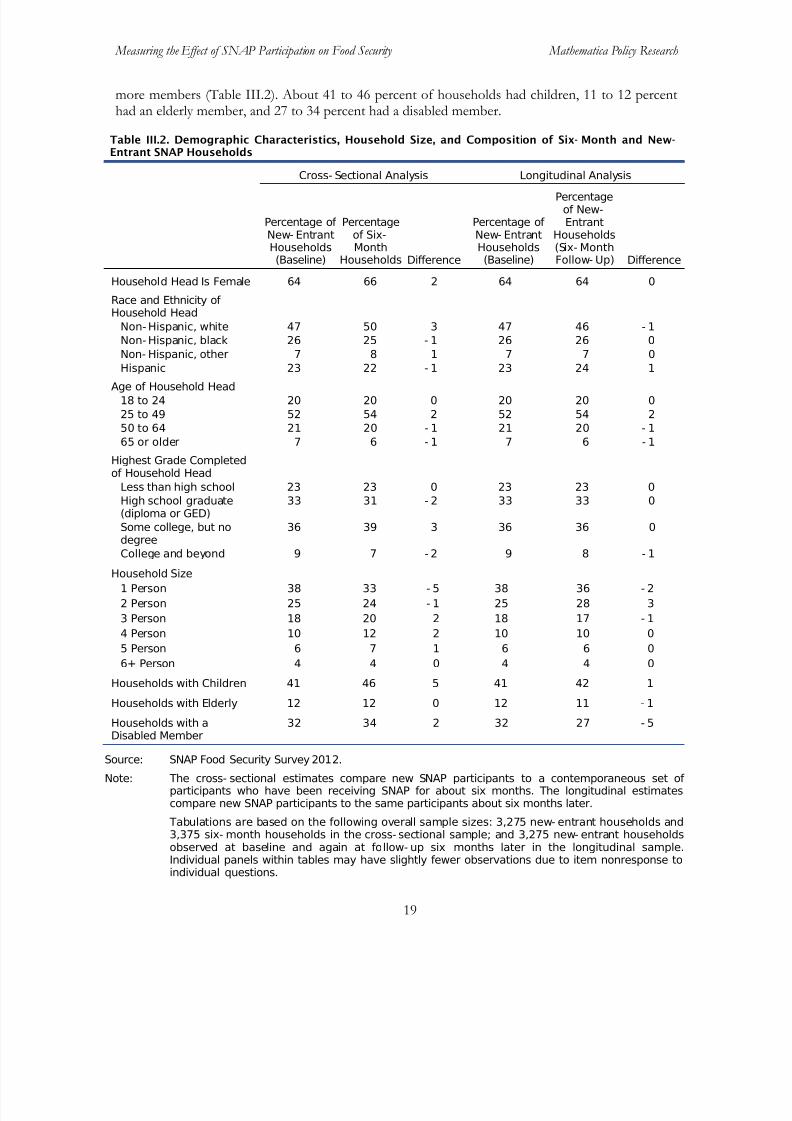
8/22/2019 USDA Report re SNAP & Food Security 08/2013
http://slidepdf.com/reader/full/usda-report-re-snap-food-security-082013 55/355
Measuring the Effect of SNAP Participation on Food Security Mathematica Policy Research
19
more members (Table III.2). About 41 to 46 percent of households had children, 11 to 12 percenthad an elderly member, and 27 to 34 percent had a disabled member.
Table III.2. Demographic Characteristics, Household Size, and Composition of Six- Month and New-Entrant SNAP Households
Cross- Sectional Analysis Longitudinal Analysis
Percentage of New- EntrantHouseholds(Baseline)
Percentageof Six-Month
Households Difference
Percentage of New- EntrantHouseholds(Baseline)
Percentageof New-Entrant
Households(Six- MonthFollow- Up) Difference
Household Head Is Female 64 66 2 64 64 0
Race and Ethnicity of Household Head
Non- Hispanic, white 47 50 3 47 46 - 1
Non- Hispanic, black 26 25 - 1 26 26 0
Non- Hispanic, other 7 8 1 7 7 0
Hispanic 23 22 - 1 23 24 1
Age of Household Head
18 to 24 20 20 0 20 20 0
25 to 49 52 54 2 52 54 2
50 to 64 21 20 - 1 21 20 - 1
65 or older 7 6 - 1 7 6 - 1
Highest Grade Completedof Household Head
Less than high school 23 23 0 23 23 0
High school graduate(diploma or GED)
33 31 - 2 33 33 0
Some college, but nodegree
36 39 3 36 36 0
College and beyond 9 7 - 2 9 8 - 1
Household Size
1 Person 38 33 - 5 38 36 - 2
2 Person 25 24 - 1 25 28 3
3 Person 18 20 2 18 17 - 1
4 Person 10 12 2 10 10 0
5 Person 6 7 1 6 6 0
6+ Person 4 4 0 4 4 0
Households with Children 41 46 5 41 42 1
Households with Elderly 12 12 0 12 11 - 1
Households with a
Disabled Member
32 34 2 32 27 - 5
Source: SNAP Food Security Survey 2012.
Note: The cross- sectional estimates compare new SNAP participants to a contemporaneous set of participants who have been receiving SNAP for about six months. The longitudinal estimatescompare new SNAP participants to the same participants about six months later.
Tabulations are based on the following overall sample sizes: 3,275 new- entrant households and3,375 six- month households in the cross- sectional sample; and 3,275 new- entrant householdsobserved at baseline and again at follow- up six months later in the longitudinal sample.Individual panels within tables may have slightly fewer observations due to item nonresponse toindividual questions.
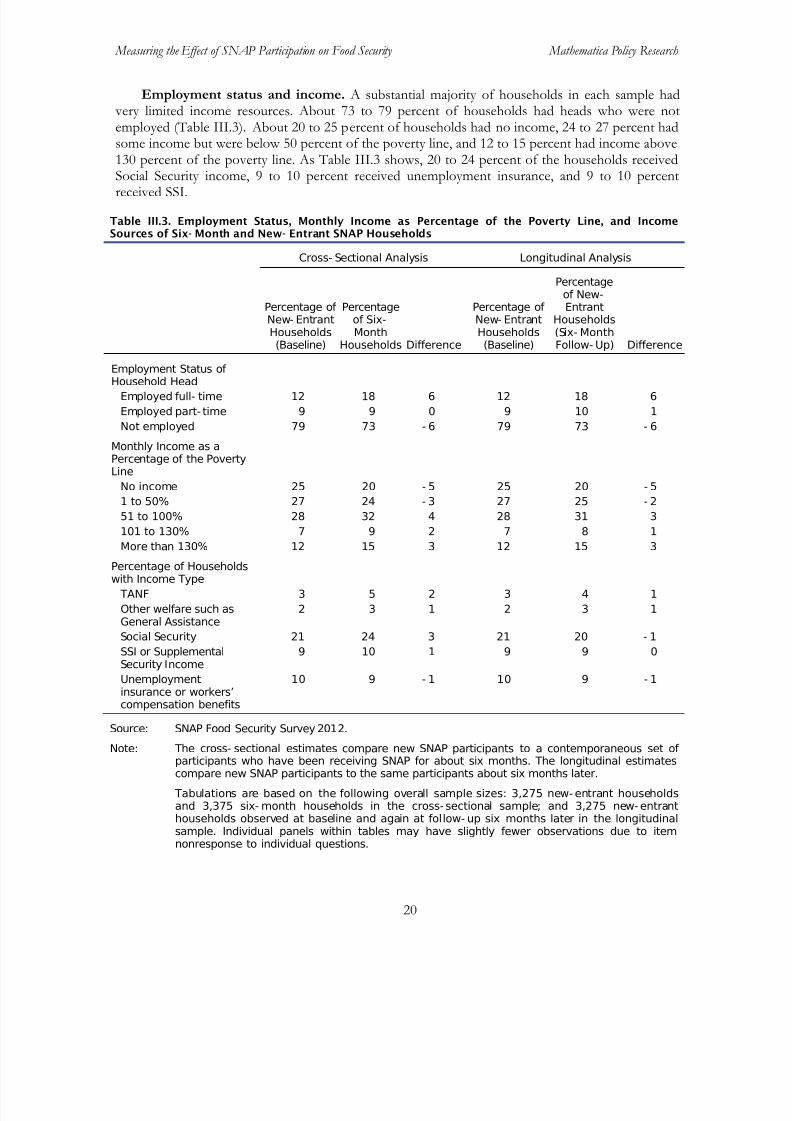
8/22/2019 USDA Report re SNAP & Food Security 08/2013
http://slidepdf.com/reader/full/usda-report-re-snap-food-security-082013 56/355
Measuring the Effect of SNAP Participation on Food Security Mathematica Policy Research
20
Employment status and income. A substantial majority of households in each sample had very limited income resources. About 73 to 79 percent of households had heads who were notemployed (Table III.3). About 20 to 25 percent of households had no income, 24 to 27 percent hadsome income but were below 50 percent of the poverty line, and 12 to 15 percent had income above130 percent of the poverty line. As Table III.3 shows, 20 to 24 percent of the households received
Social Security income, 9 to 10 percent received unemployment insurance, and 9 to 10 percentreceived SSI.
Table III.3. Employment Status, Monthly Income as Percentage of the Poverty Line, and IncomeSources of Six- Month and New- Entrant SNAP Households
Cross- Sectional Analysis Longitudinal Analysis
Percentage of New- EntrantHouseholds(Baseline)
Percentageof Six-Month
Households Difference
Percentage of New- EntrantHouseholds(Baseline)
Percentageof New-Entrant
Households(Six- MonthFollow- Up) Difference
Employment Status of Household Head
Employed full- time 12 18 6 12 18 6
Employed part- time 9 9 0 9 10 1
Not employed 79 73 - 6 79 73 - 6
Monthly Income as aPercentage of the PovertyLine
No income 25 20 - 5 25 20 - 5
1 to 50% 27 24 - 3 27 25 - 2
51 to 100% 28 32 4 28 31 3
101 to 130% 7 9 2 7 8 1
More than 130% 12 15 3 12 15 3Percentage of Householdswith Income Type
TANF 3 5 2 3 4 1
Other welfare such asGeneral Assistance
2 3 1 2 3 1
Social Security 21 24 3 21 20 - 1
SSI or SupplementalSecurity Income
9 10 1 9 9 0
Unemploymentinsurance or workers’compensation benefits
10 9 - 1 10 9 - 1
Source: SNAP Food Security Survey 2012.
Note: The cross- sectional estimates compare new SNAP participants to a contemporaneous set of participants who have been receiving SNAP for about six months. The longitudinal estimatescompare new SNAP participants to the same participants about six months later.
Tabulations are based on the following overall sample sizes: 3,275 new- entrant householdsand 3,375 six- month households in the cross- sectional sample; and 3,275 new- entranthouseholds observed at baseline and again at follow- up six months later in the longitudinalsample. Individual panels within tables may have slightly fewer observations due to itemnonresponse to individual questions.

8/22/2019 USDA Report re SNAP & Food Security 08/2013
http://slidepdf.com/reader/full/usda-report-re-snap-food-security-082013 57/355
Measuring the Effect of SNAP Participation on Food Security Mathematica Policy Research
21
Changes in household size, housing status, and employment, pay, or hours worked. Pastresearch has suggested that changes in household structure or economic circumstances (often called“trigger events”) frequently precede entry into assistance programs. Consistent with this, 21 percentof new-entrant households had experienced a change in household size in the past six months, 5percent were evicted from their house or apartment in the past six months, and 39 percent
experienced a change in employment, pay, or hours worked (Table III.4).Prior SNAP participation. Across all the samples, 48 to 49 percent of households participated
in SNAP before their current enrollment (Table III.4).
Table III.4. Prior SNAP Participation and Changes in Household Size, Housing Status, or Employment,Pay, or Hours Worked in Past Six Months Experienced by Six- Month and New- Entrant SNAPHouseholds
Cross- Sectional Analysis Longitudinal Analysis
Percentage of
New- EntrantHouseholds(Baseline)
Percentage
of Six-MonthHouseholds Difference
Percentage of
New- EntrantHouseholds(Baseline)
Percentageof New-Entrant
Households(Six- MonthFollow- Up) Difference
Prior SNAP Participation 49 48 - 1 49 n.a. n.a.
In Past 6 Months,Experienced
Change in HouseholdSize
21 14 - 7 21 16 - 5
Eviction from House orApartment
5 3 - 2 5 3 - 2
Change in Employment,Pay, or Hours Worked
39 26 - 13 39 20 - 19
Source: SNAP Food Security Survey 2012.
Note: The cross- sectional estimates compare new SNAP participants to a contemporaneous set of participants who have been receiving SNAP for about six months. The longitudinal estimatescompare new SNAP participants to the same participants about six months later.
Because respondents may experience more than one trigger event, percentages for aggregatecategories such as “any trigger” may not equal the sum of the percentages for the componentcategories.
Tabulations are based on the following overall sample sizes: 3,275 new- entrant householdsand 3,375 six- month households in the cross- sectional sample; and 3,275 new- entranthouseholds observed at baseline and again at follow- up six months later in the longitudinalsample. Individual panels within tables may have slightly fewer observations due to itemnonresponse to individual questions.
Well-Being. Between 72 and 80 percent of households reported feeling depressed in the past30 days (Table III.5).
Language of interview. Ninety percent of interviews were conducted in English (Table III.5).

8/22/2019 USDA Report re SNAP & Food Security 08/2013
http://slidepdf.com/reader/full/usda-report-re-snap-food-security-082013 58/355
Measuring the Effect of SNAP Participation on Food Security Mathematica Policy Research
22
Table III.5. Well- Being, Language of Interview, and Region of Residence of Six- Month and New-Entrant SNAP Households
Cross- Sectional Analysis Longitudinal Analysis
Percentage of
New- EntrantHouseholds(Baseline)
Percentage
of Six-MonthHouseholds Difference
Percentage of
New- EntrantHouseholds(Baseline)
Percentage of New- Entrant
Households(Six- MonthFollow- Up) Difference
Household Head FeltDepressed in Past 30Days
80 77 - 3 80 72 - 6
Interview Conducted inEnglish Language
90 91 1 90 90 0
Region of Residence
Northeast 13 12 - 1 13 13 0
Mid- Atlantic 7 14 7 7 7 0
Midwest 13 18 5 13 13 0
Southeast 25 17 - 8 25 25 0Southwest 12 11 - 1 12 12 0
Mountain Plains 6 6 0 6 6 0
West 24 23 - 1 24 24 0
Source: SNAP Food Security Survey 2012.
Note: The cross- sectional estimates compare new SNAP participants to a contemporaneous set of participants who have been receiving SNAP for about six months. The longitudinal estimatescompare new SNAP participants to the same participants about six months later.
Tabulations are based on the following overall sample sizes: 3,275 new- entrant householdsand 3,375 six- month households in the cross- sectional sample; and 3,275 new- entranthouseholds observed at baseline and again at follow- up six months later in the longitudinalsample. Individual panels within tables may have slightly fewer observations due to item
nonresponse to individual questions.
State characteristics. Across all the samples, the State’s 25th percentile hourly wage was 11dollars, the State unemployment rate was 9 percent, and the average State SNAP certification period was 12 months. Across all samples, 89 percent of households lived in a State that offered broad-based categorical eligibility for SNAP (Table III.6).
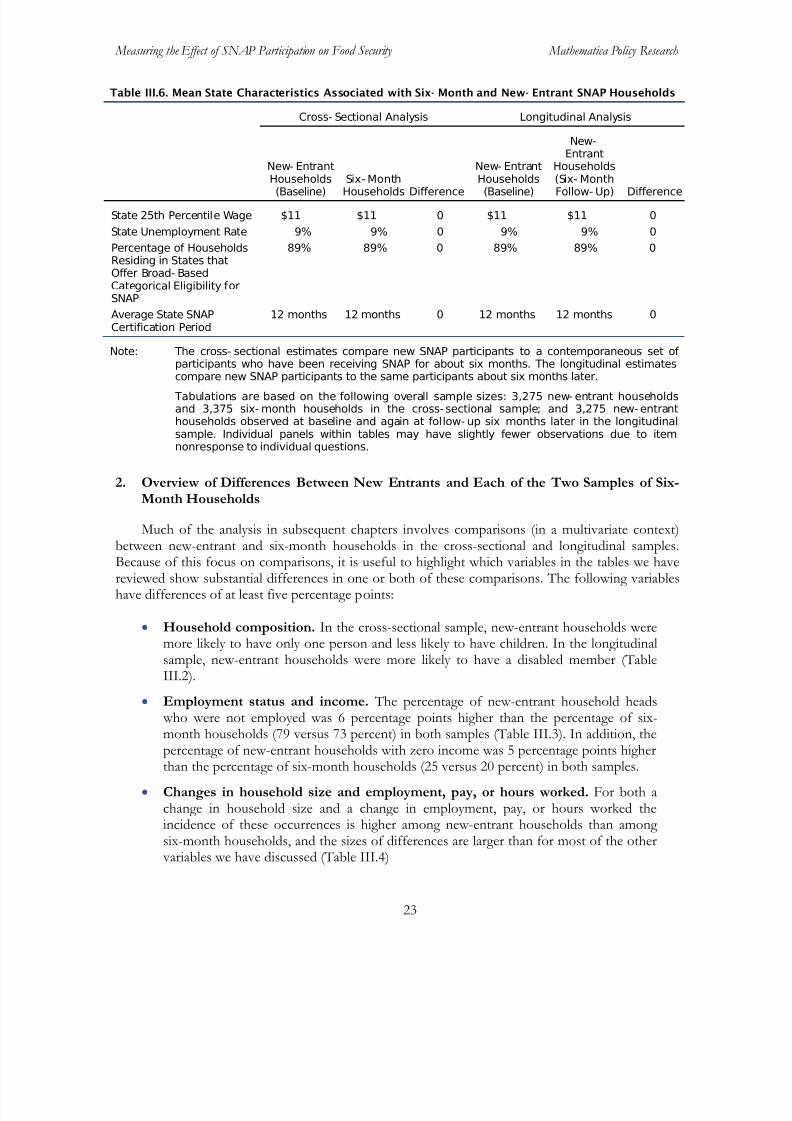
8/22/2019 USDA Report re SNAP & Food Security 08/2013
http://slidepdf.com/reader/full/usda-report-re-snap-food-security-082013 59/355
Measuring the Effect of SNAP Participation on Food Security Mathematica Policy Research
23
Table III.6. Mean State Characteristics Associated with Six- Month and New- Entrant SNAP Households
Cross- Sectional Analysis Longitudinal Analysis
New- Entrant
Households(Baseline) Six- MonthHouseholds Difference
New- Entrant
Households(Baseline)
New-Entrant
Households
(Six- MonthFollow- Up) Difference
State 25th Percentile Wage $11 $11 0 $11 $11 0
State Unemployment Rate 9% 9% 0 9% 9% 0
Percentage of HouseholdsResiding in States thatOffer Broad- BasedCategorical Eligibility forSNAP
89% 89% 0 89% 89% 0
Average State SNAPCertification Period
12 months 12 months 0 12 months 12 months 0
Note: The cross- sectional estimates compare new SNAP participants to a contemporaneous set of
participants who have been receiving SNAP for about six months. The longitudinal estimatescompare new SNAP participants to the same participants about six months later.
Tabulations are based on the following overall sample sizes: 3,275 new- entrant householdsand 3,375 six- month households in the cross- sectional sample; and 3,275 new- entranthouseholds observed at baseline and again at follow- up six months later in the longitudinalsample. Individual panels within tables may have slightly fewer observations due to itemnonresponse to individual questions.
2. Overview of Differences Between New Entrants and Each of the Two Samples of Six-Month Households
Much of the analysis in subsequent chapters involves comparisons (in a multivariate context)
between new-entrant and six-month households in the cross-sectional and longitudinal samples.Because of this focus on comparisons, it is useful to highlight which variables in the tables we havereviewed show substantial differences in one or both of these comparisons. The following variableshave differences of at least five percentage points:
• Household composition. In the cross-sectional sample, new-entrant households weremore likely to have only one person and less likely to have children. In the longitudinalsample, new-entrant households were more likely to have a disabled member (TableIII.2).
• Employment status and income. The percentage of new-entrant household heads who were not employed was 6 percentage points higher than the percentage of six-
month households (79 versus 73 percent) in both samples (Table III.3). In addition, thepercentage of new-entrant households with zero income was 5 percentage points higherthan the percentage of six-month households (25 versus 20 percent) in both samples.
• Changes in household size and employment, pay, or hours worked. For both achange in household size and a change in employment, pay, or hours worked theincidence of these occurrences is higher among new-entrant households than among six-month households, and the sizes of differences are larger than for most of the other variables we have discussed (Table III.4)
8/22/2019 USDA Report re SNAP & Food Security 08/2013
http://slidepdf.com/reader/full/usda-report-re-snap-food-security-082013 60/355
Measuring the Effect of SNAP Participation on Food Security Mathematica Policy Research
24
• Reported depression. In the longitudinal sample, new-entrant households were morelikely than six-month households to report being depressed in the past 30 days (TableIII.5).
• Region. In the cross-sectional sample, a lower percentage of new-entrant householdsthan six-month households reside in Mid-Atlantic and Midwestern States, and a higher
percentage reside in Southeastern States (Table III.5).
8/22/2019 USDA Report re SNAP & Food Security 08/2013
http://slidepdf.com/reader/full/usda-report-re-snap-food-security-082013 61/355
Measuring the Effect of SNAP Participation on Food Security Mathematica Policy Research
25
IV. SNAP AND HOUSEHOLD FOOD SECURITY
While the descriptive tabulations of the prevalence of food insecurity in the previous chaptershow the total change in food security status due to SNAP participation as well as non-SNAPchanges in household characteristics and circumstances, regression analysis that accounts forobserved differences between new-entrant and six-month households was used to estimate thechange in food security status associated with SNAP participation only. We refer to these findings as“regression-adjusted” in the figures and tables below.23
This chapter describes the findings for the estimates of the associations between SNAP andhousehold food security. In Section A, we present findings from multivariate analyses that assesshow food insecurity and very low food security vary with SNAP participation. In Section B, wepresent the findings for children’s food insecurity and very low food security. Finally, in Section C, we present the results of repeating the multivariate analysis on selected subgroups of the sample,based on household composition, household income, and SNAP benefit amount.
A. Associations Between SNAP and Household Food Security
Participating in SNAP for about six months was associated with a decrease in the percentage of households that were food insecure by 4.6 percentage points in the cross-sectional sample. 24 Thereduction was from 65.4 percent of new-entrant households to 60.8 percent of six-monthhouseholds (Figure IV.1). In the longitudinal sample, SNAP was associated with a decrease in thepercentage of households that were food insecure by 10.6 percentage points, from 65.1 percent of new-entrant households to 54.5 percent of those same households six months later.25
23
The set of explanatory variables included in the regression models is presented in Chapter II.24 An important limitation in the analysis is that it was not feasible to use randomized assignment of SNAP
participants. For this reason, we refer to the relationships between SNAP and food security as associations, rather thancausal effects. These issues are discussed in detail in Chapter II.
25 Although the same set of new-entrant households are used in the cross-sectional and longitudinal analyses, theregression-adjusted percentages of food insecure new-entrant households differ across the two analyses, because they aregenerated using model parameters specific to the samples being examined.

8/22/2019 USDA Report re SNAP & Food Security 08/2013
http://slidepdf.com/reader/full/usda-report-re-snap-food-security-082013 62/355
Measuring the Effect of SNAP Participation on Food Security Mathematica Policy Research
26
Figure IV.1. Participating in SNAP for Six Months was Associated with a Decrease in the Percentageof Households That Were Food Insecure
Source: SNAP Food Security Survey 2012.
Note: Percentages shown are regression- adjusted for differences between new- entrant and six-month households in demographic, economic, and household characteristics. See Chapter II,Section C. Standard errors in parentheses.
The cross- sectional estimates compare the sample of 3,275 new SNAP participants to thesample of 3,375 participants who had been receiving SNAP for about six months as of thebaseline data collection. The longitudinal estimates compare the 3,275 new SNAP participantsat baseline to the same 3,275 participants about six months later.
*, **, *** Significantly different from zero at the 0.10, 0.05, and 0.01 level, respectively.
SNAP participation was also associated with a reduction in the percentage of households that were food insecure with very low food security. Participating in SNAP for about six months wasassociated with a decrease in the percentage of households that experienced very low food security of 5.0 percentage points in the cross-sectional sample, from 36.4 percent of new-entrant householdsto 31.4 percent of six-month households, and of 6.3 percentage points in the longitudinal sample,from 35.9 to 29.6 percent (Figure IV.2). 26
26 As presented in Appendix D, we found the food insecurity and very low food security results to be robust with
respect to more restricted samples, different model specifications, and controlling for time since receipt of benefits. It was also robust to using the unrestricted sample of new-entrant households, which includes the new-entrant householdsthat did not have a follow-up interview.
65.4(1.0)
65.1(1.0)60.8 ***
(1.0)*** 54.5***(1.0)***
0
10
20
30
40
50
60
70
80
Cross- Sectional Analysis Longitudinal Analysis
P e r c e n t a g e o f H o u s e h o l d s F
o o d
I n s e c u r e
New- EntrantHouseholds
Six- MonthHouseholds

8/22/2019 USDA Report re SNAP & Food Security 08/2013
http://slidepdf.com/reader/full/usda-report-re-snap-food-security-082013 63/355
Measuring the Effect of SNAP Participation on Food Security Mathematica Policy Research
27
Figure IV.2. Participating in SNAP for Six Months was Associated with a Decrease in the Percentageof Households That had Very Low Food Security
Source: SNAP Food Security Survey 2012.
Note: Percentages shown are regression- adjusted for differences between new- entrant and six-month households in demographic, economic, and household characteristics. See Chapter II,Section C. Standard errors in parentheses.
The cross- sectional estimates compare the sample of 3,275 new SNAP participants to thesample of 3,375 participants who had been receiving SNAP for about six months as of thebaseline data collection. The longitudinal estimates compare the 3,275 new SNAP participantsat baseline to the same 3,275 participants about six months later.
*, **, *** Significantly different from zero at the 0.10, 0.05, and 0.01 level, respectively.
B. Associations Between SNAP and Children’s Food Security
Participating in SNAP for about six months was associated with a decrease in the percentage of households with children in which children were food insecure by 8.5 percentage points in the cross-sectional sample, from 33.3 percent of new-entrant households to 24.8 percent of six-monthhouseholds (Figure IV.3).27
27 Children’s food security is based on the 8-item child scale of the food security module (Nord and Bickel 2002).
See Chapter II and Appendix A for details.
In the longitudinal sample, the decrease was 10.1 percentage points.
36.4(0.9)
35.9(1.0)31.4 ***
(0.7)***29.6 ***(0.8)***
0
10
20
30
40
50
60
70
80
Cross- Sectional Analysis Longitudinal Analysis
P e r c e n t a g e o f H o u s e h o l d s
w i t h
V e r y L o w F
o o d S e c u r i t y
New- EntrantHouseholds
Six- MonthHouseholds
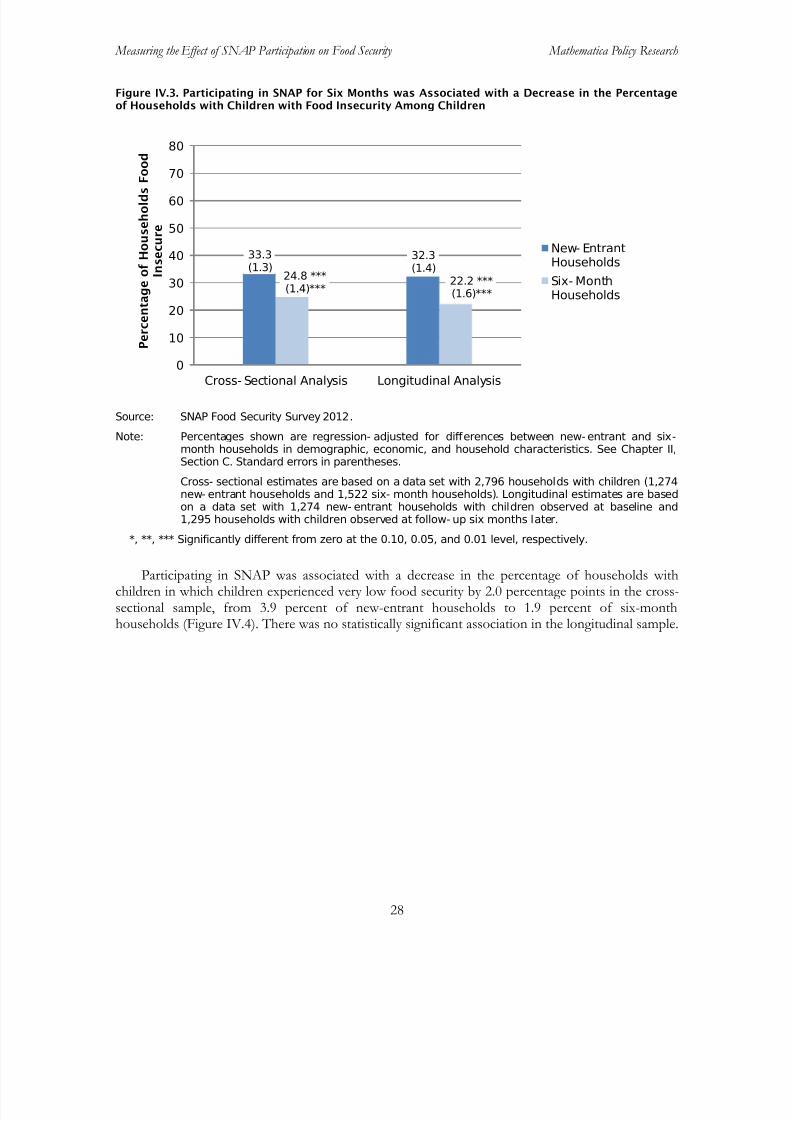
8/22/2019 USDA Report re SNAP & Food Security 08/2013
http://slidepdf.com/reader/full/usda-report-re-snap-food-security-082013 64/355
Measuring the Effect of SNAP Participation on Food Security Mathematica Policy Research
28
Figure IV.3. Participating in SNAP for Six Months was Associated with a Decrease in the Percentageof Households with Children with Food Insecurity Among Children
Source: SNAP Food Security Survey 2012.
Note: Percentages shown are regression- adjusted for differences between new- entrant and six-month households in demographic, economic, and household characteristics. See Chapter II,Section C. Standard errors in parentheses.
Cross- sectional estimates are based on a data set with 2,796 households with children (1,274new- entrant households and 1,522 six- month households). Longitudinal estimates are basedon a data set with 1,274 new- entrant households with children observed at baseline and1,295 households with children observed at follow- up six months later.
*, **, *** Significantly different from zero at the 0.10, 0.05, and 0.01 level, respectively.
Participating in SNAP was associated with a decrease in the percentage of households withchildren in which children experienced very low food security by 2.0 percentage points in the cross-sectional sample, from 3.9 percent of new-entrant households to 1.9 percent of six-monthhouseholds (Figure IV.4). There was no statistically significant association in the longitudinal sample.
33.3(1.3)
32.3(1.4)
24.8 ***(1.4)***
22.2 ***(1.6)***
0
10
20
30
40
50
60
70
80
Cross- Sectional Analysis Longitudinal Analysis
P e r c e n t a g e o f H o u s e h o l d s F o o d
I n s e c u r e
New- EntrantHouseholds
Six- MonthHouseholds
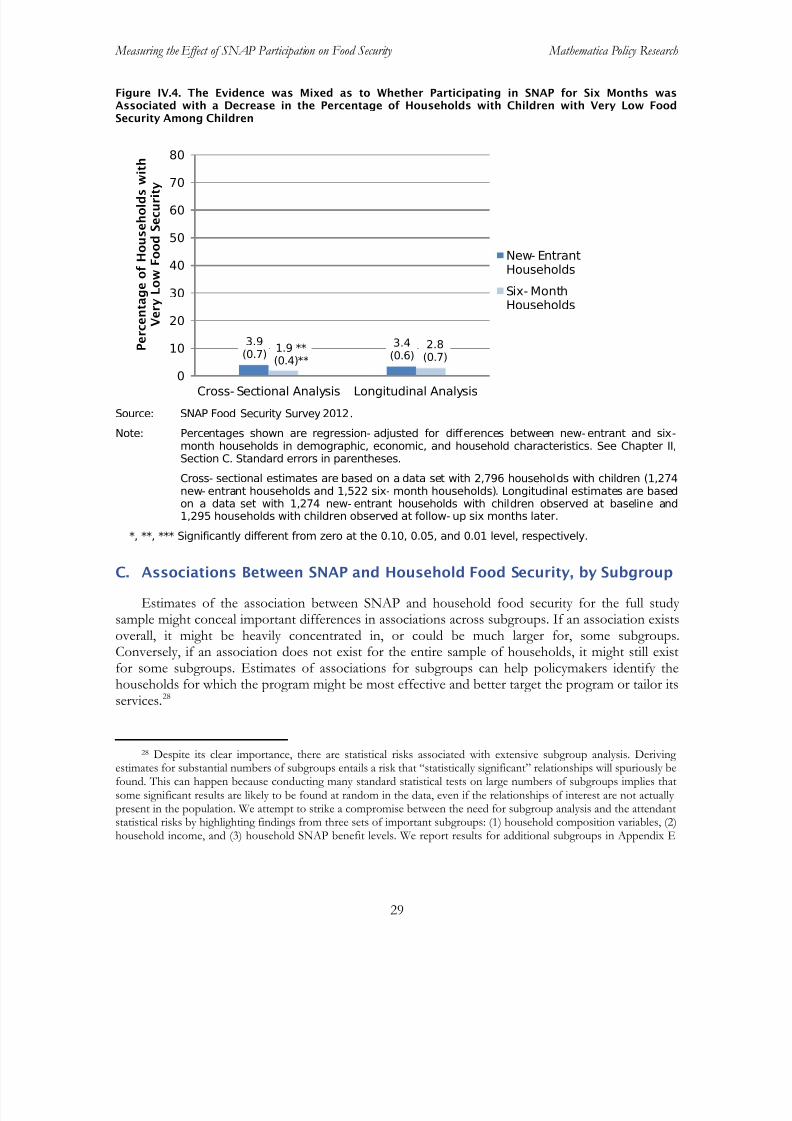
8/22/2019 USDA Report re SNAP & Food Security 08/2013
http://slidepdf.com/reader/full/usda-report-re-snap-food-security-082013 65/355
Measuring the Effect of SNAP Participation on Food Security Mathematica Policy Research
29
Figure IV.4. The Evidence was Mixed as to Whether Participating in SNAP for Six Months wasAssociated with a Decrease in the Percentage of Households with Children with Very Low FoodSecurity Among Children
Source: SNAP Food Security Survey 2012.
Note: Percentages shown are regression- adjusted for differences between new- entrant and six-month households in demographic, economic, and household characteristics. See Chapter II,Section C. Standard errors in parentheses.
Cross- sectional estimates are based on a data set with 2,796 households with children (1,274new- entrant households and 1,522 six- month households). Longitudinal estimates are basedon a data set with 1,274 new- entrant households with children observed at baseline and1,295 households with children observed at follow- up six months later.
*, **, *** Significantly different from zero at the 0.10, 0.05, and 0.01 level, respectively.
C. Associations Between SNAP and Household Food Security, by Subgroup
Estimates of the association between SNAP and household food security for the full study sample might conceal important differences in associations across subgroups. If an association existsoverall, it might be heavily concentrated in, or could be much larger for, some subgroups.Conversely, if an association does not exist for the entire sample of households, it might still existfor some subgroups. Estimates of associations for subgroups can help policymakers identify thehouseholds for which the program might be most effective and better target the program or tailor itsservices.28
28 Despite its clear importance, there are statistical risks associated with extensive subgroup analysis. Deriving
estimates for substantial numbers of subgroups entails a risk that “statistically significant” relationships will spuriously befound. This can happen because conducting many standard statistical tests on large numbers of subgroups implies thatsome significant results are likely to be found at random in the data, even if the relationships of interest are not actually present in the population. We attempt to strike a compromise between the need for subgroup analysis and the attendantstatistical risks by highlighting findings from three sets of important subgroups: (1) household composition variables, (2)household income, and (3) household SNAP benefit levels. We report results for additional subgroups in Appendix E
3.9(0.7)
3.4(0.6)
1.9 **(0.4)**
2.8(0.7)
0
10
20
30
40
50
60
70
80
Cross- Sectional Analysis Longitudinal Analysis
P e r c e n t a g e o f H o u s e h o l d s w
i t h
V e r y L o w F
o o d S e c u r i t y
New- EntrantHouseholds
Six- MonthHouseholds
8/22/2019 USDA Report re SNAP & Food Security 08/2013
http://slidepdf.com/reader/full/usda-report-re-snap-food-security-082013 66/355
Measuring the Effect of SNAP Participation on Food Security Mathematica Policy Research
30
1. Differences in Associations, by Household Composition
In this and the following sections, we present two types of analyses. First, we assess whether theindividual subgroups follow patterns that are broadly consistent with the full-sample household foodsecurity findings reported in the previous section. This essentially determines whether SNAP wasassociated with improved food security for each subgroup. Second, we assess whether themagnitudes of the associations between SNAP and food security differ across subgroups.
Presence of children in the household. In general, SNAP participation was associated withimproved food security for households with children and households without children, though forthe most part there were no statistical differences in the size of the associations for households withand without children (Table IV.1).
SNAP was also associated with a decrease in the percentage of households that had very low food security for households with children. For households without children, an association waspresent only in the longitudinal sample. The difference in the reductions in very low food security for households with and without children was statistically significant only in the cross-sectional
sample.
Presence of elderly in the household. SNAP improved food security generally only forhouseholds without an elderly member. (In the longitudinal sample, SNAP was associated with areduction in food insecurity for households with an elderly member.) In the cross-sectional sample,SNAP was associated with a larger decrease in food insecurity for households without an elderly member than for households with an elderly member. We observed similar patterns for analysis of very low food security. In both the cross-sectional and longitudinal samples, SNAP was associated with a larger decrease in very low food security for households without an elderly member than forhouseholds with an elderly member.
Presence of disabled in the household. Overall, SNAP was associated with decreases in foodinsecurity and very low food security for households with a disabled member and households without a disabled member. There were no statistical differences in the sizes the associations forhouseholds with a disabled member and households without a disabled member.
(continued)tables to allow additional analysis, as desired. Still, the subgroup analysis should be regarded as exploratory andsuggestive of possible differences in associations.
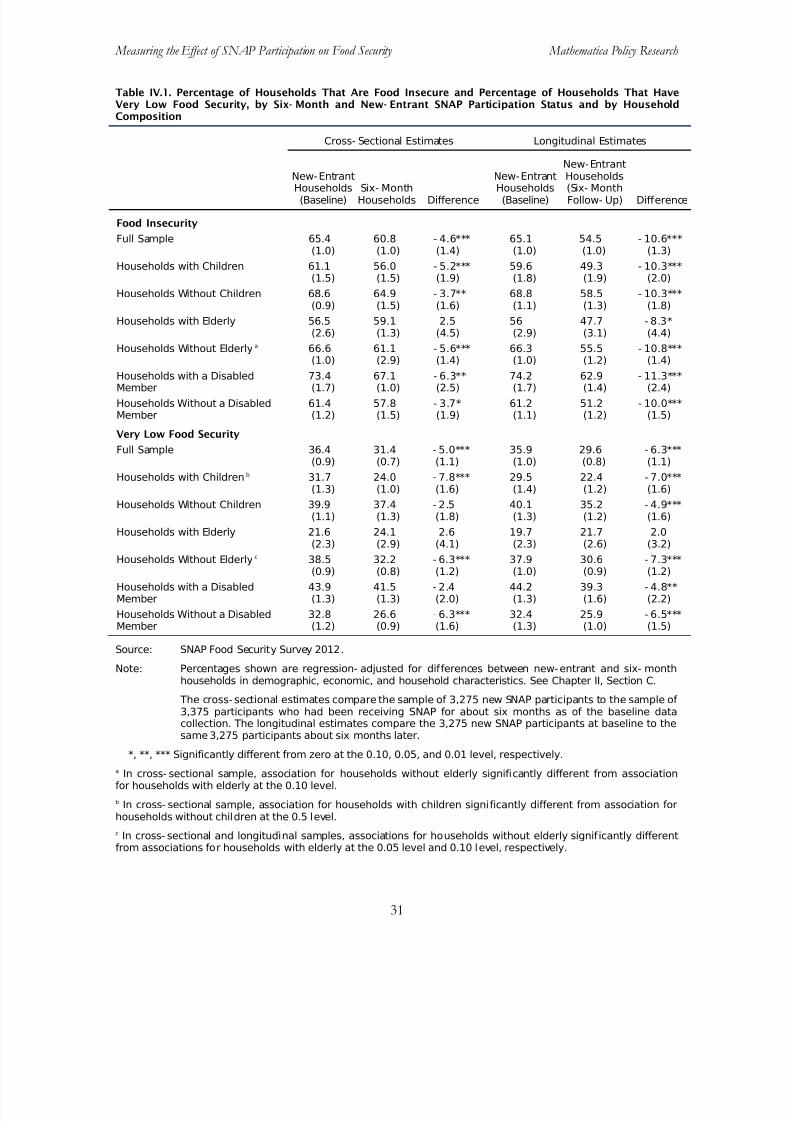
8/22/2019 USDA Report re SNAP & Food Security 08/2013
http://slidepdf.com/reader/full/usda-report-re-snap-food-security-082013 67/355
Measuring the Effect of SNAP Participation on Food Security Mathematica Policy Research
31
Table IV.1. Percentage of Households That Are Food Insecure and Percentage of Households That HaveVery Low Food Security, by Six- Month and New- Entrant SNAP Participation Status and by HouseholdComposition
Cross- Sectional Estimates Longitudinal Estimates
New-EntrantHouseholds(Baseline)
Six- MonthHouseholds Difference
New-EntrantHouseholds(Baseline)
New-EntrantHouseholds(Six- MonthFollow- Up) Difference
Food Insecurity
Full Sample 65.4(1.0)
60.8(1.0)
- 4.6***(1.4)
65.1(1.0)
54.5(1.0)
- 10.6***(1.3)
Households with Children 61.1(1.5)
56.0(1.5)
- 5.2***(1.9)
59.6(1.8)
49.3(1.9)
- 10.3***(2.0)
Households Without Children 68.6(0.9)
64.9(1.5)
- 3.7**(1.6)
68.8(1.1)
58.5(1.3)
- 10.3***(1.8)
Households with Elderly 56.5(2.6)
59.1(1.3)
2.5(4.5)
56(2.9)
47.7(3.1)
- 8.3*(4.4)
Households Without Elderly a 66.6(1.0)
61.1(2.9)
- 5.6***(1.4)
66.3(1.0)
55.5(1.2)
- 10.8***(1.4)
Households with a DisabledMember
73.4(1.7)
67.1(1.0)
- 6.3**(2.5)
74.2(1.7)
62.9(1.4)
- 11.3***(2.4)
Households Without a DisabledMember
61.4(1.2)
57.8(1.5)
- 3.7*(1.9)
61.2(1.1)
51.2(1.2)
- 10.0***(1.5)
Very Low Food Security
Full Sample 36.4(0.9)
31.4(0.7)
- 5.0***(1.1)
35.9(1.0)
29.6(0.8)
- 6.3***(1.1)
Households with Children b 31.7(1.3)
24.0(1.0)
- 7.8***(1.6)
29.5(1.4)
22.4(1.2)
- 7.0***(1.6)
Households Without Children 39.9(1.1)
37.4(1.3)
- 2.5(1.8)
40.1(1.3)
35.2(1.2)
- 4.9***(1.6)
Households with Elderly 21.6(2.3)
24.1(2.9)
2.6(4.1)
19.7(2.3)
21.7(2.6)
2.0(3.2)
Households Without Elderly c 38.5(0.9)
32.2(0.8)
- 6.3***(1.2)
37.9(1.0)
30.6(0.9)
- 7.3***(1.2)
Households with a DisabledMember
43.9(1.3)
41.5(1.3)
- 2.4(2.0)
44.2(1.3)
39.3(1.6)
- 4.8**(2.2)
Households Without a DisabledMember
32.8(1.2)
26.6(0.9)
- 6.3***(1.6)
32.4(1.3)
25.9(1.0)
- 6.5***(1.5)
Source: SNAP Food Security Survey 2012.
Note: Percentages shown are regression- adjusted for differences between new-entrant and six- monthhouseholds in demographic, economic, and household characteristics. See Chapter II, Section C.
The cross- sectional estimates compare the sample of 3,275 new SNAP participants to the sample of 3,375 participants who had been receiving SNAP for about six months as of the baseline datacollection. The longitudinal estimates compare the 3,275 new SNAP participants at baseline to the
same 3,275 participants about six months later.
*, **, *** Significantly different from zero at the 0.10, 0.05, and 0.01 level, respectively.
a In cross- sectional sample, association for households without elderly significantly different from associationfor households with elderly at the 0.10 level.
b In cross- sectional sample, association for households with children significantly different from association forhouseholds without children at the 0.5 level.
c In cross- sectional and longitudinal samples, associations for households without elderly significantly differentfrom associations for households with elderly at the 0.05 level and 0.10 level, respectively.

8/22/2019 USDA Report re SNAP & Food Security 08/2013
http://slidepdf.com/reader/full/usda-report-re-snap-food-security-082013 68/355
Measuring the Effect of SNAP Participation on Food Security Mathematica Policy Research
32
2. Differences in Associations, by Household Income
We examined associations between SNAP and food security for five income groups using monthly household income relative to the Federal poverty threshold. These groups were (1) zeromonthly income; (2) income between 1 and 50 percent of poverty; (3) income between 51 and 100percent of poverty; (4) income between 101 and 130 percent of poverty; and (5) income more than130 percent of poverty.29
For the longitudinal sample, the results closely mirror those for the full sample, with all theestimated associations showing reductions in food insecurity and very low food security and most of them being statistically significant (Table IV.2). The findings for the cross-sectional sample were notconsistent with those for the longitudinal sample. Although the signs on the associations betweenSNAP and food insecurity and very low food security were negative, they were not statistically significant for several income subgroups. SNAP was associated with a decrease in food insecurity only for households with income between 1 and 50 percent of poverty and between 51 and 100percent of poverty. For very low food security, the set of households with income between 51 and100 percent of poverty was the only subgroup for which SNAP was associated with a decrease in
very low food security.
The size of the association between SNAP and food security generally differed by incomegroup as evidenced by our rejection of the hypothesis that the associations for all the income groups were the same based on the appropriate test statistic for that joint hypothesis. There was, whengroups were considered individually, one statistically significant difference between the associationfor a group and the association for all other households. Specifically, for very low food security, theassociation for households with income between 51 and 100 percent of poverty was significantly different from the association for all other households in the cross-sectional sample.
3. Differences in Associations, by SNAP Benefit Amount
SNAP was associated with an improvement in food security for most benefit amountsubgroups (Table IV.3). The differences across benefit groups in the associations between SNAPand food insecurity were not statistically significant at the 0.10 level. For both the cross-sectionaland longitudinal samples, however, we rejected the hypothesis that the associations between SNAPand very low food security for all the benefit groups were the same. In both samples, when groups were considered individually, the reduction in very low food security was statistically larger forhouseholds that received large benefits (exceeding about 85 percent of the maximum benefit forhousehold size) than for households that received small or medium benefits. The reduction forhouseholds that received large benefits was -9.7 percentage points in the cross-sectional sample and-12.5 percentage points in the longitudinal sample.
29 The amount of SNAP benefits received by each household was not included among the set of explanatory variables in the regressions.
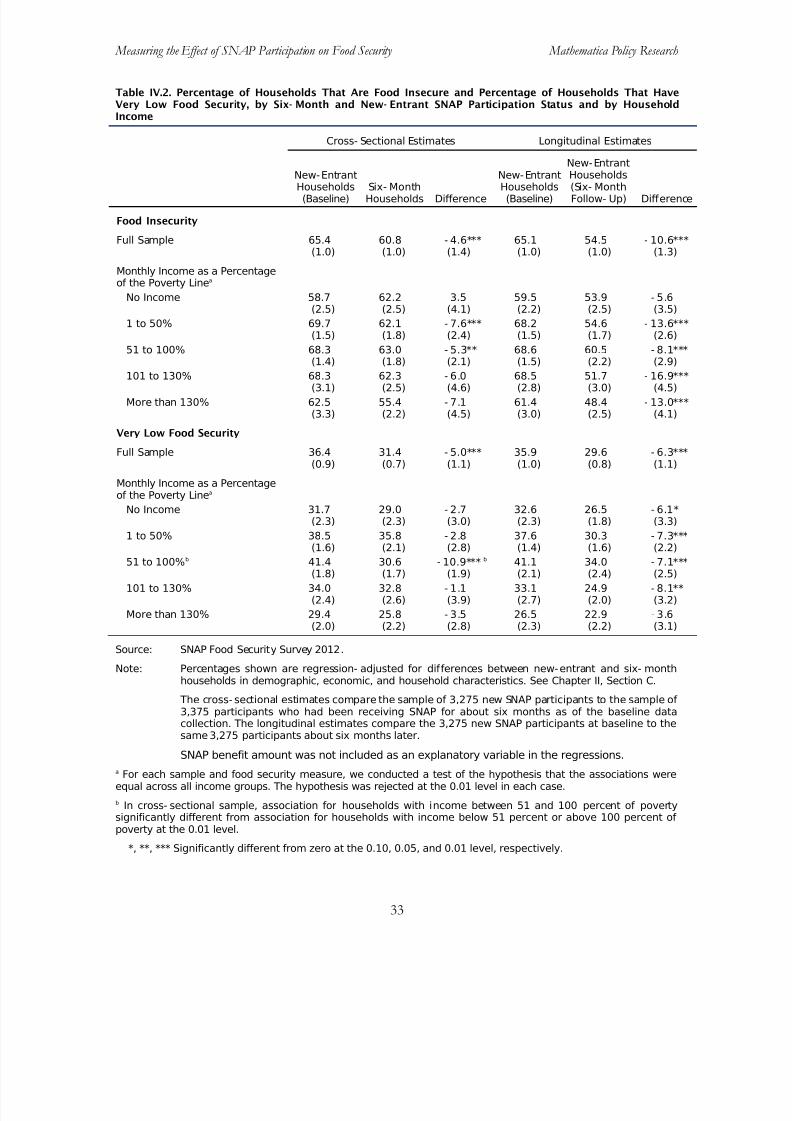
8/22/2019 USDA Report re SNAP & Food Security 08/2013
http://slidepdf.com/reader/full/usda-report-re-snap-food-security-082013 69/355
Measuring the Effect of SNAP Participation on Food Security Mathematica Policy Research
33
Table IV.2. Percentage of Households That Are Food Insecure and Percentage of Households That HaveVery Low Food Security, by Six- Month and New- Entrant SNAP Participation Status and by HouseholdIncome
Cross- Sectional Estimates Longitudinal Estimates
New-Entrant
Households(Baseline)
Six- MonthHouseholds Difference
New-Entrant
Households(Baseline)
New-EntrantHouseholds
(Six- MonthFollow- Up) Difference
Food Insecurity
Full Sample 65.4(1.0)
60.8(1.0)
- 4.6***(1.4)
65.1(1.0)
54.5(1.0)
- 10.6***(1.3)
Monthly Income as a Percentageof the Poverty Linea
No Income 58.7(2.5)
62.2(2.5)
3.5(4.1)
59.5(2.2)
53.9(2.5)
- 5.6(3.5)
1 to 50% 69.7(1.5)
62.1(1.8)
- 7.6***(2.4)
68.2(1.5)
54.6(1.7)
- 13.6***(2.6)
51 to 100% 68.3(1.4)
63.0(1.8)
- 5.3**(2.1)
68.6(1.5)
60.5(2.2)
- 8.1***(2.9)
101 to 130% 68.3(3.1)
62.3(2.5)
- 6.0(4.6)
68.5(2.8)
51.7(3.0)
- 16.9***(4.5)
More than 130% 62.5(3.3)
55.4(2.2)
- 7.1(4.5)
61.4(3.0)
48.4(2.5)
- 13.0***(4.1)
Very Low Food Security
Full Sample 36.4(0.9)
31.4(0.7)
- 5.0***(1.1)
35.9(1.0)
29.6(0.8)
- 6.3***(1.1)
Monthly Income as a Percentageof the Poverty Linea
No Income 31.7(2.3)
29.0(2.3)
- 2.7(3.0)
32.6(2.3)
26.5(1.8)
- 6.1*(3.3)
1 to 50% 38.5
(1.6)
35.8
(2.1)
- 2.8
(2.8)
37.6
(1.4)
30.3
(1.6)
- 7.3***
(2.2)51 to 100%b 41.4
(1.8)30.6(1.7)
- 10.9*** b (1.9)
41.1(2.1)
34.0(2.4)
- 7.1***(2.5)
101 to 130% 34.0(2.4)
32.8(2.6)
- 1.1(3.9)
33.1(2.7)
24.9(2.0)
- 8.1**(3.2)
More than 130% 29.4(2.0)
25.8(2.2)
- 3.5(2.8)
26.5(2.3)
22.9(2.2)
- 3.6(3.1)
Source: SNAP Food Security Survey 2012.
Note: Percentages shown are regression- adjusted for differences between new-entrant and six- monthhouseholds in demographic, economic, and household characteristics. See Chapter II, Section C.
The cross- sectional estimates compare the sample of 3,275 new SNAP participants to the sample of 3,375 participants who had been receiving SNAP for about six months as of the baseline datacollection. The longitudinal estimates compare the 3,275 new SNAP participants at baseline to the
same 3,275 participants about six months later.
SNAP benefit amount was not included as an explanatory variable in the regressions.
a For each sample and food security measure, we conducted a test of the hypothesis that the associations wereequal across all income groups. The hypothesis was rejected at the 0.01 level in each case.
b In cross- sectional sample, association for households with income between 51 and 100 percent of povertysignificantly different from association for households with income below 51 percent or above 100 percent of poverty at the 0.01 level.
*, **, *** Significantly different from zero at the 0.10, 0.05, and 0.01 level, respectively.
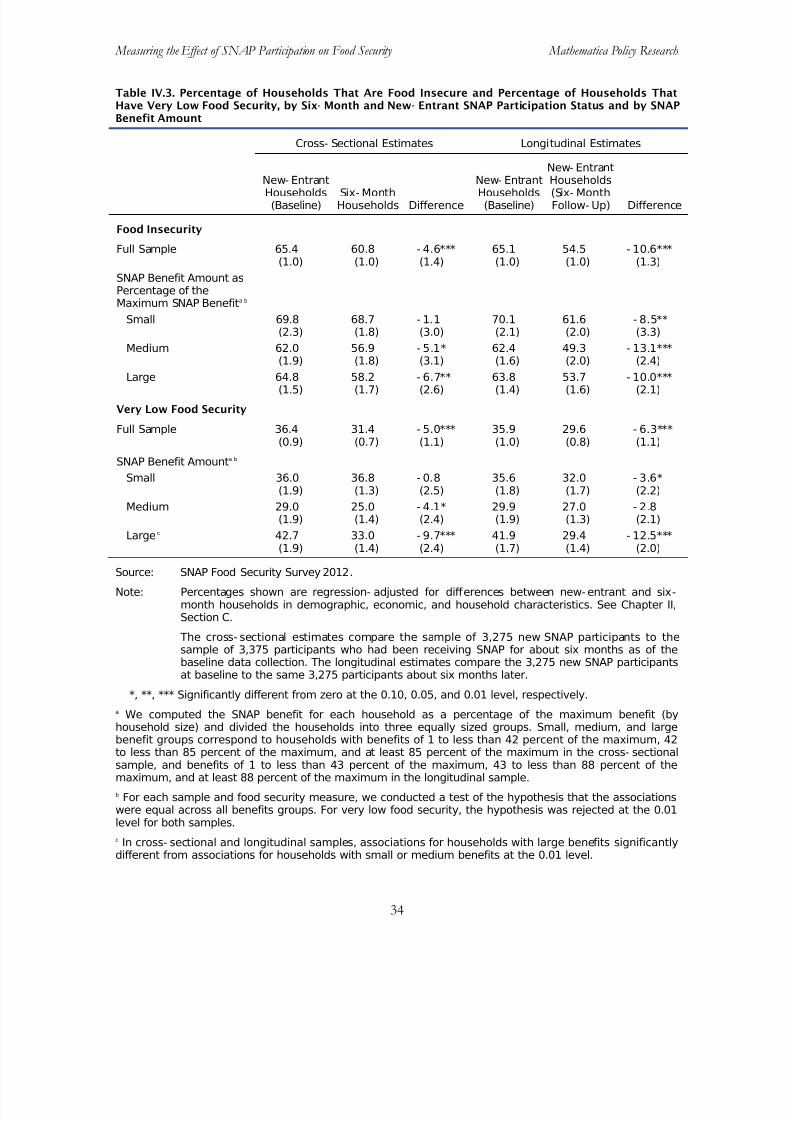
8/22/2019 USDA Report re SNAP & Food Security 08/2013
http://slidepdf.com/reader/full/usda-report-re-snap-food-security-082013 70/355
Measuring the Effect of SNAP Participation on Food Security Mathematica Policy Research
34
Table IV.3. Percentage of Households That Are Food Insecure and Percentage of Households ThatHave Very Low Food Security, by Six- Month and New- Entrant SNAP Participation Status and by SNAPBenefit Amount
Cross- Sectional Estimates Longitudinal Estimates
New- EntrantHouseholds(Baseline)
Six- MonthHouseholds Difference
New- EntrantHouseholds(Baseline)
New- Entrant
Households(Six- MonthFollow- Up) Difference
Food Insecurity
Full Sample 65.4(1.0)
60.8(1.0)
- 4.6***(1.4)
65.1(1.0)
54.5(1.0)
- 10.6***(1.3)
SNAP Benefit Amount asPercentage of theMaximum SNAP Benefita b
Small 69.8(2.3)
68.7(1.8)
- 1.1(3.0)
70.1(2.1)
61.6(2.0)
- 8.5**(3.3)
Medium 62.0(1.9)
56.9(1.8)
- 5.1*(3.1)
62.4(1.6)
49.3(2.0)
- 13.1***(2.4)
Large 64.8(1.5)
58.2(1.7)
- 6.7**(2.6)
63.8(1.4)
53.7(1.6)
- 10.0***(2.1)
Very Low Food Security
Full Sample 36.4(0.9)
31.4(0.7)
- 5.0***(1.1)
35.9(1.0)
29.6(0.8)
- 6.3***(1.1)
SNAP Benefit Amounta b
Small 36.0(1.9)
36.8(1.3)
- 0.8(2.5)
35.6(1.8)
32.0(1.7)
- 3.6*(2.2)
Medium 29.0(1.9)
25.0(1.4)
- 4.1*(2.4)
29.9(1.9)
27.0(1.3)
- 2.8(2.1)
Large c 42.7
(1.9)
33.0
(1.4)
- 9.7***
(2.4)
41.9
(1.7)
29.4
(1.4)
- 12.5***
(2.0)
Source: SNAP Food Security Survey 2012.
Note: Percentages shown are regression- adjusted for differences between new- entrant and six-month households in demographic, economic, and household characteristics. See Chapter II,Section C.
The cross- sectional estimates compare the sample of 3,275 new SNAP participants to thesample of 3,375 participants who had been receiving SNAP for about six months as of thebaseline data collection. The longitudinal estimates compare the 3,275 new SNAP participantsat baseline to the same 3,275 participants about six months later.
*, **, *** Significantly different from zero at the 0.10, 0.05, and 0.01 level, respectively.
a We computed the SNAP benefit for each household as a percentage of the maximum benefit (byhousehold size) and divided the households into three equally sized groups. Small, medium, and largebenefit groups correspond to households with benefits of 1 to less than 42 percent of the maximum, 42to less than 85 percent of the maximum, and at least 85 percent of the maximum in the cross- sectionalsample, and benefits of 1 to less than 43 percent of the maximum, 43 to less than 88 percent of themaximum, and at least 88 percent of the maximum in the longitudinal sample.
b For each sample and food security measure, we conducted a test of the hypothesis that the associationswere equal across all benefits groups. For very low food security, the hypothesis was rejected at the 0.01level for both samples.
c In cross- sectional and longitudinal samples, associations for households with large benefits significantlydifferent from associations for households with small or medium benefits at the 0.01 level.
8/22/2019 USDA Report re SNAP & Food Security 08/2013
http://slidepdf.com/reader/full/usda-report-re-snap-food-security-082013 71/355
Measuring the Effect of SNAP Participation on Food Security Mathematica Policy Research
35
4. Summary of Subgroup Findings
For the most part, the results of the subgroup analysis discussed above are consistent witheffects observed for the full sample. Most of the household composition subgroups examined hadassociations similar to the full-sample results. When subgroups defined by income relative to poverty are examined, there is wider variation in general in the estimated associations, but most areimprovements in food security, and at least half are statistically significant. (Notably, however, abouthalf of the associations for income subgroups are not statistically significant.) For most of thebenefit amount subgroups, the estimated associations show improvements in food security.
Only a relatively small number of differences across subgroups are statistically significant. In thehousehold composition subgroup analysis, the only finding that is fairly consistent across samplesand measures of food security is that SNAP improved food security for households without anelderly member, but not for households with an elderly member. In the income subgroup analysis,the associations between SNAP and food security generally did not differ by household incomerelative to the poverty threshold. The associations do differ by SNAP benefit amount, however,such that the improvement in food security was larger for households that received large benefits
(exceeding about 85 percent of the maximum benefit for household size) than for households thatreceived small or medium benefits.

8/22/2019 USDA Report re SNAP & Food Security 08/2013
http://slidepdf.com/reader/full/usda-report-re-snap-food-security-082013 72/355
This page has been left blank for double-sided copying.

8/22/2019 USDA Report re SNAP & Food Security 08/2013
http://slidepdf.com/reader/full/usda-report-re-snap-food-security-082013 73/355
Measuring the Effect of SNAP Participation on Food Security Mathematica Policy Research
37
V. SNAP AND HOUSEHOLD FOOD EXPENDITURES
This chapter presents estimates of the association between SNAP participation and householdfood expenditures. Sections A through C discuss the findings for the full sample and subgroupsusing the same procedures as in Chapter IV. Then, we conducted a number of sensitivity tests onalternative specifications, summarized in Section D. Also in Section D, we discuss concerns aboutthe food expenditure data for new-entrant households. Section E presents findings using alternativetechniques (prevalent in the related literature) that rely only on the data for six-month households.
As discussed in Chapter II, the SNAPFS survey asked respondents what they actually spent onfood during the previous week and then asked what they usually spent on food in a typical week. Pastdata on usual expenditures collected using this module have been shown to be consistent withestimates from the Consumer Expenditure Survey, the principal source of data on U.S. householdexpenditures for goods and services (Nord 2009). In light of this, we have focused on usual weekly food expenditures, rather than expenditures the previous week, as our main outcome measure.
A. Associations Between SNAP and Usual Food Expenditures
Regression-adjusted usual food spending was not statistically different for new-entrant and six-month households (Figure V.1). In the cross-sectional sample, new-entrant households usually spent$93.28 per week, and six-month households spent $94.91. In the longitudinal sample, new-entranthouseholds spent $90.79 per week, and six-month households spent $93.10.
Figure V.1. Participating in SNAP for Six Months was Not Associated with a Change in Usual WeeklyHousehold Food Spending
Source: SNAP Food Security Survey 2012.
Note: Average expenditure levels shown are regression- adjusted for differences between new-entrantand six- month households in demographic, economic, and household characteristics. See ChapterII, Section C. Standard errors in parentheses.
The cross- sectional estimates compare the sample of 3,275 new SNAP participants to the sample of 3,375 participants who had been receiving SNAP for about six months as of the baseline datacollection. The longitudinal estimates compare the 3,275 new SNAP participants at baseline to thesame 3,275 participants about six months later.
*, **, *** Significantly different from zero at the 0.10, 0.05, and 0.01 level, respectively.
$93.28(1.45)
$90.79(1.40)
$94.91(1.23) $93.10
(1.45)
0
20
40
60
80
100
120
Cross- Sectional Analysis Longitudinal Analysis
F o o d E x p e n d i t u r e s ( D o l l a r s )
New- EntrantHouseholds
Six- MonthHouseholds

8/22/2019 USDA Report re SNAP & Food Security 08/2013
http://slidepdf.com/reader/full/usda-report-re-snap-food-security-082013 74/355
Measuring the Effect of SNAP Participation on Food Security Mathematica Policy Research
38
B. Associations Between SNAP and Usual Food Expenditures Relative tothe Cost of the TFP
In the cross-sectional sample, SNAP participation was associated with a 5 percentage pointincrease in usual expenditures relative to the cost of the TFP (significant at the 0.10 level). Usualexpenditures that were, on average, 21 percent larger than the cost of the TFP for six-monthhouseholds were 16 percent larger than the cost of the TFP for new-entrant households. In thelongitudinal sample, the usual weekly spending relative to the cost of the TFP was not statistically different between new-entrant households and six-month households. 30
Figure V.2. The Evidence was Mixed as to Whether Participating in SNAP for Six Months wasAssociated with a Change in Usual Weekly Household Food Spending Relative to the Cost of the TFP
Source: SNAP Food Security Survey 2012.
Note: Average expenditures levels shown are regression- adjusted for differences between new-entrant and six- month households in demographic, economic, and household characteristics.See Chapter II, Section C.
The cross- sectional estimates compare the sample of 3,275 new SNAP participants to thesample of 3,375 participants who had been receiving SNAP for about six months as of thebaseline data collection. The longitudinal estimates compare the 3,275 new SNAP participantsat baseline to the same 3,275 participants about six months later.
*, **, *** Significantly different from zero at the 0.10, 0.05, and 0.01 level, respectively.
30 The change in the average monthly cost of the TFP for a family of four (two adults ages 19 to 50, one child age2 to 3, and a second child age 4 to 5) from the baseline to the follow-up period was 0.5 percent (less than one percentagepoint), with average monthly costs increasing from $125.62 to $126.20. The lack of a statistically significant associationbetween SNAP and TFP-adjusted usual food expenditures in the longitudinal analysis was robust to using the average TFP cost in the baseline period in place of the actual monthly TFP cost in the follow up period (deflating the TFP costfor each household in the follow up period). This suggests that changes in food prices do not explain the lack of asignificant association in the longitudinal analysis.
1.16(0.02)
1.16(0.02)
1.21 *(0.02)* 1.19
(0.02)
1.00
1.05
1.10
1.15
1.20
1.25
Cross- Sectional Analysis Longitudinal Analysis
F o o d E x p e n d i t u r e s R e l a t i v e t o t h e
C o s t o f t h e T F P
New- EntrantHouseholds
Six- MonthHouseholds
8/22/2019 USDA Report re SNAP & Food Security 08/2013
http://slidepdf.com/reader/full/usda-report-re-snap-food-security-082013 75/355
Measuring the Effect of SNAP Participation on Food Security Mathematica Policy Research
39
C. Associations Between SNAP and Household Food Spending, bySubgroup
As with food security in the previous chapter, we examined the association between SNAPparticipation and food expenditures (both in dollars and relative to the cost of the TFP) for severalsubgroups of the sample. Although food security was found to be associated with SNAPparticipation for the full sample and several subgroups, we found few significant associationsbetween SNAP participation and food expenditures that were consistent across both the cross-sectional and longitudinal samples. An exception was the set of subgroups defined by SNAP benefitamount. In this section, we present findings about whether SNAP was associated with foodspending for each subgroup and whether the magnitudes of the associations between SNAP andfood spending differed across subgroups.
1. Differences in Associations, by Household Composition
There were few significant associations between SNAP participation and food spending, as wellas between SNAP and food spending relative to the cost of the TFP, for household composition
subgroups (Table V.1). In the cross-sectional sample, SNAP was associated with 0.05 to 0.09 unitincreases in TFP-adjusted food spending for households without children, households withoutelderly, and households without a disabled member; there were no significant associations for thesegroups in the longitudinal sample.
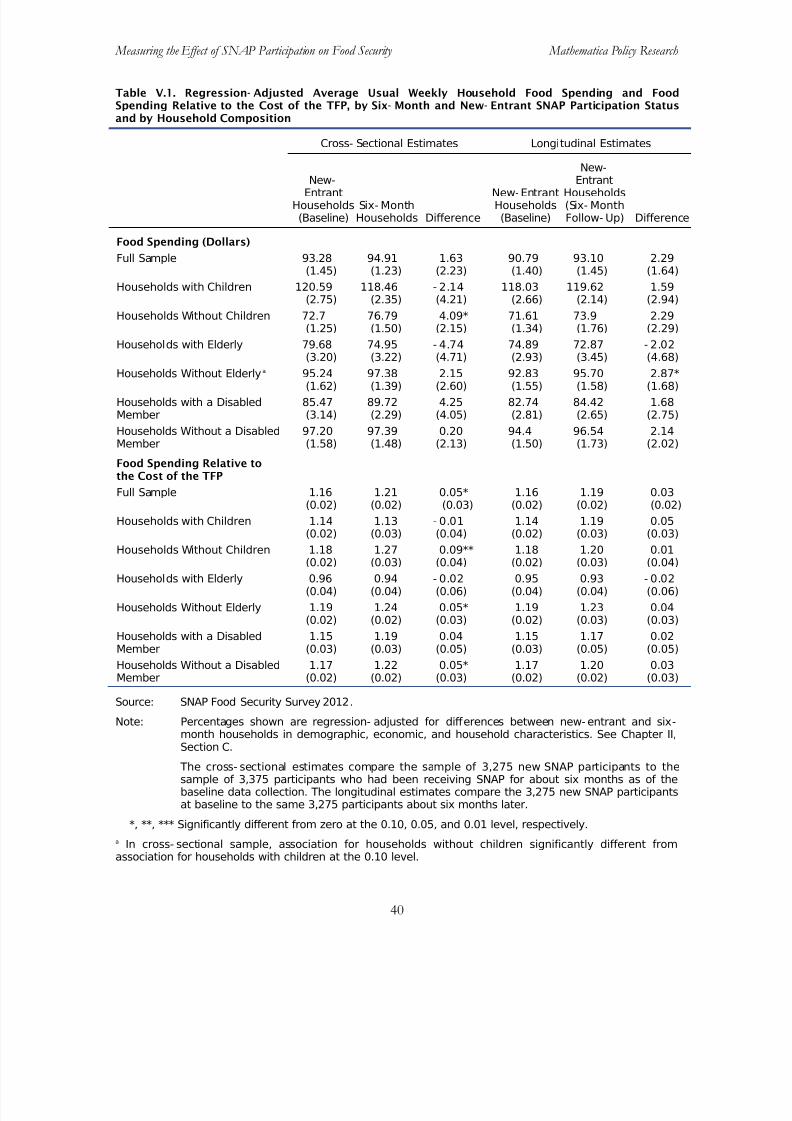
8/22/2019 USDA Report re SNAP & Food Security 08/2013
http://slidepdf.com/reader/full/usda-report-re-snap-food-security-082013 76/355
Measuring the Effect of SNAP Participation on Food Security Mathematica Policy Research
40
Table V.1. Regression- Adjusted Average Usual Weekly Household Food Spending and FoodSpending Relative to the Cost of the TFP, by Six- Month and New- Entrant SNAP Participation Statusand by Household Composition
Cross- Sectional Estimates Longitudinal Estimates
New-EntrantHouseholds(Baseline)
Six- MonthHouseholds Difference
New-EntrantHouseholds(Baseline)
New-
EntrantHouseholds(Six- MonthFollow- Up) Difference
Food Spending (Dollars)
Full Sample 93.28(1.45)
94.91(1.23)
1.63(2.23)
90.79(1.40)
93.10(1.45)
2.29(1.64)
Households with Children 120.59(2.75)
118.46(2.35)
- 2.14(4.21)
118.03(2.66)
119.62(2.14)
1.59(2.94)
Households Without Children 72.7(1.25)
76.79(1.50)
4.09*(2.15)
71.61(1.34)
73.9(1.76)
2.29(2.29)
Households with Elderly 79.68(3.20)
74.95(3.22)
- 4.74(4.71)
74.89(2.93)
72.87(3.45)
- 2.02(4.68)
Households Without Elderlya 95.24(1.62)
97.38(1.39)
2.15(2.60)
92.83(1.55)
95.70(1.58)
2.87*(1.68)
Households with a DisabledMember
85.47(3.14)
89.72(2.29)
4.25(4.05)
82.74(2.81)
84.42(2.65)
1.68(2.75)
Households Without a DisabledMember
97.20(1.58)
97.39(1.48)
0.20(2.13)
94.4(1.50)
96.54(1.73)
2.14(2.02)
Food Spending Relative tothe Cost of the TFP
Full Sample 1.16(0.02)
1.21(0.02)
0.05*(0.03)
1.16(0.02)
1.19(0.02)
0.03(0.02)
Households with Children 1.14(0.02)
1.13(0.03)
- 0.01(0.04)
1.14(0.02)
1.19(0.03)
0.05(0.03)
Households Without Children 1.18(0.02)
1.27(0.03)
0.09**(0.04)
1.18(0.02)
1.20(0.03)
0.01(0.04)
Households with Elderly 0.96(0.04)
0.94(0.04)
- 0.02(0.06)
0.95(0.04)
0.93(0.04)
- 0.02(0.06)
Households Without Elderly 1.19(0.02)
1.24(0.02)
0.05*(0.03)
1.19(0.02)
1.23(0.03)
0.04(0.03)
Households with a DisabledMember
1.15(0.03)
1.19(0.03)
0.04(0.05)
1.15(0.03)
1.17(0.05)
0.02(0.05)
Households Without a DisabledMember
1.17(0.02)
1.22(0.02)
0.05*(0.03)
1.17(0.02)
1.20(0.02)
0.03(0.03)
Source: SNAP Food Security Survey 2012.
Note: Percentages shown are regression- adjusted for differences between new- entrant and six-
month households in demographic, economic, and household characteristics. See Chapter II,Section C.
The cross- sectional estimates compare the sample of 3,275 new SNAP participants to thesample of 3,375 participants who had been receiving SNAP for about six months as of thebaseline data collection. The longitudinal estimates compare the 3,275 new SNAP participantsat baseline to the same 3,275 participants about six months later.
*, **, *** Significantly different from zero at the 0.10, 0.05, and 0.01 level, respectively.
a In cross- sectional sample, association for households without children significantly different fromassociation for households with children at the 0.10 level.
8/22/2019 USDA Report re SNAP & Food Security 08/2013
http://slidepdf.com/reader/full/usda-report-re-snap-food-security-082013 77/355
Measuring the Effect of SNAP Participation on Food Security Mathematica Policy Research
41
2. Differences in Associations, by Household Income
We examined associations between SNAP and food spending for five income groups using monthly household income relative to the Federal poverty threshold. These groups were (1) zeromonthly income; (2) income between 1 and 50 percent of poverty; (3) income between 51 and 100percent of poverty; (4) income between 101 and 130 percent of poverty; and (5) income more than130 percent of poverty.31
SNAP was associated with a 0.16 and 0.13 unit increase in food spending relative to the cost of the TFP for households with income between 1 and 50 percent of poverty in the cross-sectional andlongitudinal samples, respectively. While SNAP was associated with an increase in TFP-adjustedfood spending of 0.17 for households with income between 101 and 130 percent of poverty in thecross-sectional sample, it was associated with a decrease of 0.12 for households with income morethan 130 percent of poverty.
3. Differences in Associations, by SNAP Benefit Amount
SNAP was associated with an increase in food spending and food spending relative to the costof the TFP for large benefit amount subgroups (whose benefits exceeded about 85 percent of themaximum benefit for household size) (Table V.3). The increase in food spending relative to the costof the TFP for households that received large benefits was 0.18 in the cross-sectional sample and0.16 in the longitudinal sample. While there were no associations between SNAP and TFP-adjustedfood spending for households that received medium benefits, SNAP was associated with a decreasein food spending relative to the cost of the TFP for households that received small benefits.
31 The amount of SNAP benefits received by each household was not included among the set of explanatory variables in the regressions.

8/22/2019 USDA Report re SNAP & Food Security 08/2013
http://slidepdf.com/reader/full/usda-report-re-snap-food-security-082013 78/355
Measuring the Effect of SNAP Participation on Food Security Mathematica Policy Research
42
Table V.2. Regression- Adjusted Average Usual Weekly Household Food Spending and Food SpendingRelative to the Cost of the TFP, by Six- Month and New- Entrant SNAP Participation Status and byHousehold Income
Cross- Sectional Estimates Longitudinal Estimates
New-Entrant
Households(Baseline)
Six- MonthHouseholds Difference
New-Entrant
Households(Baseline)
New-EntrantHouseholds
(Six- MonthFollow- Up) Difference
Food Spending (Dollars)
Full Sample 93.28(1.45)
94.91(1.23)
1.63(2.23)
90.79(1.40)
93.10(1.45)
2.29(1.64)
Monthly Income as a Percentageof the Poverty Line
No Income 90.88(2.67)
90.89(2.85)
0.01(4.21)
88.41(2.59)
89.3(3.92)
0.89(4.41)
1 to 50% 95.06(2.56)
102.29(3.24)
7.23(5.14)
91.24(2.39)
99.15(2.93)
7.91*(4.38)
51 to 100% 95.00(2.88)
94.78(2.54)
- 0.22(4.19)
91.89(2.55)
93.07(2.49)
1.19(3.72)
101 to 130%a 83.56(3.00)
96.47(4.90)
12.91**(6.31)
84.78(2.65)
87.81(3.37)
3.03(3.90)
More than 130% 98.21(3.28)
88.39(2.22)
- 9.82**(4.28)
94.85(3.25)
94.85(3.76)
0.00(3.71)
Food Spending Relative to theCost of the TFP
Full Sample 1.16(0.02)
1.21(0.02)
0.05*(0.03)
1.16(0.02)
1.19(0.02)
0.03(0.02)
Monthly Income as a Percentageof the Poverty Line
No Income 1.26(0.04)
1.26(0.05)
0.00(0.06)
1.27(0.04)
1.26(0.05)
- 0.01(0.07)
1 to 50%b 1.14(0.03)
1.31(0.04)
0.16***(0.06)
1.13(0.03)
1.26(0.04)
0.13**(0.05)
51 to 100% 1.14(0.03) 1.17(0.03) 0.02(0.05) 1.14(0.03) 1.14(0.03) 0.00(0.05)
101 to 130%a 1.04(0.04)
1.21(0.05)
0.17**(0.07)
1.06(0.03)
1.08(0.04)
0.02(0.04)
More than 130%c 1.18(0.03)
1.07(0.03)
- 0.12**(0.05)
1.17(0.03)
1.17(0.07)
0.00(0.07)
Source: SNAP Food Security Survey 2012.
Note: Percentages shown are regression- adjusted for differences between new-entrant and six- monthhouseholds in demographic, economic, and household characteristics. See Chapter II, Section C.
The cross- sectional estimates compare the sample of 3,275 new SNAP participants to the sample of 3,375 participants who had been receiving SNAP for about six months as of the baseline datacollection. The longitudinal estimates compare the 3,275 new SNAP participants at baseline to thesame 3,275 participants about six months later.
SNAP benefit amount was not included as an explanatory variable in the regressions.a In the cross- sectional sample association for households with income between 101 and 130 percent of povertysignificantly different from association for households with income below 101 percent or above 130 percent of poverty at the 0.10 level.
b Associations for households with income between 1 and 50 percent of poverty significantly different fromassociation for households with no income or with income at or above 51 percent of poverty at the 0.05 level inboth the cross- sectional and longitudinal samples.
c Association for households with income above 130 percent of poverty significantly different from associationfor households with income below 130 percent of poverty at the 0.01 level in the cross- sectional sample.
*, **, *** Significantly different from zero at the 0.10, 0.05, and 0.01 level, respectively.
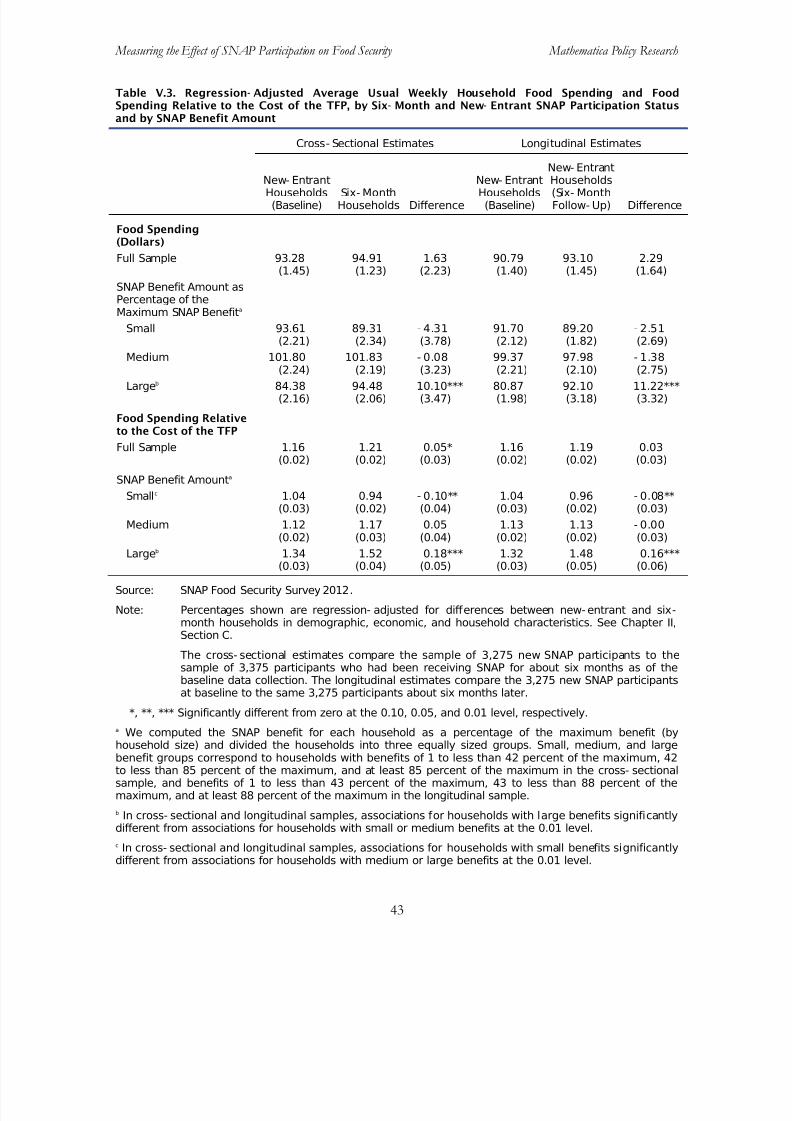
8/22/2019 USDA Report re SNAP & Food Security 08/2013
http://slidepdf.com/reader/full/usda-report-re-snap-food-security-082013 79/355
Measuring the Effect of SNAP Participation on Food Security Mathematica Policy Research
43
Table V.3. Regression- Adjusted Average Usual Weekly Household Food Spending and FoodSpending Relative to the Cost of the TFP, by Six- Month and New- Entrant SNAP Participation Statusand by SNAP Benefit Amount
Cross- Sectional Estimates Longitudinal Estimates
New- EntrantHouseholds(Baseline)
Six- MonthHouseholds Difference
New- EntrantHouseholds(Baseline)
New- Entrant
Households(Six- MonthFollow- Up) Difference
Food Spending(Dollars)
Full Sample 93.28(1.45)
94.91(1.23)
1.63(2.23)
90.79(1.40)
93.10(1.45)
2.29(1.64)
SNAP Benefit Amount asPercentage of theMaximum SNAP Benefita
Small 93.61(2.21)
89.31(2.34)
- 4.31(3.78)
91.70(2.12)
89.20(1.82)
- 2.51(2.69)
Medium 101.80
(2.24)
101.83
(2.19)
- 0.08
(3.23)
99.37
(2.21)
97.98
(2.10)
- 1.38
(2.75)
Largeb 84.38(2.16)
94.48(2.06)
10.10***(3.47)
80.87(1.98)
92.10(3.18)
11.22***(3.32)
Food Spending Relativeto the Cost of the TFP
Full Sample 1.16(0.02)
1.21(0.02)
0.05*(0.03)
1.16(0.02)
1.19(0.02)
0.03(0.03)
SNAP Benefit Amounta
Smallc 1.04(0.03)
0.94(0.02)
- 0.10**(0.04)
1.04(0.03)
0.96(0.02)
- 0.08**(0.03)
Medium 1.12(0.02)
1.17(0.03)
0.05(0.04)
1.13(0.02)
1.13(0.02)
- 0.00(0.03)
Largeb 1.34(0.03)
1.52(0.04)
0.18***(0.05)
1.32(0.03)
1.48(0.05)
0.16***(0.06)
Source: SNAP Food Security Survey 2012.
Note: Percentages shown are regression- adjusted for differences between new- entrant and six-month households in demographic, economic, and household characteristics. See Chapter II,Section C.
The cross- sectional estimates compare the sample of 3,275 new SNAP participants to thesample of 3,375 participants who had been receiving SNAP for about six months as of thebaseline data collection. The longitudinal estimates compare the 3,275 new SNAP participantsat baseline to the same 3,275 participants about six months later.
*, **, *** Significantly different from zero at the 0.10, 0.05, and 0.01 level, respectively.
a
We computed the SNAP benefit for each household as a percentage of the maximum benefit (byhousehold size) and divided the households into three equally sized groups. Small, medium, and largebenefit groups correspond to households with benefits of 1 to less than 42 percent of the maximum, 42to less than 85 percent of the maximum, and at least 85 percent of the maximum in the cross- sectionalsample, and benefits of 1 to less than 43 percent of the maximum, 43 to less than 88 percent of themaximum, and at least 88 percent of the maximum in the longitudinal sample.
b In cross- sectional and longitudinal samples, associations for households with large benefits significantlydifferent from associations for households with small or medium benefits at the 0.01 level.
c In cross- sectional and longitudinal samples, associations for households with small benefits significantlydifferent from associations for households with medium or large benefits at the 0.01 level.
8/22/2019 USDA Report re SNAP & Food Security 08/2013
http://slidepdf.com/reader/full/usda-report-re-snap-food-security-082013 80/355
Measuring the Effect of SNAP Participation on Food Security Mathematica Policy Research
44
4. Summary of Subgroup Findings
We found no evidence of an association between SNAP and food spending for most householdsubgroups. Several exceptions include households with income between 1 and 50 percent of poverty and households with large benefits (exceeding about 85 percent of the maximum benefit forhousehold size). For these households, SNAP was associated with an increase in food spending relative to the cost of the TFP in both the cross-sectional and longitudinal samples. Notably,however, for households with small benefits SNAP was associated with a decrease in TFP-adjustedfood spending.
D. Additional Results
Given the association between SNAP participation and food security, we were surprised to findso few associations between SNAP and food spending. Economic theory suggests that, if ahousehold is provided a benefit to be spent on food, then total expenditures on food will increase.Because of the unexpected results, we performed a number of diagnostic checks; however, we foundthe results to be robust with respect to more restricted samples, different model specifications, and
controlling for time since receipt of benefits. Our diagnostic tests found the following (see Appendix G for more details):
• Results were robust to the choice of measure of food spending (usual expenditures versus expenditures last week) and the distributions of the two measures were similarbetween new-entrant and six-month households
• Results were robust to sample restrictions and the choice of explanatory variables
- Eliminating observations from the tails of the expenditure distribution(households with unlikely reported expenditures from the sample)
- Restricting the set of explanatory variables
- Conducting the analysis with subgroups based on number of days since receiptof benefits
- Using alternative econometric models
While our sensitivity tests did not indicate any particular limitations of the estimation methods, we believe that it is likely that the timing of our interviews in relation to the date that householdsreceived SNAP benefits may have affected the findings reported in Table V.1 and V.2. In particular,an unavoidably high fraction of the interviews took place after households had already beenreceiving benefits.
As described in Chapter II and Appendix A, to the extent possible, we minimized the timebetween a household’s entry into SNAP and our interview. However, the majority of respondentshad already received benefits. Sixteen percent of new-entrant households were interviewed beforethey received their SNAP benefit, 13 percent 1 to 5 days after receipt, 23 percent 6 to 10 days afterreceipt, 24 percent 11 to 15 days after receipt, and 24 percent 16 or more days after receipt. 32
32 See Appendix G for table of number of days between date of benefit receipt and date of interview.
This,
8/22/2019 USDA Report re SNAP & Food Security 08/2013
http://slidepdf.com/reader/full/usda-report-re-snap-food-security-082013 81/355
Measuring the Effect of SNAP Participation on Food Security Mathematica Policy Research
45
paired with the fact that most SNAP participants spend a disproportionate amount of their SNAPbenefits shortly after receiving them (Wilde and Ranney, 2000), makes it possible that many new-entrant respondents were already factoring into their usual food expenditures the foods they wereable to purchase because of their benefit. In fact, in support of this supposition, 84 percent of new-entrant households that received their benefit before the interview reported having spent more than
half of their benefit by the interview date. This is consistent with recent estimates from Castner andHenke (2011) that by the first week after receiving benefits for the month, the average SNAPhousehold had redeemed over half of its benefit, by the second week, over three-quarters of itsbenefit, and by the end of the third week, 90 percent of its benefit. The SNAPFS survey data suggestthat, even relatively early in their time on SNAP, respondents’ benefits may have become animportant component of their food purchase decision making. We acknowledge, however, that there were no statistical associations between SNAP and food spending for households that had not yetreceived their benefit at the time of the interview or for households that received their benefit from1 to 11 days before the interview. It is also important to note that, even for households that spent asubstantial fraction of their first month’s SNAP benefit we do not have direct evidence that they have revised their notion of “usual” monthly food expenditures.
On the other hand, as presented in the next section, we also found a positive and statistically significant relationship in the SNAPFS survey data among new-entrant households betweenreported usual food spending and benefit amount, which may indicate that new-entrant households were factoring the benefits received from SNAP into their estimates of usual expenditures. It ispossible, though, that this association is attributable to other factors correlated with both foodspending and SNAP benefit amount.
E. The Relationship between the SNAP Benefit Amount and FoodExpenditures
Because of the concerns about the baseline expenditure data for new-entrant households, we
drew on a different approach to analyze food expenditures. Specifically, we used the survey datafrom the six-month households in both the cross-sectional and longitudinal samples to examineassociations between the amount of SNAP benefits and reported usual expenditures. While this doesnot allow us to exploit the full quasi-experimental design of the overall study, it does allow us toassess the association between SNAP benefit amounts and reported usual food expenditures forongoing SNAP cases. This approach reveals whether higher SNAP benefits are associated withhigher food expenditures.
Drawing on techniques used extensively in the literature (Fraker 1990; Fox et al. 2004;Boonsaeng et al. 2012), we estimated how food expenditures vary across SNAP participants withdifferent monthly SNAP benefit amounts. This approach allowed us to rely only on six-monthhousehold data from the cross-sectional and longitudinal samples. We found that a one-dollar
increase in SNAP benefits was associated with a 34 cent and a 48 cent increase in usual foodexpenditures among six-month households in the cross-sectional and longitudinal analyses,respectively. These estimates that are in or around the range of approximately 0.17 to 0.47 in Fraker(1990). More recently, since the Fraker literature review was completed, Fox et al. (2004) cite fourstudies which, after excluding one outlier, found propensities to spend on food between 0.26 and0.40, while Boonsaeng (2012) estimated a value 0.31 for the propensity to spend benefits on food athome. The above findings from the six-month households in the current study are statistically significant both in absolute dollars and after normalizing the outcome measure by household size
8/22/2019 USDA Report re SNAP & Food Security 08/2013
http://slidepdf.com/reader/full/usda-report-re-snap-food-security-082013 82/355
Measuring the Effect of SNAP Participation on Food Security Mathematica Policy Research
46
and composition using the cost of the TFP. (Appendix G presents the analysis and its findings inmore detail.)
F. Summary
Under most statistical specifications in the original research design, there was no significantassociation between participating in SNAP and the amount of money spent on food in a typical week when examining the full sample of households. Although we obtained some statistically significant findings (for example, in our main model specification in the cross-sectional sample),these findings were not robust to changes in model specification and sample definitions.
There were few significant associations between SNAP participation and food expenditures atthe subgroup level. An exception was that participating in SNAP was associated with an increase infood spending and food spending relative to the cost of the TFP for households with large benefitsin both the cross-sectional and longitudinal samples.
Further analysis of the timing of the baseline data collection suggested that having an
unavoidably high fraction of the interviews take place after new-entrant households had already been receiving benefits might have affected the main findings in the food expenditure analysis if households very quickly adjust their notion of “usual” spending after receiving their initial SNAPbenefit. Excluding new-entrant households from the analysis in both the cross-sectional andlongitudinal samples, we found a positive association between the SNAP benefit amount and foodspending among households that had been on SNAP for six months.
8/22/2019 USDA Report re SNAP & Food Security 08/2013
http://slidepdf.com/reader/full/usda-report-re-snap-food-security-082013 83/355
Measuring the Effect of SNAP Participation on Food Security Mathematica Policy Research
47
VI. CONCLUSIONS AND IMPLICATIONS FOR FUTURE RESEARCH
The main research objectives of the study were to assess how household food security and foodexpenditures are associated with SNAP participation. The findings provide strong evidence thatSNAP is associated with an improvement in food security. This evidence suggests SNAP isaccomplishing one of its main goals, that of reducing food insecurity among low-incomehouseholds.
Key findings on food security and food expenditures are summarized in the next section. Wethen compare the associations between SNAP and food security to those found in related studies.Finally, we present considerations for future research and lessons learned while conducting thisstudy.
A. Key Findings
Food security. The study found that participating in SNAP for about six months wasassociated with an improvement in food security. SNAP was associated with a decrease in the
percentage of households that were food insecure by 4.6 percentage points in the cross-sectionalsample and 10.6 percentage points in the longitudinal sample. Participating in SNAP was alsoassociated with a decrease in the percentage of households that experienced very low food security of 5.0 percentage points in the cross-sectional sample and 6.3 percentage points in the longitudinalsample. In terms of percentage changes , these translate into reductions in food insecurity of 7 percent inthe cross-sectional sample and 16 percent in the longitudinal sample.33
The conclusion that SNAP is associated with an improvement in household food security generally holds for child food security as well. SNAP was associated with a decrease in thepercentage of households with children in which children were food insecure in both samples. Inaddition, SNAP was associated with a decrease in the percentage of households in which childrenexperienced very low food security in the cross-sectional sample, although there was no associationin the longitudinal sample.
The reductions in very low food security are 14 and 18 percent in the two samples, respectively. All associations are statistically significant at the 0.01 level.
We also assessed whether SNAP was associated with improved food security for householddemographic and economic subgroups. For the most part, the results are consistent with thefindings for the full sample. SNAP was associated with an improvement in food security for mosthousehold composition subgroups, including households with and without children, households without an elderly member, and households with and without a disabled member. When subgroupsdefined by income relative to poverty are examined, the estimated associations between SNAP andfood security vary. Although most reflect improvements in food security, many of the estimated
associations are not statistically significant. For most of the SNAP benefit amount subgroups, theestimated associations show significant improvements in food security.
33 For the cross-sectional analysis, percentage changes are computed as the decrease in the percentage of new-entrant households that are food insecure (–4.6 percentage points) divided by the percentage of new-entrant householdsthat are food insecure (65.4 percent). Percentage changes for the longitudinal analysis are computed analogously, using the association of –10.6 percentage points. Finally, percentage changes for very low food security are computed using the percentage of new-entrant households that have very low food security, 36.4 percent.

8/22/2019 USDA Report re SNAP & Food Security 08/2013
http://slidepdf.com/reader/full/usda-report-re-snap-food-security-082013 84/355
Measuring the Effect of SNAP Participation on Food Security Mathematica Policy Research
48
Only a relatively small number of differences across subgroups are statistically significant. In thehousehold composition subgroup analysis, the only finding that is fairly consistent across samplesand measures of food security is that SNAP is associated with improved food security forhouseholds without an elderly member, but not for households with an elderly member. In theincome subgroup analysis, the associations between SNAP and food security generally did not differ
by household income relative to the poverty threshold. The associations do differ by SNAP benefitamount, however, such that the improvement in food security was larger for households thatreceived large benefits (exceeding about 85 percent of the maximum benefit for household size)than for households that received small or medium benefits.
Food expenditures. The main, quasi-experimental part of the study found few associationsbetween SNAP participation and food spending when examining the full sample of households.Participating in SNAP for about six months was not associated with changes in usual weekly foodexpenditures. Although participating in SNAP was associated with an increase in usual weekly foodexpenditures relative to the cost of the Thrifty Food Plan, this association was present only in thecross-sectional sample and was not robust to using more restricted samples and different modelspecifications.
There were few significant associations between SNAP participation and food expenditures atthe subgroup level. An exception was that participating in SNAP was associated with an increase infood spending and food spending relative to the cost of the TFP for households with large benefits(exceeding about 85 percent of the maximum benefit for household size) in both the cross-sectionaland longitudinal samples. Notably, however, for households with small benefits SNAP wasassociated with a decrease in food spending relative to the cost of the TFP.
Because of concerns about the baseline expenditure data for new-entrant households, we usedthe survey data from the six-month households in the cross-sectional and longitudinal samples toexamine associations between the amount of SNAP benefits and reported usual expenditures. Wefound that a one-dollar increase in SNAP benefits was significantly associated with 34 cent and 48cent increases in usual food expenditures among six-month households in the cross-sectional andlongitudinal analyses. Significant estimates were also obtained when expenditures were measuredrelative to the cost of the TFP to normalize for household size and composition.
B. Comparison of Findings to Related Studies
As stated above, SNAP participation is associated with a reduction in food insecurity of 7percent in the cross-sectional sample and 16 percent in the longitudinal sample. The reductions in very low food security are 14 and 18 percent in the two samples, respectively. How large shouldthese associations be considered from the perspective of the past literature?
One answer to this question is to note that, as discussed earlier, parts of the past literature havefailed to find any clear associations at all (Gibson-Davis and Foster 2006; Ribar and Hamrick 2003;Gundersen and Oliveira 2001; Huffman and Jensen 2008), or even positive associations betweenSNAP and food insecurity (Wilde and Nord 2005). Compared with these studies, the analysisreported here suggests that SNAP is associated with substantial improvements in food security.
At the other end of the spectrum, several studies have found that SNAP is associated withreductions in food insecurity in the range of about 20 to 30 percent. Using the 1996, 2001, and 2004SIPP panels to estimate an instrumental variables model, Ratcliffe, McKernan, and Zhang (2011)found that receiving SNAP was associated with a reduction in the probability of food insecurity of
8/22/2019 USDA Report re SNAP & Food Security 08/2013
http://slidepdf.com/reader/full/usda-report-re-snap-food-security-082013 85/355
Measuring the Effect of SNAP Participation on Food Security Mathematica Policy Research
49
31 percent and a reduction in the probability of very low food security of 20 percent. Mykerezi andMills (2010) found that SNAP was associated with a reduction in food insecurity of 39 percent.34
Comparing food insecurity of individuals who continue to participate in SNAP with those who leaveusing matched CPS data, Nord (2012) found that SNAP was associated with a reduction in very low food security of 28 percent, though the estimate ranged up to 45 percent in auxiliary analyses. Nord
and Golla (2009) found that very low food security falls by roughly one-third (34 percent) using matched CPS data.35
Compared with these studies, the analysis reported here suggests that SNAP is associated withsmaller improvements in food security. Our estimates might be somewhat conservative, as suggestedin one of the sensitivity tests summarized previously. We know that, unavoidably, there weresometimes delays of more than two weeks between the new-entrant interviews and when thosehouseholds received benefits. Our estimated associations are larger when the analysis is limited tocases in which these delays either did not occur at all or were very short. Restricting the new-entrantsample to households that had not received benefits as of the interview date resulted in estimatedassociations of 18 to 26 percent reductions in food insecurity and 26 to 31 percent reductions in very low food security.
36
In comparing our work to the studies that found that SNAP is associated with reductions in
food insecurity, it is also important to consider that the studies have different populations and wereconducted in different time periods. Our study estimates the association between SNAP and foodsecurity for households that have just entered SNAP by comparing them with those that haveparticipated for about six months. Other estimates in the literature include those derived by Mykerezi and Mills (2010), Ratcliffe, McKernan, and Zhang (2011), and Yen et al. (2008), whocompare all SNAP participants (regardless of how long they have participated in the program) andnonparticipants; Nord (2012) who compares participants with program leavers; and Nord and Golla(2009) who compare individuals two to six months before SNAP entry with those one to six monthsafter entry.
Although this provides some evidence that our estimates might be
conservative, differences in observable and unobservable characteristics between households thathad and had not yet received benefits prevent us from being able to definitively conclude that ourassociations are underestimated. Furthermore, because the food security index essentially identifiesthe worst food security conditions that a household has experienced in the previous 30 days, any bias introduced by interviewing households following benefit receipt should be at least partially mitigated by the recall period of the food security index. Under plausible assumptions, for mosthouseholds, the worst food security condition would occur just before entering SNAP, so theoutcome measure in our study is likely to have captured the worst food security condition even forthe small percentage of households interviewed more than two weeks after receiving benefits.
34 The percentage change is calculated by Mykerezi and Mills (2010) by dividing the marginal effect (the percentagepoint reduction in food insecurity) by the percentage of SNAP participants who are food insecure. To make the findingsof that study comparable to the findings in our study and in Ratcliffe, McKernan, and Zhang (2011), we instead dividedthe marginal effect in Mykerezi and Mills (2010) by the percentage food insecure in absence of the program.
35 The findings in the current study are also qualitatively similar to those in Depolt, Moffit, and Ribar (2009);Bartfield and Dunifon (2006); Borjas (2005); and Yen et al. (2008).
36 Appendix D presents the findings from sensitivity analyses of the amount of time since the receipt of benefits.

8/22/2019 USDA Report re SNAP & Food Security 08/2013
http://slidepdf.com/reader/full/usda-report-re-snap-food-security-082013 86/355
Measuring the Effect of SNAP Participation on Food Security Mathematica Policy Research
50
Study periods also differ across studies. Some extend back to the 1990s (Yen et al. [2008] andMykerezi and Mills [2010] used data from 1996 and 1999, respectively), whereas others extendthrough the early to the mid-2000s (Ratcliffe, McKernan, and Zhang [2011] used three SIPP panels, which cover from 1996 to 2007; Nord and Golla [2009] used CPS data from 2001 to 2006). Nord(2012) provided more recent evidence, extending to the period of the recent recession, by using CPS
data from 2001 to 2009. Our study provides the most recent evidence, from late 2011 to mid-2012.It is also the only study examining SNAP participation and food security for which all data werecollected in the period after the 2009 increase in SNAP benefits under the American Recovery andReinvestment Act of 2009.37
C. Implications for Future Research
Several, substantive research directions are suggested by the study findings. These include:
• More examination of reasons why SNAP households without elderly membersexperienced improvements in food security, while households with elderly membersgenerally did not. This may reflect different benefit amounts (households with elderly
members received an average SNAP benefit of $144 in FY 2011 compared to $307 forhouseholds without an elderly member). Alternatively, it may reflect different coping strategies related to food insecurity.
• More examination of reasons why the improvement in food security associated withSNAP was not larger for lower income households, relative to higher incomehouseholds. Given that households with less income generally receive higher SNAPbenefits, we expected to find the improvements in food security to be larger forhouseholds with less income. We found no association for zero income households andgenerally no pattern in relation to income for households with positive income.
• Examination of how the association between SNAP and food security differs according
to households’ physical access to food. By linking measures of food access to theSNAPFS survey data file, one could examine whether the association between SNAPparticipation and household food security differs by access to SNAP retailers, including different types of retailers like supermarkets or superstores, large grocery stores, orconvenience stores.
D. Implications for Research Methods
There are also several lessons learned from the project that pertain to performing similarresearch:
• Obtaining State cooperation. The process of obtaining our sample-frame files took extensive resources and in some cases required lengthy negotiations with the States togain their active participation in the study and allay their concerns about data
37 Nord and Prell (2011) estimate the association between the increase in SNAP benefits provided by the AmericanRecovery and Reinvestment Act of 2009 and household food security using the CPS-FSS, rather than SNAPparticipation per se. They found that the increase was associated with a 9 percent reduction in food insecurity and an 18percent reduction in very low food security.
8/22/2019 USDA Report re SNAP & Food Security 08/2013
http://slidepdf.com/reader/full/usda-report-re-snap-food-security-082013 87/355
Measuring the Effect of SNAP Participation on Food Security Mathematica Policy Research
51
confidentiality and the costs of providing data. While day to day involvement in thisprocess by FNS is not generally necessary, the active cooperation of FNS staff inproviding support and making critical phone calls was important in assuring States thatFNS was supportive of the study.
• Interviewing new-entrant households before they receive SNAP benefits. Short of
implementing methods that would substantially increase data collection costs, we believethat there is no feasible way to interview new-entrant households prior to their start of benefits. Most States distribute EBT benefits to new cases relatively quickly afterapproval. In most States, the only way to reach clients before they begin receiving benefits would be to station field staff at the program offices. This would be very expensive, however, and would require adapting to the very different intake proceduresused by States. And, even then, ways would have to be found to reach clients who apply and are certified without an office interview, as occurs now in an increasing number of States. Alternatively, interview protocols for new-entrant households could include morecomprehensive sets of questions that attempt to trace out the change in foodexpenditures in the weeks before SNAP began and the days or weeks after SNAP began.
• Obtaining accurate data on food expenditures for SNAP households. It would beuseful to develop ways of doing extensive probing during interviews about whetherbenefits are included in food expenditures. In our survey module on expenditures, weincluded Current Population Survey questionnaire language asking respondents toinclude purchases made with SNAP benefits. But there was evidence that significantnumbers did not include purchases made with their benefits. Future survey projectsshould include more probes in this area. Specifically, more probes should be includedthat, during the interview, compare the usual weekly food expenditures to the SNAPbenefit amount and ask in different ways whether respondents are including benefits intheir reported food expenditure. Approaches based on cognitive interviews with SNAPhouseholds would be valuable in learning more about how food expenditures change just
before entering SNAP, in the early weeks of SNAP participation, and after severalmonths of receiving benefits.

8/22/2019 USDA Report re SNAP & Food Security 08/2013
http://slidepdf.com/reader/full/usda-report-re-snap-food-security-082013 88/355
This page has been left blank for double-sided copying.
8/22/2019 USDA Report re SNAP & Food Security 08/2013
http://slidepdf.com/reader/full/usda-report-re-snap-food-security-082013 89/355
Measuring the Effect of SNAP Participation on Food Security Mathematica Policy Research
53
REFERENCES
The American Association for Public Opinion Research. 2011. Standard Definitions: FinalDispositions of Case Codes and Outcome Rates for Surveys. 7th edition. AAPOR.
Bartfeld, J., and R. Dunifon.“State-Level Predictors of Food Insecurity Among Households withChildren.” Journal of Policy Analysis and Management, vol. 25, 2006, pp. 921–942.
Biggs, D., B. De Ville, and E. Suen. “A Method of Choosing Multi-Way Partitions for Classificationand Decision Trees.” Journal of Applied Statistics . 18 (1), 49-62, 1991.
Boonsaeng, Tullaya, Carlos E. Carpio, Chen Zhen, Abigail M. Okrent. “The Effect of SupplementalNutrition Assistance Program on Food Spending Among Low-Income Households” SelectedPaper prepared for presentation at the Agricultural & Applied Economics Association’s 2012 AAEA Annual Meeting, Seattle, Washington, August 12-14, 2012. Available athttp://ageconsearch.umn.edu/bitstream/124839/2/AAEApaper_seattle2012_final.pdf
Borjas, G.J. “Food Insecurity and Public Assistance.” Journal of Public Economics, vol. 88, 2004, pp.1421–1443.
Burstein, N., W. Hamilton, M.K. Fox, C. Price, and M. Battaglia. ―Assessing the Food Security andDiet Quality Impacts of FNS Program Participation: Final Menu of Survey Options.Cambridge, MA: Abt Associates, Inc., 2005.
Castner, Laura and Juliette Henke. “Benefit Redemption Patterns in the Supplemental Nutrition Assistance Program”. Alexandria, VA: U.S. Department of Agriculture, Food and NutritionService, Office of Research and Analysis, 2011.
Coleman-Jensen, Alisha, Mark Nord, Margaret Andrews, and Steven Carlson. Household Food
Security in the United States in 2010. ERR-125, U.S. Dept. of Agriculture, Econ. Res. Serv.September 2011. available at http://www.ers.usda.gov/Publications/ERR125/ERR125.pdf
DePolt, R.A., R.A. Moffitt, and D.C. Ribar. “Food Stamps, Temporary Assistance for Needy Families and Food Hardships in Three American Cities.” Pacific Economic Review, vol. 14, 2009,pp. 445–473.
Edin, Kathryn, Melody Boyd, James Mabli, Jim Ohls, Julie Worthington, Sara Greene, NicholasRedel, Swetha Sridharan. “SNAP Food Security In-Depth Interview Study.”. Final reportsubmitted to the Food and Nutrition Service, United States Department of Agriculture. Alexandria, VA: USDA, FNS, March 2013.
Fox, M.K., W. Hamilton, and B. Lin. 2004. Effects of Food Assistance and Nutrition Programs onNutrition and Health: Volume 3 Literature Review. Food Assistance and Nutrition ResearchReport No. 19-3. Economic Research Service, U.S. Department of Agriculture. www.ers.usda.gov/publications/fanrr19-3/
Fraker, Thomas M. “The Effects of Food Stamps on Food Consumption: A Review of theLiterature.” Alexandria, VA: U.S. Department of Agriculture, Food and Nutrition Service, 1990.
Gibson-Davis, C., and E.M. Foster. “A Cautionary Tale: Using Propensity Scores to Estimate theEffect of Food Stamps on Food Insecurity.” Social Service Review, vol. 80, 2006, pp. 93–126.
8/22/2019 USDA Report re SNAP & Food Security 08/2013
http://slidepdf.com/reader/full/usda-report-re-snap-food-security-082013 90/355
Measuring the Effect of SNAP Participation on Food Security Mathematica Policy Research
54
Gundersen, C., and V. Oliveira. “The Food Stamp Program and Food Insufficiency.” American Journal of Agricultural Economics, vol. 83, 2001, pp. 875–887.
Huffman, S.K., and H.H. Jensen. “Food Assistance Programs and Outcomes in the Context of Welfare Reform.” Social Science Quarterly, vol. 89, 2008, pp. 95–115.
Kalton, Graham and Ismael Flores-Cervantes. “Weighting Methods”, Journal of Official Statistics, Vol.19, No.2, 2003. pp. 81–97, 2003.
Kass, G. V. An Exploratory Technique for Investigating Large Quantities of Categorical Data.” Applied Statistics 29 (2), 119-127, 1980.
Leftin, Joshua, Andrew Gothro, and Esa Eslami. “Characteristics of Supplemental Nutrition Assistance Program Households: Fiscal Year 2009.” Alexandria, VA: U.S. Department of Agriculture, Food and Nutrition Service, October 2010.
Magidson, Jay. “The Use of the New Ordinal Algorithm in CHAID to Target Profitable Segments”,
The Journal of Database Marketing , 1, 29–48, 1993.
Nord, Mark. Food Spending Declined and Food Insecurity Increased for Middle-Income and Low-Income Households From 2000 to 2007, EIB-61, U.S. Dept. of Agri., Econ. Res. Serv.,October 2009.
Nord, Mark. 2011. “How Much Does the Supplemental Nutrition Assistance Program AlleviateFood Insecurity? Evidence from Recent Programme Leavers,” Public Health Nutrition 15(5): 811-817.
Nord, Mark, and Gary Bickel. “Measuring Children’s Food Security in U.S. Households, 1995-99”.FANRR-25, USDA, Economic Research Service. 2002.
Nord, Mark, and Anne Marie Golla. “Does SNAP Decrease Food Insecurity? Untangling the Self-Selection Effect. Washington, DC: USDA, Economic Research Service, Economic ResearchReport Number 85, October, 2009.
Nord, Mark, and Mark Prell. Food Security Improved Following the 2009 ARRA Increase in SNAPBenefits, ERR-116, U.S. Department of Agriculture, Economic Research Service, April 2011.
Oliveira, Victor, and Donald Rose. 1996. Food Expenditure Estimates From the 1995 CPS FoodSecurity Supplement: How Do They Compare With the Consumer Expenditure Survey? Staff Report No. AGES9617, U.S. Department of Agriculture, Economic Research Service.
Ratcliffe, C., S. McKernan, and S. Zhang. “How Much Does the Supplemental Nutrition AssistanceProgram Reduce Food Insecurity?” American Journal of Agricultural Economics, vol. 93, no. 4, 2011,pp. 1082–1098.
Ribar, D.C., and K.S. Hamrick. “Dynamics of Poverty and Food Sufficiency.” Research report no.36. Washington, DC: U.S. Department of Agriculture, Food and Nutrition Service, 2003.
Schochet, Peter Z. (2008). Technical Methods Report: Guidelines for Multiple Testing in ImpactEvaluations (NCEE 2008-4018). Washington, DC: National Center for Education Evaluationand Regional Assistance, Institute of Education Sciences, U.S. Department of Education.

8/22/2019 USDA Report re SNAP & Food Security 08/2013
http://slidepdf.com/reader/full/usda-report-re-snap-food-security-082013 91/355
Measuring the Effect of SNAP Participation on Food Security Mathematica Policy Research
55
Siegel, P.H., Chromy, J.R., & Copello, E.A.. Propensity Models Versus Weighting Cell Approachesto Nonresponse Adjustment: A Methodological Comparison. Presented at American Association for Public Opinion Research 60th Annual Conference, Miami Beach, FL, May 2005.
Strayer, Mark , Esa Eslami, and Joshua Leftin. “Characteristics of Supplemental Nutrition AssistanceProgram Households: Fiscal Year 2011”, U.S. Department of Agriculture, Food and NutritionService, Office of Research and Analysis. Project Officer, Jenny Genser. Alexandria, VA: 2012.
Trippe, Carole, and Jessica Gillooly. “Noncash Categorical Eligibility for SNAP: State Policies andthe Number and Characteristics of SNAP Households Categorically Eligible Through ThosePolicies.” Final report submitted to the U.S. Department of Agriculture, Food and NutritionService. Washington, DC: Mathematica Policy Research, July 2010.
Wilde, P. “Measuring the Effect of Food Stamps on Food Insecurity and Hunger: Research andPolicy Considerations.” Journal of Nutrition, vol. 137, 2007, pp. 307–310.
Wilde, Parke, and Mark Nord. “The Effect of Food Stamps on Food Security: A Panel Data Approach.” Review of Agricultural Economics, vol. 27, 2005, pp. 425–432.
Wilde, Parke E. and Christine K. Ranney. "The Monthly Food Stamp Cycle: Shopping Frequency and Food Intake Decisions in an Endogenous Switching Regression Framework," American Journal of Agricultural Economics, Agricultural and Applied Economics Association, vol. 82(1),pages 200-213, 2000.
Wun, L.-M., Ezzati-Rice, Digaetano, R., Goksel, H., and Hao, H.,"Using Data from the NationalHealth Interview Survey (NHIS) to Assess the Effectiveness of Nonresponse Adjustment in theMedical Expenditure Panel Survey (MEPS)," 2005 ASA Proceedings of the Section on Survey Research Methods, (CD-ROM).
Yen, Stephen T., Margaret Andrews, Zhuo Chen, and David B. Eastwood. “Food Stamp ProgramParticipation and Food Insecurity: An Instrumental Variables Approach.” American Journal of Agricultural Economics, vol. 90, 2008, pp. 117–132.

8/22/2019 USDA Report re SNAP & Food Security 08/2013
http://slidepdf.com/reader/full/usda-report-re-snap-food-security-082013 92/355
This page has been left blank for double-sided copying.

8/22/2019 USDA Report re SNAP & Food Security 08/2013
http://slidepdf.com/reader/full/usda-report-re-snap-food-security-082013 93/355
APPENDIX A
DATA AND METHODOLOGY

8/22/2019 USDA Report re SNAP & Food Security 08/2013
http://slidepdf.com/reader/full/usda-report-re-snap-food-security-082013 94/355
This page has been left blank for double-sided copying.
8/22/2019 USDA Report re SNAP & Food Security 08/2013
http://slidepdf.com/reader/full/usda-report-re-snap-food-security-082013 95/355
Appendix A Mathematica Policy Research
A-3
Chapter II presented an overview of the study design and data collection methodology underlying the study, as well as the outcome measures and analysis methods. This Appendixpresents more detailed information about the data collection methodology, the analysis methodsused to estimate the association between SNAP and food security and food expenditures, and theconstruction of sampling weights used in the analysis.
A. Sampling Methodology
The data consist of two samples. The sample used in the cross-sectional analysis includes 9,811SNAP households interviewed in 30 States from October 2011 through February 2012. It comprises6,436 new-entrant households and 3,375 households that have participated for about six months (werefer to these households as “six-month” households, for convenience). The sample used in thelongitudinal analysis comprises the 6,436 new-entrant households interviewed from October 2011through February 2012 plus a portion of those households—3,275 households in total—who werestill participating in the program about six months later. 38
A key consideration in our approach to sampling was that the only practical way to obtainsample frames for a national sample of SNAP participants was through the State agencies thatoperate the program. Because the USDA does not have a national file with the information that isneeded, we ensured efficiency in sampling by drawing the sample of SNAP participants in a two-stage process. First, we drew a sample of States, using probability-proportional-to-size (PPS)sampling. Second, we drew samples of participant households from caseload files provided by participating States.
These households were interviewedbetween April and September 2012.
We selected States from the 48 contiguous States and the District of Columbia and used thenumber of SNAP households in each State as the measure of size. At the first stage, we selected 30States. All States with at least one-thirtieth of the national caseload (14 States) were sampled withcertainty. The rest were sampled with probabilities proportional to size and were referred to asnoncertainty States. We also selected 5 replacement States from the noncertainty group for a backupsample to use if some of the originally selected States ultimately chose not to participate. In the end,the sample included 4 replacement States.39
In sampling individual households within States from State-supplied caseload files, wecalculated the sample sizes according to the following principles:
• For each certainty State, the sample size was set proportional to the size of the State’scaseload. For instance, if State A and State B were both certainty States, and if the
38
As we discuss later in the Appendix, in both the cross-sectional and longitudinal analyses, we restricted thesample of new-entrant households to those that were still participating in SNAP six months later in order to increase thecomparability between the new-entrant and six-month samples. Thus, the sample sizes above are the initial sample sizes,rather than the analytic sample sizes.
39 The states that participated in the survey were Arizona, Arkansas, California, Florida, Georgia, Illinois, Indiana,Iowa, Kentucky, Louisiana, Maine, Maryland, Massachusetts, Michigan, Minnesota, Mississippi, Missouri, Nebraska,New Mexico, New York, North Carolina, Ohio, Oklahoma, Oregon, Pennsylvania, Rhode Island, Texas, Virginia, Washington, and Wisconsin.

8/22/2019 USDA Report re SNAP & Food Security 08/2013
http://slidepdf.com/reader/full/usda-report-re-snap-food-security-082013 96/355
Appendix A Mathematica Policy Research
A-4
caseload in State A was 50 percent larger than in State B, then State A had 1.5 times thesample of State B.
• For the States not chosen with certainty, equal-sized samples were taken, reflecting thefact that the States had already been selected with probabilities proportional to size.
Given the total sample size that we targeted across all States40
B. Data Collection
, determined using a poweranalysis, these sampling rules defined a unique number of cases to be selected from each State. Thesample of new-entrant households was to be used in both the cross-sectional and longitudinalanalyses and was re-interviewed approximately six months after the initial interview, whereas thesample of six-month households was interviewed only once. Thus, to allow for attrition in thelongitudinal sample over time, we selected a much larger sample of new-entrant households thansix-month households during the baseline survey period.
The household survey used to obtain data for the cross-sectional analysis was conductedbetween October 2011 and February 2012. The follow-up survey for new-entrant households that was used in the longitudinal analysis was conducted between April and early September 2012. Allinterviews were completed by telephone with computer-assisted telephone interviewing (CATI)using trained interview staff.
An analytic objective in conducting the telephone survey was to minimize the time betweenprogram entry and the baseline interview so that respondents’ information pertained to the timeperiod prior to entry into SNAP. In light of this need, Mathematica adopted a “rolling sample”procedure. We divided the States into seven cohorts of about four States each. Within cohorts,States loaded their raw SNAP certification files on a secure FTP site at the same time, and thesampled SNAP households were released for data collection at the same time several days later. Across cohorts, sampling and data collection was conducted sequentially, although the interviewing
periods slightly overlapped one another. That is, the interviewing of the first cohort was stillunderway at the time sampling activities for the second cohort began, and so on. The length of thebaseline field period was approximately two weeks for new-entrant households and four weeks forsix-month households, while the length of the field period for follow-up interviews with new-entranthouseholds six months later was about six weeks. Given the staggered start dates across states forthe baseline field periods, the baseline data collection period lasted from October 2011 to February 2012. The follow-up period lasted from April to September 2012.
Sequence of Data Collection Procedures
Upon receipt of the new-entrant and six-month caseload files from the States, Mathematicareviewed the data files, obtained additional information for incomplete data files (for example,missing telephone numbers), and sampled households. (This is discussed in more detail in the nextsection.) Mathematica mailed to sampled households an advance letter signed by a USDA officialthat included a $2 prepaid incentive and promised $20 additional incentive upon completion of thetelephone survey. Approximately three days after advance letters were mailed to the sampled
40 The target analysis sample size was 7,618 new-entrant households at baseline; 4,000 six-month households atbaseline; and 4,000 new-entrant household six months later at follow-up.

8/22/2019 USDA Report re SNAP & Food Security 08/2013
http://slidepdf.com/reader/full/usda-report-re-snap-food-security-082013 97/355
Appendix A Mathematica Policy Research
A-5
households, telephone interviewers began contacting the households and conducting interviewsusing the programmed CATI instrument. An automated call scheduler was used to manage thesample by controlling the delivery of cases to the interviewers.
Generally speaking, the goals of “call scheduling” were to (1) find a time when someone wouldanswer the telephone for an initial contact to screen the number as an eligible household andidentify the most appropriate household-level respondent, (2) schedule and keep appointments tointerview the respondent, and (3) deliver calls to interviewers with special skills (such as refusalconversion or language specialists), as appropriate. To achieve these goals, we defined time slots,created queues, and set rules for the initial call. We also rotated cases in and out of appropriatequeues and through the time slots. Minimum and maximum call rules were also established as wellas times when messages were left on answering machines and times when supervisors reviewedcases.
To ensure high-quality data collection, all interviewers assigned to the project, both experiencedand new, received two-day, in-person, project-specific training. Interviewers received a descriptionof the study and instructions on how to respond to questions about it. In addition, a “walk-through”
of the instrument explained the intent of each item and offered appropriate probes that werespecific to the questions.
To ensure telephone interviewers performed as trained, they were regularly monitored via asystem that enables verbal and visual monitoring without either the interviewer’s or the respondent’sknowledge. Interviewers were informed that they were to be monitored but did not know whenobservations would take place. Respondents were also informed at the start of the interview thattheir conversation may be recorded for quality-control purposes.
Minimizing the Time Between First Receipt of Benefits and Completed Interview for New-Entrant Households
To best measure the prevalence and characteristics of food-insecure households as they firstentered the program, it was essential that new SNAP households be interviewed as soon as possibleafter SNAP certification but before the household had adjusted its food purchasing andconsumption behavior based on its SNAP allotments. Two phases of the survey work were criticalin this regard: (1) minimizing the “front-end” setup time during which the raw State data files werereceived, processed, sampled and loaded into the Survey Management System (SMS) for use by theCATI center, and (2) minimizing the data collection period in the CATI center.
Minimizing front-end setup time. As part of its work in developing operational plans for the survey,Mathematica used multiple avenues toward minimizing the time from when the State uploaded itsSNAP certification data file onto Mathematica’s secure FTP site to when Mathematica could
commence telephone interviews with the sampled cases. We undertook the following steps witheach State data file before conducting CATI interviews:
• Retrieved State data files, read them into SAS, ran edit checks, and removed duplicatecase records.
• Reviewed the data file; followed up with State SNAP agencies with files that wereincomplete (for example, some states submitted “six-month” sample files that containedonly cases that had been on the program for four months. States were notified to re-submit files for six-month households).
8/22/2019 USDA Report re SNAP & Food Security 08/2013
http://slidepdf.com/reader/full/usda-report-re-snap-food-security-082013 98/355
Appendix A Mathematica Policy Research
A-6
• Verified that data files were loaded into the sample management system, assigned caseidentifiers, and checked for missing or incomplete respondent contact information.
• For many states, sent the entire file to a private locating company for address andtelephone updates. For some states, only specific cases for which there was insufficientcontact information were sent to the locating company. Files were not sent to a private
locating company for states with data sharing restrictions.
• Used sampling programs to select SNAP households, conducted an additional duplicatecheck, and flagged the sampled cases on the file.
• Checked for complete mailing addresses. If address was complete, sent advanced letter.If address was incomplete, located address.
• Released sample to survey operations center for CATI interviewing.
In most cases, interviews in a given State began three days after receiving the final State file, toallow sufficient time for sample members to receive the advance letters. Given that the State SNAPdata files included cases that had been certified one to five days prior to data file delivery, the totalelapsed time from SNAP certification to the sample case being released for telephone interviewing was about four to eight days, with the range being a function of the SNAP certification date relativeto data file delivery date.
Minimizing the data collection period. We considered a 7-day field period for new-entranthouseholds, but chose instead to use a 14-day field period. Both scenarios require working cases inthe sample much more intensively in terms of calls per day than is the case with standard CATIsurveys, which extend over a much longer time period. However, concerned that a 7-day periodmight lead to unacceptably low response rates, we used a 14-day CATI period in which for the first7 days, cases were worked nearly as intensely as they would have been worked under the 7-day CATIperiod design. The additional 7 days that followed helped us ensure that response rates were not
adversely affected.
C. Response Rates
Table A.1 summarizes the response rates that were obtained in the various parts of the datacollection. The response rates were 55.7 for the new-entrant households’ baseline interview and 55.0for the six-month sample interviewed at baseline. The response rate for the follow-up interview withthe new-entrant sample six months later was 66.6 percent. All response rates were calculated using the American Association for Public Opinion Research response rate 3 (RR3) formula (AAPOR 2009).
The response rates in the baseline interview reflect two challenges of the survey effort. First, thegoal of achieving quick turnaround in the survey raises an important trade-off among competing SNAPFS survey objectives. In particular, longer data collection periods allow survey staff andresearchers time to successfully locate, contact, and interview the sample population, thereby obtaining higher overall response and minimizing potential nonresponse bias. But allowing several weeks for data collection leads to the analytical risk that because new SNAP entrants may haveadjusted their food purchasing and consumption behavior based on their SNAP allotments beforethey were interviewed for this survey, the interview may not be a true “baseline” that reflects clients’situations prior to entering the program. This study used a 14-day field period, which is muchshorter than most field periods for standard surveys.
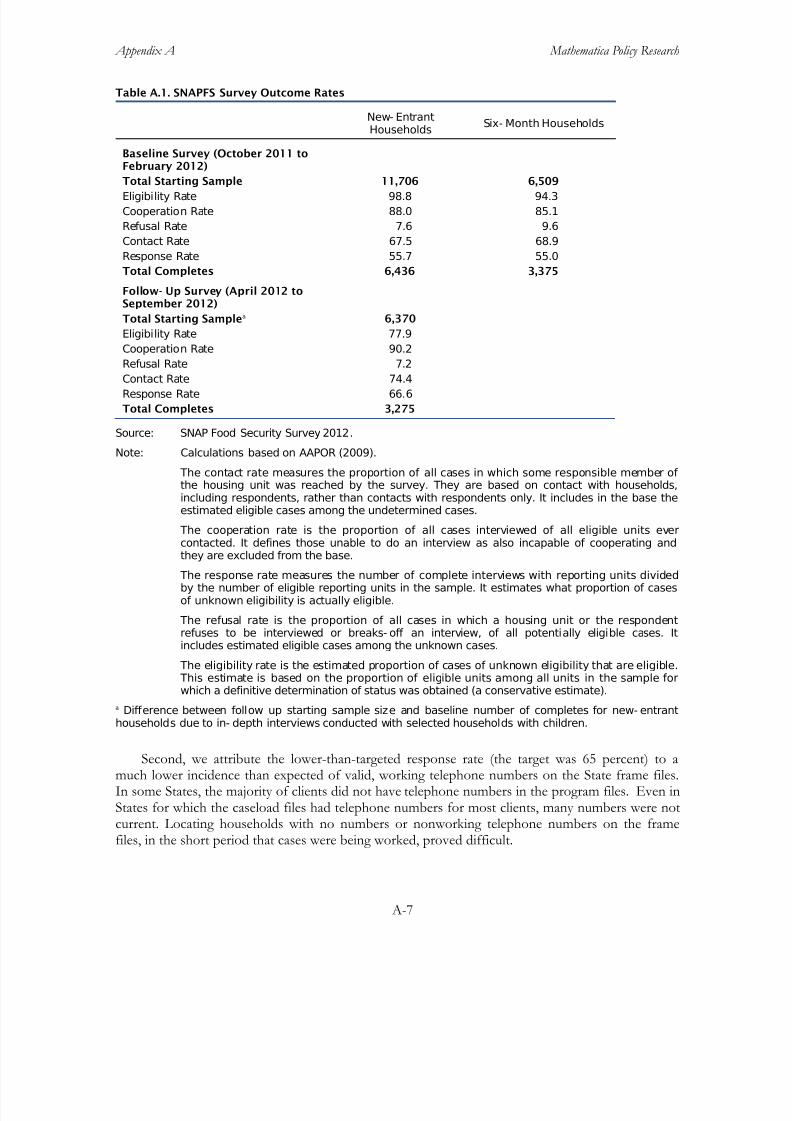
8/22/2019 USDA Report re SNAP & Food Security 08/2013
http://slidepdf.com/reader/full/usda-report-re-snap-food-security-082013 99/355
Appendix A Mathematica Policy Research
A-7
Table A.1. SNAPFS Survey Outcome Rates
New- EntrantHouseholds
Six- Month Households
Baseline Survey (October 2011 toFebruary 2012)
Total Starting Sample 11,706 6,509Eligibility Rate 98.8 94.3
Cooperation Rate 88.0 85.1
Refusal Rate 7.6 9.6
Contact Rate 67.5 68.9
Response Rate 55.7 55.0
Total Completes 6,436 3,375
Follow- Up Survey (April 2012 toSeptember 2012)
Total Starting Samplea 6,370
Eligibility Rate 77.9
Cooperation Rate 90.2
Refusal Rate 7.2Contact Rate 74.4
Response Rate 66.6
Total Completes 3,275
Source: SNAP Food Security Survey 2012.
Note: Calculations based on AAPOR (2009).
The contact rate measures the proportion of all cases in which some responsible member of the housing unit was reached by the survey. They are based on contact with households,including respondents, rather than contacts with respondents only. It includes in the base theestimated eligible cases among the undetermined cases.
The cooperation rate is the proportion of all cases interviewed of all eligible units evercontacted. It defines those unable to do an interview as also incapable of cooperating andthey are excluded from the base.
The response rate measures the number of complete interviews with reporting units dividedby the number of eligible reporting units in the sample. It estimates what proportion of casesof unknown eligibility is actually eligible.
The refusal rate is the proportion of all cases in which a housing unit or the respondentrefuses to be interviewed or breaks- off an interview, of all potentially eligible cases. Itincludes estimated eligible cases among the unknown cases.
The eligibility rate is the estimated proportion of cases of unknown eligibility that are eligible. This estimate is based on the proportion of eligible units among all units in the sample forwhich a definitive determination of status was obtained (a conservative estimate).
a Difference between follow up starting sample size and baseline number of completes for new- entranthouseholds due to in- depth interviews conducted with selected households with children.
Second, we attribute the lower-than-targeted response rate (the target was 65 percent) to amuch lower incidence than expected of valid, working telephone numbers on the State frame files.In some States, the majority of clients did not have telephone numbers in the program files. Even inStates for which the caseload files had telephone numbers for most clients, many numbers were notcurrent. Locating households with no numbers or nonworking telephone numbers on the framefiles, in the short period that cases were being worked, proved difficult.
8/22/2019 USDA Report re SNAP & Food Security 08/2013
http://slidepdf.com/reader/full/usda-report-re-snap-food-security-082013 100/355
Appendix A Mathematica Policy Research
A-8
As described in the methodology section below, we conducted a comprehensive nonresponseanalysis to ensure that household nonresponse did not bias the study findings.
D. Analysis Methods
We used descriptive, tabular analysis to examine the composition of the groups of new-entrantand six-month households, as well as to present summary statistics of the outcome measures of foodsecurity status and food expenditures used in the multivariate analysis. Next, we used multivariateregression analysis to estimate the association between SNAP and household food security and foodexpenditures while accounting for compositional differences between new-entrant and six-monthhouseholds. All analyses were weighted.
The tables in the body of this report restrict the sample of new-entrant households to those thatcontinued to participate six months later at the time of the follow-up interview. This restrictiondecreases the size of the sample used in the analysis, and thus potentially decreases statistical powerin the analyses of food security in Chapter IV and food expenditures in Chapter V. However, itincreases the comparability of new-entrant and six-month households and helps to decrease bias in
comparing the food security (or food expenditures) of six-month and new-entrant households.
1. Descriptive Analysis
We used descriptive analysis to examine the characteristics and circumstances of the samples of new-entrant and six-month households, and to assess the food-insecurity rates and usual weekly food expenditures for each group. Unless otherwise noted, statistics represent weighted means andpercentages of the group of new-entrant households or the group of six-month households.
Note that to simplify the presentation, and because the purpose of this initial analysis isdescriptive, we did not include standard errors in these tables. However, Chapters IV and V, whichfocus more on hypothesis testing, provide full documentation of statistical significance.
2. Multivariate Analysis of Food Security
We examined two outcomes: (1) food security and (2) food expenditures. In this section, wediscuss the multivariate methodology used in the food security analyses. In the next section wediscuss the analogous methodology for the food expenditures analyses.
Although comparing food insecurity rates across groups using descriptive, tabular analysisprovides valuable information about how the outcome measure differs across groups, multivariateregression analyses are needed to account for compositional differences across groups that mightbias the associations between SNAP and food security. In particular, many household characteristics
may be correlated with both continuing to participate in the SNAP program through six months anda household’s food insecurity status. To help to address this concern, we used logistic regressionanalysis to estimate the effect of SNAP on food security.41
41 While multivariate modeling helps to minimize bias, it does not eliminate it altogether, due to the inability to
account for unobservable factors that affect both SNAP participation and food security.

8/22/2019 USDA Report re SNAP & Food Security 08/2013
http://slidepdf.com/reader/full/usda-report-re-snap-food-security-082013 101/355
Appendix A Mathematica Policy Research
A-9
Outcome Measures
The SNAPFS survey included the 18-item food security module used in the Current PopulationSurvey Food Security Supplement (CPS-FSS). The questionnaire was based on a 30-day recallperiod.
We defined four outcome measures for the food security analyses:
1. Household food insecurity. A binary variable indicating whether a household wasfood insecure. Household food security status can be measured using the 10 adult-referenced items for households without children and the full 18 items (the 10 adult-referenced items plus the 8 child-referenced items) for households with children. In thisstudy, we measured food security using the 10 adult-referenced items for all householdsto minimize any measurement effects associated with the presence and ages of children(Nord and Golla 2009; Nord and Bickel 2002). Households that affirmed 3 or moreitems were classified as food insecure.
2. Household very low food security. A binary variable indicating whether a householdexperienced very low food security. This variable was measured using the 10-item adultscale of the food security module. Households that affirmed 6 or more items wereclassified as having very low food security.
3. Children’s food insecurity. For households with children, a binary variable indicating whether children in the household were food insecure. This variable was measuredusing the 8-item child scale of the food security module (Nord and Bickel 2002).Households that affirmed 2 or more items were classified as having food insecurity among children.
4. Children’s very low food security. For households with children, a binary variableindicating whether children in the household experienced very low food security. This
variable was measured using the 8-item child scale of the food security module (Nordand Bickel 2002). Households that affirmed five or more items were classified as having very low food security among children.
Empirical Model for Cross-Sectional Analysis
We estimated logistic regression models that relate the probability of food insecurity or very low food security to SNAP participation status and a set of household and State characteristics.Participation in SNAP was denoted using a binary variable equal to 1 if the household had beenparticipating in SNAP for about six months and equal to 0 if the household had just entered SNAP. The set of variables measuring household characteristics and circumstances consisted of:42 43
42 All of the variables were defined using information from the SNAPFS survey, except for the state economic and
SNAP policy variables. Analysis variables were not defined using variables from the administrative data files provided by states for the sample frame construction.
43 The survey defined “household” as “the people who live with the respondent and share food with therespondent, including babies, small children, and people who are not related to the respondent.” Some of the analysis variables measure a characteristic or circumstance for the “household head.” This was the interview respondent who

8/22/2019 USDA Report re SNAP & Food Security 08/2013
http://slidepdf.com/reader/full/usda-report-re-snap-food-security-082013 102/355
Appendix A Mathematica Policy Research
A-10
• Gender of household head. A binary variable indicating whether the household head isfemale.
• Race and ethnicity of household head. Binary variables indicating whether thehousehold head is Hispanic; non-Hispanic black; or non-Hispanic non-black and non- white (referred to as non-Hispanic “other”). The referent group was non-Hispanic white.
• Highest grade completed of household head. Binary variables indicating whether thehousehold head has completed high school, some college, or at least college. Thereferent group completed less than high school.
• Employment status of household head. Binary variables indicating whether thehousehold head was employed full-time or employed part time. The referent group was“not employed.”
• Depression status of household head. A binary variable indicating whether the headof household felt depressed in the past 30 days. It is based on whether the respondentstated that he or she felt one of the following conditions either a little of the time, most
of the time, or all of the time in the past 30 days: “felt so sad nothing could cheer youup”; “felt nervous”; “felt restless or fidgety”; “felt hopeless”; “felt that everything was aneffort”; or “felt worthless.”
• Household income-to-poverty ratio. A variable measuring a household’s grossmonthly income relative to the SNAP income eligibility standards for Fiscal Year 2012( http://www.fns.usda.gov/snap/government/FY12_Income_Standards.htm ). Thestandards represent 100 percent of the poverty level for each household size and closely resemble the Department of Health and Human Services poverty guidelines.
• Household size. A discrete variable equal to the number of people in the household.
• Household composition. Binary variables indicating whether the household includes
children; whether the household includes an elderly member (age 65 and over); and whether the household includes a disabled individual (self-reported in the survey).
• Prior SNAP participation status. A binary variable indicating whether the householdhad participated in SNAP prior to its current enrollment.
• Participation in federal or State programs. Binary variables indicating whether thehousehold was participating in federal or State programs such as TANF, other welfareprograms such as General Assistance, Supplemental Security Income (SSI), orunemployment compensation.
• Changes in household size, housing status, employment, pay, or hours worked. Binary variables indicating whether the household had experienced a change in the pastsix months in household size, housing status (as measured by eviction), or employment,pay, or hours worked.
(continued)affirmed that (1) he or she was the person who did most of the planning or preparing of meals in his or her family, or (2)he or she was the adult in the household who did most of the shopping for food in his or her family.
8/22/2019 USDA Report re SNAP & Food Security 08/2013
http://slidepdf.com/reader/full/usda-report-re-snap-food-security-082013 103/355
Appendix A Mathematica Policy Research
A-11
• Region of residence. Binary variables indicating the FNS region in which thehousehold lives. The Western region is the referent group.
• State wage and unemployment rate. We used the 25th percentile of the State wagedistribution to represent the typical wage rate of a low-income worker in the State andthe State unemployment rate to measure the general economic environment in the State.
Wage information was obtained from the May 2011 Bureau of Labor Statistics StateOccupation and Wage Estimates data [http://www.bls.gov/oes/current/oessrcst.htm ]. We calculated the State unemployment rate as the average of the nonseasonally adjustedunemployment rate from October 2011 through February 2012 for the baseline periodand from April 2012 through August 2012 for the follow-up period. We obtained thisinformation from Bureau of Labor Statistics Local Area Unemployment Statistics data.
• State SNAP policies. A binary variable indicating whether the State offers broad-basedcategorical eligibility to SNAP participants. This variable is measured using State-leveldata from Trippe and Gallooly (2010) compiled for FNS. We also included the averagecertification period in the State in fiscal year 2011 obtained from SNAP Quality Controldata used in Strayer et al. (2012).
We transform the raw logistic regression coefficient of the SNAP participation variable into a“marginal effect” to measure the association of SNAP participation with the probability of being food insecure (or, in alternate specifications, the probability of experiencing very low food security). We present the raw regression coefficients and standard errors for the main specification of eachregression to familiarize the reader with the model specification. We follow with tables thatsummarize the association between SNAP and food insecurity (or very low food security) for thefull sample and subgroup samples. These summary tables compare the rates of food insecurity across groups after accounting or adjusting for compositional differences across groups. AppendicesC and F contain regression coefficients and standard errors for all models.
The summary tables have the regression-adjusted percentage of new-entrant households thatare food insecure; the regression-adjusted percentage of six-month households that are foodinsecure; the difference in these percentages, which is the marginal effect; and the standard error of the marginal effect. Regression-adjusted percentages of households that are food insecure wereobtained by performing the following steps:
• Obtain the percentage for six-month households. We evaluated the logisticregression equation using the regression coefficient estimates, setting the SNAPparticipation variable equal to 1 for all households, and using the means of all otherexplanatory variables calculated over six-month and new-entrant households. Thisprocess generated a single predicted probability of a six-month household being food
insecure.• Obtain the percentage for new-entrant households. We evaluated the logistic
regression equation using the regression coefficient estimates, setting the SNAPparticipation variable to 0 for all households, and using the means of all otherexplanatory variables calculated over six-month and new-entrant households. Thisprocess generated a single predicted probability of a new-entrant household being foodinsecure.
8/22/2019 USDA Report re SNAP & Food Security 08/2013
http://slidepdf.com/reader/full/usda-report-re-snap-food-security-082013 104/355
Appendix A Mathematica Policy Research
A-12
• Obtain the marginal effect of SNAP on food insecurity. We calculated the differencein the two predicted probabilities to obtain the estimate of the marginal effect of SNAPon food insecurity.
We followed an analogous set of steps to obtain the regression-adjusted percentages of
households that experienced very low food security.Empirical Model for the Longitudinal Analysis
The main sample for the longitudinal analysis consisted of the new-entrant householdsinterviewed from October 2011 to February 2012 that responded to the follow-up interview approximately six months later, from April 2012 to September 2012. This is a “balanced” sample inthat all household contributed the same number of observations (two) to the data file.
The outcome measures were the same in both the longitudinal and cross-sectional analysis, as were the set of explanatory variables. We defined the values of the explanatory variables for the six-month households and the new-entrant households in the longitudinal analysis using data from the
follow-up interview and baseline interview, respectively. Although we could use this approach forthe State-level unemployment rate, the variables measuring State SNAP policies in the baselineperiod were not updated in the follow-up period, because they are fiscal year measures and thebaseline and follow-up periods were both in fiscal year 2012.
Subgroup Analysis
In addition to estimating the association between SNAP and food security using the full(restricted) sample of 6,650 households, we estimated the regressions described above for thefollowing subgroups44
• Household composition. Whether a household includes children; among households with children, whether a household is a single-parent or multiple-parent household; whether a household includes an elderly member; and whether a household includes adisabled individual.
:
• Age of household head. Households in which the head of household was age 18 to 24;age 25 to 49; age 50 to 64; or age 65 or older.
• Highest grade completed of household head. Households in which the householdhead’s highest grade of schooling completed was less than high school; high school; ormore than high school.
• Race and ethnicity of household head. Households in which the household head was
white, non-Hispanic; black, non-Hispanic; Hispanic; or non-white, non-black, and non-Hispanic.
44 There are statistical risks associated with extensive subgroup analysis due to the substantial likelihood—often anear certainty—that spurious results are obtained (Schochet 2008). As we discuss in greater detail in Chapter IV, weattempt to strike a compromise between the need for subgroup analysis and the attendant statistical risks by highlighting findings from three sets of important subgroups in the text of the report and reporting results for additional subgroupsin appendix in tables in Appendix E to allow additional exploratory analysis, as desired.
8/22/2019 USDA Report re SNAP & Food Security 08/2013
http://slidepdf.com/reader/full/usda-report-re-snap-food-security-082013 105/355
Appendix A Mathematica Policy Research
A-13
• Employment status of household head. Households in which the household head was employed full time; employed part time; or not employed.
• Region of residence. Households that lived in the Northeast region; Mid-Atlanticregion; South region; Southeast region; Midwest region; Mountain region; or Westregion.
• Household income. Households with zero income; households with an income-to-poverty ratio greater than zero, but less than or equal to 50 percent; households with anincome-to-poverty ratio greater than 50 percent but less than or equal to 130 percent;households with an income-to-poverty ratio greater than 130 percent.
• Sources of income. Whether households received income from the following sources: TANF; SSI; Social Security benefits; other retirement benefits such as a government orprivate pension or annuity; unemployment insurance or worker’s compensation benefits; veteran’s benefits; child-support payments; or financial support from families andfriends.
•
SNAP benefit amount. Households that small, medium, or large benefit amounts as apercentage of the maximum benefit. Small, medium, and large benefit groupscorrespond to households with benefits of 1 to less than 42 percent of the maximum, 42to less than 85 percent of the maximum, and at least 85 percent of the maximum in thecross-sectional sample, and benefits of 1 to less than 43 percent of the maximum, 43 toless than 88 percent of the maximum, and at least 88 percent of the maximum in thelongitudinal sample.
• Expedited service. Whether households were certified for SNAP by receiving expedited service.45
• Prior SNAP participation status. Whether households participated in SNAP prior totheir current enrollment.
• Health status. Households in which the head of household reported health as excellent, very good, good, fair, or poor.
• Body mass index. Households in which the head of household’s body mass index(BMI), based on self-reported height and weight, fell into the following categories:underweight (BMI less than 18.5); normal (BMI from 18.5 to 24.9); overweight (BMIfrom 25.0 to 29.9); and obese (BMI greater than or equal to 30.0).
• Household transportation resources. Households that owned a car, truck, or other vehicle; households that did not own but had access to a car, truck, or other vehicle;households that did not own and did not have access to a car, truck, or other vehicle.
• Household residential status and type. Household that lived in a house, townhouse,condo, mobile home or trailer, or apartment; household that lived in a room or in amotel or hotel; household that lived in another type of place (includes homeless living in
45 This information is from the State SNAP caseload administrative files used to construct the SNAPFS sampleframe.
8/22/2019 USDA Report re SNAP & Food Security 08/2013
http://slidepdf.com/reader/full/usda-report-re-snap-food-security-082013 106/355
Appendix A Mathematica Policy Research
A-14
a shelter or mission and homeless living on the street; in a car, van, or recreational vehicle; in an abandoned building; or in another place).
• Home-ownership status. Among households that lived in a house, townhouse, condo,mobile home or trailer, apartment or room, whether the household owned the place in which it lived; rented its own place or contributed to rent at a friend’s or family
member’s place; or lived rent-free.
• Food preparation and storage capabilities. Whether household had access to a place where it could prepare a meal; access to a refrigerator; access to a standalone freezer;access to a gas or electric stove; and access to a microwave.
• Participation in food assistance and nutrition programs. For households withschool-age children, whether children received free or reduced-price lunches at school;for households with school-age children, whether children received free or reduced-pricebreakfasts at school; for households with children less than five years of age, whetherchildren in the household received free or reduced-price food at a daycare or Head Startprogram; for households with children less than five years of age or with women ages 15
to 45, whether women or children in the household received Special SupplementalNutrition Program for Women, Infants and Children (WIC) benefits.
• Participation in community food programs. Whether households received emergency food from a church, food pantry, or food bank in the last 30 days; whether householdmembers went to a community program or senior center to eat prepared meals in thelast 30 days; whether adults ever ate any meals at a soup kitchen or shelter; whether inthe past 30 days anyone in the household received any meal from “Meals on Wheels” orany other program providing home-delivered meals.
• Mental health and well-being. Whether household experienced depression in the past30 days; whether the amount of help a household would expect to get from family living
nearby, if needed, was all, most, very little, or none of the help needed; whether theamount of help a household would expect to get from friends living nearby, if needed, was all, most, very little, or none of the help needed; and whether the amount of help ahousehold would expect to get from the community besides family and friends living nearby, if needed, was all, most, very little, or none of the help needed.
Standard Errors
Standard errors were estimated using a variance estimator based on a first-order Taylor seriesapproximation. We accounted for the complex survey design of the SNAPFS survey whenestimating standard errors by using the Stata software’s “svy” commands and identifying both theprimary sampling unit (PSU) identifier and the strata identifier. As an approximation, the standard
errors in the regression estimates based on the longitudinal sample do not account for multipleobservations per household.
3. Multivariate Analysis of Food Expenditures
The methodology used to estimate the association between SNAP and household foodexpenditures closely resembled the methodology used to estimate the association between SNAPand household food security. Below, we discuss the differences between the two approaches.
8/22/2019 USDA Report re SNAP & Food Security 08/2013
http://slidepdf.com/reader/full/usda-report-re-snap-food-security-082013 107/355
Appendix A Mathematica Policy Research
A-15
Outcome Measures
The SNAPFS survey included the food-expenditure module used in the CPS-FSS.46 Themodule first asked the respondent about the places where he or she bought food “last week.”Possible locations included supermarket or grocery store; meat market, produce stand, bakery, warehouse club, and convenience store; restaurant, fast fast-food restaurant, cafeteria, or vending machine; and “any other place.” Next, the respondent was asked how much the household spent last week for each set of store types from which the respondent reported purchasing food. As in theCPS-FSS, the respondent was asked to include purchases made with SNAP benefits. The computerinterviewing system calculated the total amount spent on food, and the interviewer confirmed withthe respondent last week’s total food expenditures.47
We used usual weekly food expenditures, rather than expenditures last week, as our mainoutcome measure, because research has shown that usual food expenditures estimated from datacollected using this module were consistent with estimates from the Consumer ExpenditureSurvey—the principal source of data on U.S. household expenditures for goods and services
(Oliveira and Rose 1996; Nord 2009). This approach is also consistent with the Economic ResearchService’s annual Household Food Security report (Coleman-Jensen et al. 2011).
Finally, the interviewer asked the respondenthow much the household usually spends on food in a week.
We used two measures of food expenditure as outcome variables. First, “Unadjusted” usual weekly household food expenditures was used as one outcome measure, and household size andcomposition were included among the set of explanatory variables used in the regression. We alsoused a second outcome measure that adjusted for household size and composition: usual weekly household food expenditures relative to the Thrifty Food Plan (TFP) spending amount. Wecalculated this value by dividing each household’s usual weekly food expenditures by the estimatedcost of the TFP for that household in the interview month. The TFP was developed by the USDAand serves as a national standard for a nutritious, minimal-cost diet. It represents a set of “market
baskets” of food that people in specific age and gender categories could consume at home tomaintain a healthful diet that meets current dietary standards, taking into account the foodconsumption patterns of U.S. households (U.S. Department of Agriculture, Center for NutritionPolicy and Promotion 2007). In addition to adjusting the usual weekly food spending amount by household size and composition, the TFP spending amount also adjusts for inflation in food prices. This approach is important mostly in the longitudinal analysis, when comparing food expendituresfrom April to September 2012 with expenditures that took place from October 2011 to February 2012.48
46 The CPS-FSS instrument can be found here
(
http://www.ers.usda.gov/datafiles/Food_Security_in_the_United_States/Current_Population_Survey/2011/qn2011.pdf )
47 For the first two categories of stores, respondents were also asked how much they spent on nonfood items (petfood, paper products, alcohol, detergents, or cleaning supplies). We excluded this amount from the total food spending amount.
48 From October 2011 to July 2012 (the most currently available TFP data), the cost of the TFP for a family of four(two adults ages 19 to 50, one child age 2 to 3 and a second child age 4 to 5) increased by 0.6 percent, from $125.40 to$126.20.

8/22/2019 USDA Report re SNAP & Food Security 08/2013
http://slidepdf.com/reader/full/usda-report-re-snap-food-security-082013 108/355
Appendix A Mathematica Policy Research
A-16
Empirical Model
Because both expenditure variables are continuous, we used ordinary least squares regressionanalysis to estimate the association between SNAP and each outcome measure. As in the foodsecurity regressions, the main independent variable was the binary SNAP participation variable. Theset of other explanatory variables was identical to the set used in those regressions, as well.
Because the regressions are specified to be linear, the raw coefficient on the SNAP participation variable measures the difference in usual weekly food expenditures (or usual expenditure relative tothe cost of the TFP) between six-month and new-entrant households, after accounting forcompositional differences between the two groups. In these models, there is no need to computemarginal effects separately. Regression-adjusted means were obtained in a way analogous to thatused for the regression-adjusted percentages of food insecure households. However, in place of amean predicted probability, the regression predictions yielded a mean predicted amount of expenditures (or expenditures per person per TFP) for each household in the sample.
As in the food security regressions, standard errors were estimated using a variance estimator
based on a first-order Taylor series approximation.
4. Weight Construction
We used sampling weights for all analyses to account for the complex sample design and for thepossibility that some groups in the study population may have been overrepresented orunderrepresented. Sampling weights were constructed to correct for differences in households’selection probabilities and propensities to respond. These weights restored the distribution of theresponding sample to the same proportions as the frame of SNAP participant households from which it was drawn.
Different sets of weights were constructed for the cross-sectional and longitudinal analyses
described above. Weights were also constructed separately for the samples of new-entrant and six-month households. All weights were intended only for use in making national estimates.
The weights are the products of several weighting factors that fall into three groups:
1. State-level selection and replacement of noncooperating States
2. Adjustments for selection probabilities within sampled States
3. Nonresponse adjustments at the household level
The sample design was a two-stage design, except in California, where three stages were used:
1. States were selected in the first stage.
2. In California, the second stage comprised groups of counties.
3. Households were selected at the final stage.
The Primary Sampling Units (PSUs) were states. Thirty-five states were selected using PPSmethods. A subsample of 5 States was selected as a reserve sample, and the main sample consistedof the remaining States. Because 5 of the 30 States in the main sample chose not to participate, allthe reserve States were used in the study.
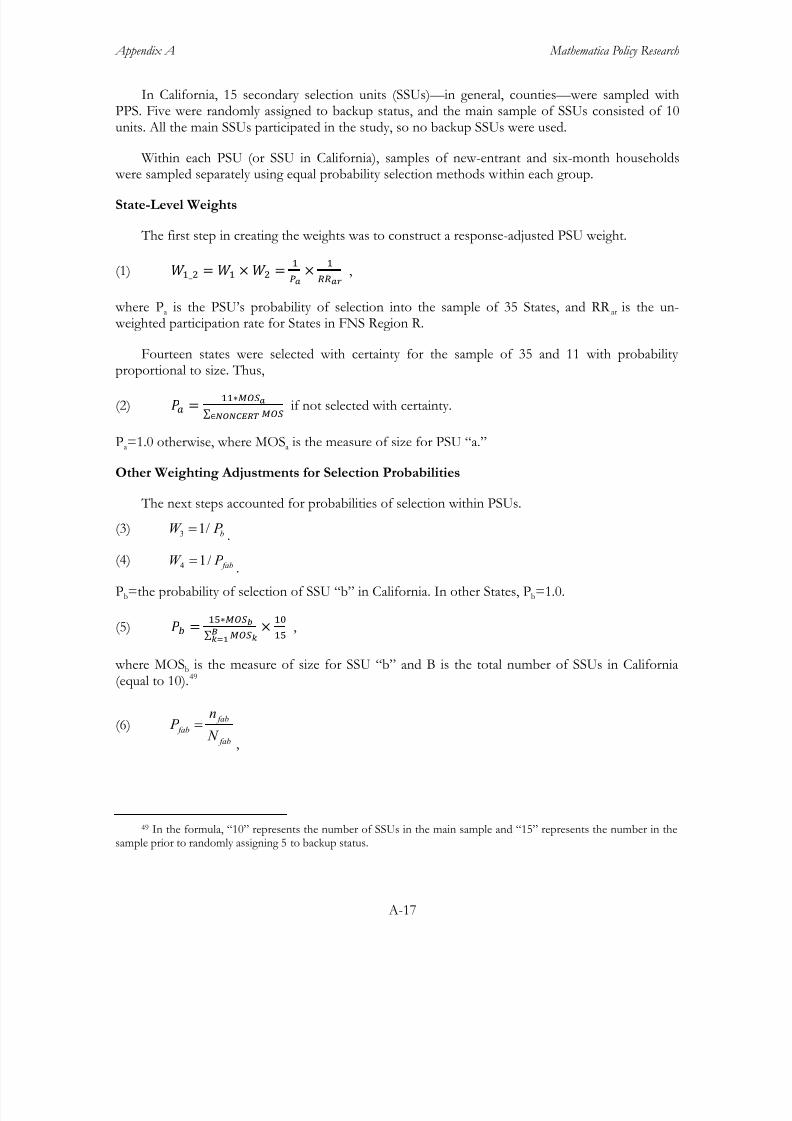
8/22/2019 USDA Report re SNAP & Food Security 08/2013
http://slidepdf.com/reader/full/usda-report-re-snap-food-security-082013 109/355
Appendix A Mathematica Policy Research
A-17
In California, 15 secondary selection units (SSUs)—in general, counties—were sampled withPPS. Five were randomly assigned to backup status, and the main sample of SSUs consisted of 10units. All the main SSUs participated in the study, so no backup SSUs were used.
Within each PSU (or SSU in California), samples of new-entrant and six-month households were sampled separately using equal probability selection methods within each group.
State-Level Weights
The first step in creating the weights was to construct a response-adjusted PSU weight.
(1) 1_2 = 1 ×2 =1
×
1
,
where Pa is the PSU’s probability of selection into the sample of 35 States, and RR ar is the un- weighted participation rate for States in FNS Region R.
Fourteen states were selected with certainty for the sample of 35 and 11 with probability
proportional to size. Thus,
(2) =11∗
∑ ∈if not selected with certainty.
Pa=1.0 otherwise, where MOSa is the measure of size for PSU “a.”
Other Weighting Adjustments for Selection Probabilities
The next steps accounted for probabilities of selection within PSUs.
(3)3
1/ bW P = .
(4)4
1/ fabW P =
.
Pb=the probability of selection of SSU “b” in California. In other States, Pb=1.0.
(5) =15∗
∑ =
×10
15,
where MOSb is the measure of size for SSU “b” and B is the total number of SSUs in California(equal to 10).49
(6) fab
fab
fab
n P
N =
,
49 In the formula, “10” represents the number of SSUs in the main sample and “15” represents the number in thesample prior to randomly assigning 5 to backup status.
8/22/2019 USDA Report re SNAP & Food Security 08/2013
http://slidepdf.com/reader/full/usda-report-re-snap-food-security-082013 110/355
Appendix A Mathematica Policy Research
A-18
where nfab is the number of households sampled from frame “F” (new-entrant or six-month) in PSU“A,” and in California, in SSU “B”, and Nfab is the number of cases on frame f in State a, and inCalifornia in SSU “b.”
Nonresponse Adjustments and Final Weight
The next set of weighting factors was obtained by conducting a nonresponse analysis andmaking adjustments for nonresponse. The nonresponse analysis was based on the SNAPadministrative data included in the state sampling frame and data from the American Community Survey (ACS) 2005-2009 summary file, which was the most recent summary file at the time of theconstruction of baseline sampling weights. The administrative data from the sampling framecontained several variables including age and gender of the SNAP unit head, language spoken in thehome, and the household’s residential ZIP code and address information. One of the most usefulpieces of information on the sample frame was the street address and zip code of households’residential location for all responders and nonresponders. We used Geographic Information System(GIS) software (ARC GIS), to geocode these addresses and assigned Census tract level areapopulation characteristics to each household using ACS data.
To perform the GIS-based nonresponse analysis, we first assigned the appropriate Census tractindicator to each household and then merged a file of tract-level population characteristics from the ACS to the household-level sample frame file. We then merged on a set of variables measuring population characteristics at the tract level that included:
• The percentage of individuals in the population with income less than 100 percent of the federal poverty threshold
• The percentage of individuals in the population with income less than 200 percent of the federal poverty threshold
• The percentage of Hispanic individuals in the population
• The percentage of non-white individuals in the population
• The percentage of households with female head with at least one child under 18
• The percentage of individuals in the population with less than a high school education
• The percentage of housing units without a vehicle
Once tract-level population characteristics were merged onto the household sample framerecords, these characteristics were treated in ways similar to the sample frame variables in analyzing nonresponse patterns and creating nonresponse adjustment factors.
In conducting the nonresponse analysis, we drew heavily on a recent technique called Chi-square Automatic Interaction Detection (CHAID) (Kass (1980); Biggs et al. (1991); Magidson(1993)). CHAID is a type of classification tree analysis that has been used for several years as a way of choosing variables to use in making weighting adjustments to survey data. Kalton and Flores-Cervantes (2003) discuss CHAID as one method of forming adjustment cells and mention its use in weighting the Continuing Survey of Food Intakes by Individuals and the Survey of Income andProgram Participation. In recent work, Siegel, Chromy and Copello (2005) used CHAID in acomparison of methods for making nonresponse weighting adjustments and Wun, et.al. (2005)discuss using CHAID to select auxiliary variables in a study of alternative weighting adjustmentmethods for the Medical Expenditure Panel Survey (MEPS).
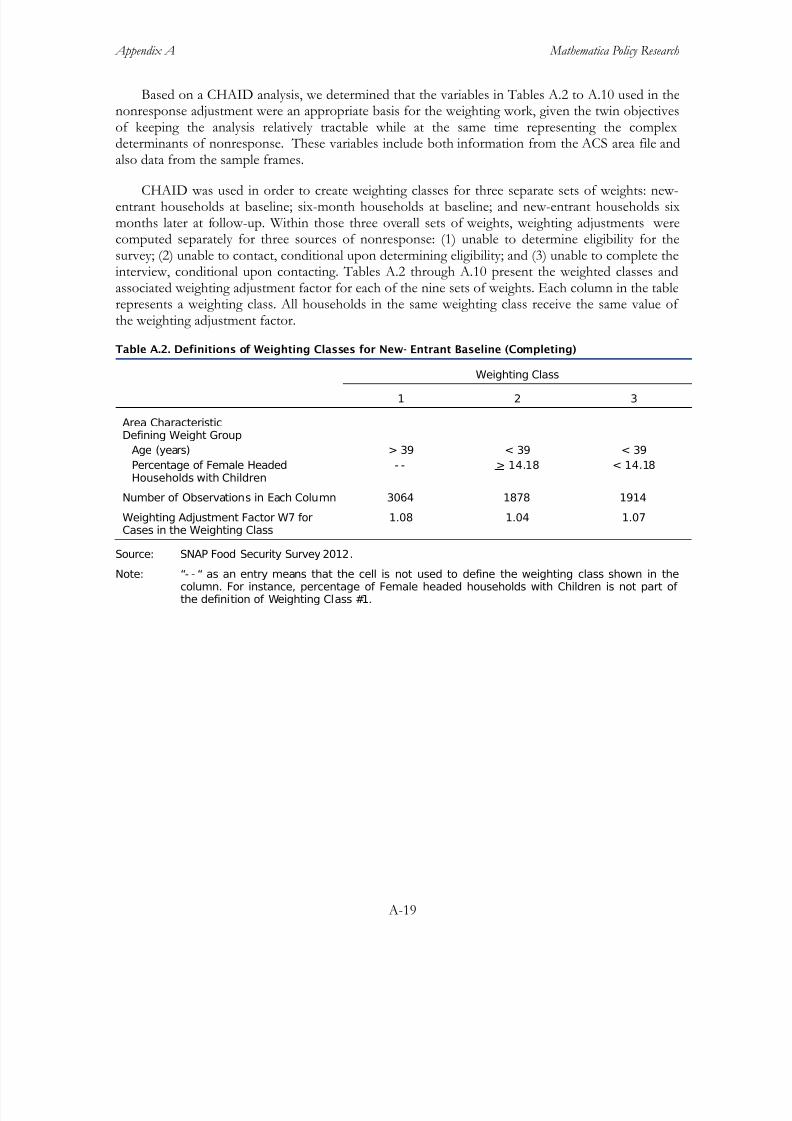
8/22/2019 USDA Report re SNAP & Food Security 08/2013
http://slidepdf.com/reader/full/usda-report-re-snap-food-security-082013 111/355
Appendix A Mathematica Policy Research
A-19
Based on a CHAID analysis, we determined that the variables in Tables A.2 to A.10 used in thenonresponse adjustment were an appropriate basis for the weighting work, given the twin objectivesof keeping the analysis relatively tractable while at the same time representing the complexdeterminants of nonresponse. These variables include both information from the ACS area file andalso data from the sample frames.
CHAID was used in order to create weighting classes for three separate sets of weights: new-entrant households at baseline; six-month households at baseline; and new-entrant households sixmonths later at follow-up. Within those three overall sets of weights, weighting adjustments werecomputed separately for three sources of nonresponse: (1) unable to determine eligibility for thesurvey; (2) unable to contact, conditional upon determining eligibility; and (3) unable to complete theinterview, conditional upon contacting. Tables A.2 through A.10 present the weighted classes andassociated weighting adjustment factor for each of the nine sets of weights. Each column in the tablerepresents a weighting class. All households in the same weighting class receive the same value of the weighting adjustment factor.
Table A.2. Definitions of Weighting Classes for New- Entrant Baseline (Completing)
Weighting Class
1 2 3
Area CharacteristicDefining Weight Group
Age (years) > 39 < 39 < 39
Percentage of Female HeadedHouseholds with Children
- - > 14.18 < 14.18
Number of Observations in Each Column 3064 1878 1914
Weighting Adjustment Factor W7 forCases in the Weighting Class
1.08 1.04 1.07
Source: SNAP Food Security Survey 2012.
Note: “- - “ as an entry means that the cell is not used to define the weighting class shown in thecolumn. For instance, percentage of Female headed households with Children is not part of the definition of Weighting Class #1.

8/22/2019 USDA Report re SNAP & Food Security 08/2013
http://slidepdf.com/reader/full/usda-report-re-snap-food-security-082013 112/355
Appendix A Mathematica Policy Research
A-20
Table A.3. Definitions of Weighting Classes for New- Entrant Baseline (Eligibility Determination)
Weighting Class Number
1 2 3 4 5 6
Area Characteristic Defining
Weighting ClassPercentage of non- whiteindividuals in the population
> 10 < 10 < 10 < 10 < 10 < 10
Percentage of Hispanic individualsin the population
- - < 7.23 < 7.23 < 7.23 < 7.23 > 7.23
Age (years) - - > 30 > 30 > 30 > 30 - -
Language - - Not Eng Not Eng Eng - - - -
Gender (male=1) - - 1 ormissing
0 - - - - - -
Number of Observations in EachColumn
5284 499 750 94 692 401
Weighting Adjustment Factor for
Cases in the Weighting Class
1.12 1.08 1.05 1.13 1.11 1.14
Source: SNAP Food Security Survey 2012.
Note: “- - “ as an entry means that the cell is not used to define the weighting class shown in thecolumn. For instance, percentage of Hispanic individuals in the population is not part of thedefinition of Weighting Class #1.

8/22/2019 USDA Report re SNAP & Food Security 08/2013
http://slidepdf.com/reader/full/usda-report-re-snap-food-security-082013 113/355
A-2 1
Table A.4. Definitions of Weighting Classes for New- Entrant Baseline (Contacting)
Weighting Class Number
1 2 3 4 5 6 7 8 9 10 11 12 13 14 15 16
Area CharacteristicDefining Weighting Class
The percentage of non- white individualsin the population
- - > 55 < 55 < 55 > 10 < 10 - - - - - - - - > 55 < 55 < 55 - - - - - -
Age (years) > 39 > 39 > 39 > 39 > 30< 39
> 30< 39
> 30< 39
> 30< 39
>30<39
>30<39
< 30 < 30 < 30 < 30 < 30 < 30
Language - - - - Eng NotEng
Eng Eng Eng NotEng
Eng NotEng
Eng Eng Eng NotEng
Eng NotEng
Percentage under 200percent of the FederalPoverty Threshold
- - - - - - - - - - - - - - - - - - - - - - >40.43
<40.43
- - - - - -
Percentage with atleast a High SchoolEducation
- - - - - - - -
25.73
> > <25.7325.73
- - - - - - - - - - - - - - - - - -
Gender (male=1) 0 1 ormiss.
1 ormiss.
1 ormiss.
0 ormiss.
0 ormiss.
0 ormiss.
0 ormiss.
1 1 0 ormiss.
0 ormiss.
0 ormiss.
0 ormiss.
1 1
Number of Observationsin each Column
2524 523 1372 308 354 187 573 288 964 136 471 729 1028 460 1600 189
Weighting AdjustmentFactor W5 for Cases inthe Weighting Class
1.33 1.61 1.42 1.29 1.68 1.42 1.45 1.35 1.76 1.51 1.78 1.49 1.63 1.44 1.83 1.48
Source: SNAP Food Security Survey 2012.
Note: “- - “ as an entry means that the cell is not used to define the weighting class shown in the column. For instance, percentage of non-white individuals in the population is not part of the definition of Weighting Class #1.
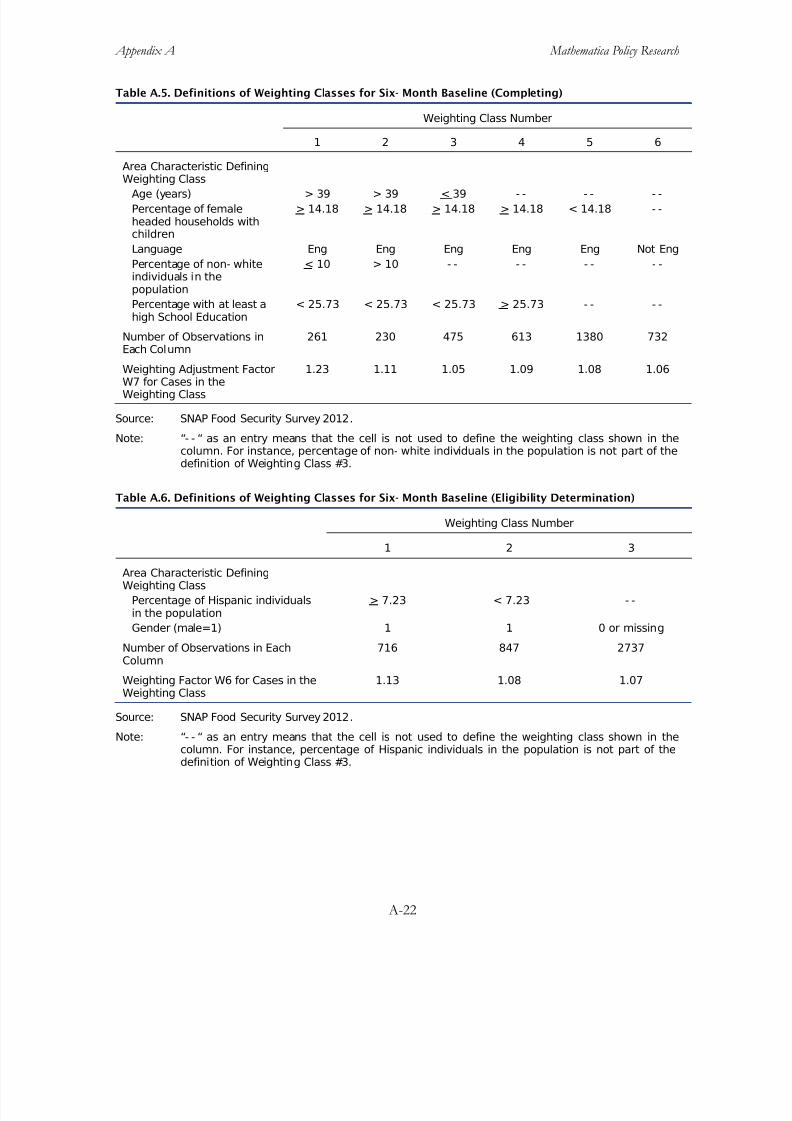
8/22/2019 USDA Report re SNAP & Food Security 08/2013
http://slidepdf.com/reader/full/usda-report-re-snap-food-security-082013 114/355
Appendix A Mathematica Policy Research
A-22
Table A.5. Definitions of Weighting Classes for Six- Month Baseline (Completing)
Weighting Class Number
1 2 3 4 5 6
Area Characteristic Defining
Weighting ClassAge (years) > 39 > 39 < - -39 - - - -
Percentage of femaleheaded households withchildren
> 14.18 > 14.18 > 14.18 > 14.18 < 14.18 - -
Language Eng Eng Eng Eng Eng Not Eng
Percentage of non- whiteindividuals in thepopulation
< 10 > 10 - - - - - - - -
Percentage with at least ahigh School Education
< 25.73 < 25.73 < 25.73 > 25.73 - - - -
Number of Observations inEach Column
261 230 475 613 1380 732
Weighting Adjustment FactorW7 for Cases in theWeighting Class
1.23 1.11 1.05 1.09 1.08 1.06
Source: SNAP Food Security Survey 2012.
Note: “- - “ as an entry means that the cell is not used to define the weighting class shown in thecolumn. For instance, percentage of non- white individuals in the population is not part of thedefinition of Weighting Class #3.
Table A.6. Definitions of Weighting Classes for Six- Month Baseline (Eligibility Determination)
Weighting Class Number
1 2 3
Area Characteristic DefiningWeighting Class
Percentage of Hispanic individualsin the population
> 7.23 < 7.23 - -
Gender (male=1) 1 1 0 or missing
Number of Observations in EachColumn
716 847 2737
Weighting Factor W6 for Cases in theWeighting Class
1.13 1.08 1.07
Source: SNAP Food Security Survey 2012.
Note: “- - “ as an entry means that the cell is not used to define the weighting class shown in thecolumn. For instance, percentage of Hispanic individuals in the population is not part of thedefinition of Weighting Class #3.
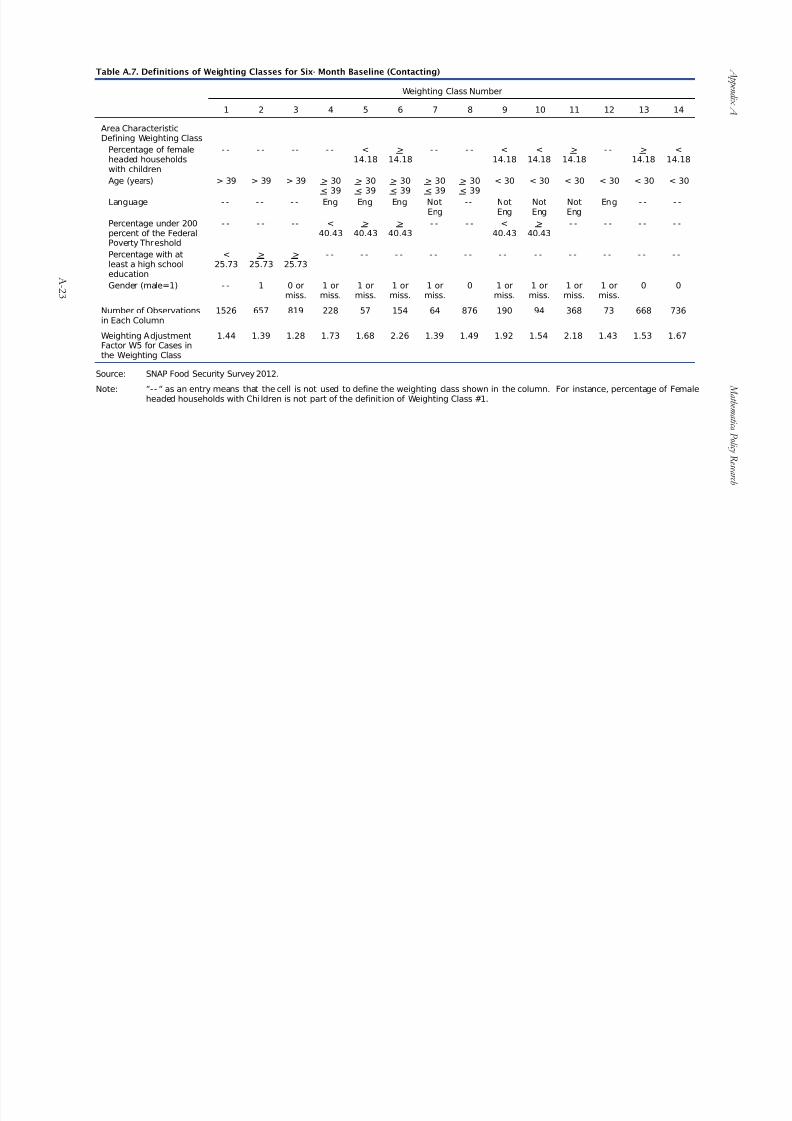
8/22/2019 USDA Report re SNAP & Food Security 08/2013
http://slidepdf.com/reader/full/usda-report-re-snap-food-security-082013 115/355
A-2 3
Table A.7. Definitions of Weighting Classes for Six- Month Baseline (Contacting)
Weighting Class Number
1 2 3 4 5 6 7 8 9 10 11 12 13 14
Area CharacteristicDefining Weighting Class
Percentage of femaleheaded householdswith children
- - - - -- - - <14.18
>14.18
- - - - <14.18
<14.18
>14.18
- - >14.18
<14.18
Age (years) > 39 > 39 > 39 > 30< 39
> 30< 39
> 30< 39
> 30< 39
> 30< 39
< 30 < 30 < 30 < 30 < 30 < 30
Language - - - - - - Eng Eng Eng NotEng
-- NotEng
NotEng
NotEng
Eng - - - -
Percentage under 200percent of the FederalPoverty Threshold
- - - - -- <40.43
>40.43
>40.43
- - - - <40.43
>40.43
- - - - - - - -
Percentage with atleast a high schooleducation
<25.73
>25.73
>25.73
- - - - - - - - - - - - - - - - - - - - - -
Gender (male=1) - - 1 0 ormiss.
1 ormiss.
1 ormiss.
1 ormiss.
1 ormiss.
0 1 ormiss.
1 ormiss.
1 ormiss.
1 ormiss.
0 0
Number of Observationsin Each Column
1526 657 819 228 57 154 64 876 190 94 368 73 668 736
Weighting AdjustmentFactor W5 for Cases inthe Weighting Class
1.44 1.39 1.28 1.73 1.68 2.26 1.39 1.49 1.92 1.54 2.18 1.43 1.53 1.67
Source: SNAP Food Security Survey 2012.
Note: “-- “ as an entry means that the cell is not used to define the weighting class shown in the column. For instance, percentage of Femaleheaded households with Chi ldren is not part of the definition of Weighting Class #1.
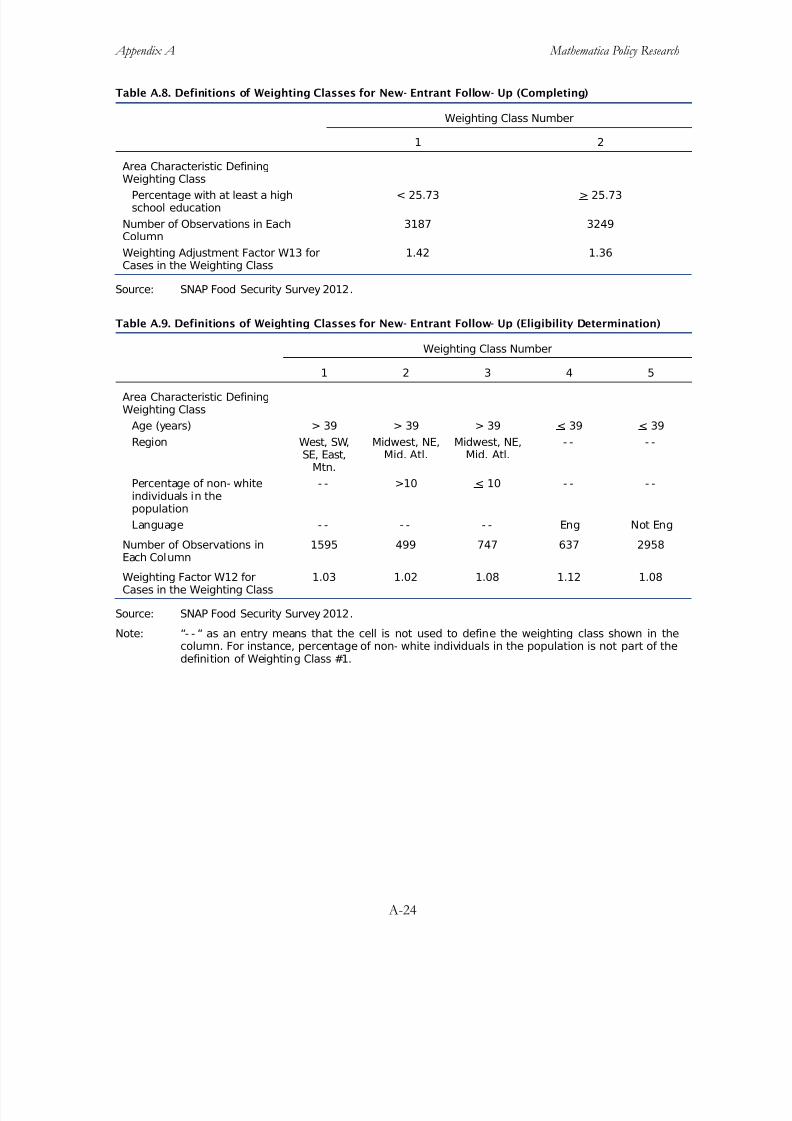
8/22/2019 USDA Report re SNAP & Food Security 08/2013
http://slidepdf.com/reader/full/usda-report-re-snap-food-security-082013 116/355
Appendix A Mathematica Policy Research
A-24
Table A.8. Definitions of Weighting Classes for New- Entrant Follow- Up (Completing)
Weighting Class Number
1 2
Area Characteristic Defining
Weighting ClassPercentage with at least a highschool education
< 25.73 > 25.73
Number of Observations in EachColumn
3187 3249
Weighting Adjustment Factor W13 forCases in the Weighting Class
1.42 1.36
Source: SNAP Food Security Survey 2012.
Table A.9. Definitions of Weighting Classes for New- Entrant Follow- Up (Eligibility Determination)
Weighting Class Number
1 2 3 4 5
Area Characteristic DefiningWeighting Class
Age (years) > 39 > 39 > 39 < 39 < 39
Region West, SW,SE, East,
Mtn.
Midwest, NE,Mid. Atl.
Midwest, NE,Mid. Atl.
- - - -
Percentage of non- whiteindividuals in thepopulation
- - >10 < 10 - - - -
Language - - - - - - Eng Not Eng
Number of Observations inEach Column
1595 499 747 637 2958
Weighting Factor W12 forCases in the Weighting Class
1.03 1.02 1.08 1.12 1.08
Source: SNAP Food Security Survey 2012.
Note: “- - “ as an entry means that the cell is not used to define the weighting class shown in thecolumn. For instance, percentage of non- white individuals in the population is not part of thedefinition of Weighting Class #1.

8/22/2019 USDA Report re SNAP & Food Security 08/2013
http://slidepdf.com/reader/full/usda-report-re-snap-food-security-082013 117/355
Appendix A Mathematica Policy Research
A-25
Table A.10. Definitions of Weighting Classes for New- Entrant Follow- Up (Contacting)
Weighting Class Number
1 2 3 4 5 6 7
Area Characteristic
Defining WeightingClass
Percentage with atleast a high schooleducation
- - > 25.73 < 25.73 - - - - - - - -
Percentage of Hispanic individuals inthe population
- - - - - - > 7.23 < 7.23 < 7.23 < 7.23
Age (years) > 39 < 39 < 39 < 39 > 30
<
< 30
39
< 30
Region - - - - - - - - - - West, SE,NE
Midwest,Mid. Atl.,SW, East,
Mtn.
Gender (male=1) - - 1 1 0 ormiss.
0 ormiss.
0 ormiss.
0 ormiss.
Number of Observations in EachColumn
2841 651 688 1072 428 268 488
Weighting Factor W11for Cases in theWeighting Class
1.21 1.61 1.47 1.47 1.28 1.23 1.51
Source: SNAP Food Security Survey 2012.
Note: “- - “ as an entry means that the cell is not used to define the weighting class shown in thecolumn. For instance, percentage non- white is not part of the definition of Weighting Class
#1.
Characteristics of households and the areas in which households lived that were identified by the nonresponse analysis as being associated with nonresponse were used to define weighting classesto compute nonresponse adjustments. Based on the output of the CHAID analysis we decided tocreate weighting classes and perform adjustments separately for the contact rate (equal to thenumber of households successfully contacted divided by the number of households released forinterviewing), the eligibility determination rate (equal to the number of households that were eligiblefor the survey divided by the number of households contacted), and the completion rate (equal tothe number of households that completed the survey divided by the number of households that were contacted and were eligible for the survey). Adjustments were done separately for the baseline
newcomers, the newcomers at follow up at six months, and the six-month sample at baseline.
Returning to the mathematical discussion of the weights,
(7) 5 =1
,
(8) 6 =1
,
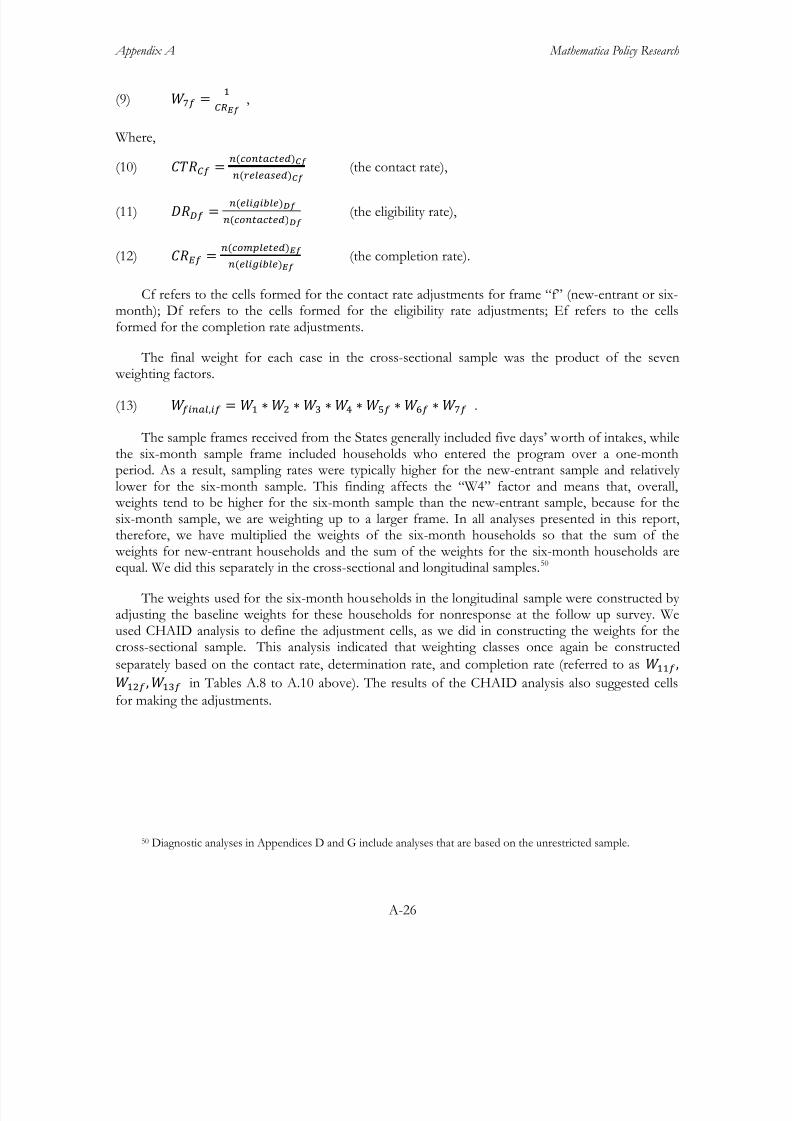
8/22/2019 USDA Report re SNAP & Food Security 08/2013
http://slidepdf.com/reader/full/usda-report-re-snap-food-security-082013 118/355
Appendix A Mathematica Policy Research
A-26
(9) 7 =1
,
Where,
(10) =()
()(the contact rate),
(11) =()
()(the eligibility rate),
(12) =()
()(the completion rate).
Cf refers to the cells formed for the contact rate adjustments for frame “f” (new-entrant or six-month); Df refers to the cells formed for the eligibility rate adjustments; Ef refers to the cellsformed for the completion rate adjustments.
The final weight for each case in the cross-sectional sample was the product of the seven weighting factors.
(13) , = 1 ∗2 ∗ 3 ∗4 ∗ 5 ∗ 6 ∗ 7 .
The sample frames received from the States generally included five days’ worth of intakes, whilethe six-month sample frame included households who entered the program over a one-monthperiod. As a result, sampling rates were typically higher for the new-entrant sample and relatively lower for the six-month sample. This finding affects the “W4” factor and means that, overall, weights tend to be higher for the six-month sample than the new-entrant sample, because for thesix-month sample, we are weighting up to a larger frame. In all analyses presented in this report,therefore, we have multiplied the weights of the six-month households so that the sum of the
weights for new-entrant households and the sum of the weights for the six-month households areequal. We did this separately in the cross-sectional and longitudinal samples. 50
The weights used for the six-month households in the longitudinal sample were constructed by adjusting the baseline weights for these households for nonresponse at the follow up survey. Weused CHAID analysis to define the adjustment cells, as we did in constructing the weights for thecross-sectional sample. This analysis indicated that weighting classes once again be constructed
separately based on the contact rate, determination rate, and completion rate (referred to as 11 ,
12 ,13 in Tables A.8 to A.10 above). The results of the CHAID analysis also suggested cells
for making the adjustments.
50 Diagnostic analyses in Appendices D and G include analyses that are based on the unrestricted sample.

8/22/2019 USDA Report re SNAP & Food Security 08/2013
http://slidepdf.com/reader/full/usda-report-re-snap-food-security-082013 119/355
APPENDIX B
EXPANDED SET OF CHARACTERISTICS OF NEW- ENTRANT AND SIX- MONTH
SNAP HOUSEHOLDS

8/22/2019 USDA Report re SNAP & Food Security 08/2013
http://slidepdf.com/reader/full/usda-report-re-snap-food-security-082013 120/355
This page has been left blank for double-sided copying.

8/22/2019 USDA Report re SNAP & Food Security 08/2013
http://slidepdf.com/reader/full/usda-report-re-snap-food-security-082013 121/355
Appendix B Mathematica Policy Research
B-3
In this appendix, we use tabular methods to examine the characteristics of SNAP participants inthe study, including both new-entrant and six-month households. The tables are structured the sameas the Chapter III tables. All the control variables shown in the Chapter III tables are included inthis appendix.
Table B.1 highlights the categorical variables which vary “substantially” between new-entrantand six-month households, where “substantially” is defined as a difference of at least 5 percentagepoints. Several continuous variables (presented in tables B.5 and B.6) also show considerable variation between the analysis samples.
Table B.1. Variables for Which There is at Least a 5 Percentage Point Difference between New- Entrant and Six-Month Household Percentages For at Least One of the Cross- Sectional or Longitudinal Samples
Variable TableNumber
Cross Section Sample
Which Group Has Higher Valueof Variable?
Longitudinal Sample
Region of Residence: Mid- Atlantic
Which Group Has Higher Valueof Variable?
B.2 Six- month NSD
Region of Residence: Midwestern B.2 Six- month NSD
Region of Residence: Southeastern B.2 New-entrant NSDHousehold has only One Person B.3 New-entrant NSD
Household Has Children B.3 Six- month NSD
Household Has Disabled Member B.3 NSD New-entrant
Household Head is Not Employed B.3 New-entrant New-entrant
Household Has No Income B.4 New- entrant New- entrant
Receives Financial Support from Familyor Friends
B.5 NSD New-entrant
Lives in House, Townhouse, or Condo B.7 Six- month NSD
Change in Household Size in PreviousSix Months
B.8 New- entrant New- entrant
Change in Employment, Pay, or HoursWorked in Previous 6 Months
B.8 New- entrant New- entrant
Received SNAP Benefits 12 Months Ago B.9 New-entrant n.a.
SNAP Benefits Between 101 and 200per Month
B.9 Six- month Six- month
SNAP Benefits between 201 and 301 B.9 New-entrant New-entrant
Children in NSLP in Previous 30 Days B.10 NSD New-entrant
Children in SBP in Previous 30 Days B.10 NSD New-entrant
Received Emergency Food from Church,Food Bank, etc. in Previous 30 Days
B.10 NSD New-entrant
Interviewed closer to date of receivingSNAP benefits
B.12 New- entrant New- entrant
Use Discount Coupons when BuyingFood
B.12 NSD Six- month
Sometimes Buy Large Quantities forCheap Prices
B.12 NSD Six- month
Percentage of respondents that in thelast 30 days felt sad, nervous, restless,
hopeless, worthless
B.14 New- entrant New- entrant
Source: SNAP Food Security Survey 2012.
Notes: “NSD” stands for “no substantial difference” between groups, where “substantial differences” are definedto be 5 percentage points or more. n.a. = not applicable.
The cross- sectional sample refers to a sample of new SNAP participant households and acontemporaneous sample of households that have received SNAP for about six months, interviewed fromOctober 2011 to February 2012. The longitudinal sample refers to sample of new- entrant householdsinterviewed from October 2011 to February 2012 and those same households interviewed again after theyreceived benefits for about six months, from April 2012 to September 2012.
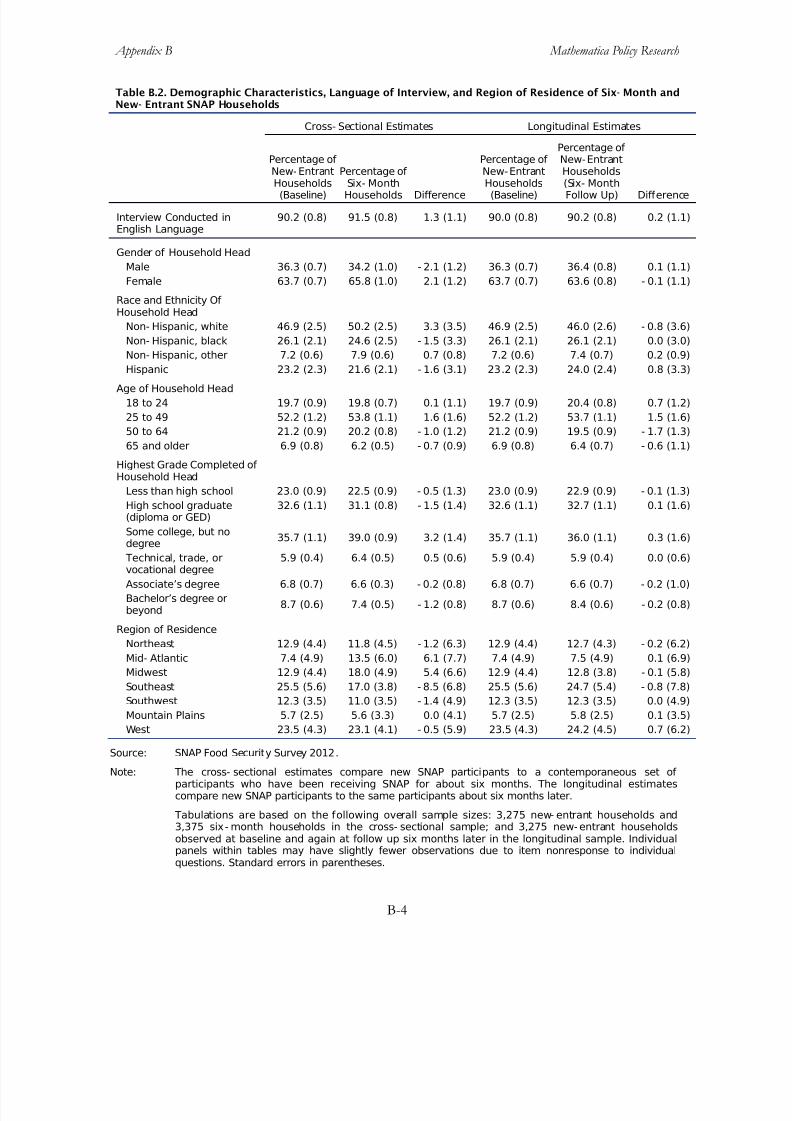
8/22/2019 USDA Report re SNAP & Food Security 08/2013
http://slidepdf.com/reader/full/usda-report-re-snap-food-security-082013 122/355
Appendix B Mathematica Policy Research
B-4
Table B.2. Demographic Characteristics, Language of Interview, and Region of Residence of Six- Month andNew- Entrant SNAP Households
Cross- Sectional Estimates Longitudinal Estimates
Percentage of New-Entrant
Households(Baseline)
Percentage of
Six- MonthHouseholds Difference
Percentage of New-Entrant
Households(Baseline)
Percentage of New-EntrantHouseholds
(Six- MonthFollow Up) Difference
Interview Conducted inEnglish Language
90.2 (0.8) 91.5 (0.8) 1.3 (1.1) 90.0 (0.8) 90.2 (0.8) 0.2 (1.1)
Gender of Household Head
Male 36.3 (0.7) 34.2 (1.0) - 2.1 (1.2) 36.3 (0.7) 36.4 (0.8) 0.1 (1.1)
Female 63.7 (0.7) 65.8 (1.0) 2.1 (1.2) 63.7 (0.7) 63.6 (0.8) - 0.1 (1.1)
Race and Ethnicity Of Household Head
Non- Hispanic, white 46.9 (2.5) 50.2 (2.5) 3.3 (3.5) 46.9 (2.5) 46.0 (2.6) - 0.8 (3.6)
Non- Hispanic, black 26.1 (2.1) 24.6 (2.5) - 1.5 (3.3) 26.1 (2.1) 26.1 (2.1) 0.0 (3.0)
Non- Hispanic, other 7.2 (0.6) 7.9 (0.6) 0.7 (0.8) 7.2 (0.6) 7.4 (0.7) 0.2 (0.9)
Hispanic 23.2 (2.3) 21.6 (2.1) - 1.6 (3.1) 23.2 (2.3) 24.0 (2.4) 0.8 (3.3)
Age of Household Head
18 to 24 19.7 (0.9) 19.8 (0.7) 0.1 (1.1) 19.7 (0.9) 20.4 (0.8) 0.7 (1.2)
25 to 49 52.2 (1.2) 53.8 (1.1) 1.6 (1.6) 52.2 (1.2) 53.7 (1.1) 1.5 (1.6)
50 to 64 21.2 (0.9) 20.2 (0.8) - 1.0 (1.2) 21.2 (0.9) 19.5 (0.9) - 1.7 (1.3)
65 and older 6.9 (0.8) 6.2 (0.5) - 0.7 (0.9) 6.9 (0.8) 6.4 (0.7) - 0.6 (1.1)
Highest Grade Completed of Household Head
Less than high school 23.0 (0.9) 22.5 (0.9) - 0.5 (1.3) 23.0 (0.9) 22.9 (0.9) - 0.1 (1.3)
High school graduate(diploma or GED)
32.6 (1.1) 31.1 (0.8) - 1.5 (1.4) 32.6 (1.1) 32.7 (1.1) 0.1 (1.6)
Some college, but nodegree
35.7 (1.1) 39.0 (0.9) 3.2 (1.4) 35.7 (1.1) 36.0 (1.1) 0.3 (1.6)
Technical, trade, orvocational degree
5.9 (0.4) 6.4 (0.5) 0.5 (0.6) 5.9 (0.4) 5.9 (0.4) 0.0 (0.6)
Associate’s degree 6.8 (0.7) 6.6 (0.3) - 0.2 (0.8) 6.8 (0.7) 6.6 (0.7) - 0.2 (1.0)
Bachelor’s degree orbeyond
8.7 (0.6) 7.4 (0.5) - 1.2 (0.8) 8.7 (0.6) 8.4 (0.6) - 0.2 (0.8)
Region of Residence
Northeast 12.9 (4.4) 11.8 (4.5) - 1.2 (6.3) 12.9 (4.4) 12.7 (4.3) - 0.2 (6.2)
Mid- Atlantic 7.4 (4.9) 13.5 (6.0) 6.1 (7.7) 7.4 (4.9) 7.5 (4.9) 0.1 (6.9)
Midwest 12.9 (4.4) 18.0 (4.9) 5.4 (6.6) 12.9 (4.4) 12.8 (3.8) - 0.1 (5.8)
Southeast 25.5 (5.6) 17.0 (3.8) - 8.5 (6.8) 25.5 (5.6) 24.7 (5.4) - 0.8 (7.8)
Southwest 12.3 (3.5) 11.0 (3.5) - 1.4 (4.9) 12.3 (3.5) 12.3 (3.5) 0.0 (4.9)
Mountain Plains 5.7 (2.5) 5.6 (3.3) 0.0 (4.1) 5.7 (2.5) 5.8 (2.5) 0.1 (3.5)
West 23.5 (4.3) 23.1 (4.1) - 0.5 (5.9) 23.5 (4.3) 24.2 (4.5) 0.7 (6.2)
Source: SNAP Food Security Survey 2012.
Note: The cross- sectional estimates compare new SNAP participants to a contemporaneous set of participants who have been receiving SNAP for about six months. The longitudinal estimatescompare new SNAP participants to the same participants about six months later.
Tabulations are based on the following overall sample sizes: 3,275 new- entrant households and3,375 six- month households in the cross- sectional sample; and 3,275 new- entrant householdsobserved at baseline and again at follow up six months later in the longitudinal sample. Individualpanels within tables may have slightly fewer observations due to item nonresponse to individualquestions. Standard errors in parentheses.
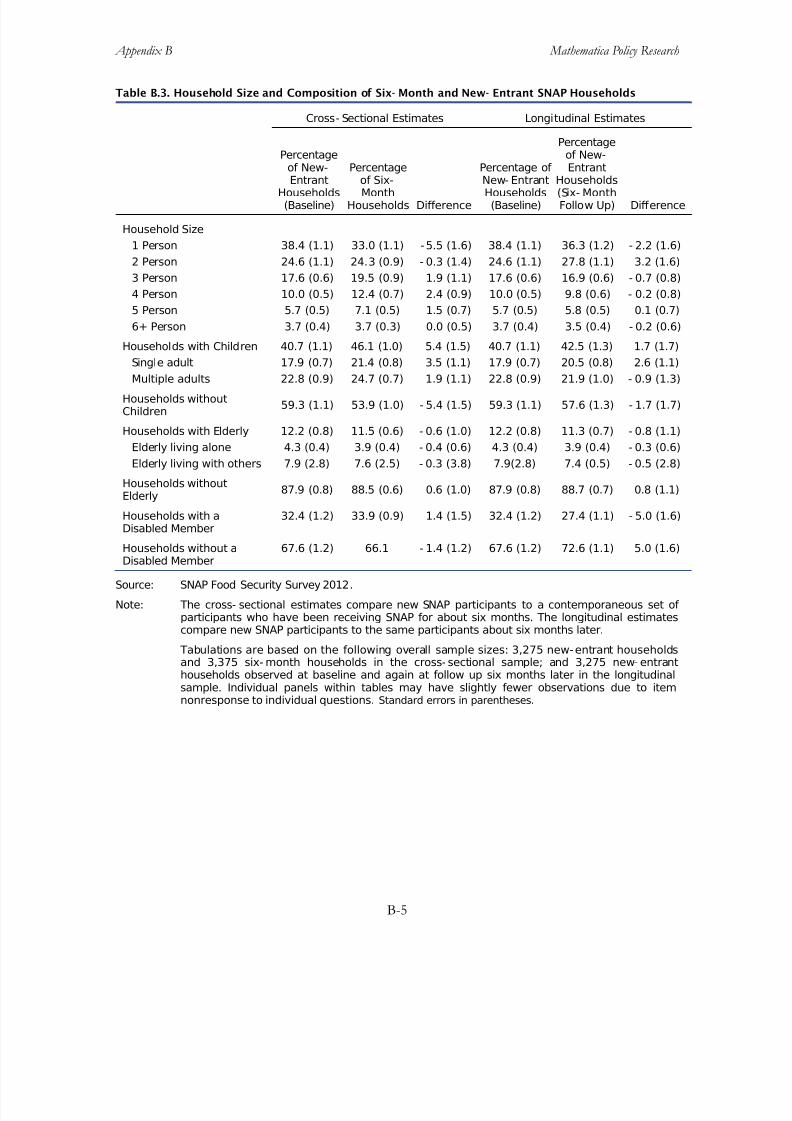
8/22/2019 USDA Report re SNAP & Food Security 08/2013
http://slidepdf.com/reader/full/usda-report-re-snap-food-security-082013 123/355
Appendix B Mathematica Policy Research
B-5
Table B.3. Household Size and Composition of Six- Month and New- Entrant SNAP Households
Cross- Sectional Estimates Longitudinal Estimates
Percentageof New-
EntrantHouseholds(Baseline)
Percentage
of Six-MonthHouseholds Difference
Percentage of
New- EntrantHouseholds(Baseline)
Percentageof New-Entrant
Households(Six- MonthFollow Up) Difference
Household Size
1 Person 38.4 (1.1) 33.0 (1.1) -5.5 (1.6) 38.4 (1.1) 36.3 (1.2) - 2.2 (1.6)
2 Person 24.6 (1.1) 24.3 (0.9) - 0.3 (1.4) 24.6 (1.1) 27.8 (1.1) 3.2 (1.6)
3 Person 17.6 (0.6) 19.5 (0.9) 1.9 (1.1) 17.6 (0.6) 16.9 (0.6) - 0.7 (0.8)
4 Person 10.0 (0.5) 12.4 (0.7) 2.4 (0.9) 10.0 (0.5) 9.8 (0.6) - 0.2 (0.8)
5 Person 5.7 (0.5) 7.1 (0.5) 1.5 (0.7) 5.7 (0.5) 5.8 (0.5) 0.1 (0.7)
6+ Person 3.7 (0.4) 3.7 (0.3) 0.0 (0.5) 3.7 (0.4) 3.5 (0.4) - 0.2 (0.6)
Households with Children 40.7 (1.1) 46.1 (1.0) 5.4 (1.5) 40.7 (1.1) 42.5 (1.3) 1.7 (1.7)
Single adult 17.9 (0.7) 21.4 (0.8) 3.5 (1.1) 17.9 (0.7) 20.5 (0.8) 2.6 (1.1)Multiple adults 22.8 (0.9) 24.7 (0.7) 1.9 (1.1) 22.8 (0.9) 21.9 (1.0) - 0.9 (1.3)
Households withoutChildren
59.3 (1.1) 53.9 (1.0) - 5.4 (1.5) 59.3 (1.1) 57.6 (1.3) - 1.7 (1.7)
Households with Elderly 12.2 (0.8) 11.5 (0.6) - 0.6 (1.0) 12.2 (0.8) 11.3 (0.7) - 0.8 (1.1)
Elderly living alone 4.3 (0.4) 3.9 (0.4) - 0.4 (0.6) 4.3 (0.4) 3.9 (0.4) - 0.3 (0.6)
Elderly living with others 7.9 (2.8) 7.6 (2.5) - 0.3 (3.8) 7.9(2.8) 7.4 (0.5) - 0.5 (2.8)
Households withoutElderly
87.9 (0.8) 88.5 (0.6) 0.6 (1.0) 87.9 (0.8) 88.7 (0.7) 0.8 (1.1)
Households with aDisabled Member
32.4 (1.2) 33.9 (0.9) 1.4 (1.5) 32.4 (1.2) 27.4 (1.1) - 5.0 (1.6)
Households without aDisabled Member 67.6 (1.2) 66.1 - 1.4 (1.2) 67.6 (1.2) 72.6 (1.1) 5.0 (1.6)
Source: SNAP Food Security Survey 2012.
Note: The cross- sectional estimates compare new SNAP participants to a contemporaneous set of participants who have been receiving SNAP for about six months. The longitudinal estimatescompare new SNAP participants to the same participants about six months later.
Tabulations are based on the following overall sample sizes: 3,275 new-entrant householdsand 3,375 six- month households in the cross- sectional sample; and 3,275 new- entranthouseholds observed at baseline and again at follow up six months later in the longitudinalsample. Individual panels within tables may have slightly fewer observations due to itemnonresponse to individual questions. Standard errors in parentheses.
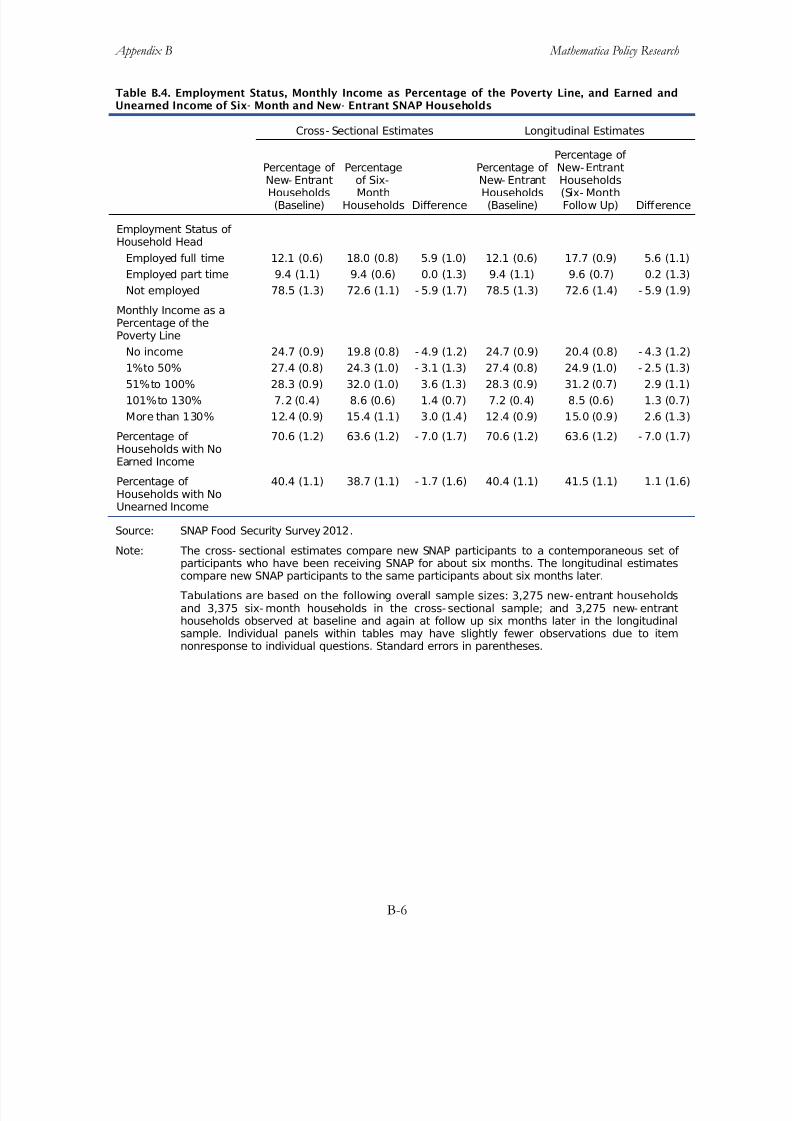
8/22/2019 USDA Report re SNAP & Food Security 08/2013
http://slidepdf.com/reader/full/usda-report-re-snap-food-security-082013 124/355
Appendix B Mathematica Policy Research
B-6
Table B.4. Employment Status, Monthly Income as Percentage of the Poverty Line, and Earned andUnearned Income of Six- Month and New- Entrant SNAP Households
Cross- Sectional Estimates Longitudinal Estimates
Percentage of
New- EntrantHouseholds(Baseline)
Percentage
of Six-MonthHouseholds Difference
Percentage of
New- EntrantHouseholds(Baseline)
Percentage of New-Entrant
Households(Six- MonthFollow Up) Difference
Employment Status of Household Head
Employed full time 12.1 (0.6) 18.0 (0.8) 5.9 (1.0) 12.1 (0.6) 17.7 (0.9) 5.6 (1.1)
Employed part time 9.4 (1.1) 9.4 (0.6) 0.0 (1.3) 9.4 (1.1) 9.6 (0.7) 0.2 (1.3)
Not employed 78.5 (1.3) 72.6 (1.1) - 5.9 (1.7) 78.5 (1.3) 72.6 (1.4) - 5.9 (1.9)
Monthly Income as aPercentage of thePoverty Line
No income 24.7 (0.9) 19.8 (0.8) - 4.9 (1.2) 24.7 (0.9) 20.4 (0.8) - 4.3 (1.2)
1%to 50% 27.4 (0.8) 24.3 (1.0) - 3.1 (1.3) 27.4 (0.8) 24.9 (1.0) - 2.5 (1.3)51%to 100% 28.3 (0.9) 32.0 (1.0) 3.6 (1.3) 28.3 (0.9) 31.2 (0.7) 2.9 (1.1)
101%to 130% 7.2 (0.4) 8.6 (0.6) 1.4 (0.7) 7.2 (0.4) 8.5 (0.6) 1.3 (0.7)
More than 130% 12.4 (0.9) 15.4 (1.1) 3.0 (1.4) 12.4 (0.9) 15.0 (0.9) 2.6 (1.3)
Percentage of Households with NoEarned Income
70.6 (1.2) 63.6 (1.2) - 7.0 (1.7) 70.6 (1.2) 63.6 (1.2) - 7.0 (1.7)
Percentage of Households with NoUnearned Income
40.4 (1.1) 38.7 (1.1) - 1.7 (1.6) 40.4 (1.1) 41.5 (1.1) 1.1 (1.6)
Source: SNAP Food Security Survey 2012.
Note: The cross- sectional estimates compare new SNAP participants to a contemporaneous set of participants who have been receiving SNAP for about six months. The longitudinal estimatescompare new SNAP participants to the same participants about six months later.
Tabulations are based on the following overall sample sizes: 3,275 new-entrant householdsand 3,375 six- month households in the cross- sectional sample; and 3,275 new- entranthouseholds observed at baseline and again at follow up six months later in the longitudinalsample. Individual panels within tables may have slightly fewer observations due to itemnonresponse to individual questions. Standard errors in parentheses.

8/22/2019 USDA Report re SNAP & Food Security 08/2013
http://slidepdf.com/reader/full/usda-report-re-snap-food-security-082013 125/355
Appendix B Mathematica Policy Research
B-7
Table B.5. Income Sources and Average Monthly Income Amounts of Six- Month and New- EntrantSNAP Households
Cross- Sectional Estimates Longitudinal Estimates
New- Entrant
Households(Baseline) Six- MonthHouseholds Difference
New- Entrant
Households(Baseline)
New- EntrantHouseholds
(Six- MonthFollow Up) Difference
Percentage of Householdswith Income Type
TANF 2.6 (0.4) 5.0 (0.4) 2.4 (0.6) 2.6 (0.4) 4.3 (0.3) 1.7 (0.5)
Social Security 21.1 (1.4) 23.7 (1.0) 2.6 (1.7) 21.1 (1.4) 20.5 (1.1) - 0.6 (1.8)
SSI or SupplementalSecurity Income
9.1 (0.7) 10.5 (0.9) 1.4 (1.1) 9.1 (0.7) 8.7 (0.7) - 0.4 (1.0)
Unemployment insuranceor worker'scompensation benefits
9.6 (0.7) 9.3 (0.6) - 0.3 (0.9) 9.6 (0.7) 9.0 (0.9) - 0.6 (1.1)
Child support payments 5.2 (0.5) 7.0 (0.5) 1.7 (0.7) 5.2 (0.5) 6.6 (0.6) 1.4 (0.8)
Financial support fromfriends or family 28.6 (0.7) 24.9 (1.0) - 3.6 (1.2) 28.6 (0.7) 23.5 (0.9) - 5.1 (1.1)
Other income 8.4 (0.6) 10.6 (0.7) 2.2 (0.9) 8.4 (0.6) 9.7 (0.8) 1.3 (1.0)
Median Monthly IncomeAmount amongHouseholds with PositiveIncome from the SpecifiedSource (in dollars)
TANF 254.0 347.0 93.0 254.0 300.0 46.0
Social Security 821.0 823.0 2.0 821.0 854.0 33.0
Supplemental SecurityIncome (SSI)
674.0 647.0 - 27.0 674.0 687.0 13.0
Unemployment insurance
or worker'scompensation benefits
600.0 708.0 108.0 600.0 616.0 16.0
Child support payments 281.0 274.0 - 7.0 281.0 257.0 - 24.0
Financial support fromfriends or family
130.0 120.0 - 10.0 130.0 135.0 5.0
Other income 316.0 300.0 - 16.0 316.0 272.0 - 44.0
Source: SNAP Food Security Survey 2012.
Note: The cross- sectional estimates compare new SNAP participants to a contemporaneous set of participants who have been receiving SNAP for about six months. The longitudinal estimatescompare new SNAP participants to the same participants about six months later.
Tabulations are based on the following overall sample sizes: 3,275 new-entrant householdsand 3,375 six- month households in the cross- sectional sample; and 3,275 new- entranthouseholds observed at baseline and again at follow up six months later in the longitudinalsample. Individual panels within tables may have slightly fewer observations due to itemnonresponse to individual questions. Standard errors for percentages in parentheses.

8/22/2019 USDA Report re SNAP & Food Security 08/2013
http://slidepdf.com/reader/full/usda-report-re-snap-food-security-082013 126/355
Appendix B Mathematica Policy Research
B-8
Table B.6. Household Income, Earnings, and Unearned Income of Six- Month and New- Entrant SNAPHouseholds, Among Households with Income
Cross- Sectional Estimates Longitudinal Estimates
New-EntrantHouseholds(Baseline)
Six- MonthHouseholds Difference
New-EntrantHouseholds(Baseline)
New-EntrantHouseholds(Six- MonthFollow Up) Difference
Monthly Household Incomeamong Households withPositive Income (in dollars)
10th Percentile 100.0 200.0 100.0 100.0 200.0 100.0
25th Percentile 430.0 596.0 166.0 430.0 537.0 107.0
50th Percentile 862.4 1,000.0 137.6 862.4 963.2 100.8
75th Percentile 1,479.4 1,655.5 176.1 1,479.4 1,549.6 70.2
90th Percentile 2,199.0 2,446.2 247.2 2,199.0 2,408.0 209.0
Mean 1,101.2(22.8)
1,267.5(31.1)
166.3(38.6)
1,101.2(22.8)
1,216.7(26.0)
115.5(34.6)
Standard Deviation 1,037.6 1,126.8 89.2 1,037.6 1,133.7 96.1
Monthly Household Earningsamong Households withPositive Earnings (in dollars)
10th Percentile 344.0 412.8 68.8 344.0 430.0 86.0
25th Percentile 688.0 752.5 64.5 688.0 774.0 86.0
50th Percentile 1,161.0 1,290.0 129.0 1,161.0 1,277.1 116.1
75th Percentile 1,720.0 1,892.0 172.0 1,720.0 1,811.4 91.4
90th Percentile 2,580.0 2,752.0 172.0 2,580.0 2,731.4 151.4
Mean 1,355.6(46.6)
1,501.6(40.7)
146.0(61.9)
1,355.6(46.6)
1,461.5(34.6)
105.9(58.0)
Standard Deviation 1,028.6 1,171.7 143.1 1,028.6 1,049.2 20.6
Monthly HouseholdUnearned Income among
Households with PositiveUnearned Income (in dollars)
10th Percentile 72.0 84.0 12.0 72.0 100.0 28.0
25th Percentile 200.0 236.0 36.0 200.0 226.0 26.0
50th Percentile 600.0 674.0 74.0 600.0 643.0 43.0
75th Percentile 1,000.0 1,036.0 36.0 1,000.0 1,000.0 0.0
90th Percentile 1,500.0 1,564.0 64.0 1,500.0 1,477.0 - 23.0
Mean 723.0(19.1)
766.9(25.5)
43.9(31.9)
723.0(19.1)
748.0(20.0)
25.0(27.7)
Standard Deviation 752.5 699.6 - 52.9 752.5 836.4 83.9
Source: SNAP Food Security Survey 2012.
Note: The cross- sectional estimates compare new SNAP participants to a contemporaneous set of
participants who have been receiving SNAP for about six months. The longitudinal estimatescompare new SNAP participants to the same participants about six months later.
Tabulations are based on the following overall sample sizes: 3,275 new- entrant households and3,375 six- month households in the cross- sectional sample; and 3,275 new-entrant householdsobserved at baseline and again at follow up six months later in the longitudinal sample. Individualpanels within tables may have slightly fewer observations due to item nonresponse to individualquestions. Standard errors for means in parentheses.
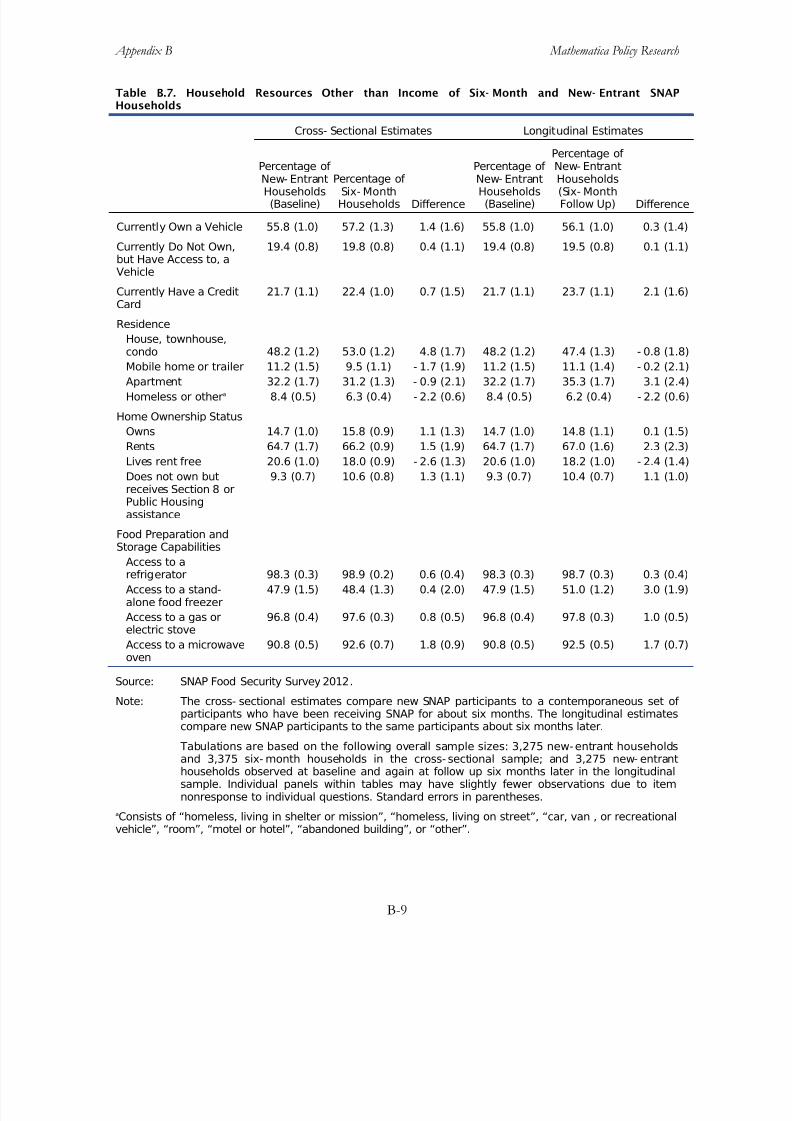
8/22/2019 USDA Report re SNAP & Food Security 08/2013
http://slidepdf.com/reader/full/usda-report-re-snap-food-security-082013 127/355
Appendix B Mathematica Policy Research
B-9
Table B.7. Household Resources Other than Income of Six- Month and New- Entrant SNAPHouseholds
Cross- Sectional Estimates Longitudinal Estimates
Percentage of
New- EntrantHouseholds(Baseline)
Percentage of Six- MonthHouseholds Difference
Percentage of
New- EntrantHouseholds(Baseline)
Percentage of New- Entrant
Households(Six- MonthFollow Up) Difference
Currently Own a Vehicle 55.8 (1.0) 57.2 (1.3) 1.4 (1.6) 55.8 (1.0) 56.1 (1.0) 0.3 (1.4)
Currently Do Not Own,but Have Access to, aVehicle
19.4 (0.8) 19.8 (0.8) 0.4 (1.1) 19.4 (0.8) 19.5 (0.8) 0.1 (1.1)
Currently Have a CreditCard
21.7 (1.1) 22.4 (1.0) 0.7 (1.5) 21.7 (1.1) 23.7 (1.1) 2.1 (1.6)
Residence
House, townhouse,condo 48.2 (1.2) 53.0 (1.2) 4.8 (1.7) 48.2 (1.2) 47.4 (1.3) - 0.8 (1.8)
Mobile home or trailer 11.2 (1.5) 9.5 (1.1) - 1.7 (1.9) 11.2 (1.5) 11.1 (1.4) - 0.2 (2.1)Apartment 32.2 (1.7) 31.2 (1.3) - 0.9 (2.1) 32.2 (1.7) 35.3 (1.7) 3.1 (2.4)
Homeless or othera 8.4 (0.5) 6.3 (0.4) - 2.2 (0.6) 8.4 (0.5) 6.2 (0.4) - 2.2 (0.6)
Home Ownership Status
Owns 14.7 (1.0) 15.8 (0.9) 1.1 (1.3) 14.7 (1.0) 14.8 (1.1) 0.1 (1.5)
Rents 64.7 (1.7) 66.2 (0.9) 1.5 (1.9) 64.7 (1.7) 67.0 (1.6) 2.3 (2.3)
Lives rent free 20.6 (1.0) 18.0 (0.9) - 2.6 (1.3) 20.6 (1.0) 18.2 (1.0) - 2.4 (1.4)
Does not own butreceives Section 8 orPublic Housingassistance
9.3 (0.7) 10.6 (0.8) 1.3 (1.1) 9.3 (0.7) 10.4 (0.7) 1.1 (1.0)
Food Preparation and
Storage CapabilitiesAccess to arefrigerator 98.3 (0.3) 98.9 (0.2) 0.6 (0.4) 98.3 (0.3) 98.7 (0.3) 0.3 (0.4)
Access to a stand-alone food freezer
47.9 (1.5) 48.4 (1.3) 0.4 (2.0) 47.9 (1.5) 51.0 (1.2) 3.0 (1.9)
Access to a gas orelectric stove
96.8 (0.4) 97.6 (0.3) 0.8 (0.5) 96.8 (0.4) 97.8 (0.3) 1.0 (0.5)
Access to a microwaveoven
90.8 (0.5) 92.6 (0.7) 1.8 (0.9) 90.8 (0.5) 92.5 (0.5) 1.7 (0.7)
Source: SNAP Food Security Survey 2012.
Note: The cross- sectional estimates compare new SNAP participants to a contemporaneous set of participants who have been receiving SNAP for about six months. The longitudinal estimatescompare new SNAP participants to the same participants about six months later.
Tabulations are based on the following overall sample sizes: 3,275 new-entrant householdsand 3,375 six- month households in the cross- sectional sample; and 3,275 new- entranthouseholds observed at baseline and again at follow up six months later in the longitudinalsample. Individual panels within tables may have slightly fewer observations due to itemnonresponse to individual questions. Standard errors in parentheses.
aConsists of “homeless, living in shelter or mission”, “homeless, living on street”, “car, van , or recreationalvehicle”, “room”, “motel or hotel”, “abandoned building”, or “other”.
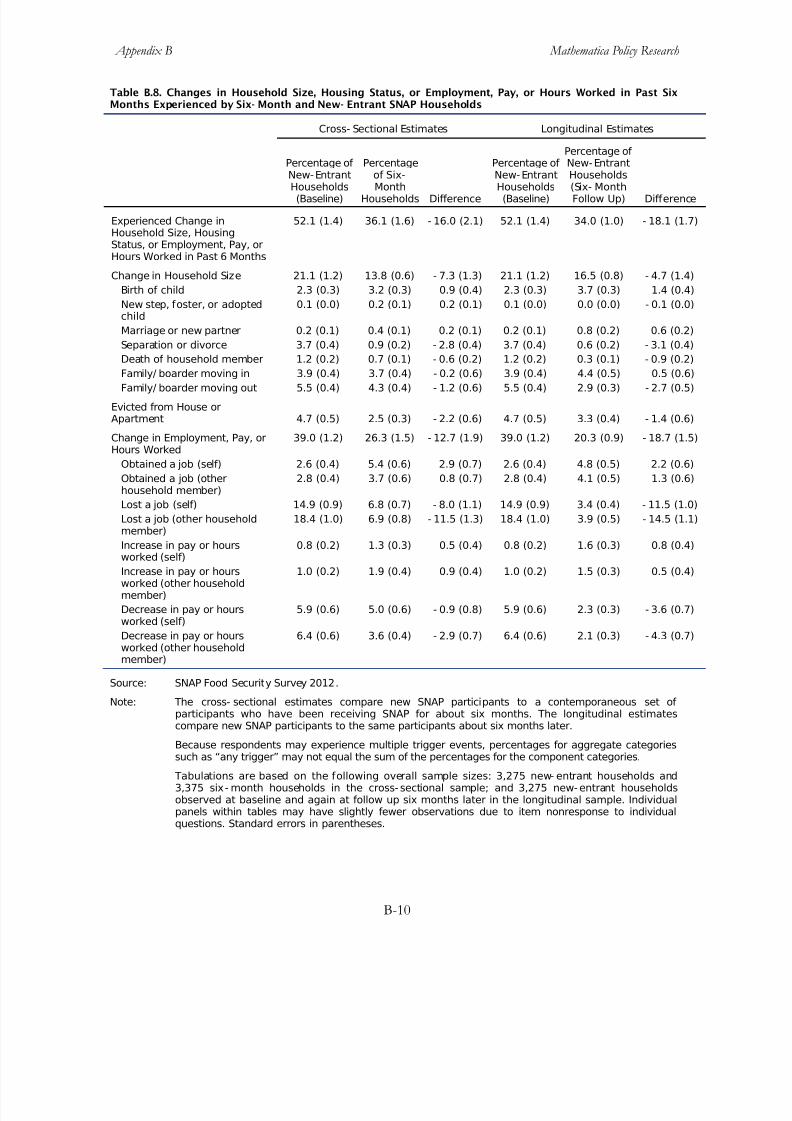
8/22/2019 USDA Report re SNAP & Food Security 08/2013
http://slidepdf.com/reader/full/usda-report-re-snap-food-security-082013 128/355
Appendix B Mathematica Policy Research
B-10
Table B.8. Changes in Household Size, Housing Status, or Employment, Pay, or Hours Worked in Past SixMonths Experienced by Six- Month and New- Entrant SNAP Households
Cross- Sectional Estimates Longitudinal Estimates
Percentage of New-Entrant
Households(Baseline)
Percentageof Six-
MonthHouseholds Difference
Percentage of New-Entrant
Households(Baseline)
Percentage of New-EntrantHouseholds
(Six- MonthFollow Up) Difference
Experienced Change inHousehold Size, HousingStatus, or Employment, Pay, orHours Worked in Past 6 Months
52.1 (1.4) 36.1 (1.6) - 16.0 (2.1) 52.1 (1.4) 34.0 (1.0) - 18.1 (1.7)
Change in Household Size 21.1 (1.2) 13.8 (0.6) - 7.3 (1.3) 21.1 (1.2) 16.5 (0.8) - 4.7 (1.4)
Birth of child 2.3 (0.3) 3.2 (0.3) 0.9 (0.4) 2.3 (0.3) 3.7 (0.3) 1.4 (0.4)
New step, foster, or adoptedchild
0.1 (0.0) 0.2 (0.1) 0.2 (0.1) 0.1 (0.0) 0.0 (0.0) - 0.1 (0.0)
Marriage or new partner 0.2 (0.1) 0.4 (0.1) 0.2 (0.1) 0.2 (0.1) 0.8 (0.2) 0.6 (0.2)
Separation or divorce 3.7 (0.4) 0.9 (0.2) - 2.8 (0.4) 3.7 (0.4) 0.6 (0.2) - 3.1 (0.4)
Death of household member 1.2 (0.2) 0.7 (0.1) - 0.6 (0.2) 1.2 (0.2) 0.3 (0.1) - 0.9 (0.2)
Family/ boarder moving in 3.9 (0.4) 3.7 (0.4) - 0.2 (0.6) 3.9 (0.4) 4.4 (0.5) 0.5 (0.6)
Family/ boarder moving out 5.5 (0.4) 4.3 (0.4) - 1.2 (0.6) 5.5 (0.4) 2.9 (0.3) - 2.7 (0.5)
Evicted from House orApartment 4.7 (0.5) 2.5 (0.3) - 2.2 (0.6) 4.7 (0.5) 3.3 (0.4) - 1.4 (0.6)
Change in Employment, Pay, orHours Worked
39.0 (1.2) 26.3 (1.5) - 12.7 (1.9) 39.0 (1.2) 20.3 (0.9) - 18.7 (1.5)
Obtained a job (self) 2.6 (0.4) 5.4 (0.6) 2.9 (0.7) 2.6 (0.4) 4.8 (0.5) 2.2 (0.6)
Obtained a job (otherhousehold member)
2.8 (0.4) 3.7 (0.6) 0.8 (0.7) 2.8 (0.4) 4.1 (0.5) 1.3 (0.6)
Lost a job (self) 14.9 (0.9) 6.8 (0.7) - 8.0 (1.1) 14.9 (0.9) 3.4 (0.4) - 11.5 (1.0)
Lost a job (other householdmember)
18.4 (1.0) 6.9 (0.8) - 11.5 (1.3) 18.4 (1.0) 3.9 (0.5) - 14.5 (1.1)
Increase in pay or hoursworked (self)
0.8 (0.2) 1.3 (0.3) 0.5 (0.4) 0.8 (0.2) 1.6 (0.3) 0.8 (0.4)
Increase in pay or hoursworked (other householdmember)
1.0 (0.2) 1.9 (0.4) 0.9 (0.4) 1.0 (0.2) 1.5 (0.3) 0.5 (0.4)
Decrease in pay or hoursworked (self)
5.9 (0.6) 5.0 (0.6) - 0.9 (0.8) 5.9 (0.6) 2.3 (0.3) - 3.6 (0.7)
Decrease in pay or hoursworked (other householdmember)
6.4 (0.6) 3.6 (0.4) - 2.9 (0.7) 6.4 (0.6) 2.1 (0.3) - 4.3 (0.7)
Source: SNAP Food Security Survey 2012.
Note: The cross- sectional estimates compare new SNAP participants to a contemporaneous set of participants who have been receiving SNAP for about six months. The longitudinal estimatescompare new SNAP participants to the same participants about six months later.
Because respondents may experience multiple trigger events, percentages for aggregate categoriessuch as “any trigger” may not equal the sum of the percentages for the component categories.
Tabulations are based on the following overall sample sizes: 3,275 new- entrant households and3,375 six- month households in the cross- sectional sample; and 3,275 new- entrant householdsobserved at baseline and again at follow up six months later in the longitudinal sample. Individualpanels within tables may have slightly fewer observations due to item nonresponse to individualquestions. Standard errors in parentheses.
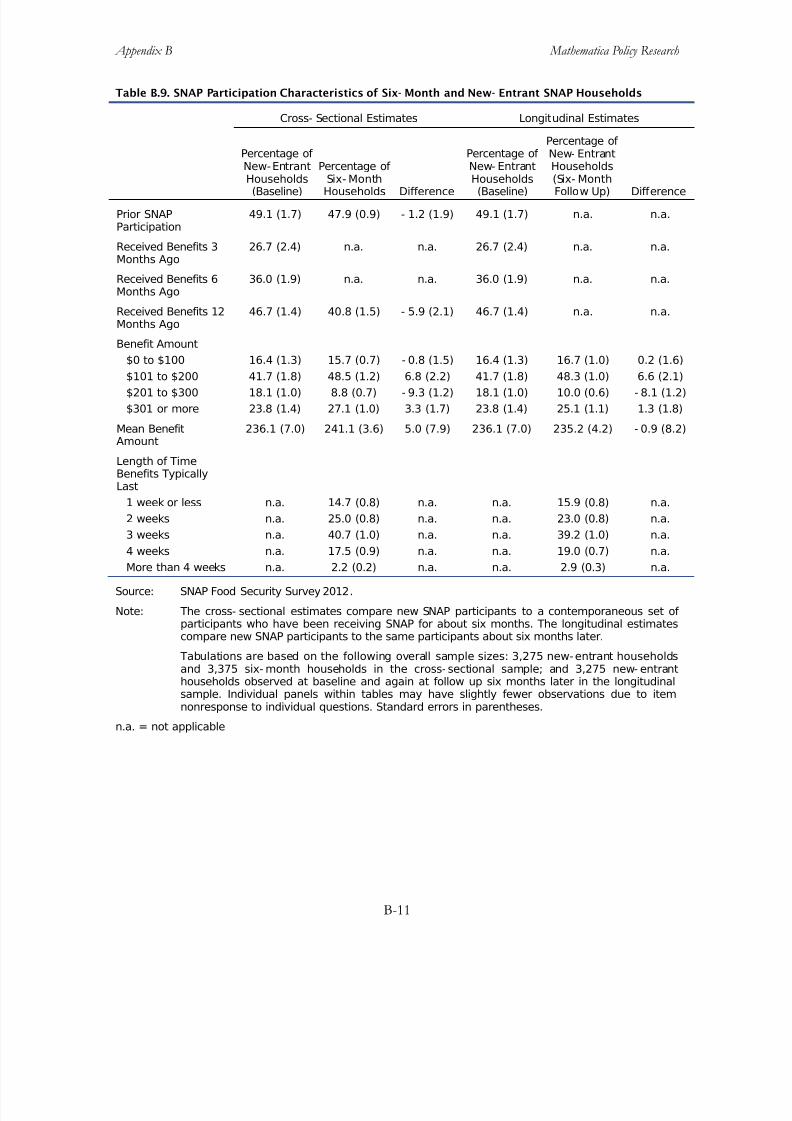
8/22/2019 USDA Report re SNAP & Food Security 08/2013
http://slidepdf.com/reader/full/usda-report-re-snap-food-security-082013 129/355
Appendix B Mathematica Policy Research
B-11
Table B.9. SNAP Participation Characteristics of Six- Month and New- Entrant SNAP Households
Cross- Sectional Estimates Longitudinal Estimates
Percentage of New-Entrant
Households(Baseline)
Percentage of
Six- MonthHouseholds Difference
Percentage of New- Entrant
Households(Baseline)
Percentage of New- EntrantHouseholds
(Six- MonthFollow Up) Difference
Prior SNAPParticipation
49.1 (1.7) 47.9 (0.9) - 1.2 (1.9) 49.1 (1.7) n.a. n.a.
Received Benefits 3Months Ago
26.7 (2.4) n.a. n.a. 26.7 (2.4) n.a. n.a.
Received Benefits 6Months Ago
36.0 (1.9) n.a. n.a. 36.0 (1.9) n.a. n.a.
Received Benefits 12Months Ago
46.7 (1.4) 40.8 (1.5) - 5.9 (2.1) 46.7 (1.4) n.a. n.a.
Benefit Amount
$0 to $100 16.4 (1.3) 15.7 (0.7) - 0.8 (1.5) 16.4 (1.3) 16.7 (1.0) 0.2 (1.6)
$101 to $200 41.7 (1.8) 48.5 (1.2) 6.8 (2.2) 41.7 (1.8) 48.3 (1.0) 6.6 (2.1)
$201 to $300 18.1 (1.0) 8.8 (0.7) - 9.3 (1.2) 18.1 (1.0) 10.0 (0.6) - 8.1 (1.2)
$301 or more 23.8 (1.4) 27.1 (1.0) 3.3 (1.7) 23.8 (1.4) 25.1 (1.1) 1.3 (1.8)
Mean BenefitAmount
236.1 (7.0) 241.1 (3.6) 5.0 (7.9) 236.1 (7.0) 235.2 (4.2) - 0.9 (8.2)
Length of TimeBenefits TypicallyLast
1 week or less n.a. 14.7 (0.8) n.a. n.a. 15.9 (0.8) n.a.
2 weeks n.a. 25.0 (0.8) n.a. n.a. 23.0 (0.8) n.a.
3 weeks n.a. 40.7 (1.0) n.a. n.a. 39.2 (1.0) n.a.
4 weeks n.a. 17.5 (0.9) n.a. n.a. 19.0 (0.7) n.a.More than 4 weeks n.a. 2.2 (0.2) n.a. n.a. 2.9 (0.3) n.a.
Source: SNAP Food Security Survey 2012.
Note: The cross- sectional estimates compare new SNAP participants to a contemporaneous set of participants who have been receiving SNAP for about six months. The longitudinal estimatescompare new SNAP participants to the same participants about six months later.
Tabulations are based on the following overall sample sizes: 3,275 new-entrant householdsand 3,375 six- month households in the cross- sectional sample; and 3,275 new- entranthouseholds observed at baseline and again at follow up six months later in the longitudinalsample. Individual panels within tables may have slightly fewer observations due to itemnonresponse to individual questions. Standard errors in parentheses.
n.a. = not applicable
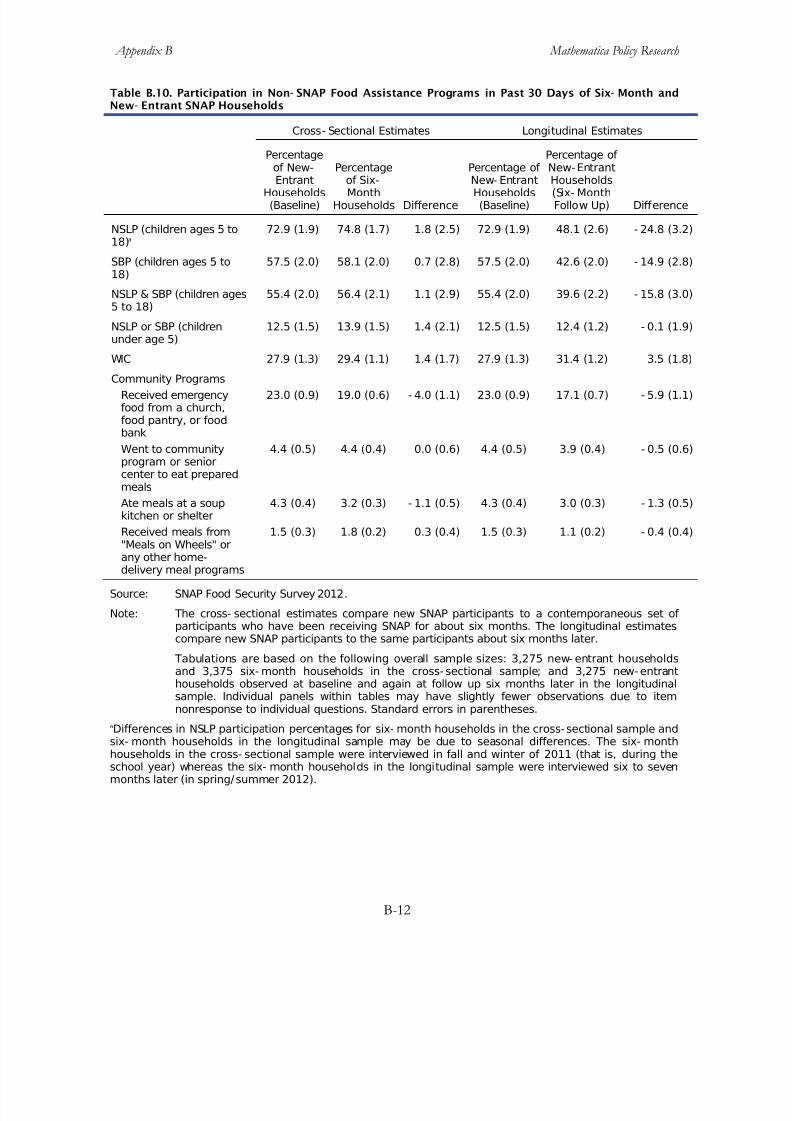
8/22/2019 USDA Report re SNAP & Food Security 08/2013
http://slidepdf.com/reader/full/usda-report-re-snap-food-security-082013 130/355
Appendix B Mathematica Policy Research
B-12
Table B.10. Participation in Non- SNAP Food Assistance Programs in Past 30 Days of Six- Month andNew- Entrant SNAP Households
Cross- Sectional Estimates Longitudinal Estimates
Percentageof New-
EntrantHouseholds(Baseline)
Percentage
of Six-MonthHouseholds Difference
Percentage of
New- EntrantHouseholds(Baseline)
Percentage of New-Entrant
Households(Six- MonthFollow Up) Difference
NSLP (children ages 5 to18)a
72.9 (1.9) 74.8 (1.7) 1.8 (2.5) 72.9 (1.9) 48.1 (2.6) - 24.8 (3.2)
SBP (children ages 5 to18)
57.5 (2.0) 58.1 (2.0) 0.7 (2.8) 57.5 (2.0) 42.6 (2.0) - 14.9 (2.8)
NSLP & SBP (children ages5 to 18)
55.4 (2.0) 56.4 (2.1) 1.1 (2.9) 55.4 (2.0) 39.6 (2.2) - 15.8 (3.0)
NSLP or SBP (childrenunder age 5)
12.5 (1.5) 13.9 (1.5) 1.4 (2.1) 12.5 (1.5) 12.4 (1.2) - 0.1 (1.9)
WIC 27.9 (1.3) 29.4 (1.1) 1.4 (1.7) 27.9 (1.3) 31.4 (1.2) 3.5 (1.8)
Community Programs
Received emergencyfood from a church,food pantry, or foodbank
23.0 (0.9) 19.0 (0.6) - 4.0 (1.1) 23.0 (0.9) 17.1 (0.7) - 5.9 (1.1)
Went to communityprogram or seniorcenter to eat preparedmeals
4.4 (0.5) 4.4 (0.4) 0.0 (0.6) 4.4 (0.5) 3.9 (0.4) - 0.5 (0.6)
Ate meals at a soupkitchen or shelter
4.3 (0.4) 3.2 (0.3) - 1.1 (0.5) 4.3 (0.4) 3.0 (0.3) - 1.3 (0.5)
Received meals from"Meals on Wheels" orany other home-delivery meal programs
1.5 (0.3) 1.8 (0.2) 0.3 (0.4) 1.5 (0.3) 1.1 (0.2) - 0.4 (0.4)
Source: SNAP Food Security Survey 2012.
Note: The cross- sectional estimates compare new SNAP participants to a contemporaneous set of participants who have been receiving SNAP for about six months. The longitudinal estimatescompare new SNAP participants to the same participants about six months later.
Tabulations are based on the following overall sample sizes: 3,275 new- entrant householdsand 3,375 six- month households in the cross- sectional sample; and 3,275 new- entranthouseholds observed at baseline and again at follow up six months later in the longitudinalsample. Individual panels within tables may have slightly fewer observations due to itemnonresponse to individual questions. Standard errors in parentheses.
aDifferences in NSLP participation percentages for six- month households in the cross- sectional sample andsix- month households in the longitudinal sample may be due to seasonal differences. The six- monthhouseholds in the cross- sectional sample were interviewed in fall and winter of 2011 (that is, during theschool year) whereas the six- month households in the longitudinal sample were interviewed six to sevenmonths later (in spring/summer 2012).

8/22/2019 USDA Report re SNAP & Food Security 08/2013
http://slidepdf.com/reader/full/usda-report-re-snap-food-security-082013 131/355
Appendix B Mathematica Policy Research
B-13
Table B.11. Food Purchase Behavior of Six- Month and New- Entrant SNAP Households
Cross- Sectional Estimates Longitudinal Estimates
Percentage of New- EntrantHouseholds
(Baseline)
Percentageof Six- Month
Households Difference
Percentage of New- EntrantHouseholds
(Baseline)
Percentage of New- EntrantHouseholds(Six- Month
Follow Up) Difference
Purchase Most of Groceries at
Supermarkets / grocery stores 77.3 (1.1) 75.8 (1.2) - 1.5 (1.6) 77.3 (1.1) 79.6 (1.0) 2.3 (1.5)
Discount stores 14.2 (1.0) 14.7 (1.1) 0.5 (1.5) 14.2 (1.0) 11.2 (0.8) - 3.0 (1.3)
Warehouse clubs 1.7 (0.3) 2.2 (0.3) 0.5 (0.4) 1.7 (0.3) 2.0 (0.3) 0.3 (0.4)
Convenience stores 0.4 (0.1) 0.3 (0.1) 0.0 (0.1) 0.4 (0.1) 0.3 (0.1) - 0.1 (0.1)
Ethnic food stores 1.0 (0.2) 1.2 (0.4) 0.1 (0.4) 1.0 (0.2) 1.2 (0.2) 0.1 (0.3)
Farmer’s markets 0.3 (0.1) 0.3 (0.1) - 0.1 (0.1) 0.3 (0.1) 0.2 (0.1) - 0.1 (0.1)
Dollar stores 0.3 (0.1) 0.3 (0.1) 0.0 (0.1) 0.3 (0.1) 0.3 (0.1) 0.0 (0.1)
Other stores 4.8 (0.3) 5.3 (0.7) 0.5 (0.8) 4.8 (0.3) 5.2 (0.5) 0.4 (0.6)
Reason for Store
Low prices or sales 50.6 (1.4) 52.7 (1.5) 2.1 (2.1) 50.6 (1.4) 55.2 (1.2) 4.5 (1.8)
Quality or variety of food 11.0 (0.8) 9.8 (0.7) - 1.2 (1.1) 11.0 (0.8) 8.4 (0.5) - 2.6 (0.9)
Close to home / Convenient /
Easy to get to 26.6 (0.8) 26.7 (1.0) 0.2 (1.3) 26.6 (0.8) 24.9 (1.0) - 1.7 (1.3)Other 11.3 (0.6) 10.6 (0.6) - 0.8 (0.8) 11.3 (0.6) 11.3 (0.7) - 0.1 (0.9)
Mode of Transportation
Drive own car 45.7 (1.0) 47.3 (1.3) 1.7 (1.6) 45.7 (1.0) 47.0 (1.4) 1.3 (1.7)
Drive someone else’s car 9.5 (0.7) 9.1 (0.6) - 0.4 (0.9) 9.5 (0.7) 9.0 (0.6) - 0.5 (0.9)
Someone else drives 35.0 (0.9) 36.8 (1.3) 1.8 (1.6) 35.0 (0.9) 36.3 (1.3) 1.3 (1.6)
Walk 16.0 (0.9) 14.3 (0.7) - 1.7 (1.1) 16.0 (0.9) 15.8 (0.9) - 0.2 (1.3)
Bus 10.1 (1.0) 10.2 (1.0) 0.1 (1.4) 10.1 (1.0) 9.8 (0.6) - 0.4 (1.2)
Taxi 1.8 (0.3) 2.1 (0.3) 0.3 (0.4) 1.8 (0.3) 2.1 (0.3) 0.3 (0.4)
Ride bicycle 1.8 (0.5) 1.3 (0.3) - 0.5 (0.6) 1.8 (0.5) 2.0 (0.5) 0.2 (0.7)
Other 1.6 (0.3) 2.0 (0.4) 0.4 (0.5) 1.6 (0.3) 1.5 (0.2) - 0.1 (0.4)
Usually go directly from home 93.4 (0.7) 93.9 (0.5) 0.5 (0.9) 93.4 (0.7) 94.7 (0.6) 1.3 (0.9)
How Many Minutes One Way fromHome (among those that usuallygo directly from home)
0 to 5 25.8 (1.0) 24.6 (0.9) - 1.3 (1.3) 25.8 (1.0) 26.0 (0.9) 0.1 (1.3)
6 to 10 30.2 (1.0) 29.8 (1.2) - 0.4 (1.6) 30.2 (1.0) 29.9 (1.0) - 0.3 (1.4)
11 to 20 29.5 (1.1) 31.0 (0.9) 1.5 (1.4) 29.5 (1.1) 29.9 (1.1) 0.3 (1.6)
21 to 30 9.3 (0.5) 9.5 (0.6) 0.3 (0.8) 9.3 (0.6) 8.9 (0.5) - 0.4 (0.8)
31 to 60 4.7 (0.6) 4.5 (0.4) - 0.3 (0.7) 4.7 (0.6) 4.8 (0.5) 0.1 (0.8)
More than 60 0.5 (0.2) 0.6 (0.1) 0.2 (0.2) 0.5 (0.2) 0.6 (0.1) 0.2 (0.2)
Median minutes 10.0 10.0 0.0 10.0 10.0 0.0
How Many Miles One Way fromHome (among those that usuallygo directly from home)
Less than one mile 12.1 (0.8) 11.9 (0.6) - 0.2 (1.0) 12.1 (0.8) 11.0 (0.9) - 1.1(1.2)
0- 5 miles 55.7 (1.5) 53.9 (1.6) - 1.8 (2.2) 55.7 (1.5) 56.5 (1.8) 0.9 (2.3)
5- 10 miles 16.3 (0.8) 17.5 (1.0) 1.2 (1.3) 16.3 (0.8) 18.1 (1.3) 1.8 (1.5)
10- 20 miles 11.3 (1.1) 11.8 (1.9) 0.5 (2.2) 11.3 (1.1) 10.1 (1.0) - 1.3 (1.5)Over 20 miles 4.7 (0.5) 5.0 (0.5) 0.3 (0.7) 4.7 (0.5) 4.3 (0.5) - 0.3 (0.7)
Source: SNAP Food Security Survey 2012.
Note: The cross- sectional estimates compare new SNAP participants to a contemporaneous set of participants whohave been receiving SNAP for about six months. The longitudinal estimates compare new SNAP participantsto the same participants about six months later.
Tabulations are based on the following overall sample sizes: 3,275 new- entrant households and 3,375 six-month households in the cross- sectional sample; and 3,275 new- entrant households observed at baselineand again at follow up six months later in the longitudinal sample. Individual panels within tables may haveslightly fewer observations due to item nonresponse to individual questions. Standard errors for percentageestimates in parentheses.
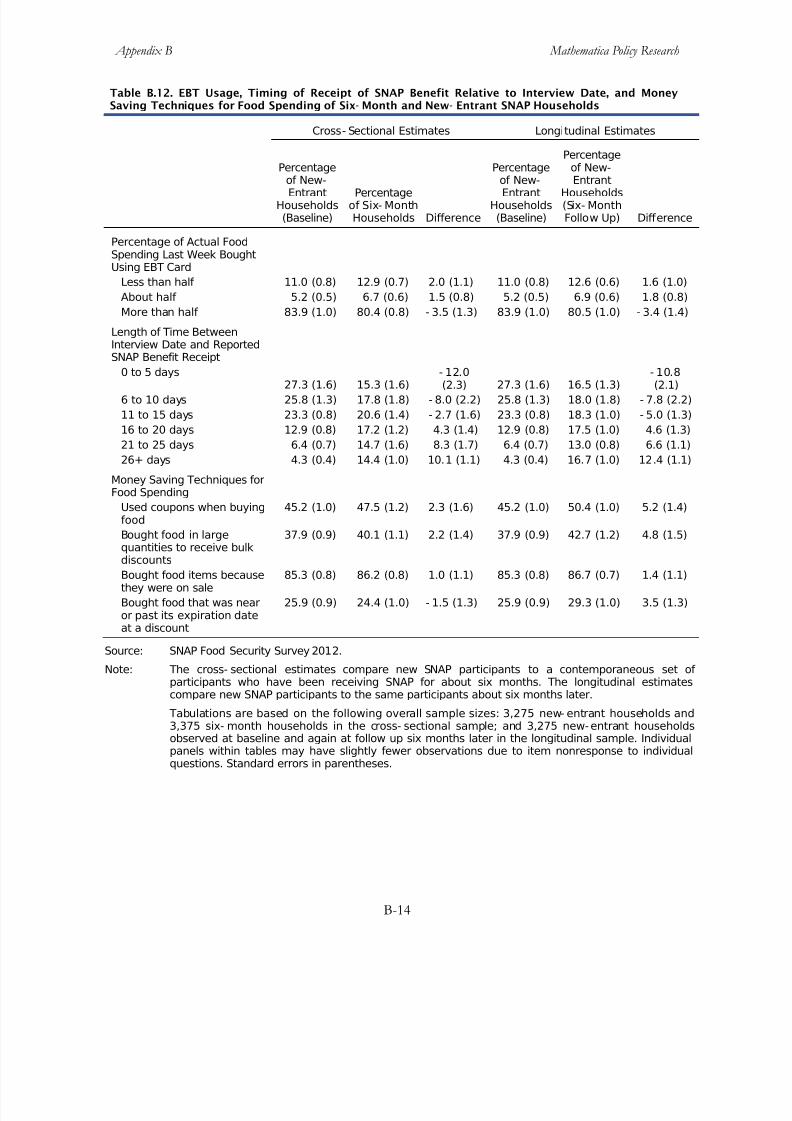
8/22/2019 USDA Report re SNAP & Food Security 08/2013
http://slidepdf.com/reader/full/usda-report-re-snap-food-security-082013 132/355
Appendix B Mathematica Policy Research
B-14
Table B.12. EBT Usage, Timing of Receipt of SNAP Benefit Relative to Interview Date, and MoneySaving Techniques for Food Spending of Six- Month and New- Entrant SNAP Households
Cross- Sectional Estimates Longitudinal Estimates
Percentage
of New-EntrantHouseholds(Baseline)
Percentageof Six- MonthHouseholds Difference
Percentage
of New-EntrantHouseholds(Baseline)
Percentageof New-
EntrantHouseholds(Six- MonthFollow Up) Difference
Percentage of Actual FoodSpending Last Week BoughtUsing EBT Card
Less than half 11.0 (0.8) 12.9 (0.7) 2.0 (1.1) 11.0 (0.8) 12.6 (0.6) 1.6 (1.0)
About half 5.2 (0.5) 6.7 (0.6) 1.5 (0.8) 5.2 (0.5) 6.9 (0.6) 1.8 (0.8)
More than half 83.9 (1.0) 80.4 (0.8) - 3.5 (1.3) 83.9 (1.0) 80.5 (1.0) - 3.4 (1.4)
Length of Time BetweenInterview Date and ReportedSNAP Benefit Receipt
0 to 5 days27.3 (1.6) 15.3 (1.6)
- 12.0(2.3) 27.3 (1.6) 16.5 (1.3)
- 10.8(2.1)
6 to 10 days 25.8 (1.3) 17.8 (1.8) - 8.0 (2.2) 25.8 (1.3) 18.0 (1.8) - 7.8 (2.2)
11 to 15 days 23.3 (0.8) 20.6 (1.4) - 2.7 (1.6) 23.3 (0.8) 18.3 (1.0) - 5.0 (1.3)
16 to 20 days 12.9 (0.8) 17.2 (1.2) 4.3 (1.4) 12.9 (0.8) 17.5 (1.0) 4.6 (1.3)
21 to 25 days 6.4 (0.7) 14.7 (1.6) 8.3 (1.7) 6.4 (0.7) 13.0 (0.8) 6.6 (1.1)
26+ days 4.3 (0.4) 14.4 (1.0) 10.1 (1.1) 4.3 (0.4) 16.7 (1.0) 12.4 (1.1)
Money Saving Techniques forFood Spending
Used coupons when buyingfood
45.2 (1.0) 47.5 (1.2) 2.3 (1.6) 45.2 (1.0) 50.4 (1.0) 5.2 (1.4)
Bought food in large
quantities to receive bulkdiscounts
37.9 (0.9) 40.1 (1.1) 2.2 (1.4) 37.9 (0.9) 42.7 (1.2) 4.8 (1.5)
Bought food items becausethey were on sale
85.3 (0.8) 86.2 (0.8) 1.0 (1.1) 85.3 (0.8) 86.7 (0.7) 1.4 (1.1)
Bought food that was nearor past its expiration dateat a discount
25.9 (0.9) 24.4 (1.0) - 1.5 (1.3) 25.9 (0.9) 29.3 (1.0) 3.5 (1.3)
Source: SNAP Food Security Survey 2012.
Note: The cross- sectional estimates compare new SNAP participants to a contemporaneous set of participants who have been receiving SNAP for about six months. The longitudinal estimatescompare new SNAP participants to the same participants about six months later.
Tabulations are based on the following overall sample sizes: 3,275 new- entrant households and3,375 six- month households in the cross- sectional sample; and 3,275 new-entrant households
observed at baseline and again at follow up six months later in the longitudinal sample. Individualpanels within tables may have slightly fewer observations due to item nonresponse to individualquestions. Standard errors in parentheses.
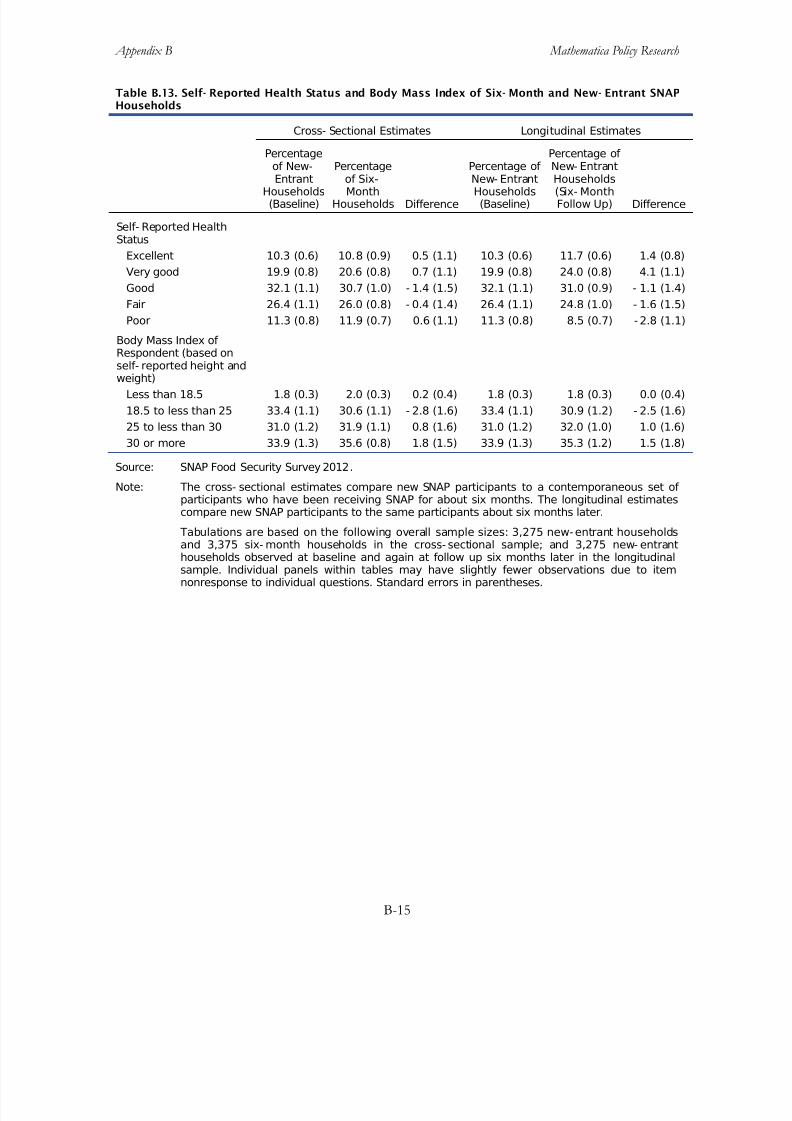
8/22/2019 USDA Report re SNAP & Food Security 08/2013
http://slidepdf.com/reader/full/usda-report-re-snap-food-security-082013 133/355
Appendix B Mathematica Policy Research
B-15
Table B.13. Self- Reported Health Status and Body Mass Index of Six- Month and New- Entrant SNAPHouseholds
Cross- Sectional Estimates Longitudinal Estimates
Percentageof New-
EntrantHouseholds(Baseline)
Percentage
of Six-MonthHouseholds Difference
Percentage of
New- EntrantHouseholds(Baseline)
Percentage of New- Entrant
Households(Six- MonthFollow Up) Difference
Self- Reported HealthStatus
Excellent 10.3 (0.6) 10.8 (0.9) 0.5 (1.1) 10.3 (0.6) 11.7 (0.6) 1.4 (0.8)
Very good 19.9 (0.8) 20.6 (0.8) 0.7 (1.1) 19.9 (0.8) 24.0 (0.8) 4.1 (1.1)
Good 32.1 (1.1) 30.7 (1.0) - 1.4 (1.5) 32.1 (1.1) 31.0 (0.9) - 1.1 (1.4)
Fair 26.4 (1.1) 26.0 (0.8) - 0.4 (1.4) 26.4 (1.1) 24.8 (1.0) - 1.6 (1.5)
Poor 11.3 (0.8) 11.9 (0.7) 0.6 (1.1) 11.3 (0.8) 8.5 (0.7) - 2.8 (1.1)
Body Mass Index of Respondent (based on
self- reported height andweight)
Less than 18.5 1.8 (0.3) 2.0 (0.3) 0.2 (0.4) 1.8 (0.3) 1.8 (0.3) 0.0 (0.4)
18.5 to less than 25 33.4 (1.1) 30.6 (1.1) - 2.8 (1.6) 33.4 (1.1) 30.9 (1.2) - 2.5 (1.6)
25 to less than 30 31.0 (1.2) 31.9 (1.1) 0.8 (1.6) 31.0 (1.2) 32.0 (1.0) 1.0 (1.6)
30 or more 33.9 (1.3) 35.6 (0.8) 1.8 (1.5) 33.9 (1.3) 35.3 (1.2) 1.5 (1.8)
Source: SNAP Food Security Survey 2012.
Note: The cross- sectional estimates compare new SNAP participants to a contemporaneous set of participants who have been receiving SNAP for about six months. The longitudinal estimatescompare new SNAP participants to the same participants about six months later.
Tabulations are based on the following overall sample sizes: 3,275 new-entrant householdsand 3,375 six- month households in the cross- sectional sample; and 3,275 new- entranthouseholds observed at baseline and again at follow up six months later in the longitudinalsample. Individual panels within tables may have slightly fewer observations due to itemnonresponse to individual questions. Standard errors in parentheses.

8/22/2019 USDA Report re SNAP & Food Security 08/2013
http://slidepdf.com/reader/full/usda-report-re-snap-food-security-082013 134/355
Appendix B Mathematica Policy Research
B-16
Table B.14. Self- Reported Mental Health and Well- Being of Six- Month and New- Entrant SNAP Households
Cross- Sectional Estimates Longitudinal Estimates
Percentage of New- EntrantHouseholds
(Baseline)
Percentageof Six-Month
Households Difference
Percentage of New- EntrantHouseholds
(Baseline)
Percentage of New- EntrantHouseholds(Six- Month
Follow Up) Difference
Percentage of Respondents thatin the Last 30 Days Felta
So sad nothing could cheerthem up
48.0 (0.8) 41.9 (1.3) - 6.1 (1.5) 48.0 (0.8) 38.5 (1.0) - 9.5 (1.3)
Nervous 50.4 (1.0) 45.6 (1.0) - 4.8 (1.4) 50.4 (1.0) 41.3 (1.3) - 9.1 (1.6)
Restless or Fidgety 49.5 (1.0) 46.8 (1.1) - 2.7 (1.5) 49.5 (1.0) 40.5 (1.7) - 9.0 (2.0)
Hopeless 35.4 (0.8) 29.6 (1.1) - 5.8 (1.4) 35.4 (0.8) 25.8 (0.9) - 9.6 (1.2)
That everything was an effort 62.7 (0.8) 60.2 (1.0) - 2.5 (1.3) 62.7 (0.8) 54.0 (1.3) - 8.7 (1.5)
Worthless 28.5 (0.9) 24.8 (0.8) - 3.7 (1.2) 28.5 (0.9) 21.6 (0.9) - 6.9 (1.3)
Percentage of Households that,if Needed Help, Would Get thisAmount of Help from FamilyLiving Nearby
All of the help needed 18.7 (0.7) 21.6 (0.9) 2.9 (1.1) 18.7 (0.7) 19.8 (0.8) 1.1 (1.1)
Most of the help needed 30.7 (0.9) 31.0 (1.4) 0.2 (1.7) 30.7 (0.9) 31.8 (1.1) 1.1 (1.4)
Very little of the help needed 30.6 (0.7) 28.9 (1.0) - 1.8 (1.2) 30.6 (0.7) 28.7 (0.9) - 2.0 (1.1)
No help 20.0 (1.0) 18.6 (0.7) - 1.3 (1.2) 20.0 (1.0) 19.7 (0.8) - 0.2 (1.3)
Percentage of Households that,if Needed Help, Would Get thisAmount of Help from Friends
All of the help needed 8.3 (0.6) 9.9 (0.8) 1.7 (1.0) 8.3 (0.6) 9.4 (0.5) 1.1 (0.8)
Most of the help needed 28.0 (0.8) 30.6 (0.9) 2.6 (1.2) 28.0 (0.8) 30.3 (0.9) 2.3 (1.2)
Very little of the help needed 43.6 (0.9) 40.4 (1.0) - 3.3 (1.3) 43.6 (0.9) 41.7 (1.0) - 1.9 (1.3)
No help 20.1 (0.8) 19.1 (0.7) - 1.0 (1.1) 20.1 (0.8) 18.6 (1.0) - 1.5 (1.3)
Percentage of Households that,if Needed Help, Would Get this
Amount of Help from OtherPeople in the CommunityBesides Family and Friends
All of the help needed 6.0 (0.4) 5.3 (0.4) - 0.7 (0.6) 6.0 (0.4) 4.8 (0.5) - 1.2 (0.6)
Most of the help needed 18.6 (0.7) 19.8 (1.0) 1.2 (1.2) 18.6 (0.7) 19.5 (0.8) 0.9 (1.1)
Very little of the help needed 44.9 (0.8) 42.5 (1.2) - 2.4 (1.4) 44.9 (0.8) 43.1 (1.2) - 1.9 (1.4)
No help 30.5 (0.9) 32.4 (1.3) 1.9 (1.6) 30.5 (0.9) 32.6 (1.3) 2.2 (1.6)
Percentage of Households thatConsider Neighborhood
Very safe 42.4 (1.5) 43.3 (1.5) 0.9 (2.1) 42.4 (1.5) 43.3 (1.5) 0.9 (2.1)
Somewhat safe 48.1 (1.2) 46.9 (1.2) - 1.2 (1.7) 48.1 (1.2) 46.8 (1.1) - 1.3 (1.6)
Very unsafe 9.6 (0.6) 9.8 (0.8) 0.2 (1.0) 9.6 (0.6) 10.0 (0.6) 0.4 (0.8)
Source: SNAP Food Security Survey 2012.
Note: The cross- sectional estimates compare new SNAP participants to a contemporaneous set of participantswho have been receiving SNAP for about six months. The longitudinal estimates compare new SNAPparticipants to the same participants about six months later.
Tabulations are based on the following overall sample sizes: 3,275 new- entrant households and 3,375six- month households in the cross- sectional sample; and 3,275 new- entrant households observed atbaseline and again at follow up six months later in the longitudinal sample. Individual panels within tablesmay have slightly fewer observations due to item nonresponse to individual questions.
aResponses of “all of the time”, “most of the time”, “a little of the time” were counted as affirmative; “none of the time”were not counted as affirmative.
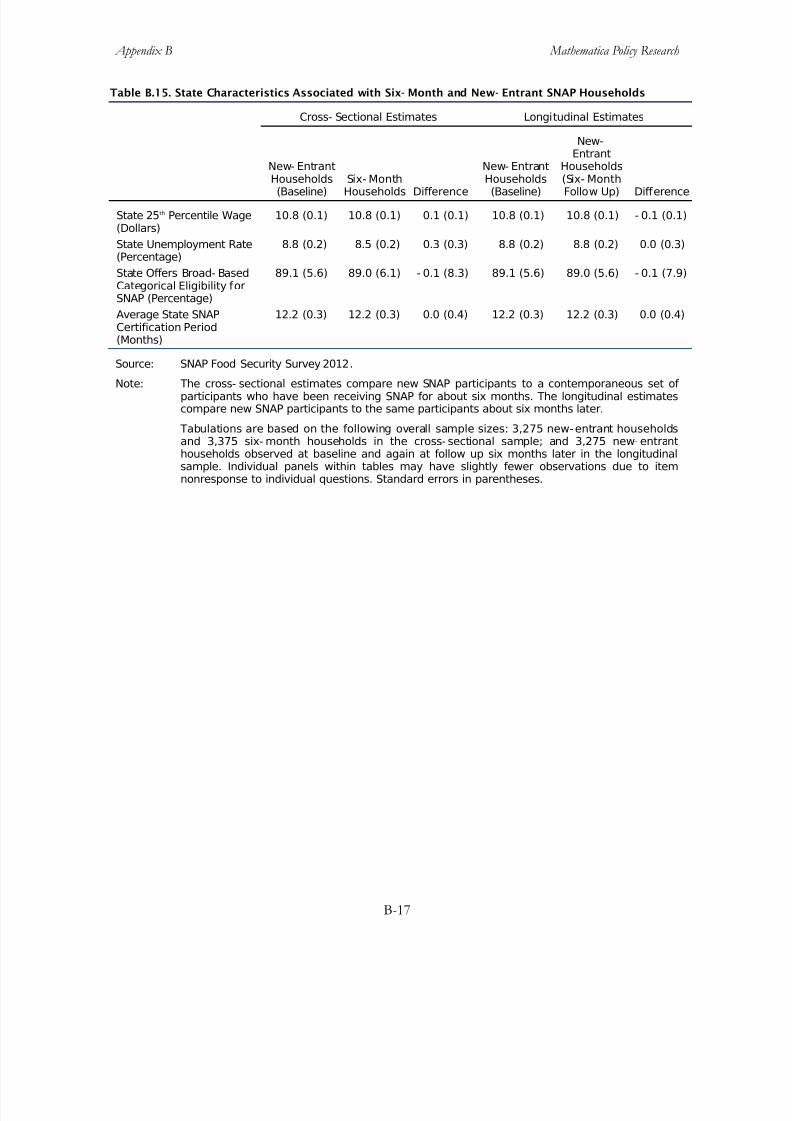
8/22/2019 USDA Report re SNAP & Food Security 08/2013
http://slidepdf.com/reader/full/usda-report-re-snap-food-security-082013 135/355
Appendix B Mathematica Policy Research
B-17
Table B.15. State Characteristics Associated with Six- Month and New- Entrant SNAP Households
Cross- Sectional Estimates Longitudinal Estimates
New- Entrant
Households(Baseline) Six- MonthHouseholds Difference
New- Entrant
Households(Baseline)
New-Entrant
Households
(Six- MonthFollow Up) Difference
State 25th Percentile Wage(Dollars)
10.8 (0.1) 10.8 (0.1) 0.1 (0.1) 10.8 (0.1) 10.8 (0.1) - 0.1 (0.1)
State Unemployment Rate(Percentage)
8.8 (0.2) 8.5 (0.2) 0.3 (0.3) 8.8 (0.2) 8.8 (0.2) 0.0 (0.3)
State Offers Broad- BasedCategorical Eligibility forSNAP (Percentage)
89.1 (5.6) 89.0 (6.1) - 0.1 (8.3) 89.1 (5.6) 89.0 (5.6) - 0.1 (7.9)
Average State SNAPCertification Period(Months)
12.2 (0.3) 12.2 (0.3) 0.0 (0.4) 12.2 (0.3) 12.2 (0.3) 0.0 (0.4)
Source: SNAP Food Security Survey 2012.Note: The cross- sectional estimates compare new SNAP participants to a contemporaneous set of
participants who have been receiving SNAP for about six months. The longitudinal estimatescompare new SNAP participants to the same participants about six months later.
Tabulations are based on the following overall sample sizes: 3,275 new-entrant householdsand 3,375 six- month households in the cross- sectional sample; and 3,275 new- entranthouseholds observed at baseline and again at follow up six months later in the longitudinalsample. Individual panels within tables may have slightly fewer observations due to itemnonresponse to individual questions. Standard errors in parentheses.

8/22/2019 USDA Report re SNAP & Food Security 08/2013
http://slidepdf.com/reader/full/usda-report-re-snap-food-security-082013 136/355
This page has been left blank for double-sided copying.

8/22/2019 USDA Report re SNAP & Food Security 08/2013
http://slidepdf.com/reader/full/usda-report-re-snap-food-security-082013 137/355
APPENDIX C
DETAILS FOR FOOD SECURITY REGRESSIONS

8/22/2019 USDA Report re SNAP & Food Security 08/2013
http://slidepdf.com/reader/full/usda-report-re-snap-food-security-082013 138/355
This page has been left blank for double-sided copying.
8/22/2019 USDA Report re SNAP & Food Security 08/2013
http://slidepdf.com/reader/full/usda-report-re-snap-food-security-082013 139/355
Appendix C Mathematica Policy Research
C-3
A. Regression Analysis of the Associations between SNAP and HouseholdFood Insecurity and between SNAP and Very Low Food Security
Raw Regression Coefficients
Our main estimates of the association between SNAP and food security are derived fromregression analysis of the data, based on logistic regression techniques. As described in the Data andMethodology discussion in Chapter II, we performed a cross-sectional analysis of the baseline data,comparing new-entrant and six-month households, and a longitudinal analysis of the new-entranthousehold sample at two points in time approximately six months apart. The main independent variable of interest in these analyses was the binary variable that measures whether a household hadparticipated in SNAP for six months or was a new-entrant household. Although we focus onsummary measures of the association between SNAP and food security in Chapter IV, in thissection we describe the full set of regression coefficients and standard errors to provide backgroundinformation for regression results behind the summary measures.
Table C.1 presents the regression coefficients and standard errors from the logistic regression
of household food insecurity. In the cross-sectional sample, participating in SNAP for six months was negatively associated with the likelihood that a household was food insecure. Households werealso less likely to be food insecure if they completed high school or beyond, relative to less than highschool; conducted their interview in English rather than Spanish; had children; had an elderly member in the household; lived in the Northeast or Mid-Atlantic compared with the West; or livedin a State that offered broad-based categorical eligibility. In contrast, households were more likely tobe food insecure if they had a household head age 25 to 64, compared with having a household headage 18 to 24; had a household head experiencing depression in the past 30 days; had a disabledperson living in the household; participated in SNAP prior to their current enrollment; received SSIor unemployment compensation; or experienced a change in household size, had been evicted fromtheir house or apartment, or experienced a change in employment, pay, or hours worked in the past
six months. The coefficients of the remaining variables were not statistically significant at the 10percent level.
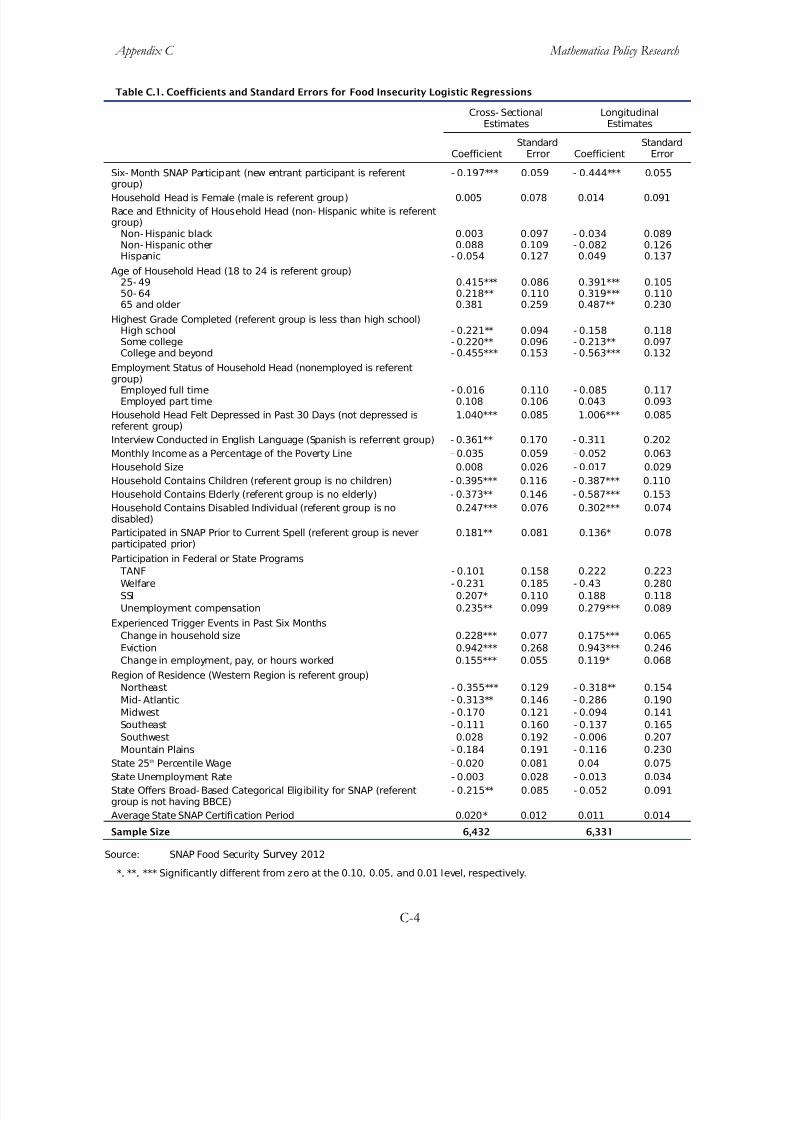
8/22/2019 USDA Report re SNAP & Food Security 08/2013
http://slidepdf.com/reader/full/usda-report-re-snap-food-security-082013 140/355
Appendix C Mathematica Policy Research
C-4
Table C.1. Coefficients and Standard Errors for Food Insecurity Logistic Regressions
Cross- SectionalEstimates
LongitudinalEstimates
CoefficientStandard
Error CoefficientStandard
Error
Six- Month SNAP Participant (new entrant participant is referent
group)
- 0.197*** 0.059 - 0.444*** 0.055
Household Head is Female (male is referent group) 0.005 0.078 0.014 0.091
Race and Ethnicity of Household Head (non- Hispanic white is referentgroup)
Non-Hispanic black 0.003 0.097 - 0.034 0.089Non-Hispanic other 0.088 0.109 - 0.082 0.126Hispanic - 0.054 0.127 0.049 0.137
Age of Household Head (18 to 24 is referent group)25- 49 0.415*** 0.086 0.391*** 0.10550- 64 0.218** 0.110 0.319*** 0.11065 and older 0.381 0.259 0.487** 0.230
Highest Grade Completed (referent group is less than high school)High school - 0.221** 0.094 - 0.158 0.118Some college - 0.220** 0.096 - 0.213** 0.097College and beyond - 0.455*** 0.153 - 0.563*** 0.132
Employment Status of Household Head (nonemployed is referentgroup)
Employed full time - 0.016 0.110 - 0.085 0.117Employed part time 0.108 0.106 0.043 0.093
Household Head Felt Depressed in Past 30 Days (not depressed isreferent group)
1.040*** 0.085 1.006*** 0.085
Interview Conducted in English Language (Spanish is referrent group) - 0.361** 0.170 - 0.311 0.202
Monthly Income as a Percentage of the Poverty Line - 0.035 0.059 - 0.052 0.063
Household Size 0.008 0.026 - 0.017 0.029
Household Contains Children (referent group is no children) - 0.395*** 0.116 - 0.387*** 0.110
Household Contains Elderly (referent group is no elderly) - 0.373** 0.146 - 0.587*** 0.153
Household Contains Disabled Individual (referent group is nodisabled)
0.247*** 0.076 0.302*** 0.074
Participated in SNAP Prior to Current Spell (referent group is neverparticipated prior)
0.181** 0.081 0.136* 0.078
Participation in Federal or State Programs
TANF - 0.101 0.158 0.222 0.223
Welfare - 0.231 0.185 - 0.43 0.280
SSI 0.207* 0.110 0.188 0.118
Unemployment compensation 0.235** 0.099 0.279*** 0.089
Experienced Trigger Events in Past Six Months
Change in household size 0.228*** 0.077 0.175*** 0.065
Eviction 0.942*** 0.268 0.943*** 0.246
Change in employment, pay, or hours worked 0.155*** 0.055 0.119* 0.068
Region of Residence (Western Region is referent group)
Northeast - 0.355*** 0.129 - 0.318** 0.154
Mid- Atlantic - 0.313** 0.146 - 0.286 0.190
Midwest - 0.170 0.121 - 0.094 0.141
Southeast - 0.111 0.160 - 0.137 0.165
Southwest 0.028 0.192 - 0.006 0.207Mountain Plains - 0.184 0.191 - 0.116 0.230
State 25th Percentile Wage - 0.020 0.081 0.04 0.075
State Unemployment Rate - 0.003 0.028 - 0.013 0.034
State Offers Broad- Based Categorical Eligibility for SNAP (referentgroup is not having BBCE)
- 0.215** 0.085 - 0.052 0.091
Average State SNAP Certification Period 0.020* 0.012 0.011 0.014
Sample Size 6,432 6,331
Source: SNAP Food Security Survey 2012
*, **, *** Significantly different from zero at the 0.10, 0.05, and 0.01 level, respectively.

8/22/2019 USDA Report re SNAP & Food Security 08/2013
http://slidepdf.com/reader/full/usda-report-re-snap-food-security-082013 141/355
Appendix C Mathematica Policy Research
C-5
In the longitudinal sample, participating in SNAP for six months was negatively associated withthe likelihood that a household was food insecure (Table C.1). Households were also less likely to befood insecure if they completed some college or beyond, relative to less than high school; hadchildren; had an elderly member in the household; or lived in the Northeast compared with the West. In contrast, households were more likely to be food insecure if they had a household head age
25 and older, compared with having a household head age 18 to 24; had a household headexperiencing depression in the past 30 days; had a disabled person living in the household;participated in SNAP prior to their current enrollment; received unemployment compensation; orhad a change in household size, had been evicted from their house or apartment, or experienced achange in employment, pay, or hours worked in the past six months. The coefficients of theremaining variables were not statistically significant at the 10 percent level.
Table C.2 presents the analogous set of regression coefficients and standard errors from thelogistic regression of whether a household had very low food security. The sets of variables that were statistically associated with very low food security in both samples generally were similar to thesets from the food insecurity regressions. Two notable exceptions include highest grade completedand household size. More education was associated with a lower likelihood that a household was
food insecure, but was generally not associated with the likelihood that a household had very low food security. Having more people in the household was not associated with the likelihood that ahousehold was food insecure, but was associated with a lower likelihood that the household had very low food security.
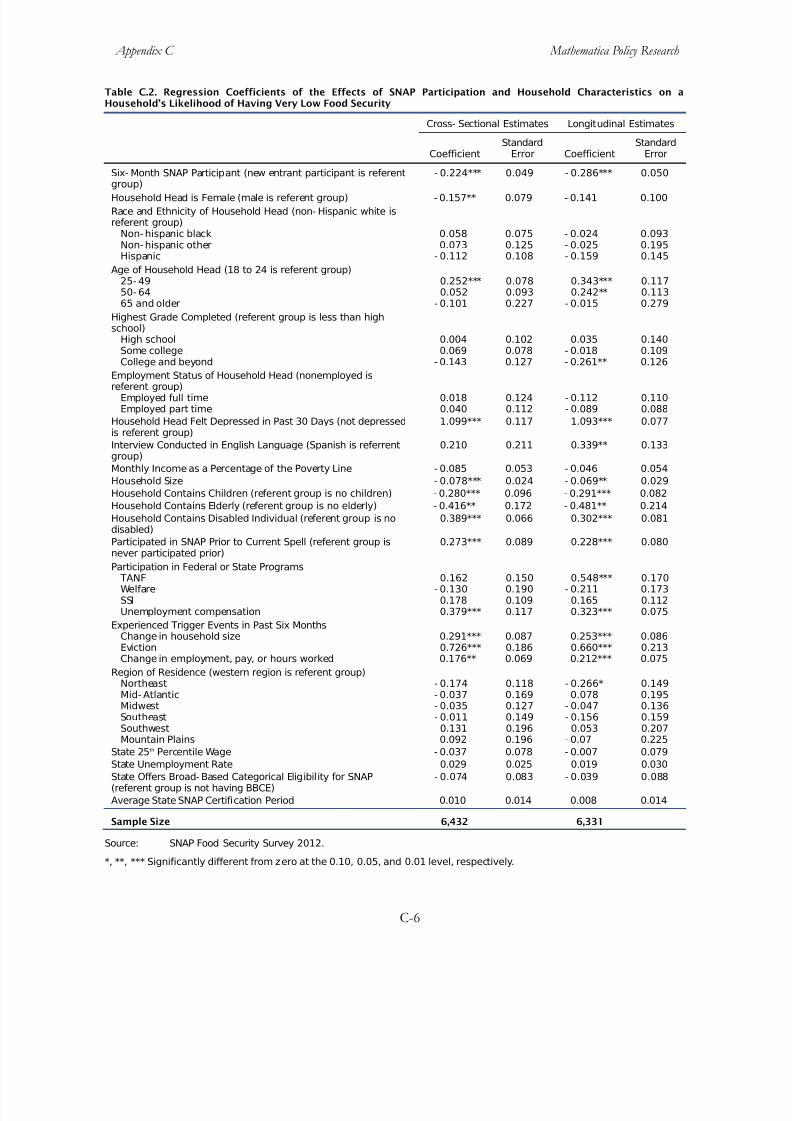
8/22/2019 USDA Report re SNAP & Food Security 08/2013
http://slidepdf.com/reader/full/usda-report-re-snap-food-security-082013 142/355
Appendix C Mathematica Policy Research
C-6
Table C.2. Regression Coefficients of the Effects of SNAP Participation and Household Characteristics on aHousehold’s Likelihood of Having Very Low Food Security
Cross- Sectional Estimates Longitudinal Estimates
CoefficientStandard
Error CoefficientStandard
Error
Six- Month SNAP Participant (new entrant participant is referent
group)
- 0.224*** 0.049 - 0.286*** 0.050
Household Head is Female (male is referent group) - 0.157** 0.079 - 0.141 0.100
Race and Ethnicity of Household Head (non- Hispanic white isreferent group)
Non-hispanic black 0.058 0.075 - 0.024 0.093Non-hispanic other 0.073 0.125 - 0.025 0.195Hispanic - 0.112 0.108 - 0.159 0.145
Age of Household Head (18 to 24 is referent group)25- 49 0.252*** 0.078 0.343*** 0.11750- 64 0.052 0.093 0.242** 0.11365 and older - 0.101 0.227 - 0.015 0.279
Highest Grade Completed (referent group is less than highschool)
High school 0.004 0.102 0.035 0.140Some college 0.069 0.078 - 0.018 0.109College and beyond - 0.143 0.127 - 0.261** 0.126
Employment Status of Household Head (nonemployed isreferent group)
Employed full time 0.018 0.124 - 0.112 0.110Employed part time 0.040 0.112 - 0.089 0.088
Household Head Felt Depressed in Past 30 Days (not depressedis referent group)
1.099*** 0.117 1.093*** 0.077
Interview Conducted in English Language (Spanish is referrentgroup)
0.210 0.211 0.339** 0.133
Monthly Income as a Percentage of the Poverty Line - 0.085 0.053 - 0.046 0.054
Household Size - 0.078*** 0.024 - 0.069** 0.029
Household Contains Children (referent group is no children) - 0.280*** 0.096 - 0.291*** 0.082
Household Contains Elderly (referent group is no elderly) - 0.416** 0.172 - 0.481** 0.214
Household Contains Disabled Individual (referent group is nodisabled)
0.389*** 0.066 0.302*** 0.081
Participated in SNAP Prior to Current Spell (referent group is
never participated prior)
0.273*** 0.089 0.228*** 0.080
Participation in Federal or State Programs TANF 0.162 0.150 0.548*** 0.170Welfare - 0.130 0.190 - 0.211 0.173SSI 0.178 0.109 0.165 0.112Unemployment compensation 0.379*** 0.117 0.323*** 0.075
Experienced Trigger Events in Past Six MonthsChange in household size 0.291*** 0.087 0.253*** 0.086Eviction 0.726*** 0.186 0.660*** 0.213Change in employment, pay, or hours worked 0.176** 0.069 0.212*** 0.075
Region of Residence (western region is referent group)Northeast - 0.174 0.118 - 0.266* 0.149Mid- Atlantic - 0.037 0.169 0.078 0.195Midwest - 0.035 0.127 - 0.047 0.136Southeast - 0.011 0.149 - 0.156 0.159Southwest 0.131 0.196 0.053 0.207Mountain Plains 0.092 0.196 - 0.07 0.225
State 25th Percentile Wage - 0.037 0.078 - 0.007 0.079
State Unemployment Rate 0.029 0.025 0.019 0.030
State Offers Broad- Based Categorical Eligibility for SNAP(referent group is not having BBCE)
- 0.074 0.083 - 0.039 0.088
Average State SNAP Certification Period 0.010 0.014 0.008 0.014
Sample Size 6,432 6,331
Source: SNAP Food Security Survey 2012.
*, **, *** Significantly different from zero at the 0.10, 0.05, and 0.01 level, respectively.
8/22/2019 USDA Report re SNAP & Food Security 08/2013
http://slidepdf.com/reader/full/usda-report-re-snap-food-security-082013 143/355
Appendix C Mathematica Policy Research
C-7
Table C.3 presents the regression coefficients and standard errors from the logistic regressionof food insecurity for households with children. In the cross-sectional sample, participating in SNAPfor six months was negatively associated with the likelihood that a household was food insecure.Households were also less likely to be food insecure if they completed high school or some college,relative to less than high school, or conducted their interview in English rather than Spanish. In
contrast, households were more likely to be food insecure if they had a household head age 25 to 49,compared with having a household head age 18 to 24; had a household head experiencing depression in the past 30 days; or experienced a change in household size, or had been evicted fromtheir house or apartment in the past six months. Households also were more likely to be foodinsecure the greater the age of the oldest child in the household.
In the longitudinal sample, participating in SNAP for six months was negatively associated withthe likelihood that a household was food insecure (Table C.3). Households were also less likely to befood insecure if the household head had completed high school or beyond, relative to less than highschool; or conducted the interview in English rather than in Spanish. In contrast, households weremore likely to be food insecure if they had a household head age 25 to 64, compared with having ahousehold head age 18 to 24; had a household head experiencing depression in the past 30 days; had
a disabled person living in the household; had received TANF; or experienced a change inhousehold size or had been evicted from their house or apartment in the past six months. Like thecross-sectional sample, households also were more likely to be food insecure the greater the age of the oldest child in the household.
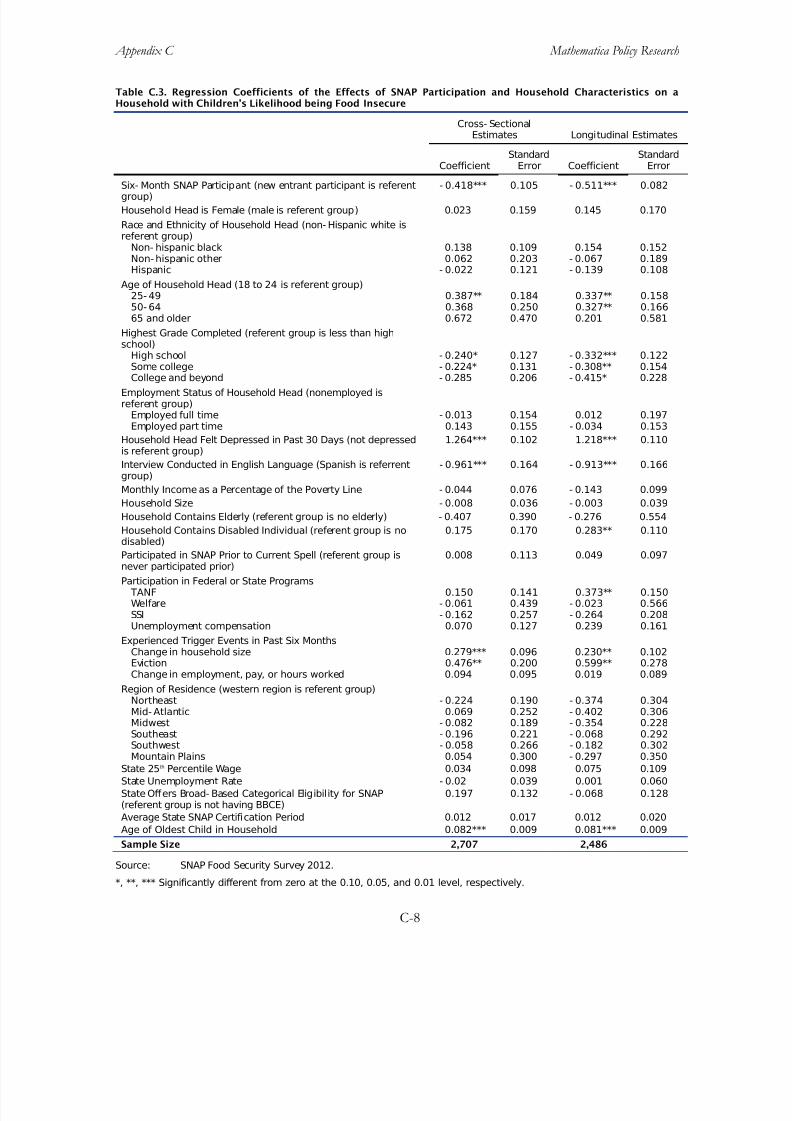
8/22/2019 USDA Report re SNAP & Food Security 08/2013
http://slidepdf.com/reader/full/usda-report-re-snap-food-security-082013 144/355
Appendix C Mathematica Policy Research
C-8
Table C.3. Regression Coefficients of the Effects of SNAP Participation and Household Characteristics on aHousehold with Children’s Likelihood being Food Insecure
Cross- SectionalEstimates Longitudinal Estimates
CoefficientStandard
Error CoefficientStandard
Error
Six- Month SNAP Participant (new entrant participant is referentgroup)
- 0.418*** 0.105 - 0.511*** 0.082
Household Head is Female (male is referent group) 0.023 0.159 0.145 0.170
Race and Ethnicity of Household Head (non- Hispanic white isreferent group)
Non- hispanic black 0.138 0.109 0.154 0.152Non-hispanic other 0.062 0.203 - 0.067 0.189Hispanic - 0.022 0.121 - 0.139 0.108
Age of Household Head (18 to 24 is referent group)25- 49 0.387** 0.184 0.337** 0.15850- 64 0.368 0.250 0.327** 0.16665 and older 0.672 0.470 0.201 0.581
Highest Grade Completed (referent group is less than highschool)
High school - 0.240* 0.127 - 0.332*** 0.122
Some college - 0.224* 0.131 - 0.308** 0.154College and beyond - 0.285 0.206 - 0.415* 0.228
Employment Status of Household Head (nonemployed isreferent group)
Employed full time - 0.013 0.154 0.012 0.197Employed part time 0.143 0.155 - 0.034 0.153
Household Head Felt Depressed in Past 30 Days (not depressedis referent group)
1.264*** 0.102 1.218*** 0.110
Interview Conducted in English Language (Spanish is referrentgroup)
- 0.961*** 0.164 - 0.913*** 0.166
Monthly Income as a Percentage of the Poverty Line - 0.044 0.076 - 0.143 0.099
Household Size - 0.008 0.036 - 0.003 0.039
Household Contains Elderly (referent group is no elderly) - 0.407 0.390 - 0.276 0.554
Household Contains Disabled Individual (referent group is nodisabled)
0.175 0.170 0.283** 0.110
Participated in SNAP Prior to Current Spell (referent group isnever participated prior)
0.008 0.113 0.049 0.097
Participation in Federal or State Programs TANF 0.150 0.141 0.373** 0.150Welfare - 0.061 0.439 - 0.023 0.566SSI - 0.162 0.257 - 0.264 0.208Unemployment compensation 0.070 0.127 0.239 0.161
Experienced Trigger Events in Past Six MonthsChange in household size 0.279*** 0.096 0.230** 0.102Eviction 0.476** 0.200 0.599** 0.278Change in employment, pay, or hours worked 0.094 0.095 0.019 0.089
Region of Residence (western region is referent group)Northeast - 0.224 0.190 - 0.374 0.304Mid- Atlantic 0.069 0.252 - 0.402 0.306Midwest - 0.082 0.189 - 0.354 0.228
Southeast - 0.196 0.221 - 0.068 0.292Southwest - 0.058 0.266 - 0.182 0.302Mountain Plains 0.054 0.300 - 0.297 0.350
State 25th Percentile Wage 0.034 0.098 0.075 0.109
State Unemployment Rate - 0.02 0.039 0.001 0.060
State Offers Broad- Based Categorical Eligibility for SNAP(referent group is not having BBCE)
0.197 0.132 - 0.068 0.128
Average State SNAP Certification Period 0.012 0.017 0.012 0.020
Age of Oldest Child in Household 0.082*** 0.009 0.081*** 0.009
Sample Size 2,707 2,486
Source: SNAP Food Security Survey 2012.
*, **, *** Significantly different from zero at the 0.10, 0.05, and 0.01 level, respectively.
8/22/2019 USDA Report re SNAP & Food Security 08/2013
http://slidepdf.com/reader/full/usda-report-re-snap-food-security-082013 145/355
Appendix C Mathematica Policy Research
C-9
Table C.4 presents the regression coefficients and standard errors from the logistic regressionof whether a household with children had very low food security. In the cross-sectional sample,participating in SNAP for six months was negatively associated with the likelihood that children had very low food security. Children were also less likely to have very low food security if they lived in ahousehold in which the household head completed high school, relative to less than high school;
conducted their interview in English rather than Spanish; participated in SNAP prior to their currentenrollment; or had a change in pay, employment, or hours worked over the past six months. Inaddition, the state unemployment rate was negatively associated with food insecurity. In contrast,children were more likely to have very low food security if the household head was black, compared with non-Hispanic white; had a household head experiencing depression in the past 30 days; had adisabled member; the household head was receiving TANF or unemployment compensation; or if the household had an older child.
In the longitudinal sample, participating in SNAP for six months was not associated with thelikelihood that children had very low food security at the 0.10 level (Table C.4). Children were lesslikely to have very low food security if the respondent conducted their interview in English ratherthan Spanish; the household residence was in the Midwest or Mountain Plan states; if the state of
residence offered broad-based categorical eligibility for SNAP, compared with not having BBCE. Inaddition, the state unemployment rate was negatively associated with very low food security.Children were more likely to have very low food security if the head of household was black,compared to non-Hispanic white; had experienced depression within the last 30 days; was receiving unemployment compensation; if the household had undergone a change in size over the past sixmonths; had a disabled member, or an older child.

8/22/2019 USDA Report re SNAP & Food Security 08/2013
http://slidepdf.com/reader/full/usda-report-re-snap-food-security-082013 146/355
Appendix C Mathematica Policy Research
C-10
Table C.4. Regression Coefficients of the Effects of SNAP Participation and Household Characteristics on aHousehold with Children’s Likelihood of Having Very Low Food Security
Cross- SectionalEstimates Longitudinal Estimates
CoefficientStandard
Error CoefficientStandard
Error
Six- Month SNAP Participant (new entrant participant is referentgroup)
- 0.722*** 0.280 - 0.199 0.214
Household Head is Female (male is referent group) - 0.229 0.251 - 0.04 0.249
Race and Ethnicity of Household Head (non- Hispanic white isreferent group)
Non- hispanic black 0.941*** 0.272 1.055*** 0.273Non-hispanic other 0.196 0.388 - 0.107 0.526Hispanic 0.454 0.315 0.335 0.324
Age of Household Head (18 to 24 is referent group)25- 49 0.149 0.337 - 0.042 0.28250- 64 0.670 0.417 0.367 0.40565 and older 0.572 0.764 - 1.393 1.302
Highest Grade Completed (referent group is less than highschool)
High school - 0.537* 0.326 - 0.34 0.274Some college - 0.182 0.254 - 0.225 0.276
College and beyond - 0.279 0.405 - 0.594 0.471
Employment Status of Household Head (nonemployed isreferent group)
Employed full time 0.237 0.355 0.101 0.276Employed part time 0.340 0.367 - 0.332 0.472
Household Head Felt Depressed in Past 30 Days (not depressedis referent group)
1.439*** 0.320 1.703*** 0.422
Interview Conducted in English Language (Spanish is referrentgroup)
- 0.869*** 0.354 - 0.761* 0.417
Monthly Income as a Percentage of the Poverty Line 0.039 0.194 - 0.145 0.128
Household Size - 0.005 0.067 - 0.025 0.087
Household Contains Elderly (referent group is no elderly) - 0.751 0.794 - 0.101 0.447
Household Contains Disabled Individual (referent group is nodisabled)
0.446* 0.268 0.602** 0.259
Participated in SNAP Prior to Current Spell (referent group isnever participated prior) - 0.363* 0.209 - 0.157 0.290
Participation in Federal or State Programs TANF 0.669* 0.361 0.334 0.467Welfare - 0.269 0.569 - 0.516 0.779SSI - 0.558 0.416 - 0.753 0.473Unemployment compensation 0.695*** 0.238 0.396* 0.224
Experienced Trigger Events in Past Six MonthsChange in household size 0.392 0.264 0.522*** 0.174Eviction 0.055 0.542 0.431 0.504Change in employment, pay, or hours worked - 0.376** 0.188 - 0.198 0.171
Region of Residence (western region is referent group)Northeast - 0.226 0.493 - 0.281 0.498Mid- Atlantic 0.247 0.549 - 0.52 0.543Midwest - 0.018 0.462 - 0.976** 0.480Southeast - 0.18 0.57 - 0.382 0.523
Southwest - 0.187 0.672 - 0.774 0.657Mountain Plains - 1.01 0.925 - 1.585** 0.717
State 25th Percentile Wage 0.035 0.266 0.091 0.192
State Unemployment Rate - 0.273*** 0.107 - 0.219* 0.121
State Offers Broad- Based Categorical Eligibility for SNAP(referent group is not having BBCE)
- 0.038 0.227 - 0.770*** 0.223
Average State SNAP Certification Period - 0.048 0.043 - 0.02 0.037
Age of Oldest Child in Household 0.120*** 0.023 0.107*** 0.023
Sample Size 2,707 2,486
Source: SNAP Food Security Survey 2012.
*, **, *** Significantly different from zero at the 0.10, 0.05, and 0.01 level, respectively.

8/22/2019 USDA Report re SNAP & Food Security 08/2013
http://slidepdf.com/reader/full/usda-report-re-snap-food-security-082013 147/355
APPENDIX D
SENSITIVITY ANALYSES FOR FOOD SECURITY REGRESSIONS

8/22/2019 USDA Report re SNAP & Food Security 08/2013
http://slidepdf.com/reader/full/usda-report-re-snap-food-security-082013 148/355
This page has been left blank for double-sided copying.
8/22/2019 USDA Report re SNAP & Food Security 08/2013
http://slidepdf.com/reader/full/usda-report-re-snap-food-security-082013 149/355
Appendix D Mathematica Policy Research
D-3
The finding in Chapter IV that SNAP was associated with improved food security was generally consistent across the cross-sectional and longitudinal samples, across the two outcome measures of food insecurity and very low food security, and across household food security and child foodsecurity. Nevertheless, we conducted auxiliary analyses to determine whether the associationsbetween SNAP and food insecurity (or very low food security) were sensitive to the empirical
modeling decisions or decisions related to which households were included in the analysis sample. The findings reported in Chapter IV were found to be robust to these alternative specifications. Inthis appendix, we present the results of these auxiliary analyses.
Diagnostic Checks Associated with Model Specification
We conducted several auxiliary analyses to determine whether the associations between SNAPand food insecurity (or very low food security) were sensitive to the statistical model or the set of explanatory variables included in the model. The findings reported in Chapter IV were found to berobust to these alternative specifications.
Ordinary least squares (OLS). In place of estimating a logistic regression model, we
estimated an OLS regression of food insecurity (or very low food security) on SNAP and the sameset of explanatory variables used above. This allowed us to test the sensitivity of our findings to thefunctional form of the model. Relative to our main findings presented above, the associationsbetween SNAP and food insecurity and between SNAP and very low food security decreased by lessthan half a percentage point in the cross-sectional sample and by less than one percentage point inthe longitudinal sample (Table D.1). For example, in the cross-sectional sample, the estimatedassociation between SNAP and the percentage of food insecure households was a decrease of -4.3percentage points, compared to a decrease of -4.6 percentage points in the original model.

8/22/2019 USDA Report re SNAP & Food Security 08/2013
http://slidepdf.com/reader/full/usda-report-re-snap-food-security-082013 150/355
Appendix D Mathematica Policy Research
D-4
Table D.1. Regression- Adjusted Percentage of Households That Are Food Insecure or That HaveVery Low Food Security, by Six- Month and New- Entrant SNAP Participation Status and by ModelSpecification
Cross- Sectional Estimates Longitudinal Estimates
New- EntrantHouseholds(Baseline)
Six- MonthHouseholds Difference
New- EntrantHouseholds(Baseline)
New- Entrant
Households(Six- MonthFollow- Up) Difference
Food Insecure
Main Model Specification(Logistic RegressionModel)
65.4 60.8 - 4.6*** 65.1 54.5 - 10.6***
Alternative ModelSpecification(OLS Regression Model)
64.2 60.0 - 4.3*** 63.9 54.2 - 9.7***
Food Insecure with VeryLow Food Security
Main Model Specification(Logistic RegressionModel)
36.4 31.4 - 5.0*** 35.9 29.6 - 6.3***
Alternative ModelSpecification(OLS Regression Model)
38.0 33.4 - 4.6*** 37.7 31.9 - 5.8***
Source: SNAP Food Security Survey 2012.
Note: The cross- sectional estimates compare new SNAP participants to a contemporaneous set of participants who have been receiving SNAP for about six months. The longitudinal estimatescompare new SNAP participants to the same participants about six months later.
Cross- sectional estimates are based on a data set with 6,650 households (3,275 new- entranthouseholds and 3,375 six- month households). Longitudinal estimates are based on a data setwith 3,275 new- entrant households observed at baseline and again at follow- up six months
later.
*, **, *** Significantly different from zero at the 0.10, 0.05, and 0.01 level, respectively.
Explanatory variables. Maintaining the logistic regression model, we also assessed thespecification of the model in terms of the set of explanatory variables used. Our basic analysis used arelatively large number of explanatory variables, reflecting both the richness of the data set and themany variables that may affect food security and explain differences between SNAP six-month andnew-entrant households. We tested the sensitivity of our findings using a more parsimonious set of explanatory variables limited to household size, household composition (whether the household hadchildren, whether the household had an elderly individual living in the household, whether thehousehold had a disabled individual living in the household), household income, region of residence,
interview conducted in English, and prior SNAP participation. As Table D.2 shows, relative to ourmain findings, SNAP was associated with larger decreases in food insecurity and very low foodsecurity (-6.5 percentage points for food insecurity in the cross-sectional sample, compared to -4.6percentage points in the original model, for example). A statistical comparison of the model fit fromthese “restricted” models to the original specification (the “unrestricted” models) rejected using theparsimonious specification in favor of using the original model for both the cross-sectional andlongitudinal samples and for food insecurity and very low food security.
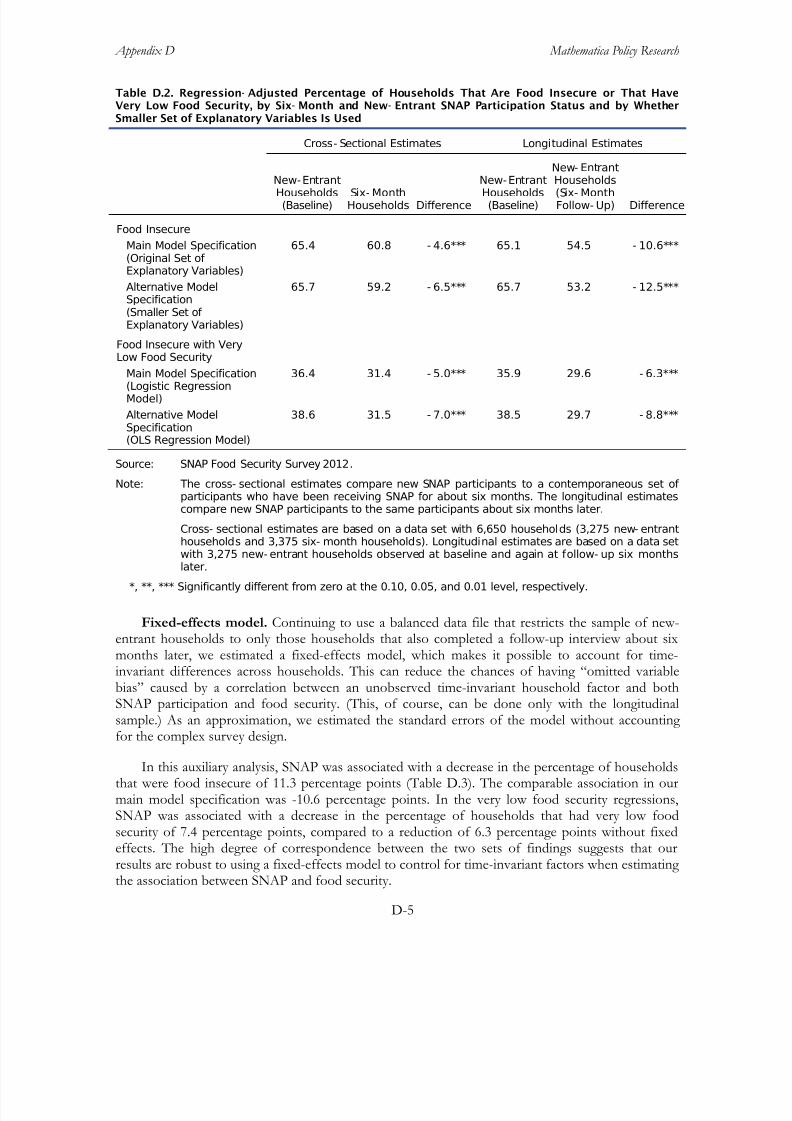
8/22/2019 USDA Report re SNAP & Food Security 08/2013
http://slidepdf.com/reader/full/usda-report-re-snap-food-security-082013 151/355
Appendix D Mathematica Policy Research
D-5
Table D.2. Regression- Adjusted Percentage of Households That Are Food Insecure or That HaveVery Low Food Security, by Six- Month and New- Entrant SNAP Participation Status and by WhetherSmaller Set of Explanatory Variables Is Used
Cross- Sectional Estimates Longitudinal Estimates
New-EntrantHouseholds(Baseline)
Six- MonthHouseholds Difference
New-EntrantHouseholds(Baseline)
New- Entrant
Households(Six- MonthFollow- Up) Difference
Food Insecure
Main Model Specification(Original Set of Explanatory Variables)
65.4 60.8 - 4.6*** 65.1 54.5 - 10.6***
Alternative ModelSpecification(Smaller Set of Explanatory Variables)
65.7 59.2 - 6.5*** 65.7 53.2 - 12.5***
Food Insecure with VeryLow Food Security
Main Model Specification(Logistic RegressionModel)
36.4 31.4 - 5.0*** 35.9 29.6 - 6.3***
Alternative ModelSpecification(OLS Regression Model)
38.6 31.5 - 7.0*** 38.5 29.7 - 8.8***
Source: SNAP Food Security Survey 2012.
Note: The cross- sectional estimates compare new SNAP participants to a contemporaneous set of participants who have been receiving SNAP for about six months. The longitudinal estimatescompare new SNAP participants to the same participants about six months later.
Cross- sectional estimates are based on a data set with 6,650 households (3,275 new- entranthouseholds and 3,375 six- month households). Longitudinal estimates are based on a data set
with 3,275 new- entrant households observed at baseline and again at follow- up six monthslater.
*, **, *** Significantly different from zero at the 0.10, 0.05, and 0.01 level, respectively.
Fixed-effects model. Continuing to use a balanced data file that restricts the sample of new-entrant households to only those households that also completed a follow-up interview about sixmonths later, we estimated a fixed-effects model, which makes it possible to account for time-invariant differences across households. This can reduce the chances of having “omitted variablebias” caused by a correlation between an unobserved time-invariant household factor and bothSNAP participation and food security. (This, of course, can be done only with the longitudinalsample.) As an approximation, we estimated the standard errors of the model without accounting
for the complex survey design.
In this auxiliary analysis, SNAP was associated with a decrease in the percentage of householdsthat were food insecure of 11.3 percentage points (Table D.3). The comparable association in ourmain model specification was -10.6 percentage points. In the very low food security regressions,SNAP was associated with a decrease in the percentage of households that had very low foodsecurity of 7.4 percentage points, compared to a reduction of 6.3 percentage points without fixedeffects. The high degree of correspondence between the two sets of findings suggests that ourresults are robust to using a fixed-effects model to control for time-invariant factors when estimating the association between SNAP and food security.
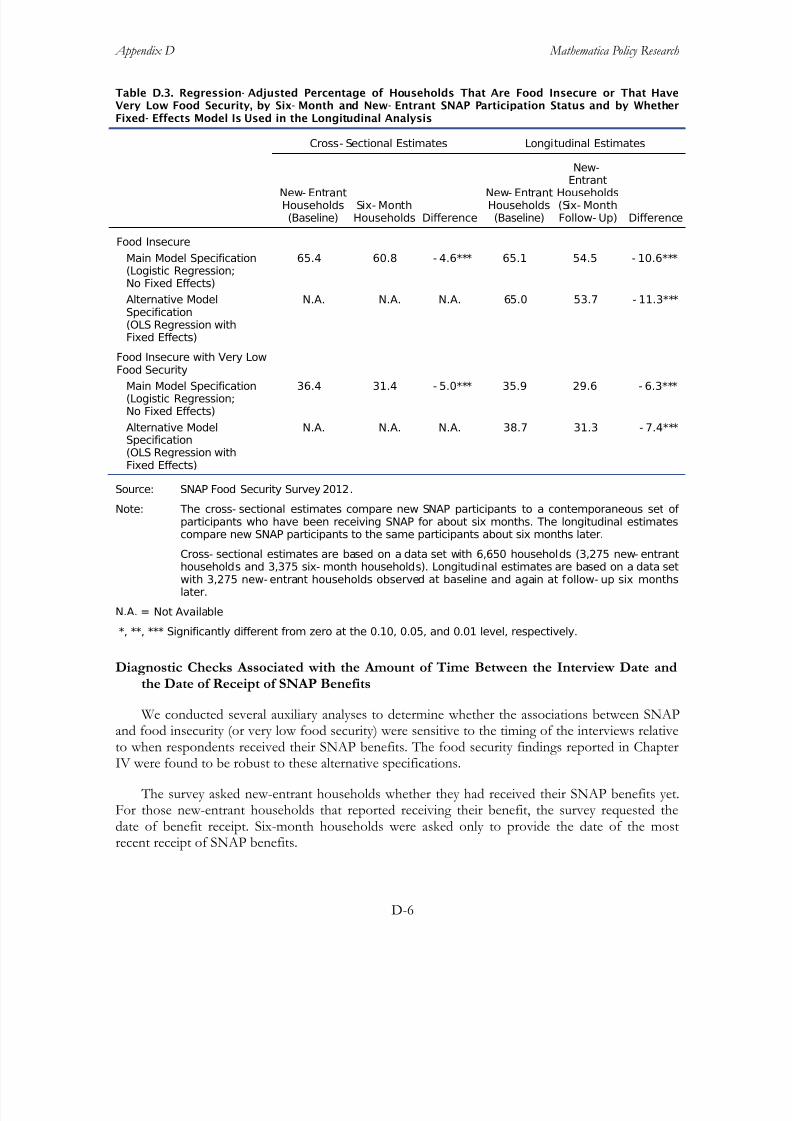
8/22/2019 USDA Report re SNAP & Food Security 08/2013
http://slidepdf.com/reader/full/usda-report-re-snap-food-security-082013 152/355
Appendix D Mathematica Policy Research
D-6
Table D.3. Regression- Adjusted Percentage of Households That Are Food Insecure or That HaveVery Low Food Security, by Six- Month and New- Entrant SNAP Participation Status and by WhetherFixed- Effects Model Is Used in the Longitudinal Analysis
Cross- Sectional Estimates Longitudinal Estimates
New- EntrantHouseholds(Baseline)
Six- MonthHouseholds Difference
New- EntrantHouseholds(Baseline)
New-
EntrantHouseholds(Six- MonthFollow- Up) Difference
Food Insecure
Main Model Specification(Logistic Regression;No Fixed Effects)
65.4 60.8 - 4.6*** 65.1 54.5 - 10.6***
Alternative ModelSpecification(OLS Regression withFixed Effects)
N.A. N.A. N.A. 65.0 53.7 - 11.3***
Food Insecure with Very Low
Food Security
Main Model Specification(Logistic Regression;No Fixed Effects)
36.4 31.4 - 5.0*** 35.9 29.6 - 6.3***
Alternative ModelSpecification(OLS Regression withFixed Effects)
N.A. N.A. N.A. 38.7 31.3 - 7.4***
Source: SNAP Food Security Survey 2012.
Note: The cross- sectional estimates compare new SNAP participants to a contemporaneous set of participants who have been receiving SNAP for about six months. The longitudinal estimatescompare new SNAP participants to the same participants about six months later.
Cross- sectional estimates are based on a data set with 6,650 households (3,275 new- entranthouseholds and 3,375 six- month households). Longitudinal estimates are based on a data setwith 3,275 new- entrant households observed at baseline and again at follow- up six monthslater.
N.A. = Not Available
*, **, *** Significantly different from zero at the 0.10, 0.05, and 0.01 level, respectively.
Diagnostic Checks Associated with the Amount of Time Between the Interview Date andthe Date of Receipt of SNAP Benefits
We conducted several auxiliary analyses to determine whether the associations between SNAP
and food insecurity (or very low food security) were sensitive to the timing of the interviews relativeto when respondents received their SNAP benefits. The food security findings reported in ChapterIV were found to be robust to these alternative specifications.
The survey asked new-entrant households whether they had received their SNAP benefits yet.For those new-entrant households that reported receiving their benefit, the survey requested thedate of benefit receipt. Six-month households were asked only to provide the date of the mostrecent receipt of SNAP benefits.
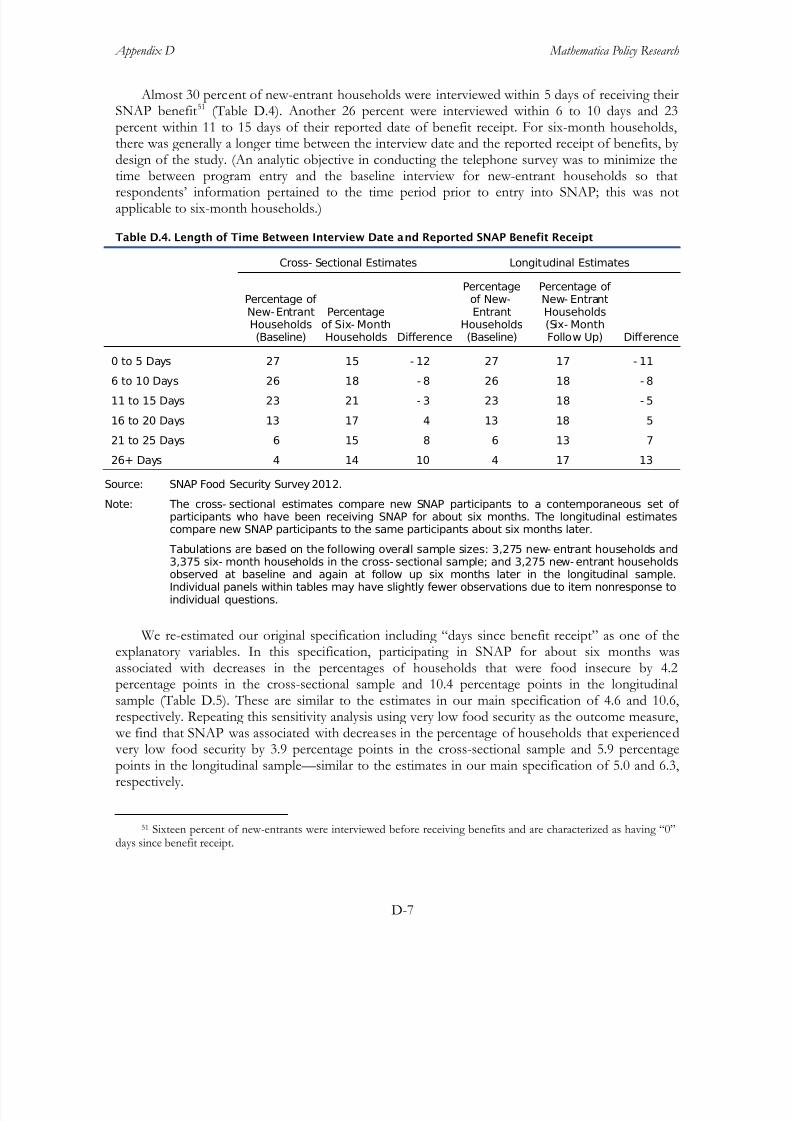
8/22/2019 USDA Report re SNAP & Food Security 08/2013
http://slidepdf.com/reader/full/usda-report-re-snap-food-security-082013 153/355
Appendix D Mathematica Policy Research
D-7
Almost 30 percent of new-entrant households were interviewed within 5 days of receiving theirSNAP benefit51
Table D.4. Length of Time Between Interview Date and Reported SNAP Benefit Receipt
(Table D.4). Another 26 percent were interviewed within 6 to 10 days and 23percent within 11 to 15 days of their reported date of benefit receipt. For six-month households,there was generally a longer time between the interview date and the reported receipt of benefits, by design of the study. (An analytic objective in conducting the telephone survey was to minimize the
time between program entry and the baseline interview for new-entrant households so thatrespondents’ information pertained to the time period prior to entry into SNAP; this was notapplicable to six-month households.)
Cross- Sectional Estimates Longitudinal Estimates
Percentage of New-EntrantHouseholds(Baseline)
Percentageof Six- MonthHouseholds Difference
Percentageof New-Entrant
Households(Baseline)
Percentage of New- EntrantHouseholds(Six- MonthFollow Up) Difference
0 to 5 Days 27 15 - 12 27 17 - 11
6 to 10 Days 26 18 - 8 26 18 - 8
11 to 15 Days 23 21 - 3 23 18 - 5
16 to 20 Days 13 17 4 13 18 5
21 to 25 Days 6 15 8 6 13 7
26+ Days 4 14 10 4 17 13
Source: SNAP Food Security Survey 2012.
Note: The cross- sectional estimates compare new SNAP participants to a contemporaneous set of participants who have been receiving SNAP for about six months. The longitudinal estimatescompare new SNAP participants to the same participants about six months later.
Tabulations are based on the following overall sample sizes: 3,275 new- entrant households and3,375 six- month households in the cross- sectional sample; and 3,275 new- entrant householdsobserved at baseline and again at follow up six months later in the longitudinal sample.Individual panels within tables may have slightly fewer observations due to item nonresponse toindividual questions.
We re-estimated our original specification including “days since benefit receipt” as one of theexplanatory variables. In this specification, participating in SNAP for about six months wasassociated with decreases in the percentages of households that were food insecure by 4.2percentage points in the cross-sectional sample and 10.4 percentage points in the longitudinalsample (Table D.5). These are similar to the estimates in our main specification of 4.6 and 10.6,respectively. Repeating this sensitivity analysis using very low food security as the outcome measure,
we find that SNAP was associated with decreases in the percentage of households that experienced very low food security by 3.9 percentage points in the cross-sectional sample and 5.9 percentagepoints in the longitudinal sample—similar to the estimates in our main specification of 5.0 and 6.3,respectively.
51 Sixteen percent of new-entrants were interviewed before receiving benefits and are characterized as having “0”days since benefit receipt.

8/22/2019 USDA Report re SNAP & Food Security 08/2013
http://slidepdf.com/reader/full/usda-report-re-snap-food-security-082013 154/355
Appendix D Mathematica Policy Research
D-8
Table D.5. Regression- Adjusted Percentage of Households That Are Food Insecure or That HaveVery Low Food Security, by Six- Month and New- Entrant SNAP Participation Status and by WhetherModel Includes “Days Since SNAP Benefit Receipt” Variable
Cross- Sectional Estimates Longitudinal Estimates
New- EntrantHouseholds(Baseline)
Six- MonthHouseholds Difference
New- EntrantHouseholds(Baseline)
New-
EntrantHouseholds(Six- MonthFollow- Up) Difference
Food Insecure
Main Model Specification 65.4 60.8 - 4.6*** 65.1 54.5 - 10.6***
Alternative Model ThatIncludes “Days SinceBenefit Receipt” asExplanatory Variable
65.4 61.2 - 4.2*** 64.4 54.0 - 10.4***
Food Insecure with Very LowFood Security
Main Model Specification 36.4 31.4 - 5.0*** 35.9 29.6 - 6.3***
Alternative Model ThatIncludes “Days SinceBenefit Receipt” asExplanatory Variable
35.9 31.9 - 3.9*** 35.0 29.1 - 5.9***
Source: SNAP Food Security Survey 2012.
Note: The cross- sectional estimates compare new SNAP participants to a contemporaneous set of participants who have been receiving SNAP for about six months. The longitudinal estimatescompare new SNAP participants to the same participants about six months later.
Cross- sectional estimates are based on a data set with 6,650 households (3,275 new- entranthouseholds and 3,375 six- month households). Longitudinal estimates are based on a data setwith 3,275 new- entrant households observed at baseline and again at follow- up six monthslater.
*, **, *** Significantly different from zero at the 0.10, 0.05, and 0.01 level, respectively.
As an additional set of sensitivity analyses, we categorized new-entrant households into fourgroups based on the days since benefit receipt: 0 days, greater than 0 days, 1 to 11 days, or 12 daysor more.52
The findings from the main specification reported earlier were robust to these alternativespecifications. As anticipated, there was a tendency for the groups interviewed before receiving benefits or within a short time of receiving benefits to have stronger associations between SNAPand food security. For instance, for households that had not received benefits as of the interview date, SNAP participation was associated with greater reductions in food insecurity than for theentire samples in the main analysis. The reduction in food insecurity in the sensitivity analysis was12.7 percentage points in the cross-sectional sample and 18.9 percentage points in the longitudinalsample (Table D.6). Among households that had already received benefits by the time of the
We estimated the food insecurity and very low food security regressions for each of thesesets of new-entrant households and the full set of six-month households.
52 Eleven days was the median number of days in the new-entrant sample among new-entrant households that hadreceived their benefit at the time of the interview.
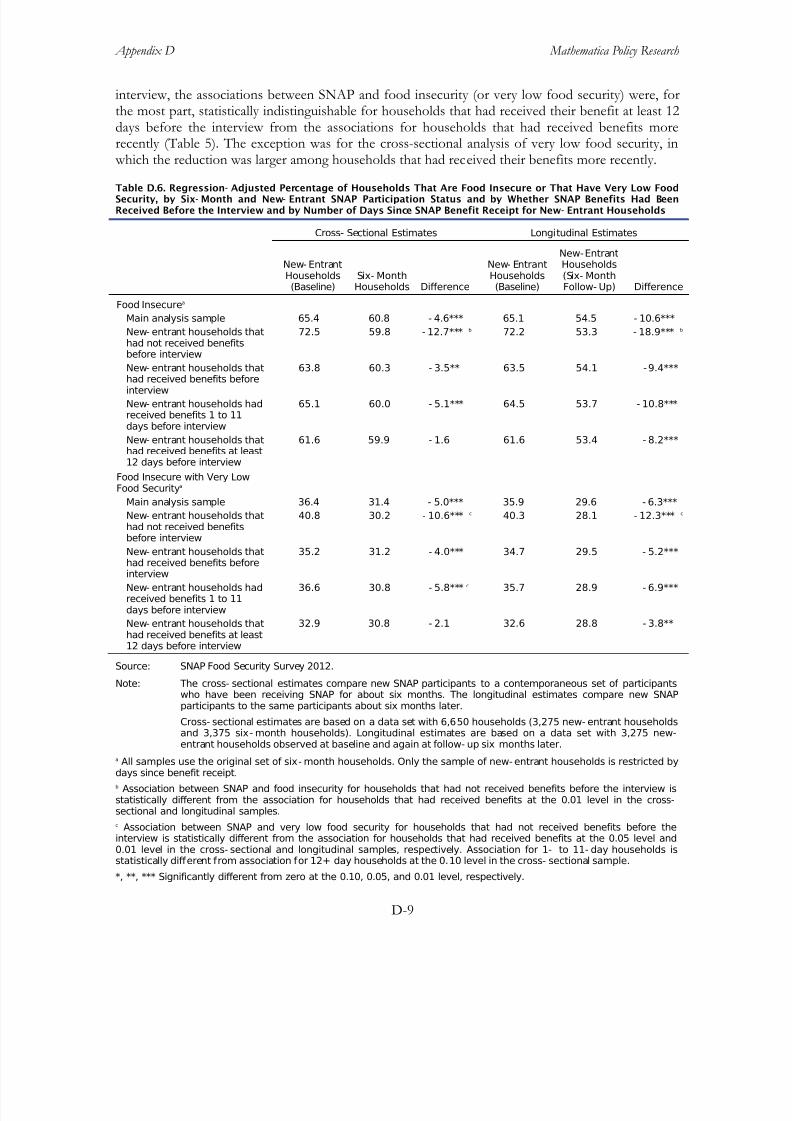
8/22/2019 USDA Report re SNAP & Food Security 08/2013
http://slidepdf.com/reader/full/usda-report-re-snap-food-security-082013 155/355
Appendix D Mathematica Policy Research
D-9
interview, the associations between SNAP and food insecurity (or very low food security) were, forthe most part, statistically indistinguishable for households that had received their benefit at least 12days before the interview from the associations for households that had received benefits morerecently (Table 5). The exception was for the cross-sectional analysis of very low food security, in which the reduction was larger among households that had received their benefits more recently.
Table D.6. Regression- Adjusted Percentage of Households That Are Food Insecure or That Have Very Low FoodSecurity, by Six- Month and New- Entrant SNAP Participation Status and by Whether SNAP Benefits Had BeenReceived Before the Interview and by Number of Days Since SNAP Benefit Receipt for New- Entrant Households
Cross- Sectional Estimates Longitudinal Estimates
New- EntrantHouseholds(Baseline)
Six- MonthHouseholds Difference
New- EntrantHouseholds(Baseline)
New-EntrantHouseholds(Six- MonthFollow- Up) Difference
Food Insecurea
Main analysis sample 65.4 60.8 - 4.6*** 65.1 54.5 - 10.6***
New- entrant households thathad not received benefitsbefore interview
72.5 59.8 - 12.7*** b 72.2 53.3 - 18.9*** b
New- entrant households thathad received benefits beforeinterview
63.8 60.3 - 3.5** 63.5 54.1 -9.4***
New- entrant households hadreceived benefits 1 to 11days before interview
65.1 60.0 - 5.1*** 64.5 53.7 - 10.8***
New- entrant households thathad received benefits at least12 days before interview
61.6 59.9 - 1.6 61.6 53.4 - 8.2***
Food Insecure with Very LowFood Securitya
Main analysis sample 36.4 31.4 - 5.0*** 35.9 29.6 - 6.3***
New- entrant households thathad not received benefitsbefore interview
40.8 30.2 - 10.6*** c 40.3 28.1 - 12.3*** c
New- entrant households thathad received benefits beforeinterview
35.2 31.2 - 4.0*** 34.7 29.5 - 5.2***
New- entrant households hadreceived benefits 1 to 11days before interview
36.6 30.8 - 5.8*** c 35.7 28.9 - 6.9***
New- entrant households thathad received benefits at least12 days before interview
32.9 30.8 - 2.1 32.6 28.8 - 3.8**
Source: SNAP Food Security Survey 2012.
Note: The cross- sectional estimates compare new SNAP participants to a contemporaneous set of participantswho have been receiving SNAP for about six months. The longitudinal estimates compare new SNAPparticipants to the same participants about six months later.
Cross- sectional estimates are based on a data set with 6,650 households (3,275 new- entrant households
and 3,375 six- month households). Longitudinal estimates are based on a data set with 3,275 new-entrant households observed at baseline and again at follow- up six months later.
a All samples use the original set of six- month households. Only the sample of new- entrant households is restricted bydays since benefit receipt.
b Association between SNAP and food insecurity for households that had not received benefits before the interview isstatistically different from the association for households that had received benefits at the 0.01 level in the cross-sectional and longitudinal samples.
c Association between SNAP and very low food security for households that had not received benefits before theinterview is statistically different from the association for households that had received benefits at the 0.05 level and0.01 level in the cross- sectional and longitudinal samples, respectively. Association for 1- to 11- day households isstatistically different from association for 12+ day households at the 0.10 level in the cross- sectional sample.
*, **, *** Significantly different from zero at the 0.10, 0.05, and 0.01 level, respectively.

8/22/2019 USDA Report re SNAP & Food Security 08/2013
http://slidepdf.com/reader/full/usda-report-re-snap-food-security-082013 156/355
Appendix D Mathematica Policy Research
D-10
Because the food security index essentially identifies the worst food security conditions that ahousehold has experienced in the previous 30 days, any bias introduced by interviewing householdspost benefit receipt should be at least partially mitigated by the recall period of the food security index. Under plausible assumptions, for most households, the worst food security condition wouldoccur just before entering SNAP, so the measure is likely to have captured the worst food security
condition even for the small percentage of households interviewed three or four weeks afterreceiving benefits.
Overall, this sensitivity analysis suggests that the study’s findings remained consistent—SNAPbenefits were generally associated with improved food security across different sets of householdsgrouped by time since receipt of benefits at baseline. These results provide further evidence of therobustness of our basic results. In addition, the findings for households that had not received theirbenefits as of the interview date suggest that the association between SNAP and food security foundin the main analysis might be somewhat conservative. However, because households that had notyet received benefits may differ in observable and unobservable characteristics from households thathad received benefits, differences in the sizes of the associations may not be due only to the amountof time since benefit receipt.
Comparison of Findings to Unrestricted New-Entrant Household Sample
In Chapter IV, we restricted the sample of new-entrant households to those that continued toparticipate six months later, at the time of the follow-up interview, to improve the comparability of the groups of new-entrant and six-month households. In this section, we present the findings fromthe analysis that uses the unrestricted sample of new-entrant households.
Using the unrestricted sample of new-entrant households, SNAP was associated with a decreasein the percentage of households that were food insecure by 4.7 percentage points in the cross-sectional sample and 10.9 percentage points in the longitudinal sample (Table D.7). This comparesto 4.6 and 10.8 using the restricted sample.
Using the unrestricted sample of new-entrant households, participating in SNAP for about sixmonths was associated with a decrease in the percentage of households that experienced very low food security by 5.8 percentage points in the cross-sectional sample and 7.0 percentage points in thelongitudinal sample (Table D.7). This compares to 5.0 and 6.3 using the restricted sample. Weconclude that the restricted sample findings do not appear to be sensitive to this restriction.
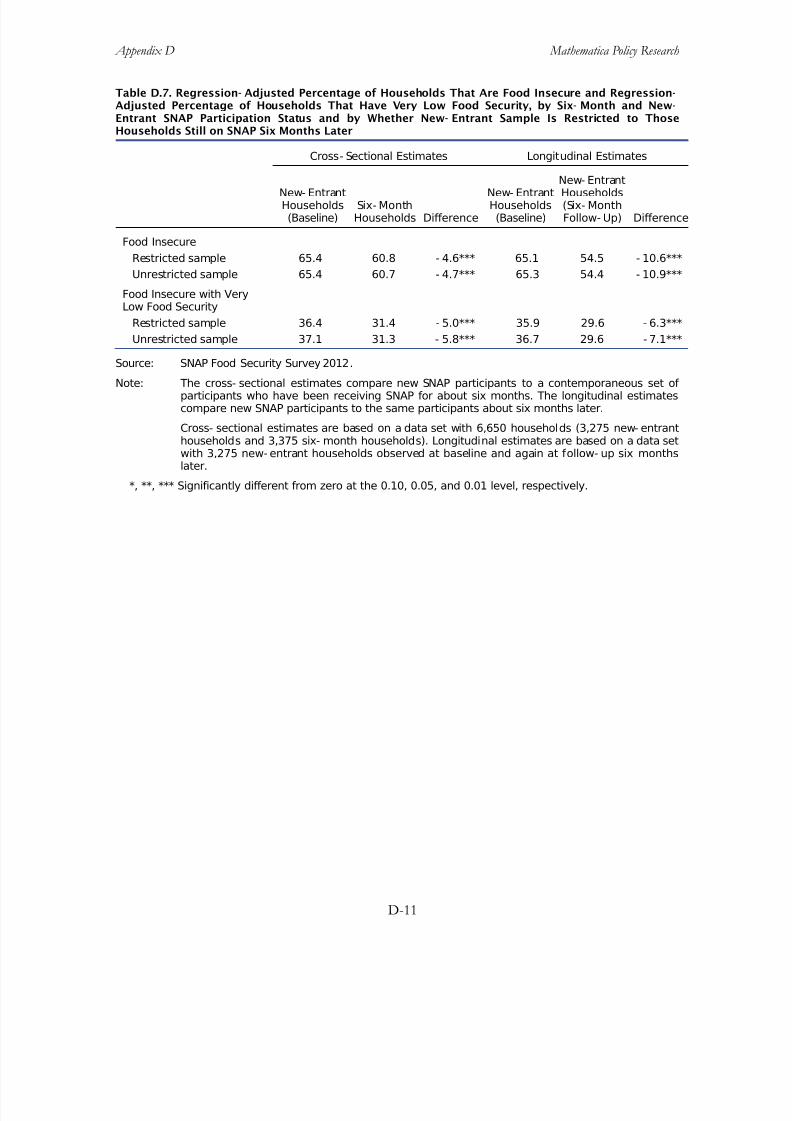
8/22/2019 USDA Report re SNAP & Food Security 08/2013
http://slidepdf.com/reader/full/usda-report-re-snap-food-security-082013 157/355
Appendix D Mathematica Policy Research
D-11
Table D.7. Regression- Adjusted Percentage of Households That Are Food Insecure and Regression-Adjusted Percentage of Households That Have Very Low Food Security, by Six- Month and New-Entrant SNAP Participation Status and by Whether New- Entrant Sample Is Restricted to ThoseHouseholds Still on SNAP Six Months Later
Cross- Sectional Estimates Longitudinal Estimates
New- EntrantHouseholds(Baseline)
Six- MonthHouseholds Difference
New- EntrantHouseholds(Baseline)
New- EntrantHouseholds(Six- MonthFollow- Up) Difference
Food Insecure
Restricted sample 65.4 60.8 - 4.6*** 65.1 54.5 - 10.6***
Unrestricted sample 65.4 60.7 - 4.7*** 65.3 54.4 - 10.9***
Food Insecure with VeryLow Food Security
Restricted sample 36.4 31.4 - 5.0*** 35.9 29.6 - 6.3***
Unrestricted sample 37.1 31.3 - 5.8*** 36.7 29.6 - 7.1***
Source: SNAP Food Security Survey 2012.Note: The cross- sectional estimates compare new SNAP participants to a contemporaneous set of
participants who have been receiving SNAP for about six months. The longitudinal estimatescompare new SNAP participants to the same participants about six months later.
Cross- sectional estimates are based on a data set with 6,650 households (3,275 new- entranthouseholds and 3,375 six- month households). Longitudinal estimates are based on a data setwith 3,275 new- entrant households observed at baseline and again at follow- up six monthslater.
*, **, *** Significantly different from zero at the 0.10, 0.05, and 0.01 level, respectively.

8/22/2019 USDA Report re SNAP & Food Security 08/2013
http://slidepdf.com/reader/full/usda-report-re-snap-food-security-082013 158/355
This page has been left blank for double-sided copying.

8/22/2019 USDA Report re SNAP & Food Security 08/2013
http://slidepdf.com/reader/full/usda-report-re-snap-food-security-082013 159/355
APPENDIX E
ASSOCIATIONS BETWEEN SNAP AND FOOD INSECURITY, BY SUBGROUP

8/22/2019 USDA Report re SNAP & Food Security 08/2013
http://slidepdf.com/reader/full/usda-report-re-snap-food-security-082013 160/355
This page has been left blank for double-sided copying.
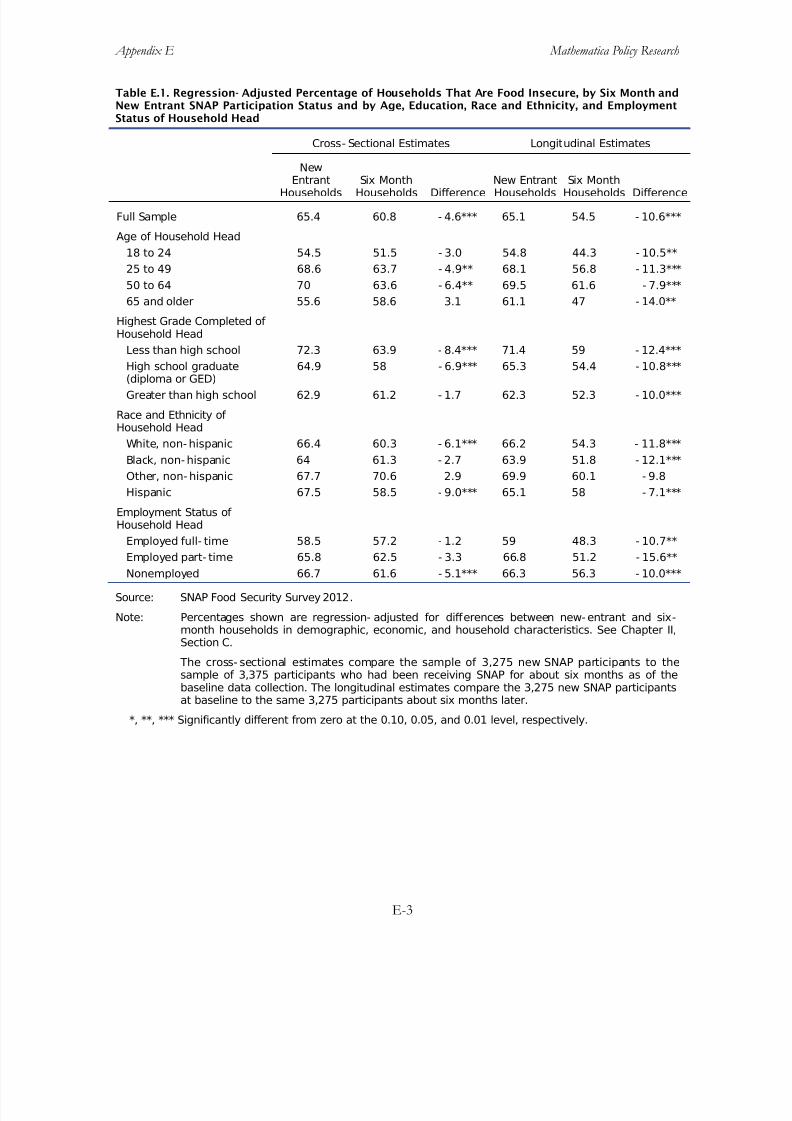
8/22/2019 USDA Report re SNAP & Food Security 08/2013
http://slidepdf.com/reader/full/usda-report-re-snap-food-security-082013 161/355
Appendix E Mathematica Policy Research
E-3
Table E.1. Regression- Adjusted Percentage of Households That Are Food Insecure, by Six Month andNew Entrant SNAP Participation Status and by Age, Education, Race and Ethnicity, and EmploymentStatus of Household Head
Cross- Sectional Estimates Longitudinal Estimates
New
EntrantHouseholds Six MonthHouseholds Difference New EntrantHouseholds Six MonthHouseholds Difference
Full Sample 65.4 60.8 - 4.6*** 65.1 54.5 - 10.6***
Age of Household Head
18 to 24 54.5 51.5 - 3.0 54.8 44.3 - 10.5**
25 to 49 68.6 63.7 - 4.9** 68.1 56.8 - 11.3***
50 to 64 70 63.6 - 6.4** 69.5 61.6 - 7.9***
65 and older 55.6 58.6 3.1 61.1 47 - 14.0**
Highest Grade Completed of Household Head
Less than high school 72.3 63.9 - 8.4*** 71.4 59 - 12.4***
High school graduate(diploma or GED)
64.9 58 - 6.9*** 65.3 54.4 - 10.8***
Greater than high school 62.9 61.2 - 1.7 62.3 52.3 - 10.0***
Race and Ethnicity of Household Head
White, non- hispanic 66.4 60.3 - 6.1*** 66.2 54.3 - 11.8***
Black, non- hispanic 64 61.3 - 2.7 63.9 51.8 - 12.1***
Other, non- hispanic 67.7 70.6 2.9 69.9 60.1 - 9.8
Hispanic 67.5 58.5 - 9.0*** 65.1 58 - 7.1***
Employment Status of Household Head
Employed full- time 58.5 57.2 - 1.2 59 48.3 - 10.7**
Employed part- time 65.8 62.5 - 3.3 66.8 51.2 - 15.6**
Nonemployed 66.7 61.6 - 5.1*** 66.3 56.3 - 10.0***
Source: SNAP Food Security Survey 2012.
Note: Percentages shown are regression- adjusted for differences between new- entrant and six-month households in demographic, economic, and household characteristics. See Chapter II,Section C.
The cross- sectional estimates compare the sample of 3,275 new SNAP participants to thesample of 3,375 participants who had been receiving SNAP for about six months as of thebaseline data collection. The longitudinal estimates compare the 3,275 new SNAP participantsat baseline to the same 3,275 participants about six months later.
*, **, *** Significantly different from zero at the 0.10, 0.05, and 0.01 level, respectively.

8/22/2019 USDA Report re SNAP & Food Security 08/2013
http://slidepdf.com/reader/full/usda-report-re-snap-food-security-082013 162/355
Appendix E Mathematica Policy Research
E-4
Table E.2. Regression- Adjusted Percentage of Households That Are Food Insecure, by Six Month andNew Entrant SNAP Participation Status and by Household Composition and Region of Residence
Cross- Sectional Estimates Longitudinal Estimates
New EntrantHouseholds
Six MonthHouseholds Difference
New EntrantHouseholds
Six MonthHouseholds Difference
Full Sample 65.4 60.8 - 4.6*** 65.1 54.5 - 10.6***
Households with Children 61.1 56 - 5.2*** 59.6 49.3 - 10.3***
Single- adult householdswith children
60.3 54.5 - 5.9 59.5 48.3 - 11.2***
Multiple- adult householdswith children
62.5 57.7 - 4.8 60.3 50.1 - 10.1***
Households withoutChildren
68.6 64.9 - 3.7** 68.8 58.5 - 10.3***
Households with Elderly 56.5 59.1 2.5 56 47.7 - 8.3*
Households without Elderly 66.6 61.1 - 5.6*** 66.3 55.5 - 10.8***
Households with a DisabledMember
73.4 67.1 - 6.3** 74.2 62.9 - 11.3***
Households without aDisabled Member
61.4 57.8 - 3.7* 61.2 51.2 - 10.0***
Region of Residence
Northeast 62.4 54.1 - 8.3** 64.6 49.2 - 15.4***
Midatlantic 62.2 60.7 - 1.5 62.1 56.7 - 5.3***
Southeast 62.7 62.8 0.1 62.6 51.5 - 11.1***
South 71.2 66.4 - 4.8 70.8 57.7 - 13.1***
Mountain 70.5 60.8 - 9.7* 73.1 56.4 - 16.7***
Midwest 65.9 61.7 - 4.2** 66.5 57.7 - 8.7***
West 67.8 62 - 5.7** 66.4 57 - 9.5***
Source: SNAP Food Security Survey 2012.
Note: Percentages shown are regression- adjusted for differences between new- entrant and six-month households in demographic, economic, and household characteristics. See Chapter II,Section C.
The cross- sectional estimates compare the sample of 3,275 new SNAP participants to thesample of 3,375 participants who had been receiving SNAP for about six months as of thebaseline data collection. The longitudinal estimates compare the 3,275 new SNAP participantsat baseline to the same 3,275 participants about six months later.

8/22/2019 USDA Report re SNAP & Food Security 08/2013
http://slidepdf.com/reader/full/usda-report-re-snap-food-security-082013 163/355
Appendix E Mathematica Policy Research
E-5
Table E.3. Regression- Adjusted Percentage of Households That are Food Insecure, by Six Month and NewEntrant SNAP Participation Status and by Household Income and Sources of Household Income
Cross- Sectional Estimates Longitudinal Estimates
New EntrantHouseholds
Six MonthHouseholds Difference
New EntrantHouseholds
Six MonthHouseholds Difference
Full Sample 65.4 60.8 - 4.6*** 65.1 54.5 - 10.6***
Monthly Income as a Percentageof Poverty
No Income 58.7 62.2 3.5 59.5 53.9 - 5.6
1%to 50% 69.7 62.1 - 7.6*** 68.2 54.6 - 13.6***
51%to 100% 68.3 63 - 5.3** 68.6 60.5 - 8.1***
101%to 130% 68.3 62.3 - 6 68.5 51.7 - 16.9***
More than 130% 62.5 55.4 - 7.1 61.4 48.4 - 13.0***
Household Receives TANFIncome
Yes 77.3 45.5 - 31.8*** 75.8 53 - 22.8***
No 65.2 61.4 - 3.9*** 64.9 54.7 - 10.2***
Household Receives SSI or
Supplemental Security Income Yes 74.7 68.3 - 6.4 73.9 61.2 - 12.7**
No 64.6 60 - 4.7*** 64.3 53.8 - 10.5***
Household Receives SocialSecurity income
Yes 64.6 61.3 - 3.3 65.2 56.4 - 8.7***
No 65.7 60.8 - 4.9*** 65.3 54.2 - 11.1***
Household Receives RetirementBenefits Such as a Governmentor Private Pension or Annuity
Yes 42.4 57.3 14.9* 38.6 54 15.5
No 65.7 60.9 - 4.7*** 65.6 54.3 - 11.3***
Household Receives
Unemployment Insurance orWorker's Compensation Benefits
Yes 70.8 66.4 - 4.4 72.9 60.5 - 12.4**
No 64.7 60.4 - 4.3*** 64.5 53.9 - 10.6***
Household Receives Veteran’sBenefits
Yes 78.2 87.7 9.5 82.5 80.3 - 2.2
No 65.4 60.6 - 4.8*** 65.1 54.5 - 10.6***
Household Receives ChildSupport Payments
Yes 68.3 51.2 - 17.1*** 67.5 49.7 - 17.8***
No 65.4 61.4 - 4.0*** 65.2 54.8 - 10.3***
Household Receives Financial
Support from Friends or Family Yes 74.3 69 - 5.3** 73.6 66.8 - 6.8***
No 62.2 58.1 - 4.1** 62.1 50.9 - 11.2***
Source: SNAP Food Security Survey 2012.
Note: Percentages shown are regression- adjusted for differences between new-entrant and six- monthhouseholds in demographic, economic, and household characteristics. See Chapter II, Section C.
The cross- sectional estimates compare the sample of 3,275 new SNAP participants to the sample of 3,375 participants who had been receiving SNAP for about six months as of the baseline datacollection. The longitudinal estimates compare the 3,275 new SNAP participants at baseline to thesame 3,275 participants about six months later.
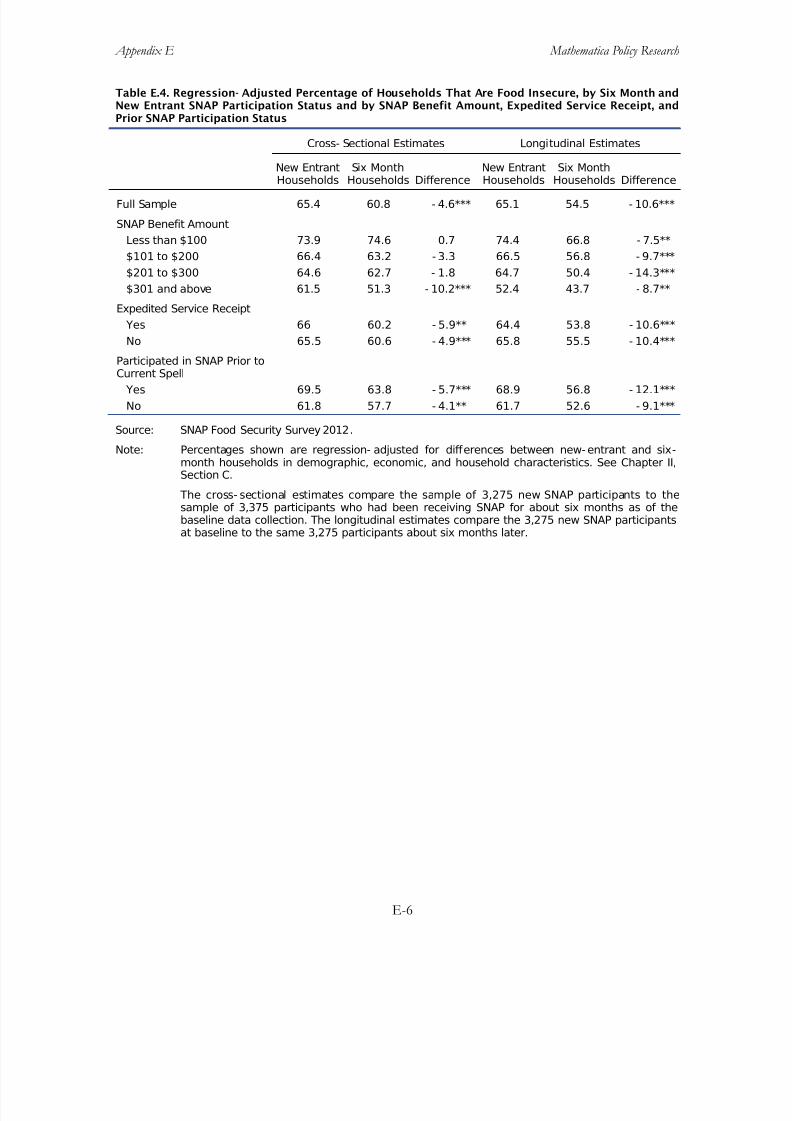
8/22/2019 USDA Report re SNAP & Food Security 08/2013
http://slidepdf.com/reader/full/usda-report-re-snap-food-security-082013 164/355
Appendix E Mathematica Policy Research
E-6
Table E.4. Regression- Adjusted Percentage of Households That Are Food Insecure, by Six Month andNew Entrant SNAP Participation Status and by SNAP Benefit Amount, Expedited Service Receipt, andPrior SNAP Participation Status
Cross- Sectional Estimates Longitudinal Estimates
New Entrant
Households
Six Month
Households Difference
New Entrant
Households
Six Month
Households Difference
Full Sample 65.4 60.8 - 4.6*** 65.1 54.5 - 10.6***
SNAP Benefit Amount
Less than $100 73.9 74.6 0.7 74.4 66.8 - 7.5**
$101 to $200 66.4 63.2 - 3.3 66.5 56.8 - 9.7***
$201 to $300 64.6 62.7 - 1.8 64.7 50.4 - 14.3***
$301 and above 61.5 51.3 - 10.2*** 52.4 43.7 - 8.7**
Expedited Service Receipt
Yes 66 60.2 - 5.9** 64.4 53.8 - 10.6***
No 65.5 60.6 - 4.9*** 65.8 55.5 - 10.4***
Participated in SNAP Prior toCurrent Spell
Yes 69.5 63.8 - 5.7*** 68.9 56.8 - 12.1***
No 61.8 57.7 - 4.1** 61.7 52.6 - 9.1***
Source: SNAP Food Security Survey 2012.
Note: Percentages shown are regression- adjusted for differences between new- entrant and six-month households in demographic, economic, and household characteristics. See Chapter II,Section C.
The cross- sectional estimates compare the sample of 3,275 new SNAP participants to thesample of 3,375 participants who had been receiving SNAP for about six months as of thebaseline data collection. The longitudinal estimates compare the 3,275 new SNAP participantsat baseline to the same 3,275 participants about six months later.
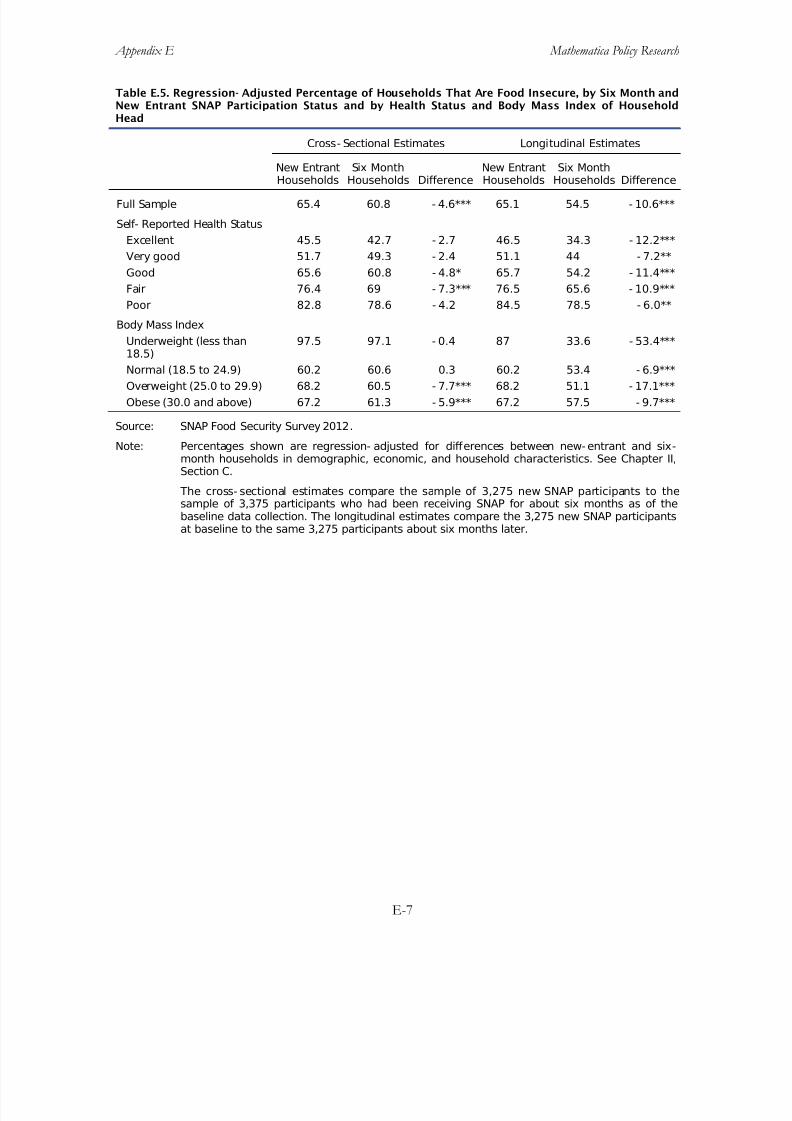
8/22/2019 USDA Report re SNAP & Food Security 08/2013
http://slidepdf.com/reader/full/usda-report-re-snap-food-security-082013 165/355
Appendix E Mathematica Policy Research
E-7
Table E.5. Regression- Adjusted Percentage of Households That Are Food Insecure, by Six Month andNew Entrant SNAP Participation Status and by Health Status and Body Mass Index of HouseholdHead
Cross- Sectional Estimates Longitudinal Estimates
New Entrant
Households
Six Month
Households Difference
New Entrant
Households
Six Month
Households Difference
Full Sample 65.4 60.8 - 4.6*** 65.1 54.5 - 10.6***
Self- Reported Health Status
Excellent 45.5 42.7 - 2.7 46.5 34.3 - 12.2***
Very good 51.7 49.3 - 2.4 51.1 44 - 7.2**
Good 65.6 60.8 - 4.8* 65.7 54.2 - 11.4***
Fair 76.4 69 - 7.3*** 76.5 65.6 - 10.9***
Poor 82.8 78.6 - 4.2 84.5 78.5 - 6.0**
Body Mass Index
Underweight (less than18.5)
97.5 97.1 - 0.4 87 33.6 - 53.4***
Normal (18.5 to 24.9) 60.2 60.6 0.3 60.2 53.4 - 6.9***
Overweight (25.0 to 29.9) 68.2 60.5 - 7.7*** 68.2 51.1 - 17.1***
Obese (30.0 and above) 67.2 61.3 - 5.9*** 67.2 57.5 - 9.7***
Source: SNAP Food Security Survey 2012.
Note: Percentages shown are regression- adjusted for differences between new- entrant and six-month households in demographic, economic, and household characteristics. See Chapter II,Section C.
The cross- sectional estimates compare the sample of 3,275 new SNAP participants to thesample of 3,375 participants who had been receiving SNAP for about six months as of thebaseline data collection. The longitudinal estimates compare the 3,275 new SNAP participantsat baseline to the same 3,275 participants about six months later.
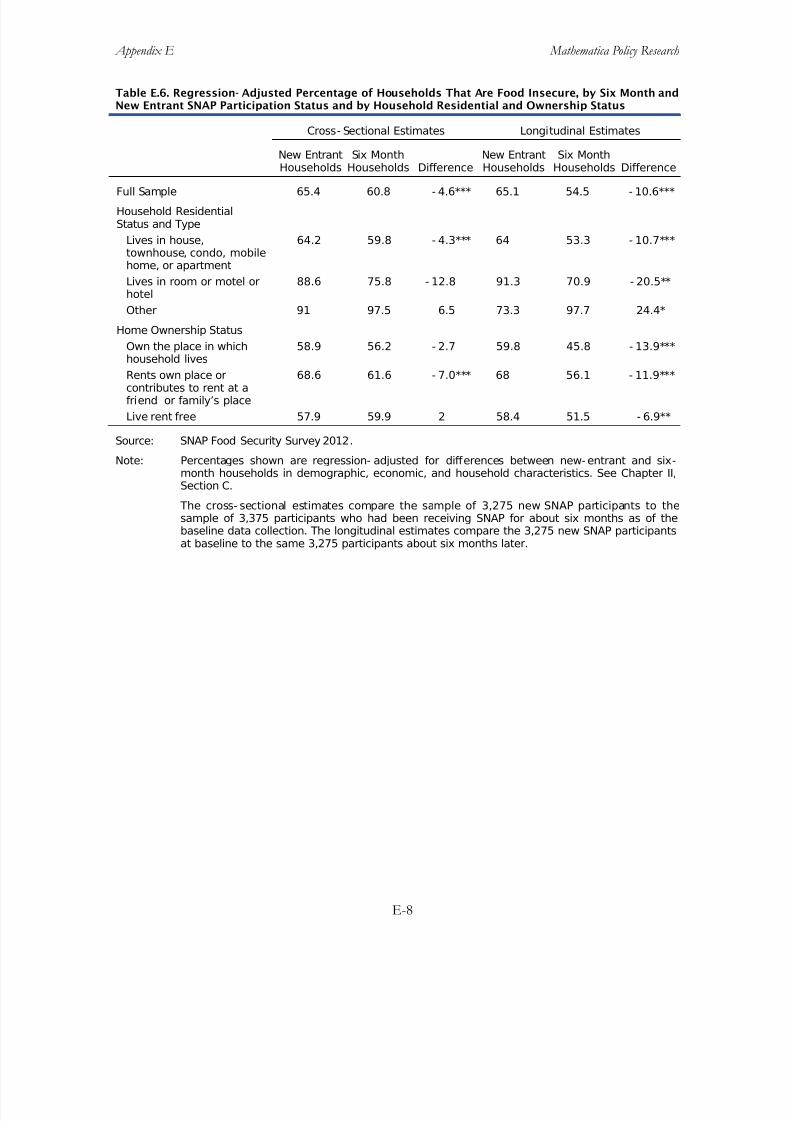
8/22/2019 USDA Report re SNAP & Food Security 08/2013
http://slidepdf.com/reader/full/usda-report-re-snap-food-security-082013 166/355
Appendix E Mathematica Policy Research
E-8
Table E.6. Regression- Adjusted Percentage of Households That Are Food Insecure, by Six Month andNew Entrant SNAP Participation Status and by Household Residential and Ownership Status
Cross- Sectional Estimates Longitudinal Estimates
New EntrantHouseholds
Six MonthHouseholds Difference
New EntrantHouseholds
Six MonthHouseholds Difference
Full Sample 65.4 60.8 - 4.6*** 65.1 54.5 - 10.6***
Household ResidentialStatus and Type
Lives in house,townhouse, condo, mobilehome, or apartment
64.2 59.8 - 4.3*** 64 53.3 - 10.7***
Lives in room or motel orhotel
88.6 75.8 - 12.8 91.3 70.9 - 20.5**
Other 91 97.5 6.5 73.3 97.7 24.4*
Home Ownership Status
Own the place in whichhousehold lives
58.9 56.2 - 2.7 59.8 45.8 - 13.9***
Rents own place orcontributes to rent at afriend or family’s place
68.6 61.6 - 7.0*** 68 56.1 - 11.9***
Live rent free 57.9 59.9 2 58.4 51.5 - 6.9**
Source: SNAP Food Security Survey 2012.
Note: Percentages shown are regression- adjusted for differences between new- entrant and six-month households in demographic, economic, and household characteristics. See Chapter II,Section C.
The cross- sectional estimates compare the sample of 3,275 new SNAP participants to thesample of 3,375 participants who had been receiving SNAP for about six months as of thebaseline data collection. The longitudinal estimates compare the 3,275 new SNAP participantsat baseline to the same 3,275 participants about six months later.
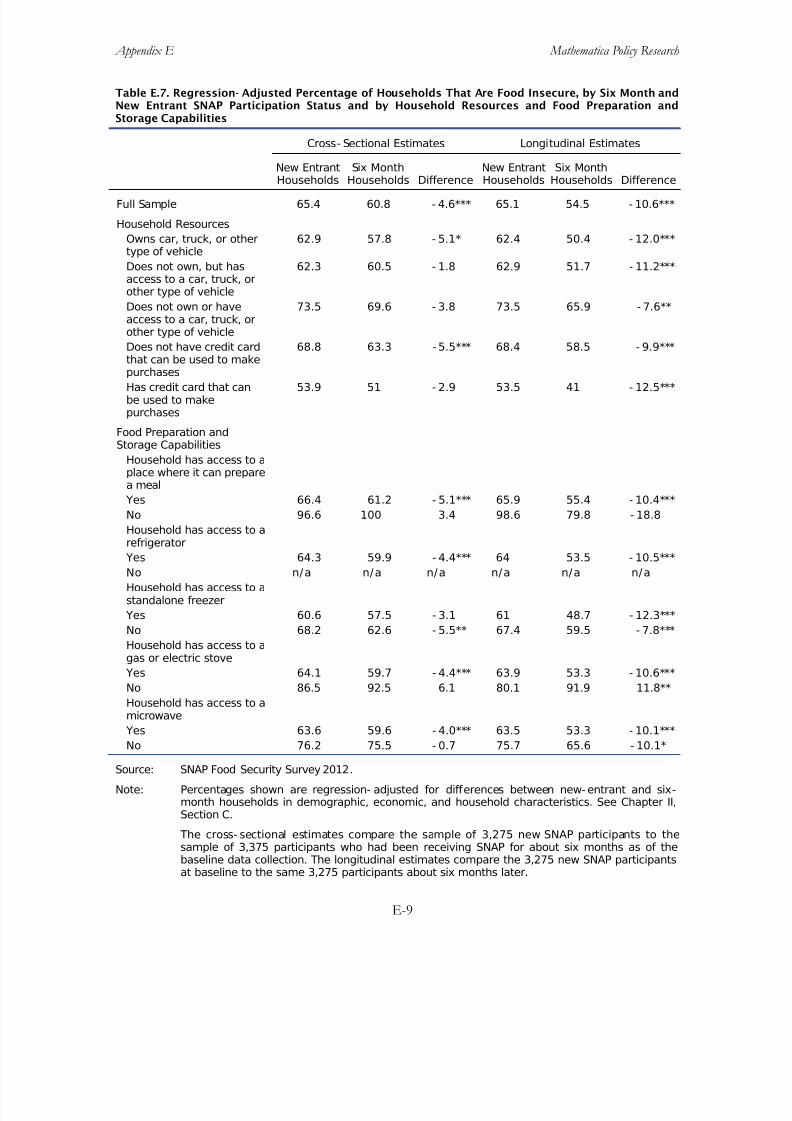
8/22/2019 USDA Report re SNAP & Food Security 08/2013
http://slidepdf.com/reader/full/usda-report-re-snap-food-security-082013 167/355
Appendix E Mathematica Policy Research
E-9
Table E.7. Regression- Adjusted Percentage of Households That Are Food Insecure, by Six Month andNew Entrant SNAP Participation Status and by Household Resources and Food Preparation andStorage Capabilities
Cross- Sectional Estimates Longitudinal Estimates
New Entrant
Households
Six Month
Households Difference
New Entrant
Households
Six Month
Households Difference
Full Sample 65.4 60.8 - 4.6*** 65.1 54.5 - 10.6***
Household Resources
Owns car, truck, or othertype of vehicle
62.9 57.8 - 5.1* 62.4 50.4 - 12.0***
Does not own, but hasaccess to a car, truck, orother type of vehicle
62.3 60.5 - 1.8 62.9 51.7 - 11.2***
Does not own or haveaccess to a car, truck, orother type of vehicle
73.5 69.6 - 3.8 73.5 65.9 - 7.6**
Does not have credit cardthat can be used to makepurchases
68.8 63.3 - 5.5*** 68.4 58.5 - 9.9***
Has credit card that canbe used to makepurchases
53.9 51 - 2.9 53.5 41 - 12.5***
Food Preparation andStorage Capabilities
Household has access to aplace where it can preparea meal
Yes 66.4 61.2 - 5.1*** 65.9 55.4 - 10.4***
No 96.6 100 3.4 98.6 79.8 - 18.8
Household has access to arefrigerator
Yes 64.3 59.9 - 4.4*** 64 53.5 - 10.5***
No n/a n/a n/a n/a n/a n/a
Household has access to astandalone freezer
Yes 60.6 57.5 - 3.1 61 48.7 - 12.3***
No 68.2 62.6 - 5.5** 67.4 59.5 - 7.8***
Household has access to agas or electric stove
Yes 64.1 59.7 - 4.4*** 63.9 53.3 - 10.6***
No 86.5 92.5 6.1 80.1 91.9 11.8**
Household has access to amicrowave
Yes 63.6 59.6 - 4.0*** 63.5 53.3 - 10.1***No 76.2 75.5 - 0.7 75.7 65.6 - 10.1*
Source: SNAP Food Security Survey 2012.
Note: Percentages shown are regression- adjusted for differences between new- entrant and six-month households in demographic, economic, and household characteristics. See Chapter II,Section C.
The cross- sectional estimates compare the sample of 3,275 new SNAP participants to thesample of 3,375 participants who had been receiving SNAP for about six months as of thebaseline data collection. The longitudinal estimates compare the 3,275 new SNAP participantsat baseline to the same 3,275 participants about six months later.

8/22/2019 USDA Report re SNAP & Food Security 08/2013
http://slidepdf.com/reader/full/usda-report-re-snap-food-security-082013 168/355
Appendix E Mathematica Policy Research
E-10
Table E.8. Regression- Adjusted Percentage of Households That are Food Insecure, by Six Month and NewEntrant SNAP Participation Status and by Participation in Nutrition and Community Food Programs
Cross- Sectional Estimates Longitudinal Estimates
New EntrantHouseholds
Six MonthHouseholds Difference
New EntrantHouseholds
Six MonthHouseholds Difference
Full Sample 65.4 60.8 - 4.6*** 65.1 54.5 - 10.6***
Children in Household ReceiveFree or Reduced- Cost Lunches atSchool
Yes 67.3 61.1 - 6.3** 67.5 53.6 - 13.9***
No 63.1 59.1 - 4 60.9 48.5 - 12.4**
Children in Household ReceiveFree or Reduced- Cost Breakfastsat School
Yes 68.4 61.2 - 7.2** 68.6 54.2 - 14.4***
No 63.3 60.2 - 3.1 61.1 49.4 - 11.7***
Children in Household ReceiveFree or Reduced-Cost Food at a
Day- Care or Head Start Program Yes 61.6 36.4 - 25.2** 67.2 43.5 - 23.7**
No 56.2 51.5 - 4.7 53.1 42.8 - 10.3***
Women or Children in theHousehold Receive Food Through the WIC Program
Yes 60.6 49.4 - 11.3*** 58.6 45.8 - 12.8***
No 64.3 63.7 - 0.6 64.2 54.5 - 9.7***
Household Received EmergencyFood from a Church, FoodPantry, Or Food Bank
Yes 83.4 77.7 - 5.7** 83.3 80.0 - 3.2
No 59.9 56.7 - 3.2* 59.8 49.0 - 10.8***
Household Attended CommunityProgram or Senior Center to EatPrepared Meals
Yes 92.6 82.9 - 9.7** 95.5 93.6 - 1.8
No 64.3 60 - 4.3*** 64.1 53.2 - 10.8***
Household at Meals at a SoupKitchen or Shelter
Yes 91.8 87.1 - 4.6 90.2 97.8 7.6*
No 64.3 59.9 - 4.4*** 64.1 53.2 - 10.9***
Household Received Meals from“Meals on Wheels” or Any OtherHome- Delivered Meal Program
Yes 66.3 82.4 16.1 n/ a n/ a n/ a
No 65.2 60.5 - 4.7*** 65.0 54.3 - 10.6***
Source: SNAP Food Security Survey 2012.
Note: Percentages shown are regression- adjusted for differences between new-entrant and six- monthhouseholds in demographic, economic, and household characteristics. See Chapter II, Section C.
The cross- sectional estimates compare the sample of 3,275 new SNAP participants to the sample of 3,375 participants who had been receiving SNAP for about six months as of the baseline datacollection. The longitudinal estimates compare the 3,275 new SNAP participants at baseline to thesame 3,275 participants about six months later.
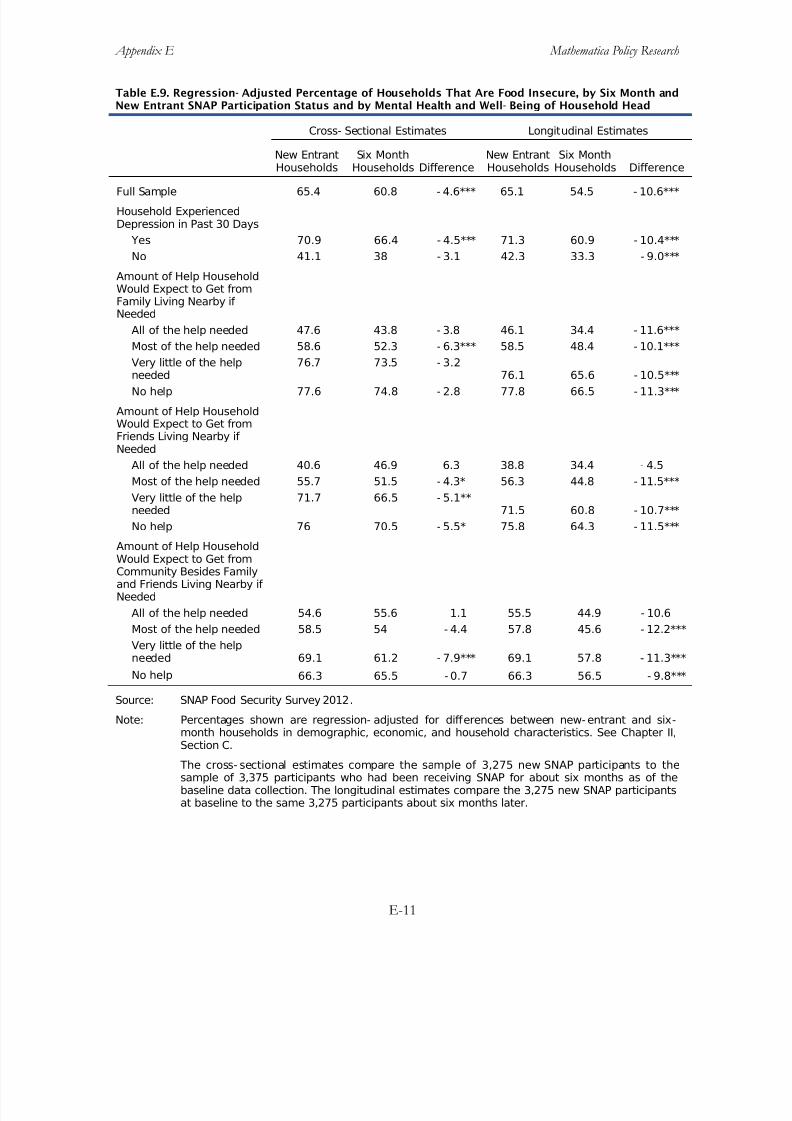
8/22/2019 USDA Report re SNAP & Food Security 08/2013
http://slidepdf.com/reader/full/usda-report-re-snap-food-security-082013 169/355
Appendix E Mathematica Policy Research
E-11
Table E.9. Regression- Adjusted Percentage of Households That Are Food Insecure, by Six Month andNew Entrant SNAP Participation Status and by Mental Health and Well- Being of Household Head
Cross- Sectional Estimates Longitudinal Estimates
New EntrantHouseholds
Six MonthHouseholds Difference
New EntrantHouseholds
Six MonthHouseholds Difference
Full Sample 65.4 60.8 - 4.6*** 65.1 54.5 - 10.6***
Household ExperiencedDepression in Past 30 Days
Yes 70.9 66.4 - 4.5*** 71.3 60.9 - 10.4***
No 41.1 38 - 3.1 42.3 33.3 - 9.0***
Amount of Help HouseholdWould Expect to Get fromFamily Living Nearby if Needed
All of the help needed 47.6 43.8 - 3.8 46.1 34.4 - 11.6***
Most of the help needed 58.6 52.3 - 6.3*** 58.5 48.4 - 10.1***
Very little of the helpneeded 76.7 73.5 - 3.2 76.1 65.6 - 10.5***
No help 77.6 74.8 - 2.8 77.8 66.5 - 11.3***
Amount of Help HouseholdWould Expect to Get fromFriends Living Nearby if Needed
All of the help needed 40.6 46.9 6.3 38.8 34.4 - 4.5
Most of the help needed 55.7 51.5 - 4.3* 56.3 44.8 - 11.5***
Very little of the helpneeded
71.7 66.5 - 5.1**71.5 60.8 - 10.7***
No help 76 70.5 - 5.5* 75.8 64.3 - 11.5***
Amount of Help HouseholdWould Expect to Get fromCommunity Besides Familyand Friends Living Nearby if Needed
All of the help needed 54.6 55.6 1.1 55.5 44.9 - 10.6
Most of the help needed 58.5 54 - 4.4 57.8 45.6 - 12.2***
Very little of the helpneeded 69.1 61.2 - 7.9*** 69.1 57.8 - 11.3***
No help 66.3 65.5 - 0.7 66.3 56.5 - 9.8***
Source: SNAP Food Security Survey 2012.
Note: Percentages shown are regression- adjusted for differences between new- entrant and six-
month households in demographic, economic, and household characteristics. See Chapter II,Section C.
The cross- sectional estimates compare the sample of 3,275 new SNAP participants to thesample of 3,375 participants who had been receiving SNAP for about six months as of thebaseline data collection. The longitudinal estimates compare the 3,275 new SNAP participantsat baseline to the same 3,275 participants about six months later.

8/22/2019 USDA Report re SNAP & Food Security 08/2013
http://slidepdf.com/reader/full/usda-report-re-snap-food-security-082013 170/355
Appendix E Mathematica Policy Research
E-12
Table E.10. Regression- Adjusted Percentage of Households That Have Very Low Food Security, bySix Month and New Entrant SNAP Participation Status and by Age, Education, Race and Ethnicity, andEmployment Status of Household Head
Cross- Sectional Estimates Longitudinal Estimates
New Entrant
Households
Six Month
Households Difference
New Entrant
Households
Six Month
Households Difference
Full Sample 36.4 31.4 - 5.0*** 35.9 29.6 -6.3***
Age of Household Head
18 to 24 28.4 24.8 - 3.6 28.6 20.5 - 8.1***
25 to 49 39.3 33.3 - 6.0*** 38.1 31.8 - 6.4***
50 to 64 42.2 34.3 - 7.9*** 42 36.6 - 5.4*
65 and older 18.6 20 1.4 18.7 15.9 - 2.8
Highest Grade Completed of Household Head
Less than high school 34.4 28.6 - 5.8** 33.5 27.9 - 5.6**
High school graduate
(diploma or GED)
36 29.2 - 6.8*** 35.9 30.2 - 5.7***
Greater than high school 37 33.4 - 3.5 36.2 28.8 - 7.3***
Race and Ethnicity of Household Head
White, non- hispanic 38.1 33.2 - 4.9*** 37.7 32.6 - 5.1***
Black, non- hispanic 39.1 33.8 -5.3* 39 28.7 - 10.3***
Other, non- hispanic 38.4 39.8 1.4 39.6 34 - 5.6
Hispanic 29.8 22.3 - 7.5** 27.4 22.1 - 5.3**
Employment Status of Household Head
Employed full- time 31.8 26.9 - 4.9 31.3 22.3 - 9.0**
Employed part- time 30.9 30.5 - 0.4 31 24.6 - 6.4
Nonemployed 37.7 32 - 5.7*** 37.1 31.4 - 5.7***
Source: SNAP Food Security Survey 2012.
Note: Percentages shown are regression- adjusted for differences between new- entrant and six-month households in demographic, economic, and household characteristics. See Chapter II,Section C.
The cross- sectional estimates compare the sample of 3,275 new SNAP participants to thesample of 3,375 participants who had been receiving SNAP for about six months as of thebaseline data collection. The longitudinal estimates compare the 3,275 new SNAP participantsat baseline to the same 3,275 participants about six months later.
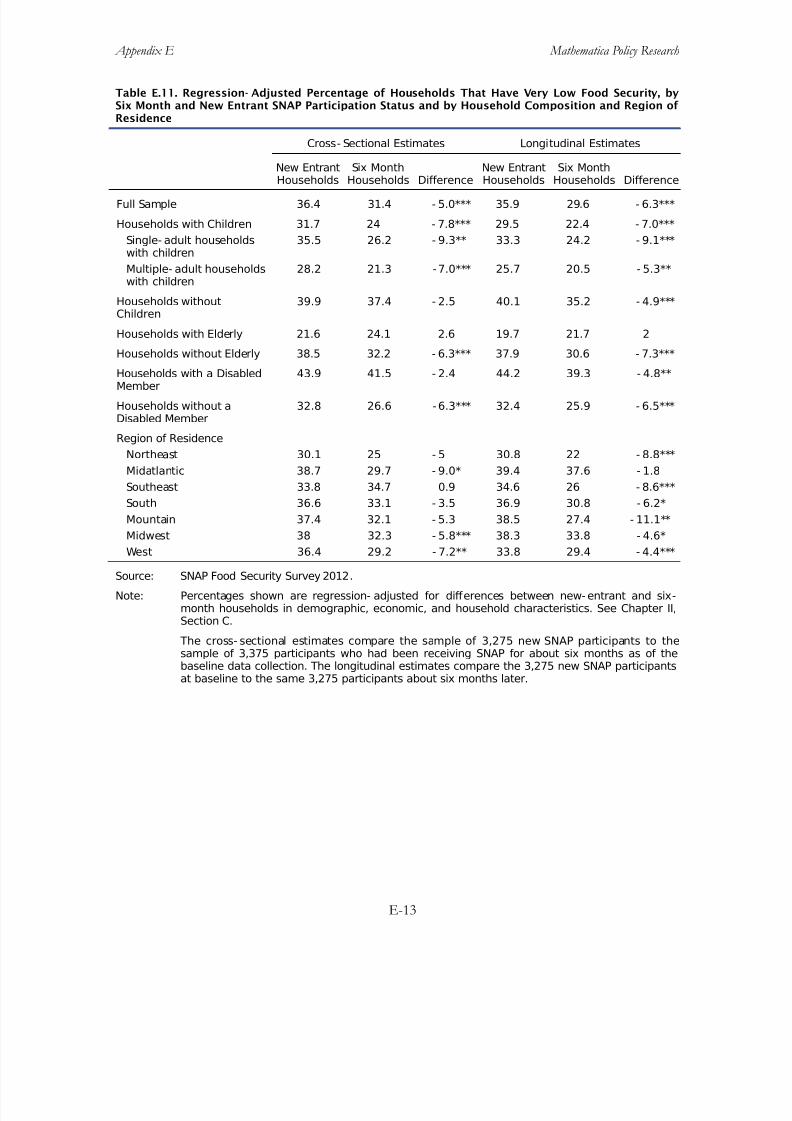
8/22/2019 USDA Report re SNAP & Food Security 08/2013
http://slidepdf.com/reader/full/usda-report-re-snap-food-security-082013 171/355
Appendix E Mathematica Policy Research
E-13
Table E.11. Regression- Adjusted Percentage of Households That Have Very Low Food Security, bySix Month and New Entrant SNAP Participation Status and by Household Composition and Region of Residence
Cross- Sectional Estimates Longitudinal Estimates
New Entrant
Households
Six Month
Households Difference
New Entrant
Households
Six Month
Households Difference
Full Sample 36.4 31.4 - 5.0*** 35.9 29.6 - 6.3***
Households with Children 31.7 24 - 7.8*** 29.5 22.4 - 7.0***
Single- adult householdswith children
35.5 26.2 - 9.3** 33.3 24.2 - 9.1***
Multiple- adult householdswith children
28.2 21.3 -7.0*** 25.7 20.5 - 5.3**
Households withoutChildren
39.9 37.4 - 2.5 40.1 35.2 - 4.9***
Households with Elderly 21.6 24.1 2.6 19.7 21.7 2
Households without Elderly 38.5 32.2 - 6.3*** 37.9 30.6 - 7.3***
Households with a DisabledMember
43.9 41.5 - 2.4 44.2 39.3 - 4.8**
Households without aDisabled Member
32.8 26.6 -6.3*** 32.4 25.9 - 6.5***
Region of Residence
Northeast 30.1 25 - 5 30.8 22 - 8.8***
Midatlantic 38.7 29.7 - 9.0* 39.4 37.6 - 1.8
Southeast 33.8 34.7 0.9 34.6 26 - 8.6***
South 36.6 33.1 - 3.5 36.9 30.8 - 6.2*
Mountain 37.4 32.1 - 5.3 38.5 27.4 - 11.1**
Midwest 38 32.3 - 5.8*** 38.3 33.8 - 4.6*
West 36.4 29.2 - 7.2** 33.8 29.4 - 4.4***
Source: SNAP Food Security Survey 2012.
Note: Percentages shown are regression- adjusted for differences between new- entrant and six-month households in demographic, economic, and household characteristics. See Chapter II,Section C.
The cross- sectional estimates compare the sample of 3,275 new SNAP participants to thesample of 3,375 participants who had been receiving SNAP for about six months as of thebaseline data collection. The longitudinal estimates compare the 3,275 new SNAP participantsat baseline to the same 3,275 participants about six months later.
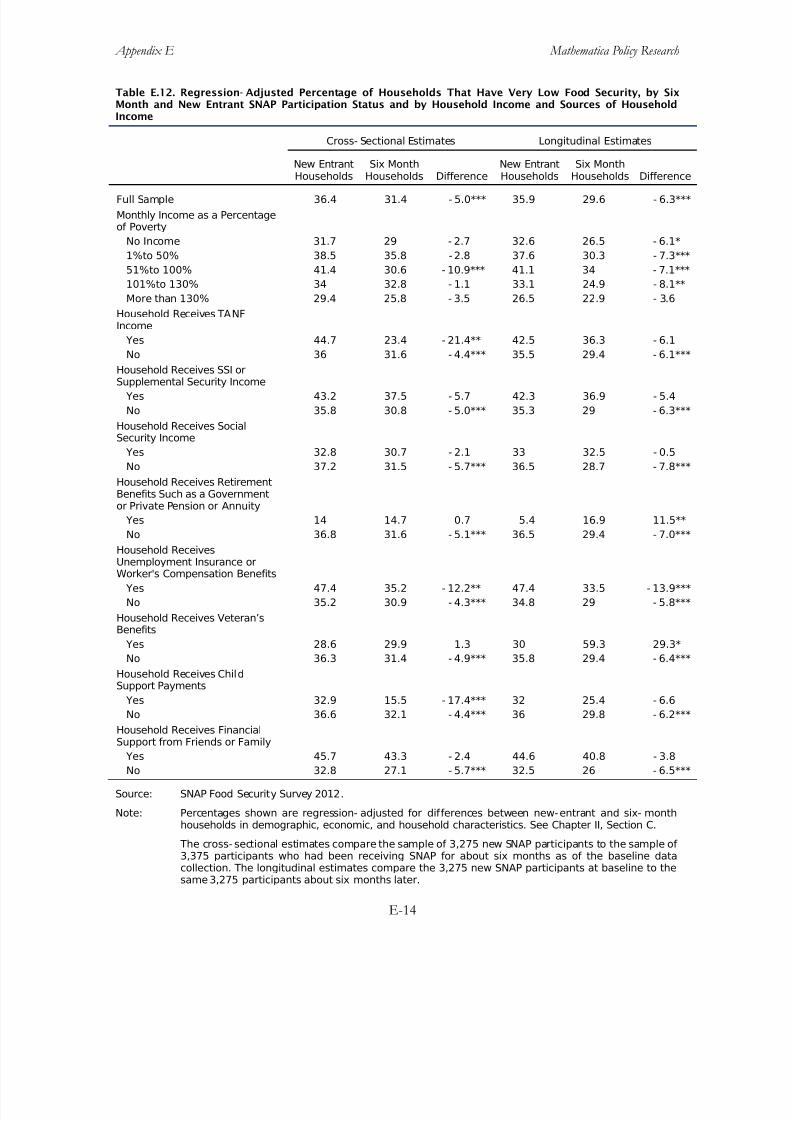
8/22/2019 USDA Report re SNAP & Food Security 08/2013
http://slidepdf.com/reader/full/usda-report-re-snap-food-security-082013 172/355
Appendix E Mathematica Policy Research
E-14
Table E.12. Regression- Adjusted Percentage of Households That Have Very Low Food Security, by SixMonth and New Entrant SNAP Participation Status and by Household Income and Sources of HouseholdIncome
Cross- Sectional Estimates Longitudinal Estimates
New EntrantHouseholds
Six MonthHouseholds Difference
New EntrantHouseholds
Six MonthHouseholds Difference
Full Sample 36.4 31.4 - 5.0*** 35.9 29.6 - 6.3***
Monthly Income as a Percentageof Poverty
No Income 31.7 29 - 2.7 32.6 26.5 - 6.1*
1%to 50% 38.5 35.8 - 2.8 37.6 30.3 - 7.3***
51%to 100% 41.4 30.6 - 10.9*** 41.1 34 - 7.1***
101%to 130% 34 32.8 - 1.1 33.1 24.9 - 8.1**
More than 130% 29.4 25.8 - 3.5 26.5 22.9 - 3.6
Household Receives TANFIncome
Yes 44.7 23.4 - 21.4** 42.5 36.3 - 6.1
No 36 31.6 - 4.4*** 35.5 29.4 - 6.1***
Household Receives SSI orSupplemental Security Income
Yes 43.2 37.5 - 5.7 42.3 36.9 - 5.4
No 35.8 30.8 - 5.0*** 35.3 29 - 6.3***
Household Receives SocialSecurity Income
Yes 32.8 30.7 - 2.1 33 32.5 - 0.5
No 37.2 31.5 - 5.7*** 36.5 28.7 - 7.8***
Household Receives RetirementBenefits Such as a Governmentor Private Pension or Annuity
Yes 14 14.7 0.7 5.4 16.9 11.5**
No 36.8 31.6 - 5.1*** 36.5 29.4 - 7.0***
Household ReceivesUnemployment Insurance orWorker's Compensation Benefits
Yes 47.4 35.2 - 12.2** 47.4 33.5 - 13.9***
No 35.2 30.9 - 4.3*** 34.8 29 - 5.8***
Household Receives Veteran’sBenefits
Yes 28.6 29.9 1.3 30 59.3 29.3*
No 36.3 31.4 - 4.9*** 35.8 29.4 - 6.4***
Household Receives ChildSupport Payments
Yes 32.9 15.5 - 17.4*** 32 25.4 - 6.6
No 36.6 32.1 - 4.4*** 36 29.8 - 6.2***
Household Receives FinancialSupport from Friends or Family
Yes 45.7 43.3 - 2.4 44.6 40.8 - 3.8
No 32.8 27.1 - 5.7*** 32.5 26 - 6.5***
Source: SNAP Food Security Survey 2012.
Note: Percentages shown are regression- adjusted for differences between new-entrant and six- monthhouseholds in demographic, economic, and household characteristics. See Chapter II, Section C.
The cross- sectional estimates compare the sample of 3,275 new SNAP participants to the sample of 3,375 participants who had been receiving SNAP for about six months as of the baseline datacollection. The longitudinal estimates compare the 3,275 new SNAP participants at baseline to thesame 3,275 participants about six months later.
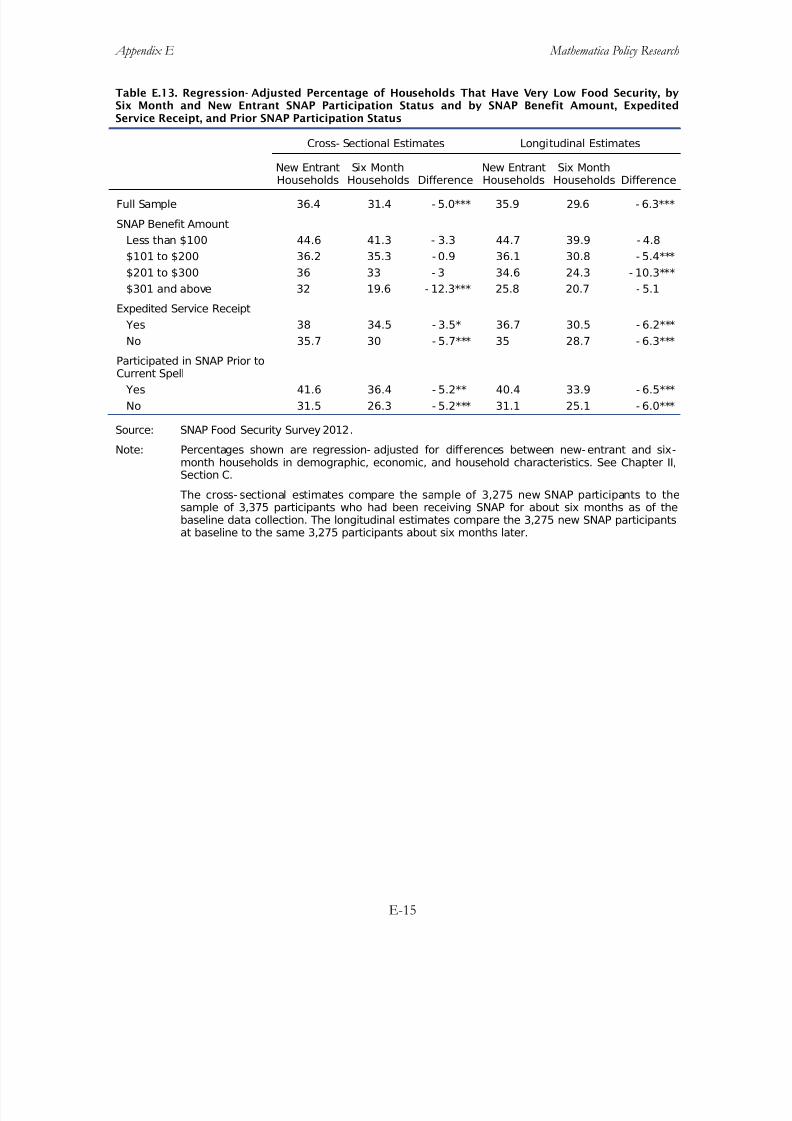
8/22/2019 USDA Report re SNAP & Food Security 08/2013
http://slidepdf.com/reader/full/usda-report-re-snap-food-security-082013 173/355
Appendix E Mathematica Policy Research
E-15
Table E.13. Regression- Adjusted Percentage of Households That Have Very Low Food Security, bySix Month and New Entrant SNAP Participation Status and by SNAP Benefit Amount, ExpeditedService Receipt, and Prior SNAP Participation Status
Cross- Sectional Estimates Longitudinal Estimates
New Entrant
Households
Six Month
Households Difference
New Entrant
Households
Six Month
Households Difference
Full Sample 36.4 31.4 - 5.0*** 35.9 29.6 - 6.3***
SNAP Benefit Amount
Less than $100 44.6 41.3 - 3.3 44.7 39.9 - 4.8
$101 to $200 36.2 35.3 - 0.9 36.1 30.8 - 5.4***
$201 to $300 36 33 - 3 34.6 24.3 - 10.3***
$301 and above 32 19.6 - 12.3*** 25.8 20.7 - 5.1
Expedited Service Receipt
Yes 38 34.5 - 3.5* 36.7 30.5 - 6.2***
No 35.7 30 - 5.7*** 35 28.7 - 6.3***
Participated in SNAP Prior toCurrent Spell
Yes 41.6 36.4 - 5.2** 40.4 33.9 - 6.5***
No 31.5 26.3 - 5.2*** 31.1 25.1 - 6.0***
Source: SNAP Food Security Survey 2012.
Note: Percentages shown are regression- adjusted for differences between new- entrant and six-month households in demographic, economic, and household characteristics. See Chapter II,Section C.
The cross- sectional estimates compare the sample of 3,275 new SNAP participants to thesample of 3,375 participants who had been receiving SNAP for about six months as of thebaseline data collection. The longitudinal estimates compare the 3,275 new SNAP participantsat baseline to the same 3,275 participants about six months later.

8/22/2019 USDA Report re SNAP & Food Security 08/2013
http://slidepdf.com/reader/full/usda-report-re-snap-food-security-082013 174/355
Appendix E Mathematica Policy Research
E-16
Table E.14. Regression- Adjusted Percentage of Households That Have Very Low Food Security, bySix Month and New Entrant SNAP Participation Status and by Health Status and Body Mass Index of Household Head
Cross- Sectional Estimates Longitudinal Estimates
New Entrant
Households
Six Month
Households Difference
New Entrant
Households
Six Month
Households Difference
Full Sample 36.4 31.4 - 5.0*** 35.9 29.6 - 6.3***
Self- Reported Health Status
Excellent 19.2 17.6 - 1.6 18.5 12.3 - 6.2**
Very good 26.2 19.7 - 6.5** 25.7 19.5 -6.2**
Good 34.4 28.3 - 6.1*** 34.3 29.6 - 4.7*
Fair 45 38.6 - 6.4** 45 39.1 - 5.9***
Poor 53.4 53.2 - 0.1 52.1 48.1 - 3.9
Body Mass Index
Underweight (less than18.5)
45.2 51.4 6.3 51.4 9.2 - 42.2***
Normal (18.5 to 24.9) 31.9 28.1 - 3.8 31.6 28.6 - 2.9
Overweight (25.0 to 29.9) 37.9 28.7 - 9.2*** 37.1 27.4 - 9.7***
Obese (30.0 and above) 37.8 34.5 - 3.2 37.5 29.7 - 7.7***
Source: SNAP Food Security Survey 2012.
Note: Percentages shown are regression- adjusted for differences between new- entrant and six-month households in demographic, economic, and household characteristics. See Chapter II,Section C.
The cross- sectional estimates compare the sample of 3,275 new SNAP participants to thesample of 3,375 participants who had been receiving SNAP for about six months as of thebaseline data collection. The longitudinal estimates compare the 3,275 new SNAP participantsat baseline to the same 3,275 participants about six months later.
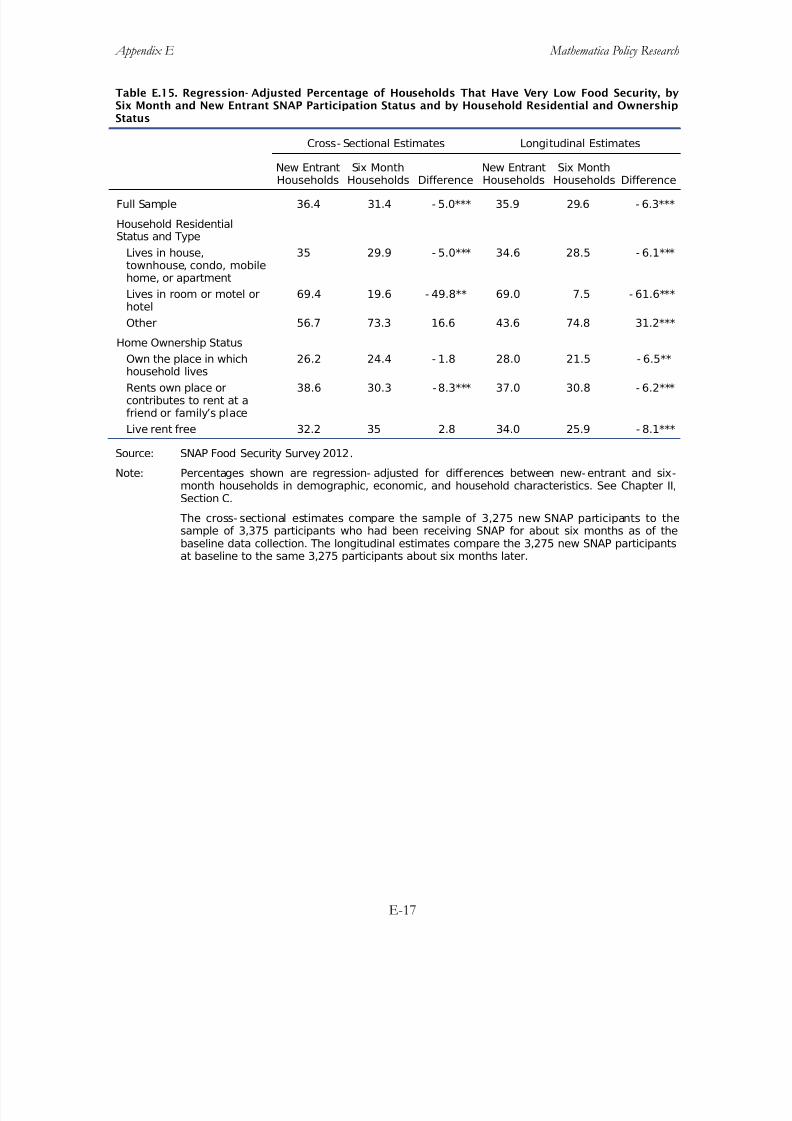
8/22/2019 USDA Report re SNAP & Food Security 08/2013
http://slidepdf.com/reader/full/usda-report-re-snap-food-security-082013 175/355
Appendix E Mathematica Policy Research
E-17
Table E.15. Regression- Adjusted Percentage of Households That Have Very Low Food Security, bySix Month and New Entrant SNAP Participation Status and by Household Residential and OwnershipStatus
Cross- Sectional Estimates Longitudinal Estimates
New Entrant
Households
Six Month
Households Difference
New Entrant
Households
Six Month
Households Difference
Full Sample 36.4 31.4 - 5.0*** 35.9 29.6 - 6.3***
Household ResidentialStatus and Type
Lives in house,townhouse, condo, mobilehome, or apartment
35 29.9 - 5.0*** 34.6 28.5 - 6.1***
Lives in room or motel orhotel
69.4 19.6 - 49.8** 69.0 7.5 - 61.6***
Other 56.7 73.3 16.6 43.6 74.8 31.2***
Home Ownership Status
Own the place in whichhousehold lives
26.2 24.4 - 1.8 28.0 21.5 - 6.5**
Rents own place orcontributes to rent at afriend or family’s place
38.6 30.3 -8.3*** 37.0 30.8 - 6.2***
Live rent free 32.2 35 2.8 34.0 25.9 - 8.1***
Source: SNAP Food Security Survey 2012.
Note: Percentages shown are regression- adjusted for differences between new- entrant and six-month households in demographic, economic, and household characteristics. See Chapter II,Section C.
The cross- sectional estimates compare the sample of 3,275 new SNAP participants to thesample of 3,375 participants who had been receiving SNAP for about six months as of thebaseline data collection. The longitudinal estimates compare the 3,275 new SNAP participantsat baseline to the same 3,275 participants about six months later.

8/22/2019 USDA Report re SNAP & Food Security 08/2013
http://slidepdf.com/reader/full/usda-report-re-snap-food-security-082013 176/355
Appendix E Mathematica Policy Research
E-18
Table E.16. Regression- Adjusted Percentage of Households That Have Very Low Food Security, bySix Month and New Entrant SNAP Participation Status and by Household Resources and FoodPreparation and Storage Capabilities
Cross- Sectional Estimates Longitudinal Estimates
New Entrant
Households
Six Month
Households Difference
New Entrant
Households
Six Month
Households Difference
Full Sample 36.4 31.4 - 5.0*** 35.9 29.6 - 6.3***
Household Resources
Owns car, truck, or othertype of vehicle
32.5 28.5 - 4.0* 31.7 26.6 - 5.2***
Does not own, but hasaccess to a car, truck, orother type of vehicle
36.2 29.6 - 6.6 35.1 28.3 - 6.9**
Does not own or haveaccess to a car, truck, orother type of vehicle
45.2 39.4 - 5.7 45.3 36.9 - 8.4***
Does not have credit cardthat can be used to makepurchases
39 34.4 - 4.7*** 38.6 33.9 - 4.8***
Has credit card that canbe used to makepurchases
26.9 20.5 - 6.4** 25.8 15.8 - 10.0***
Food Preparation andStorage Capabilities
Household has access to aplace where it can preparea meal
Yes 37.9 32.2 - 5.7*** 37.0 30.5 - 6.5***
No 44 15.4 - 28.6 41.4 33.9 - 7.5
Household has access to arefrigerator
Yes 35.2 30.4 - 4.9*** 34.6 28.5 - 6.1***
No 51 27.8 - 23.2 48.6 24.7 - 23.9
Household has access to astandalone freezer
Yes 30.7 26.1 - 4.5*** 30.9 23.1 - 7.8***
No 39.4 34.2 - 5.2*** 38.3 34.6 - 3.7*
Household has access to agas or electric stove
Yes 34.9 29.7 - 5.1*** 34.3 28.3 - 6.0***
No 46.2 60.4 14.3 39.0 36.3 - 2.7
Household has access to amicrowave
Yes 34.5 30 - 4.6*** 34.0 27.9 - 6.1***No 42.7 36.7 - 6 40.7 40.5 - 0.2
Source: SNAP Food Security Survey 2012.
Note: Percentages shown are regression- adjusted for differences between new- entrant and six-month households in demographic, economic, and household characteristics. See Chapter II,Section C.
The cross- sectional estimates compare the sample of 3,275 new SNAP participants to thesample of 3,375 participants who had been receiving SNAP for about six months as of thebaseline data collection. The longitudinal estimates compare the 3,275 new SNAP participantsat baseline to the same 3,275 participants about six months later.
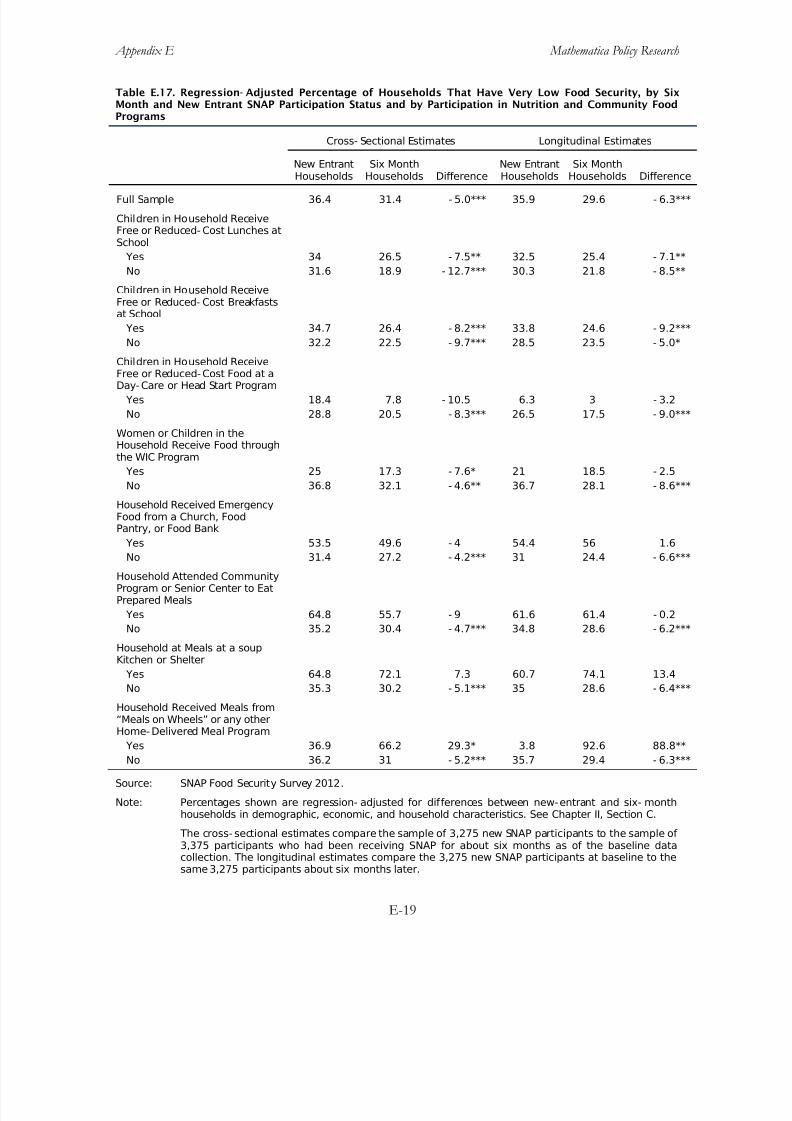
8/22/2019 USDA Report re SNAP & Food Security 08/2013
http://slidepdf.com/reader/full/usda-report-re-snap-food-security-082013 177/355
Appendix E Mathematica Policy Research
E-19
Table E.17. Regression- Adjusted Percentage of Households That Have Very Low Food Security, by SixMonth and New Entrant SNAP Participation Status and by Participation in Nutrition and Community FoodPrograms
Cross- Sectional Estimates Longitudinal Estimates
New EntrantHouseholds
Six MonthHouseholds Difference
New EntrantHouseholds
Six MonthHouseholds Difference
Full Sample 36.4 31.4 - 5.0*** 35.9 29.6 - 6.3***
Children in Household ReceiveFree or Reduced- Cost Lunches atSchool
Yes 34 26.5 - 7.5** 32.5 25.4 - 7.1**
No 31.6 18.9 - 12.7*** 30.3 21.8 - 8.5**
Children in Household ReceiveFree or Reduced- Cost Breakfastsat School
Yes 34.7 26.4 - 8.2*** 33.8 24.6 - 9.2***
No 32.2 22.5 - 9.7*** 28.5 23.5 - 5.0*
Children in Household ReceiveFree or Reduced-Cost Food at aDay- Care or Head Start Program
Yes 18.4 7.8 - 10.5 6.3 3 - 3.2
No 28.8 20.5 - 8.3*** 26.5 17.5 - 9.0***
Women or Children in theHousehold Receive Food throughthe WIC Program
Yes 25 17.3 - 7.6* 21 18.5 - 2.5
No 36.8 32.1 - 4.6** 36.7 28.1 - 8.6***
Household Received EmergencyFood from a Church, FoodPantry, or Food Bank
Yes 53.5 49.6 - 4 54.4 56 1.6
No 31.4 27.2 - 4.2*** 31 24.4 - 6.6***
Household Attended CommunityProgram or Senior Center to EatPrepared Meals
Yes 64.8 55.7 - 9 61.6 61.4 - 0.2
No 35.2 30.4 - 4.7*** 34.8 28.6 - 6.2***
Household at Meals at a soupKitchen or Shelter
Yes 64.8 72.1 7.3 60.7 74.1 13.4
No 35.3 30.2 - 5.1*** 35 28.6 - 6.4***
Household Received Meals from“Meals on Wheels” or any other
Home- Delivered Meal Program Yes 36.9 66.2 29.3* 3.8 92.6 88.8**
No 36.2 31 - 5.2*** 35.7 29.4 - 6.3***
Source: SNAP Food Security Survey 2012.
Note: Percentages shown are regression- adjusted for differences between new-entrant and six- monthhouseholds in demographic, economic, and household characteristics. See Chapter II, Section C.
The cross- sectional estimates compare the sample of 3,275 new SNAP participants to the sample of 3,375 participants who had been receiving SNAP for about six months as of the baseline datacollection. The longitudinal estimates compare the 3,275 new SNAP participants at baseline to thesame 3,275 participants about six months later.
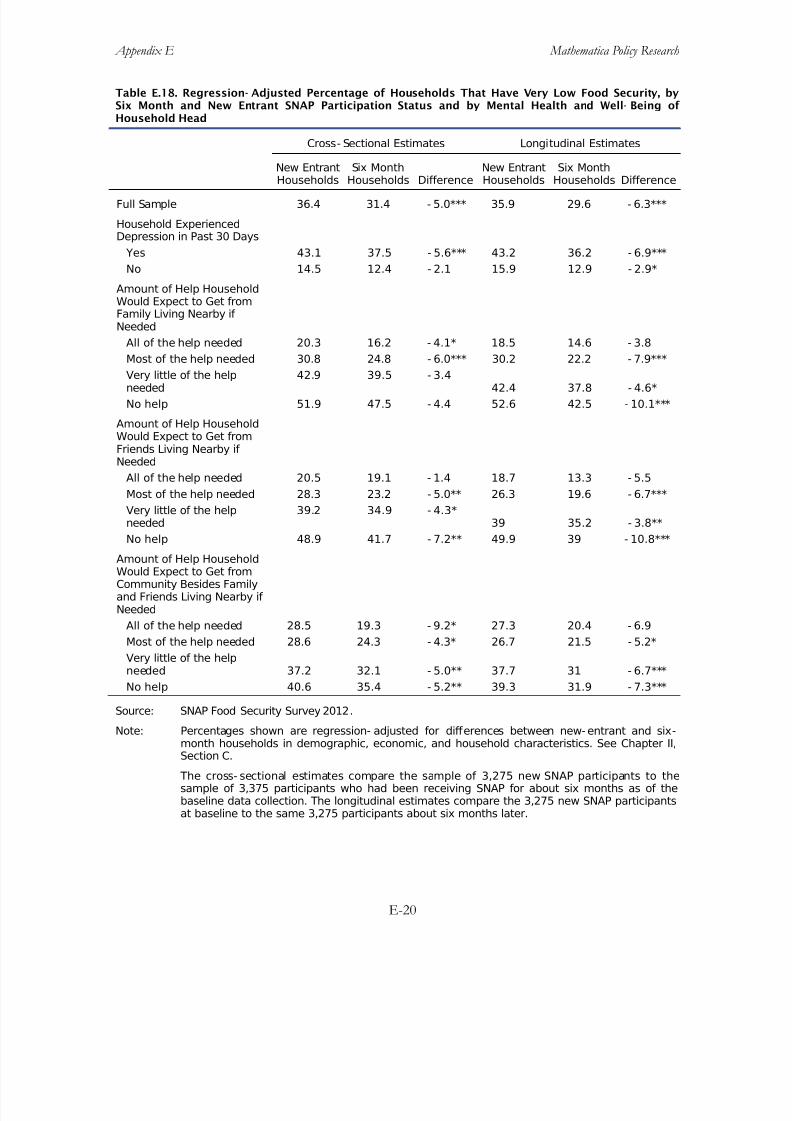
8/22/2019 USDA Report re SNAP & Food Security 08/2013
http://slidepdf.com/reader/full/usda-report-re-snap-food-security-082013 178/355
Appendix E Mathematica Policy Research
E-20
Table E.18. Regression- Adjusted Percentage of Households That Have Very Low Food Security, bySix Month and New Entrant SNAP Participation Status and by Mental Health and Well- Being of Household Head
Cross- Sectional Estimates Longitudinal Estimates
New Entrant
Households
Six Month
Households Difference
New Entrant
Households
Six Month
Households Difference
Full Sample 36.4 31.4 - 5.0*** 35.9 29.6 - 6.3***
Household ExperiencedDepression in Past 30 Days
Yes 43.1 37.5 - 5.6*** 43.2 36.2 - 6.9***
No 14.5 12.4 - 2.1 15.9 12.9 - 2.9*
Amount of Help HouseholdWould Expect to Get fromFamily Living Nearby if Needed
All of the help needed 20.3 16.2 - 4.1* 18.5 14.6 - 3.8
Most of the help needed 30.8 24.8 - 6.0*** 30.2 22.2 - 7.9***
Very little of the helpneeded
42.9 39.5 - 3.442.4 37.8 - 4.6*
No help 51.9 47.5 - 4.4 52.6 42.5 - 10.1***
Amount of Help HouseholdWould Expect to Get fromFriends Living Nearby if Needed
All of the help needed 20.5 19.1 - 1.4 18.7 13.3 - 5.5
Most of the help needed 28.3 23.2 - 5.0** 26.3 19.6 - 6.7***
Very little of the helpneeded
39.2 34.9 - 4.3*39 35.2 - 3.8**
No help 48.9 41.7 - 7.2** 49.9 39 - 10.8***
Amount of Help HouseholdWould Expect to Get fromCommunity Besides Familyand Friends Living Nearby if Needed
All of the help needed 28.5 19.3 - 9.2* 27.3 20.4 - 6.9
Most of the help needed 28.6 24.3 - 4.3* 26.7 21.5 - 5.2*
Very little of the helpneeded 37.2 32.1 - 5.0** 37.7 31 - 6.7***
No help 40.6 35.4 - 5.2** 39.3 31.9 - 7.3***
Source: SNAP Food Security Survey 2012.
Note: Percentages shown are regression- adjusted for differences between new- entrant and six-month households in demographic, economic, and household characteristics. See Chapter II,Section C.
The cross- sectional estimates compare the sample of 3,275 new SNAP participants to thesample of 3,375 participants who had been receiving SNAP for about six months as of thebaseline data collection. The longitudinal estimates compare the 3,275 new SNAP participantsat baseline to the same 3,275 participants about six months later.

8/22/2019 USDA Report re SNAP & Food Security 08/2013
http://slidepdf.com/reader/full/usda-report-re-snap-food-security-082013 179/355
APPENDIX F
DETAILS FOR FOOD EXPENDITURES REGRESSIONS

8/22/2019 USDA Report re SNAP & Food Security 08/2013
http://slidepdf.com/reader/full/usda-report-re-snap-food-security-082013 180/355
This page has been left blank for double-sided copying.
8/22/2019 USDA Report re SNAP & Food Security 08/2013
http://slidepdf.com/reader/full/usda-report-re-snap-food-security-082013 181/355
Appendix F Mathematica Policy Research
F-3
A. Regression Analysis of the Associations between SNAP and Usual FoodExpenditures
Our main estimates of the association between SNAP and food expenditures are based onregression analysis of the data. As described in the data and methodology discussion in Chapter II, we performed a cross-sectional analysis of the baseline data, comparing new-entrant and six-monthhouseholds, and a longitudinal analysis of the new-entrant household sample at two points in timeapproximately six months apart. The main independent variable of interest in these analyses was thebinary variable that measures whether a household had participated in SNAP for six months or wasa new-entrant household. Although we focus on the association between SNAP and foodexpenditures in Chapter V, in this section we describe the full set of regression coefficients andstandard errors from these models.
Usual Weekly Expenditures. Table F.1 presents the regression coefficients and standarderrors from the ordinary least squares regression of usual weekly food expenditures. A key finding here is that in the cross-sectional analysis, compared to just entering the program, participating inSNAP for six months was not statistically associated with household food expenditures. The
coefficient was 1.629 and the standard error was 2.226. The coefficient can be interpreted asmeaning that participating in SNAP was associated with a 1 to 2 dollar increase in usual weekly foodspending, though the estimate was not statistically significant.
A number of the other explanatory variables in the regression were found to have effects onspending in the cross-sectional analysis (Table F.1). Usual weekly food spending was positively associated with having a black, non-Hispanic household head, relative to a white, non-Hispanichead; having a larger household; having children in the household; living in the Northeast, comparedto in the West; and living in a state that offers broad-based categorical eligibility. Food spending wasnegatively associated with having a household head age 50 or older, compared with having a headage 18 to 24; and with having a household had that completed high school, some college, or college,
compared with less than high school.
The findings in the longitudinal analysis were generally similar. There was no associationbetween SNAP participation and usual weekly food spending. The coefficient in Table V.3 was2.701 and the standard error was 1.697. The increase in food spending was also not statistically significant at conventional levels. Usual weekly food spending was positively associated with having a black, non-Hispanic household head, relative to a white, non-Hispanic head; having a largerhousehold; having children in the household; experiencing a change in household size or a change inemployment, pay, or hours worked in the past 6 months; and living in the Northeast relative to the West. Food spending was negatively associated with having a household head age 25 or olderrelative to age 18 to 24; completing high school, some college, or college relative to less than highschool; being employed part time relative to not employed; receiving TANF or welfare benefits;
living in the Southeast compared to the West; and living in a state with a higher average wage.
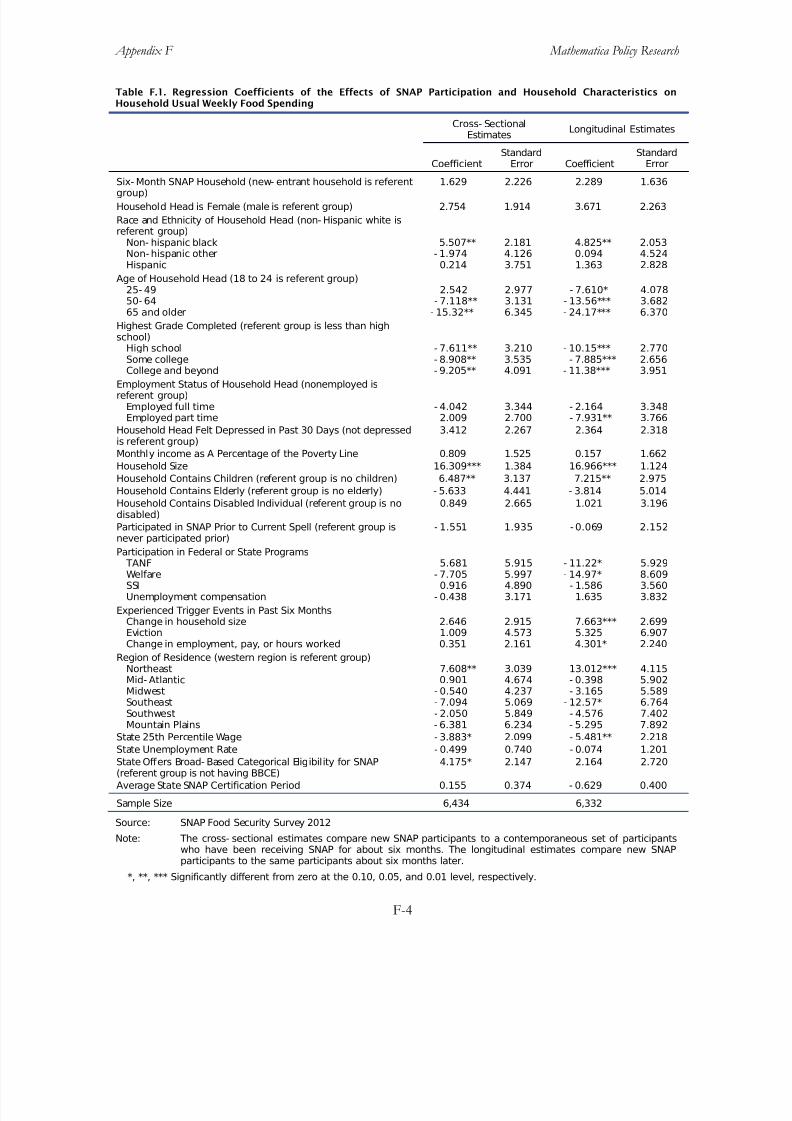
8/22/2019 USDA Report re SNAP & Food Security 08/2013
http://slidepdf.com/reader/full/usda-report-re-snap-food-security-082013 182/355
Appendix F Mathematica Policy Research
F-4
Table F.1. Regression Coefficients of the Effects of SNAP Participation and Household Characteristics onHousehold Usual Weekly Food Spending
Cross- SectionalEstimates
Longitudinal Estimates
CoefficientStandard
Error CoefficientStandard
Error
Six- Month SNAP Household (new- entrant household is referentgroup)
1.629 2.226 2.289 1.636
Household Head is Female (male is referent group) 2.754 1.914 3.671 2.263
Race and Ethnicity of Household Head (non- Hispanic white isreferent group)
Non- hispanic black 5.507** 2.181 4.825** 2.053Non- hispanic other - 1.974 4.126 0.094 4.524Hispanic 0.214 3.751 1.363 2.828
Age of Household Head (18 to 24 is referent group)25- 49 2.542 2.977 - 7.610* 4.07850- 64 - 7.118** 3.131 - 13.56*** 3.68265 and older - 15.32** 6.345 - 24.17*** 6.370
Highest Grade Completed (referent group is less than highschool)
High school - 7.611** 3.210 - 10.15*** 2.770Some college - 8.908** 3.535 - 7.885*** 2.656
College and beyond - 9.205** 4.091 - 11.38*** 3.951
Employment Status of Household Head (nonemployed isreferent group)
Employed full time - 4.042 3.344 - 2.164 3.348Employed part time 2.009 2.700 - 7.931** 3.766
Household Head Felt Depressed in Past 30 Days (not depressedis referent group)
3.412 2.267 2.364 2.318
Monthly income as A Percentage of the Poverty Line 0.809 1.525 0.157 1.662
Household Size 16.309*** 1.384 16.966*** 1.124
Household Contains Children (referent group is no children) 6.487** 3.137 7.215** 2.975
Household Contains Elderly (referent group is no elderly) - 5.633 4.441 - 3.814 5.014
Household Contains Disabled Individual (referent group is nodisabled)
0.849 2.665 1.021 3.196
Participated in SNAP Prior to Current Spell (referent group isnever participated prior)
- 1.551 1.935 - 0.069 2.152
Participation in Federal or State Programs TANF 5.681 5.915 - 11.22* 5.929Welfare - 7.705 5.997 - 14.97* 8.609SSI 0.916 4.890 - 1.586 3.560Unemployment compensation - 0.438 3.171 1.635 3.832
Experienced Trigger Events in Past Six MonthsChange in household size 2.646 2.915 7.663*** 2.699Eviction 1.009 4.573 5.325 6.907Change in employment, pay, or hours worked 0.351 2.161 4.301* 2.240
Region of Residence (western region is referent group)Northeast 7.608** 3.039 13.012*** 4.115Mid- Atlantic 0.901 4.674 - 0.398 5.902Midwest - 0.540 4.237 - 3.165 5.589Southeast - 7.094 5.069 - 12.57* 6.764Southwest - 2.050 5.849 - 4.576 7.402Mountain Plains - 6.381 6.234 - 5.295 7.892
State 25th Percentile Wage - 3.883* 2.099 - 5.481** 2.218State Unemployment Rate - 0.499 0.740 - 0.074 1.201
State Offers Broad- Based Categorical Eligibility for SNAP(referent group is not having BBCE)
4.175* 2.147 2.164 2.720
Average State SNAP Certification Period 0.155 0.374 - 0.629 0.400
Sample Size 6,434 6,332
Source: SNAP Food Security Survey 2012
Note: The cross- sectional estimates compare new SNAP participants to a contemporaneous set of participantswho have been receiving SNAP for about six months. The longitudinal estimates compare new SNAPparticipants to the same participants about six months later.
*, **, *** Significantly different from zero at the 0.10, 0.05, and 0.01 level, respectively.

8/22/2019 USDA Report re SNAP & Food Security 08/2013
http://slidepdf.com/reader/full/usda-report-re-snap-food-security-082013 183/355
Appendix F Mathematica Policy Research
F-5
Usual Weekly Expenditures Relative to Cost of the Thrifty Food Plan. Table F.2 presentsthe regression coefficients and standard errors from the ordinary least squares regression of usual weekly food expenditures relative to the cost of the TFP. SNAP was associated with a 0.047 unitincrease in usual expenditures relative to the cost of the TFP in the cross-sectional sample; there wasno statistical association in the longitudinal sample.
A number of the other explanatory variables in the regression were found to have effects onspending in the cross-sectional analysis (Table F.2). Usual weekly food spending relative to the costof the TFP was positively associated with having a female household head; having black, non-Hispanic household head, relative to a white, non-Hispanic head; having a larger household; having a household head that reported experiencing depression in the past 30 days; having children in thehousehold; having children in the household; living in the Northeast, compared to in the West; andliving in a state that offers broad-based categorical eligibility. Food spending was negatively associated with having a household head age 50 or older, compared with having a head age 18 to 24;having a household had that completed high school, some college, or college, compared with lessthan high school; having a larger household; having an elderly member in the household; and living in a state with a higher 25th percentile wage.
The findings in the longitudinal analysis were generally similar. Exceptions include that TFP-adjusted expenditures are negatively associated with having a household head that is employed parttime; receiving TANF or welfare benefits; and living in the Southeast, relative to the West. TFP-adjusted expenditures were positively associated with changes in household size and changes inemployment, pay, or hours worked.
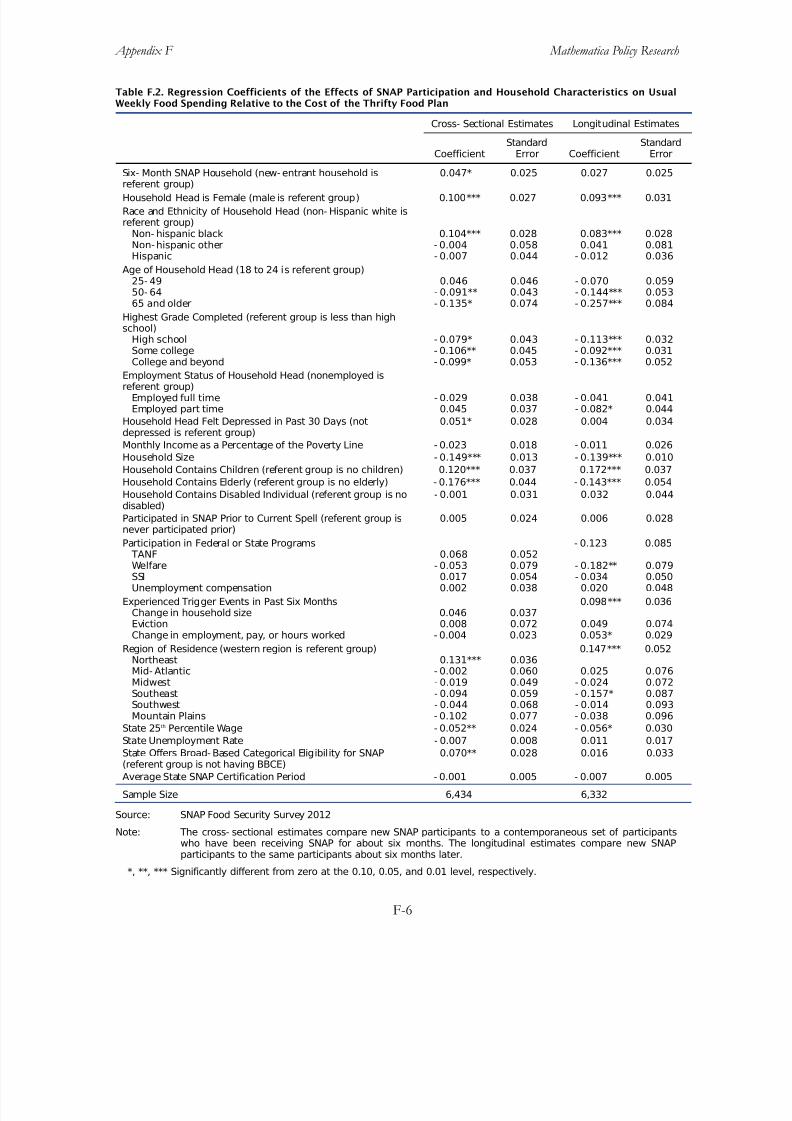
8/22/2019 USDA Report re SNAP & Food Security 08/2013
http://slidepdf.com/reader/full/usda-report-re-snap-food-security-082013 184/355
Appendix F Mathematica Policy Research
F-6
Table F.2. Regression Coefficients of the Effects of SNAP Participation and Household Characteristics on UsualWeekly Food Spending Relative to the Cost of the Thrifty Food Plan
Cross- Sectional Estimates Longitudinal Estimates
CoefficientStandard
Error CoefficientStandard
Error
Six- Month SNAP Household (new- entrant household is
referent group)
0.047* 0.025 0.027 0.025
Household Head is Female (male is referent group) 0.100*** 0.027 0.093*** 0.031
Race and Ethnicity of Household Head (non- Hispanic white isreferent group)
Non- hispanic black 0.104*** 0.028 0.083*** 0.028Non-hispanic other - 0.004 0.058 0.041 0.081Hispanic - 0.007 0.044 - 0.012 0.036
Age of Household Head (18 to 24 is referent group)25- 49 0.046 0.046 - 0.070 0.05950- 64 - 0.091** 0.043 - 0.144*** 0.05365 and older - 0.135* 0.074 - 0.257*** 0.084
Highest Grade Completed (referent group is less than highschool)
High school - 0.079* 0.043 - 0.113*** 0.032Some college - 0.106** 0.045 - 0.092*** 0.031College and beyond - 0.099* 0.053 - 0.136*** 0.052
Employment Status of Household Head (nonemployed isreferent group)
Employed full time - 0.029 0.038 - 0.041 0.041Employed part time 0.045 0.037 - 0.082* 0.044
Household Head Felt Depressed in Past 30 Days (notdepressed is referent group)
0.051* 0.028 0.004 0.034
Monthly Income as a Percentage of the Poverty Line - 0.023 0.018 - 0.011 0.026
Household Size - 0.149*** 0.013 - 0.139*** 0.010
Household Contains Children (referent group is no children) 0.120*** 0.037 0.172*** 0.037
Household Contains Elderly (referent group is no elderly) - 0.176*** 0.044 - 0.143*** 0.054
Household Contains Disabled Individual (referent group is nodisabled)
- 0.001 0.031 0.032 0.044
Participated in SNAP Prior to Current Spell (referent group isnever participated prior)
0.005 0.024 0.006 0.028
Participation in Federal or State Programs - 0.123 0.085
TANF 0.068 0.052Welfare - 0.053 0.079 - 0.182** 0.079SSI 0.017 0.054 - 0.034 0.050Unemployment compensation 0.002 0.038 0.020 0.048
Experienced Trigger Events in Past Six Months 0.098*** 0.036Change in household size 0.046 0.037Eviction 0.008 0.072 0.049 0.074Change in employment, pay, or hours worked - 0.004 0.023 0.053* 0.029
Region of Residence (western region is referent group) 0.147*** 0.052Northeast 0.131*** 0.036Mid- Atlantic - 0.002 0.060 0.025 0.076Midwest - 0.019 0.049 - 0.024 0.072Southeast - 0.094 0.059 - 0.157* 0.087Southwest - 0.044 0.068 - 0.014 0.093Mountain Plains - 0.102 0.077 - 0.038 0.096
State 25th Percentile Wage - 0.052** 0.024 - 0.056* 0.030
State Unemployment Rate - 0.007 0.008 0.011 0.017
State Offers Broad- Based Categorical Eligibility for SNAP(referent group is not having BBCE)
0.070** 0.028 0.016 0.033
Average State SNAP Certification Period - 0.001 0.005 - 0.007 0.005
Sample Size 6,434 6,332
Source: SNAP Food Security Survey 2012
Note: The cross- sectional estimates compare new SNAP participants to a contemporaneous set of participantswho have been receiving SNAP for about six months. The longitudinal estimates compare new SNAPparticipants to the same participants about six months later.
*, **, *** Significantly different from zero at the 0.10, 0.05, and 0.01 level, respectively.

8/22/2019 USDA Report re SNAP & Food Security 08/2013
http://slidepdf.com/reader/full/usda-report-re-snap-food-security-082013 185/355
APPENDIX G
SENSITIVITY ANALYSES OF FOOD EXPENDITURES

8/22/2019 USDA Report re SNAP & Food Security 08/2013
http://slidepdf.com/reader/full/usda-report-re-snap-food-security-082013 186/355
This page has been left blank for double-sided copying.
8/22/2019 USDA Report re SNAP & Food Security 08/2013
http://slidepdf.com/reader/full/usda-report-re-snap-food-security-082013 187/355
Appendix G Mathematica Policy Research
G-3
Chapter V presents estimates of the association between SNAP participation and householdfood expenditures. The lack of evidence of a statistically significant association between SNAP andfood expenditures was surprising. Economic theory suggests that, if a household is provided abenefit to be spent on food, then total expenditures on food will increase. Our prior hypothesis hadbeen that the results for food security and expenditures would be similar, but they are not. As noted
in Chapter IV, SNAP was associated with a decrease in the probability that a household was foodinsecure and the probability that a household had very low food security, but the findings on foodexpenditures provide little evidence of an association with SNAP participation. In this appendix wedescribe several auxiliary analyses we conducted to check model specifications and the expendituredata provided by respondents. We also discuss other issues related to potential reporting error.
A. Descriptive Analysis of Food Spending
As a starting point for our diagnostic assessment, we descriptively examine both expenditureslast week and usual weekly expenditures. We focus our descriptive analysis of the data on mediansbecause the median is less sensitive than the mean to outliers in the distribution.
1. Usual Expenditures and Expenditures Last Week
Median usual food spending in a typical week was the same for new-entrant and six-monthhouseholds and equal to $75 in the cross-sectional and longitudinal samples. The medianexpenditure in the week before the interview was $80 for new-entrant households and $75 for six-month households in both the cross-sectional and longitudinal samples (Table G.1). 53
53 The findings were similar when the mean was used in place of the median.

8/22/2019 USDA Report re SNAP & Food Security 08/2013
http://slidepdf.com/reader/full/usda-report-re-snap-food-security-082013 188/355
Appendix G Mathematica Policy Research
G-4
Table G.1. Median Household Food Spending in Six- Month and New- Entrant SNAP Households
Cross- Sectional Estimates Longitudinal Estimates
New-Entrant
Households
(Baseline)
Six- Month
Households Difference
New-EntrantHouseholds
(Baseline)
New- EntrantHouseholds(Six- Month
Follow- Up) Difference
Usual Weekly FoodExpenditures (in dollars)
75 75 0 75 75 0
Last Week’s FoodExpenditures (in dollars)
80 75 - 5 80 75 - 5
Usual Weekly FoodExpenditures Relative to TFP
0.99 1.00 0.01 0.99 1.00 0.01
Last Week’s FoodExpenditures Relative to TFP
1.05 0.96 - 0.09 1.05 1.00 - 0.05
Source: SNAP Food Security Survey 2012.Note: The cross- sectional estimates compare new SNAP participants to a contemporaneous set of
participants who have been receiving SNAP for about six months. The longitudinal estimatescompare new SNAP participants to the same participants about six months later.
Cross- sectional estimates are based on a data set with 6,650 households (3,275 new- entranthouseholds and 3,375 six- month households). Longitudinal estimates are based on a data setwith 3,275 new- entrant households observed at baseline and again at follow- up six monthslater.
2. Usual Expenditures Relative to the Cost of the TFP
In a typical week, median food spending was 0.99 times the cost of the TFP for new-entrant
households and 1.00 times the cost of the TFP for six-month households in the cross-sectional andlongitudinal samples (Table G.1). Median food spending based on spending in the week before theinterview was 1.05 times the cost of the TFP for new-entrant households and 0.96 times the cost of the TFP for six-month households in the cross-sectional sample. In the longitudinal sample, thesenumbers were 1.05 and 1.00, respectively.
The above patterns are consistent with most of the multivariate findings, showing no positiveassociation between SNAP and food expenditures. To examine these patterns more fully, Table G.2presents characteristics of the distributions of usual weekly food expenditures and usual weekly foodexpenditures relative to the cost of the TFP. Not only did new-entrant and six-month householdshave similar median food spending amounts, but the distributions of usual weekly food expendituresand expenditures relative to the TFP were similar at nearly all points in the distribution (10th, 25th,75th and 90th percentiles).
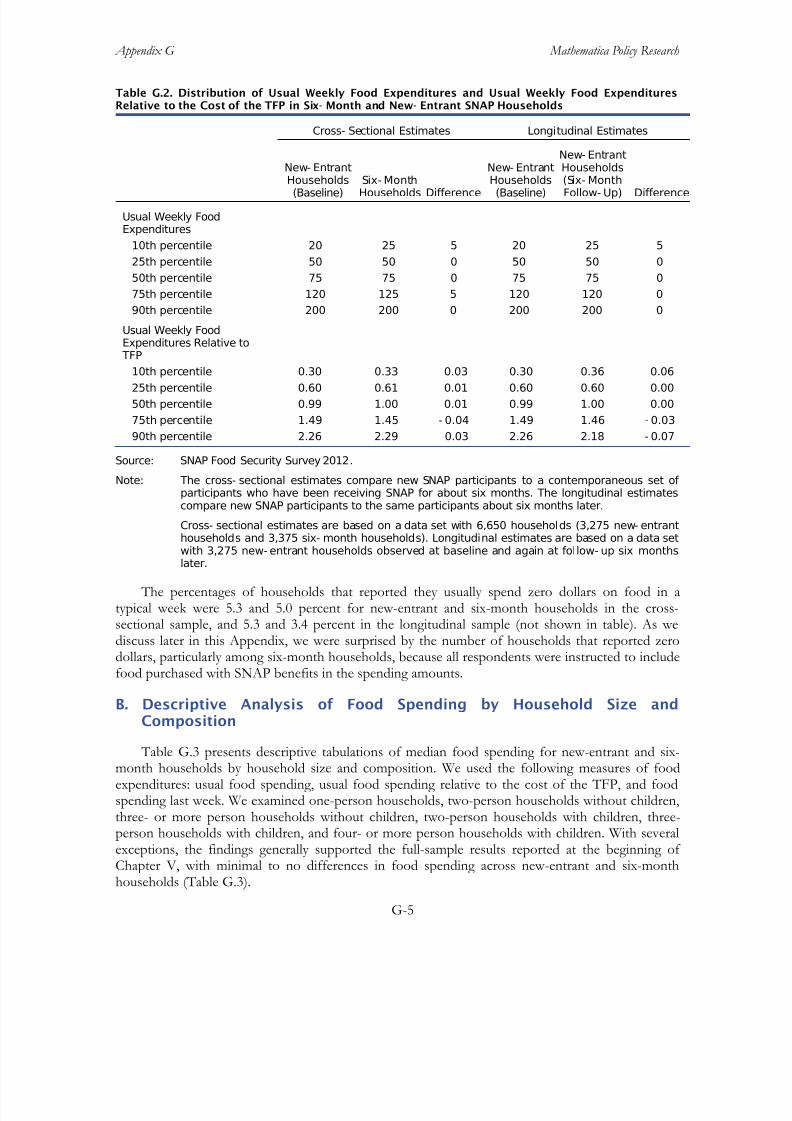
8/22/2019 USDA Report re SNAP & Food Security 08/2013
http://slidepdf.com/reader/full/usda-report-re-snap-food-security-082013 189/355
Appendix G Mathematica Policy Research
G-5
Table G.2. Distribution of Usual Weekly Food Expenditures and Usual Weekly Food ExpendituresRelative to the Cost of the TFP in Six- Month and New- Entrant SNAP Households
Cross- Sectional Estimates Longitudinal Estimates
New- Entrant
Households(Baseline) Six- MonthHouseholds Difference
New- Entrant
Households(Baseline)
New- EntrantHouseholds
(Six- MonthFollow- Up) Difference
Usual Weekly FoodExpenditures
10th percentile 20 25 5 20 25 5
25th percentile 50 50 0 50 50 0
50th percentile 75 75 0 75 75 0
75th percentile 120 125 5 120 120 0
90th percentile 200 200 0 200 200 0
Usual Weekly FoodExpenditures Relative to TFP
10th percentile 0.30 0.33 0.03 0.30 0.36 0.06
25th percentile 0.60 0.61 0.01 0.60 0.60 0.00
50th percentile 0.99 1.00 0.01 0.99 1.00 0.00
75th percentile 1.49 1.45 - 0.04 1.49 1.46 - 0.03
90th percentile 2.26 2.29 0.03 2.26 2.18 - 0.07
Source: SNAP Food Security Survey 2012.
Note: The cross- sectional estimates compare new SNAP participants to a contemporaneous set of participants who have been receiving SNAP for about six months. The longitudinal estimatescompare new SNAP participants to the same participants about six months later.
Cross- sectional estimates are based on a data set with 6,650 households (3,275 new- entranthouseholds and 3,375 six- month households). Longitudinal estimates are based on a data set
with 3,275 new- entrant households observed at baseline and again at follow- up six monthslater.
The percentages of households that reported they usually spend zero dollars on food in atypical week were 5.3 and 5.0 percent for new-entrant and six-month households in the cross-sectional sample, and 5.3 and 3.4 percent in the longitudinal sample (not shown in table). As wediscuss later in this Appendix, we were surprised by the number of households that reported zerodollars, particularly among six-month households, because all respondents were instructed to includefood purchased with SNAP benefits in the spending amounts.
B. Descriptive Analysis of Food Spending by Household Size andComposition
Table G.3 presents descriptive tabulations of median food spending for new-entrant and six-month households by household size and composition. We used the following measures of foodexpenditures: usual food spending, usual food spending relative to the cost of the TFP, and foodspending last week. We examined one-person households, two-person households without children,three- or more person households without children, two-person households with children, three-person households with children, and four- or more person households with children. With severalexceptions, the findings generally supported the full-sample results reported at the beginning of Chapter V, with minimal to no differences in food spending across new-entrant and six-monthhouseholds (Table G.3).
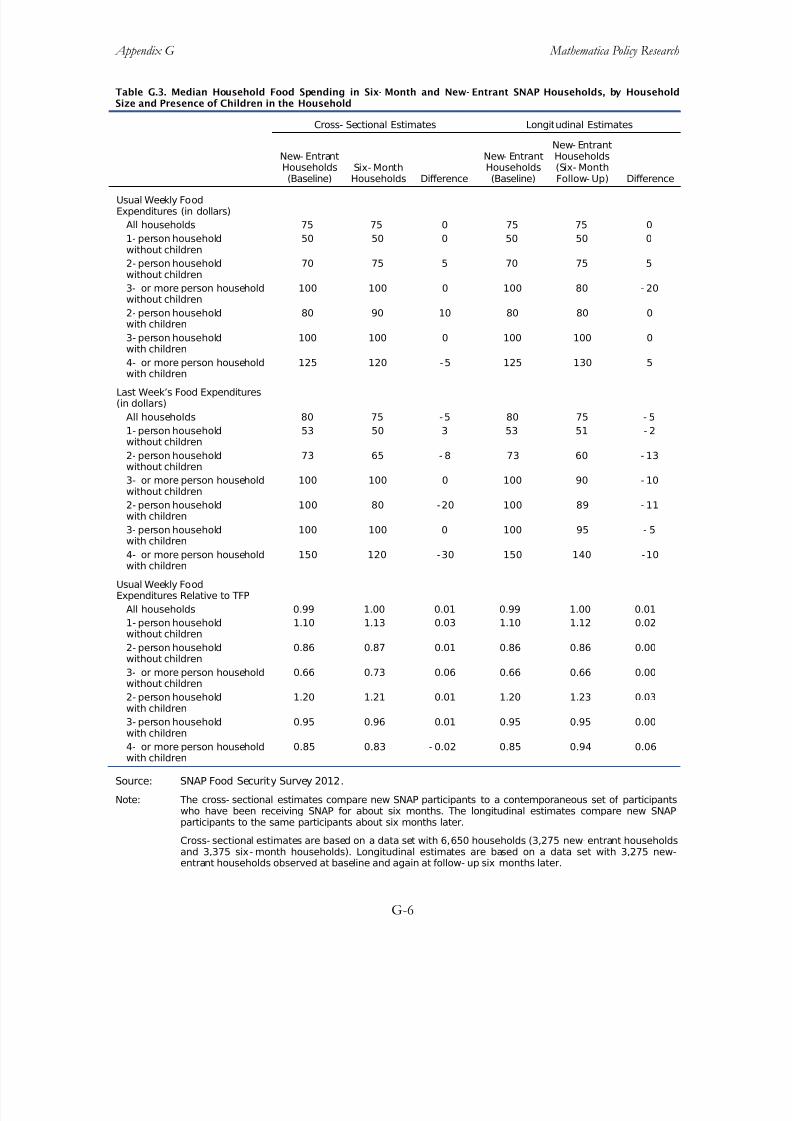
8/22/2019 USDA Report re SNAP & Food Security 08/2013
http://slidepdf.com/reader/full/usda-report-re-snap-food-security-082013 190/355
Appendix G Mathematica Policy Research
G-6
Table G.3. Median Household Food Spending in Six- Month and New- Entrant SNAP Households, by HouseholdSize and Presence of Children in the Household
Cross- Sectional Estimates Longitudinal Estimates
New- EntrantHouseholds
(Baseline)
Six- Month
Households Difference
New- EntrantHouseholds
(Baseline)
New- EntrantHouseholds(Six- Month
Follow- Up) Difference
Usual Weekly FoodExpenditures (in dollars)
All households 75 75 0 75 75 0
1- person householdwithout children
50 50 0 50 50 0
2- person householdwithout children
70 75 5 70 75 5
3- or more person householdwithout children
100 100 0 100 80 - 20
2- person householdwith children
80 90 10 80 80 0
3- person householdwith children
100 100 0 100 100 0
4- or more person householdwith children 125 120 -5 125 130 5
Last Week’s Food Expenditures(in dollars)
All households 80 75 -5 80 75 - 5
1- person householdwithout children
53 50 3 53 51 - 2
2- person householdwithout children
73 65 - 8 73 60 - 13
3- or more person householdwithout children
100 100 0 100 90 - 10
2- person householdwith children
100 80 -20 100 89 - 11
3- person householdwith children
100 100 0 100 95 - 5
4- or more person householdwith children
150 120 -30 150 140 -10
Usual Weekly FoodExpenditures Relative to TFP
All households 0.99 1.00 0.01 0.99 1.00 0.01
1- person householdwithout children
1.10 1.13 0.03 1.10 1.12 0.02
2- person householdwithout children
0.86 0.87 0.01 0.86 0.86 0.00
3- or more person householdwithout children
0.66 0.73 0.06 0.66 0.66 0.00
2- person householdwith children
1.20 1.21 0.01 1.20 1.23 0.03
3- person household
with children
0.95 0.96 0.01 0.95 0.95 0.00
4- or more person householdwith children
0.85 0.83 - 0.02 0.85 0.94 0.06
Source: SNAP Food Security Survey 2012.
Note: The cross- sectional estimates compare new SNAP participants to a contemporaneous set of participantswho have been receiving SNAP for about six months. The longitudinal estimates compare new SNAPparticipants to the same participants about six months later.
Cross- sectional estimates are based on a data set with 6,650 households (3,275 new- entrant householdsand 3,375 six- month households). Longitudinal estimates are based on a data set with 3,275 new-entrant households observed at baseline and again at follow- up six months later.
8/22/2019 USDA Report re SNAP & Food Security 08/2013
http://slidepdf.com/reader/full/usda-report-re-snap-food-security-082013 191/355
Appendix G Mathematica Policy Research
G-7
C. Auxiliary Multivariate Analyses of the Association Between SNAP andFood Expenditures
After performing diagnostic assessments based on descriptive tabulations of food spending, weconducted extensive diagnostic assessments based on multivariate analyses.
1. Sample Restrictions
The analysis samples in our main specification included all respondents with a nonmissing valuefor usual food expenditures. We were concerned that values in the tails of the expendituredistributions could be unduly influencing the regression results. For example, the distributions of usual weekly food expenditures had relatively large concentrations of households reporting spending nothing on food in a typical week and a nontrivial number of households reporting very large weekly expenditures. This was true both for new-entrant households and for six-month households.
To examine the effects of these values in the tails of the distributions, we restricted the samplein the following four ways and re-estimated the OLS regression model of usual weekly spending
relative to the cost of the TFP for each restricted sample:
• Excluded all households that reported usually spending zero dollars on food
• Excluded all households with usual spending relative to the cost of the TFP less thanthe 5th percentile (0.00 for new-entrant households) or greater than the 99th percentile(4.52 for new-entrant households)
• Excluded all households with usual spending relative to the cost of the TFP less thanthe 10th percentile (0.30 for new-entrant households) or greater than the 95th percentile(2.90 for new-entrant households)
• Excluded all households with usual spending relative to the cost of the TFP less than
the 10th percentile (0.30 for new-entrant households) or greater than the 90th percentile(2.26 for new-entrant households)
The statistically significant association of 0.05 between SNAP and usual spending relative to thecost of the TFP in the cross-sectional sample was robust to excluding households reporting zeroexpenditures, but was not robust to trimming the values in both tails of the expenditure distribution(Table G.4). In the longitudinal analysis, there were no statistically significant associations of SNAPand usual food spending relative to the cost of the TFP for any specification. We conclude that thecross-sectional sample finding is sensitive to the effects of the values in the tails in the distribution.
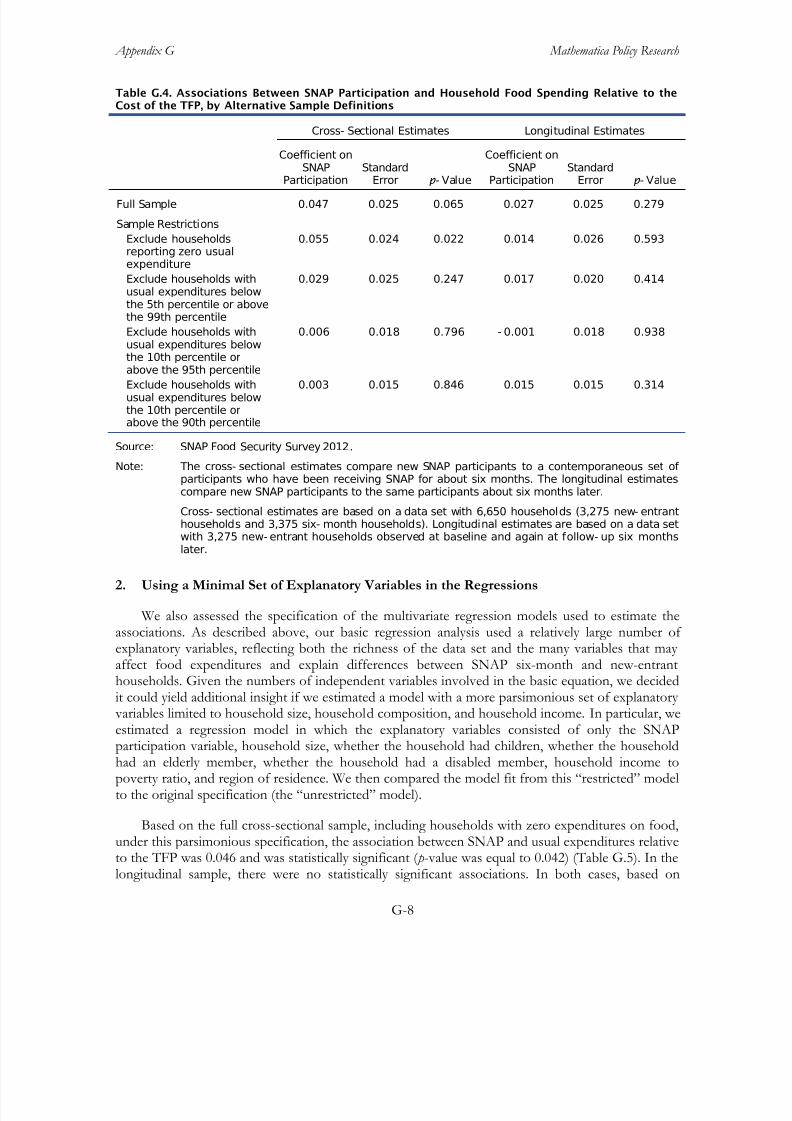
8/22/2019 USDA Report re SNAP & Food Security 08/2013
http://slidepdf.com/reader/full/usda-report-re-snap-food-security-082013 192/355
Appendix G Mathematica Policy Research
G-8
Table G.4. Associations Between SNAP Participation and Household Food Spending Relative to theCost of the TFP, by Alternative Sample Definitions
Cross- Sectional Estimates Longitudinal Estimates
Coefficient onSNAP
Participation
Standard
Error p - Value
Coefficient onSNAP
Participation
Standard
Error p - Value
Full Sample 0.047 0.025 0.065 0.027 0.025 0.279
Sample Restrictions
Exclude householdsreporting zero usualexpenditure
0.055 0.024 0.022 0.014 0.026 0.593
Exclude households withusual expenditures belowthe 5th percentile or abovethe 99th percentile
0.029 0.025 0.247 0.017 0.020 0.414
Exclude households withusual expenditures belowthe 10th percentile or
above the 95th percentile
0.006 0.018 0.796 - 0.001 0.018 0.938
Exclude households withusual expenditures belowthe 10th percentile orabove the 90th percentile
0.003 0.015 0.846 0.015 0.015 0.314
Source: SNAP Food Security Survey 2012.
Note: The cross- sectional estimates compare new SNAP participants to a contemporaneous set of participants who have been receiving SNAP for about six months. The longitudinal estimatescompare new SNAP participants to the same participants about six months later.
Cross- sectional estimates are based on a data set with 6,650 households (3,275 new- entranthouseholds and 3,375 six- month households). Longitudinal estimates are based on a data setwith 3,275 new- entrant households observed at baseline and again at follow- up six months
later.
2. Using a Minimal Set of Explanatory Variables in the Regressions
We also assessed the specification of the multivariate regression models used to estimate theassociations. As described above, our basic regression analysis used a relatively large number of explanatory variables, reflecting both the richness of the data set and the many variables that may affect food expenditures and explain differences between SNAP six-month and new-entranthouseholds. Given the numbers of independent variables involved in the basic equation, we decidedit could yield additional insight if we estimated a model with a more parsimonious set of explanatory variables limited to household size, household composition, and household income. In particular, we
estimated a regression model in which the explanatory variables consisted of only the SNAPparticipation variable, household size, whether the household had children, whether the householdhad an elderly member, whether the household had a disabled member, household income topoverty ratio, and region of residence. We then compared the model fit from this “restricted” modelto the original specification (the “unrestricted” model).
Based on the full cross-sectional sample, including households with zero expenditures on food,under this parsimonious specification, the association between SNAP and usual expenditures relativeto the TFP was 0.046 and was statistically significant ( p-value was equal to 0.042) (Table G.5). In thelongitudinal sample, there were no statistically significant associations. In both cases, based on
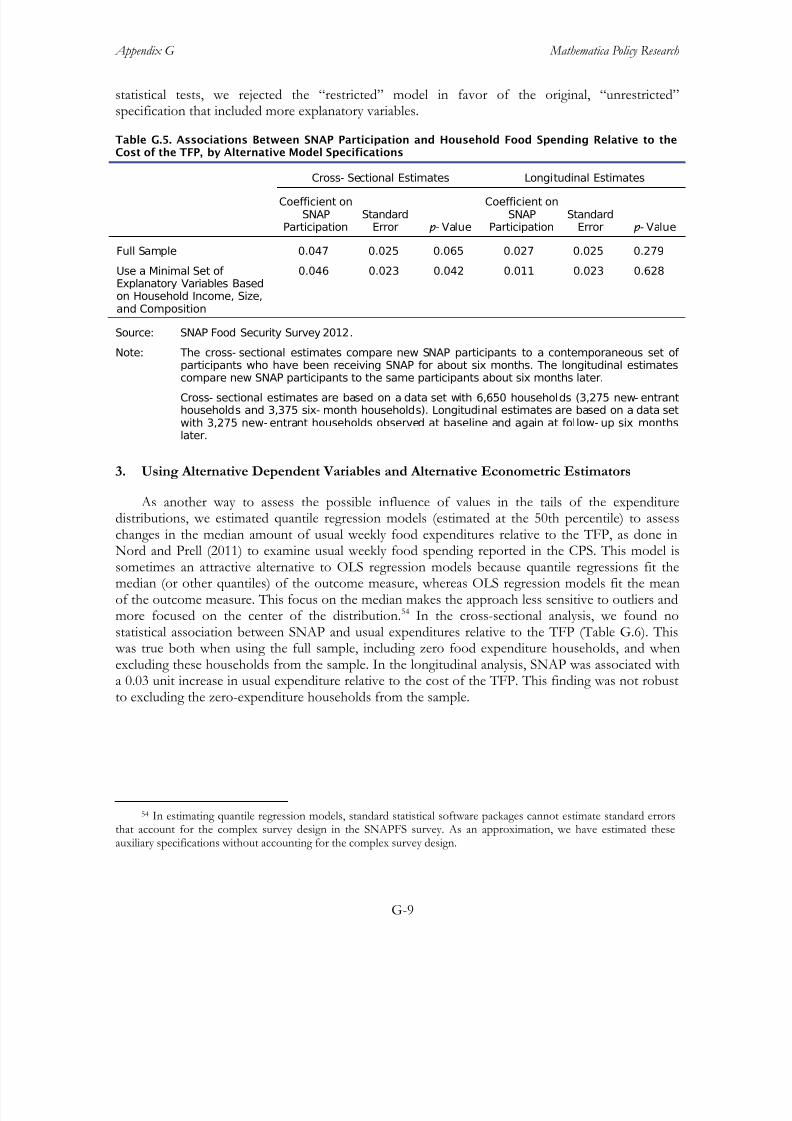
8/22/2019 USDA Report re SNAP & Food Security 08/2013
http://slidepdf.com/reader/full/usda-report-re-snap-food-security-082013 193/355
Appendix G Mathematica Policy Research
G-9
statistical tests, we rejected the “restricted” model in favor of the original, “unrestricted”specification that included more explanatory variables.
Table G.5. Associations Between SNAP Participation and Household Food Spending Relative to theCost of the TFP, by Alternative Model Specifications
Cross- Sectional Estimates Longitudinal Estimates
Coefficient onSNAP
ParticipationStandard
Error p - Value
Coefficient onSNAP
ParticipationStandard
Error p - Value
Full Sample 0.047 0.025 0.065 0.027 0.025 0.279
Use a Minimal Set of Explanatory Variables Basedon Household Income, Size,and Composition
0.046 0.023 0.042 0.011 0.023 0.628
Source: SNAP Food Security Survey 2012.
Note: The cross- sectional estimates compare new SNAP participants to a contemporaneous set of
participants who have been receiving SNAP for about six months. The longitudinal estimatescompare new SNAP participants to the same participants about six months later.
Cross- sectional estimates are based on a data set with 6,650 households (3,275 new- entranthouseholds and 3,375 six- month households). Longitudinal estimates are based on a data setwith 3,275 new- entrant households observed at baseline and again at follow- up six monthslater.
3. Using Alternative Dependent Variables and Alternative Econometric Estimators
As another way to assess the possible influence of values in the tails of the expendituredistributions, we estimated quantile regression models (estimated at the 50th percentile) to assesschanges in the median amount of usual weekly food expenditures relative to the TFP, as done in
Nord and Prell (2011) to examine usual weekly food spending reported in the CPS. This model issometimes an attractive alternative to OLS regression models because quantile regressions fit themedian (or other quantiles) of the outcome measure, whereas OLS regression models fit the meanof the outcome measure. This focus on the median makes the approach less sensitive to outliers andmore focused on the center of the distribution.54
In the cross-sectional analysis, we found nostatistical association between SNAP and usual expenditures relative to the TFP (Table G.6). This was true both when using the full sample, including zero food expenditure households, and whenexcluding these households from the sample. In the longitudinal analysis, SNAP was associated witha 0.03 unit increase in usual expenditure relative to the cost of the TFP. This finding was not robustto excluding the zero-expenditure households from the sample.
54 In estimating quantile regression models, standard statistical software packages cannot estimate standard errorsthat account for the complex survey design in the SNAPFS survey. As an approximation, we have estimated theseauxiliary specifications without accounting for the complex survey design.
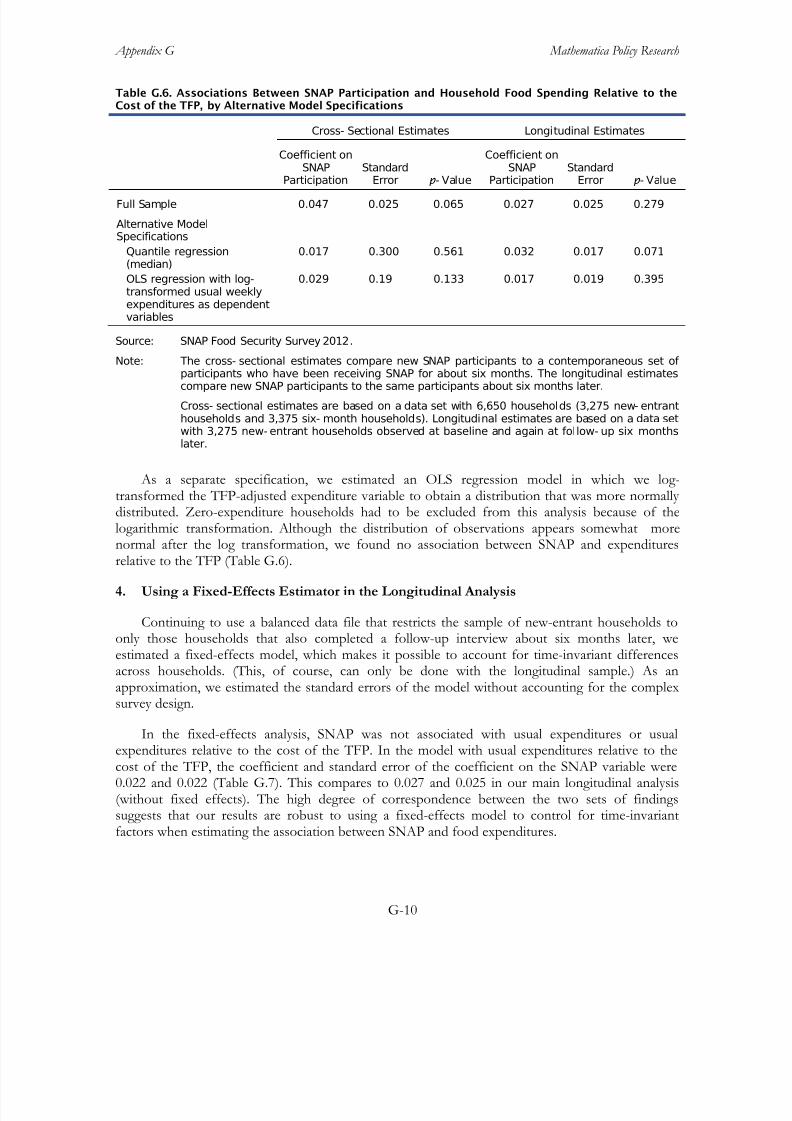
8/22/2019 USDA Report re SNAP & Food Security 08/2013
http://slidepdf.com/reader/full/usda-report-re-snap-food-security-082013 194/355
Appendix G Mathematica Policy Research
G-10
Table G.6. Associations Between SNAP Participation and Household Food Spending Relative to theCost of the TFP, by Alternative Model Specifications
Cross- Sectional Estimates Longitudinal Estimates
Coefficient onSNAP
Participation
Standard
Error p - Value
Coefficient onSNAP
Participation
Standard
Error p - Value
Full Sample 0.047 0.025 0.065 0.027 0.025 0.279
Alternative ModelSpecifications
Quantile regression(median)
0.017 0.300 0.561 0.032 0.017 0.071
OLS regression with log-transformed usual weeklyexpenditures as dependentvariables
0.029 0.19 0.133 0.017 0.019 0.395
Source: SNAP Food Security Survey 2012.
Note: The cross- sectional estimates compare new SNAP participants to a contemporaneous set of participants who have been receiving SNAP for about six months. The longitudinal estimatescompare new SNAP participants to the same participants about six months later.
Cross- sectional estimates are based on a data set with 6,650 households (3,275 new- entranthouseholds and 3,375 six- month households). Longitudinal estimates are based on a data setwith 3,275 new- entrant households observed at baseline and again at follow- up six monthslater.
As a separate specification, we estimated an OLS regression model in which we log-transformed the TFP-adjusted expenditure variable to obtain a distribution that was more normally distributed. Zero-expenditure households had to be excluded from this analysis because of thelogarithmic transformation. Although the distribution of observations appears somewhat more
normal after the log transformation, we found no association between SNAP and expendituresrelative to the TFP (Table G.6).
4. Using a Fixed-Effects Estimator in the Longitudinal Analysis
Continuing to use a balanced data file that restricts the sample of new-entrant households toonly those households that also completed a follow-up interview about six months later, weestimated a fixed-effects model, which makes it possible to account for time-invariant differencesacross households. (This, of course, can only be done with the longitudinal sample.) As anapproximation, we estimated the standard errors of the model without accounting for the complexsurvey design.
In the fixed-effects analysis, SNAP was not associated with usual expenditures or usualexpenditures relative to the cost of the TFP. In the model with usual expenditures relative to thecost of the TFP, the coefficient and standard error of the coefficient on the SNAP variable were0.022 and 0.022 (Table G.7). This compares to 0.027 and 0.025 in our main longitudinal analysis(without fixed effects). The high degree of correspondence between the two sets of findingssuggests that our results are robust to using a fixed-effects model to control for time-invariantfactors when estimating the association between SNAP and food expenditures.
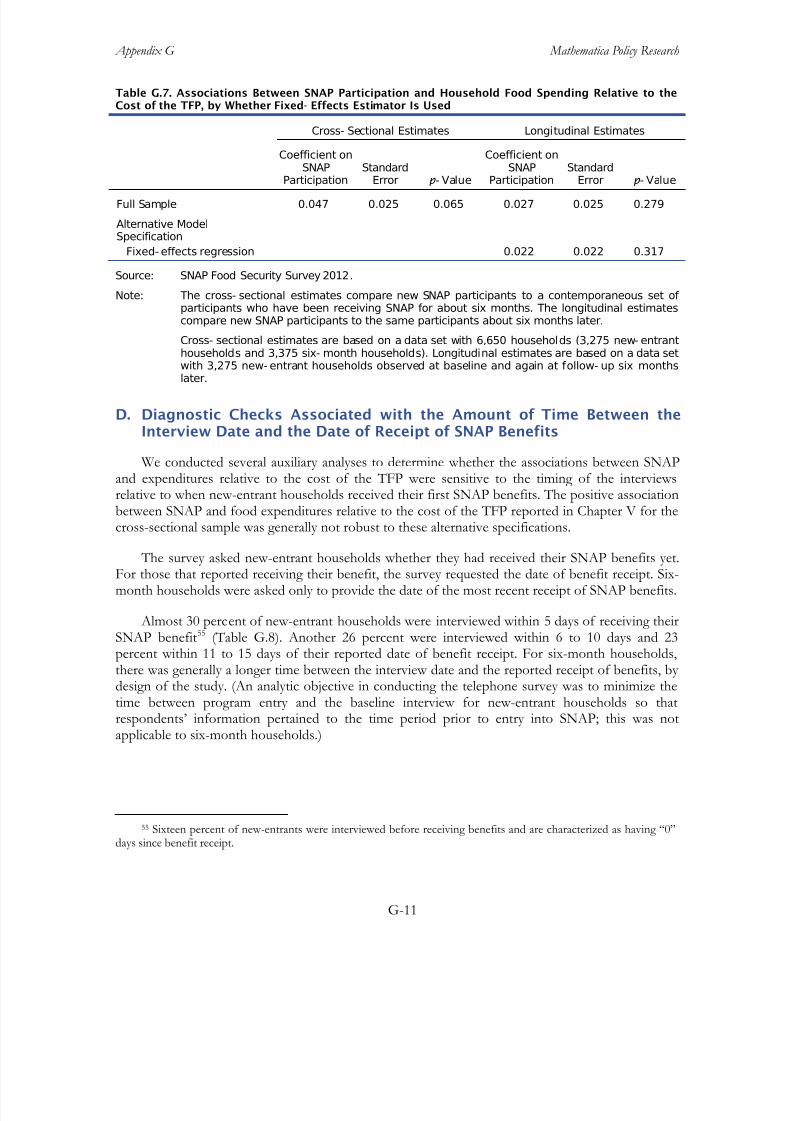
8/22/2019 USDA Report re SNAP & Food Security 08/2013
http://slidepdf.com/reader/full/usda-report-re-snap-food-security-082013 195/355
Appendix G Mathematica Policy Research
G-11
Table G.7. Associations Between SNAP Participation and Household Food Spending Relative to theCost of the TFP, by Whether Fixed- Effects Estimator Is Used
Cross- Sectional Estimates Longitudinal Estimates
Coefficient onSNAP
Participation
Standard
Error p - Value
Coefficient onSNAP
Participation
Standard
Error p - Value
Full Sample 0.047 0.025 0.065 0.027 0.025 0.279
Alternative ModelSpecification
Fixed- effects regression 0.022 0.022 0.317
Source: SNAP Food Security Survey 2012.
Note: The cross- sectional estimates compare new SNAP participants to a contemporaneous set of participants who have been receiving SNAP for about six months. The longitudinal estimatescompare new SNAP participants to the same participants about six months later.
Cross- sectional estimates are based on a data set with 6,650 households (3,275 new- entranthouseholds and 3,375 six- month households). Longitudinal estimates are based on a data set
with 3,275 new- entrant households observed at baseline and again at follow- up six monthslater.
D. Diagnostic Checks Associated with the Amount of Time Between theInterview Date and the Date of Receipt of SNAP Benefits
We conducted several auxiliary analyses to determine whether the associations between SNAPand expenditures relative to the cost of the TFP were sensitive to the timing of the interviewsrelative to when new-entrant households received their first SNAP benefits. The positive associationbetween SNAP and food expenditures relative to the cost of the TFP reported in Chapter V for thecross-sectional sample was generally not robust to these alternative specifications.
The survey asked new-entrant households whether they had received their SNAP benefits yet.For those that reported receiving their benefit, the survey requested the date of benefit receipt. Six-month households were asked only to provide the date of the most recent receipt of SNAP benefits.
Almost 30 percent of new-entrant households were interviewed within 5 days of receiving theirSNAP benefit55
(Table G.8). Another 26 percent were interviewed within 6 to 10 days and 23percent within 11 to 15 days of their reported date of benefit receipt. For six-month households,there was generally a longer time between the interview date and the reported receipt of benefits, by design of the study. (An analytic objective in conducting the telephone survey was to minimize thetime between program entry and the baseline interview for new-entrant households so thatrespondents’ information pertained to the time period prior to entry into SNAP; this was not
applicable to six-month households.)
55 Sixteen percent of new-entrants were interviewed before receiving benefits and are characterized as having “0”days since benefit receipt.
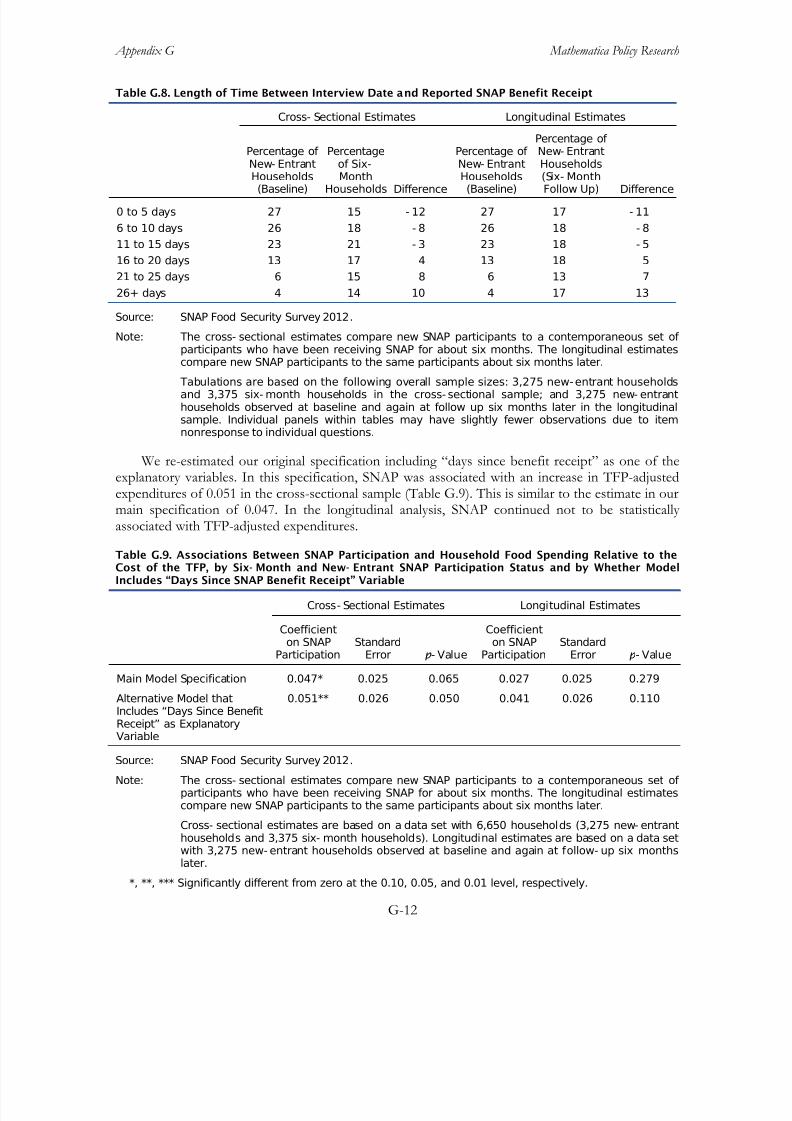
8/22/2019 USDA Report re SNAP & Food Security 08/2013
http://slidepdf.com/reader/full/usda-report-re-snap-food-security-082013 196/355
Appendix G Mathematica Policy Research
G-12
Table G.8. Length of Time Between Interview Date and Reported SNAP Benefit Receipt
Cross- Sectional Estimates Longitudinal Estimates
Percentage of New- EntrantHouseholds(Baseline)
Percentageof Six-Month
Households Difference
Percentage of New- EntrantHouseholds(Baseline)
Percentage of New- EntrantHouseholds(Six- MonthFollow Up) Difference
0 to 5 days 27 15 - 12 27 17 - 11
6 to 10 days 26 18 - 8 26 18 - 8
11 to 15 days 23 21 - 3 23 18 - 5
16 to 20 days 13 17 4 13 18 5
21 to 25 days 6 15 8 6 13 7
26+ days 4 14 10 4 17 13
Source: SNAP Food Security Survey 2012.
Note: The cross- sectional estimates compare new SNAP participants to a contemporaneous set of participants who have been receiving SNAP for about six months. The longitudinal estimates
compare new SNAP participants to the same participants about six months later. Tabulations are based on the following overall sample sizes: 3,275 new-entrant householdsand 3,375 six- month households in the cross- sectional sample; and 3,275 new- entranthouseholds observed at baseline and again at follow up six months later in the longitudinalsample. Individual panels within tables may have slightly fewer observations due to itemnonresponse to individual questions.
We re-estimated our original specification including “days since benefit receipt” as one of theexplanatory variables. In this specification, SNAP was associated with an increase in TFP-adjustedexpenditures of 0.051 in the cross-sectional sample (Table G.9). This is similar to the estimate in ourmain specification of 0.047. In the longitudinal analysis, SNAP continued not to be statistically associated with TFP-adjusted expenditures.
Table G.9. Associations Between SNAP Participation and Household Food Spending Relative to theCost of the TFP, by Six- Month and New- Entrant SNAP Participation Status and by Whether ModelIncludes “Days Since SNAP Benefit Receipt” Variable
Cross- Sectional Estimates Longitudinal Estimates
Coefficienton SNAP
ParticipationStandard
Error p - Value
Coefficienton SNAP
ParticipationStandard
Error p - Value
Main Model Specification 0.047* 0.025 0.065 0.027 0.025 0.279
Alternative Model thatIncludes “Days Since BenefitReceipt” as Explanatory
Variable
0.051** 0.026 0.050 0.041 0.026 0.110
Source: SNAP Food Security Survey 2012.
Note: The cross- sectional estimates compare new SNAP participants to a contemporaneous set of participants who have been receiving SNAP for about six months. The longitudinal estimatescompare new SNAP participants to the same participants about six months later.
Cross- sectional estimates are based on a data set with 6,650 households (3,275 new- entranthouseholds and 3,375 six- month households). Longitudinal estimates are based on a data setwith 3,275 new- entrant households observed at baseline and again at follow- up six monthslater.
*, **, *** Significantly different from zero at the 0.10, 0.05, and 0.01 level, respectively.
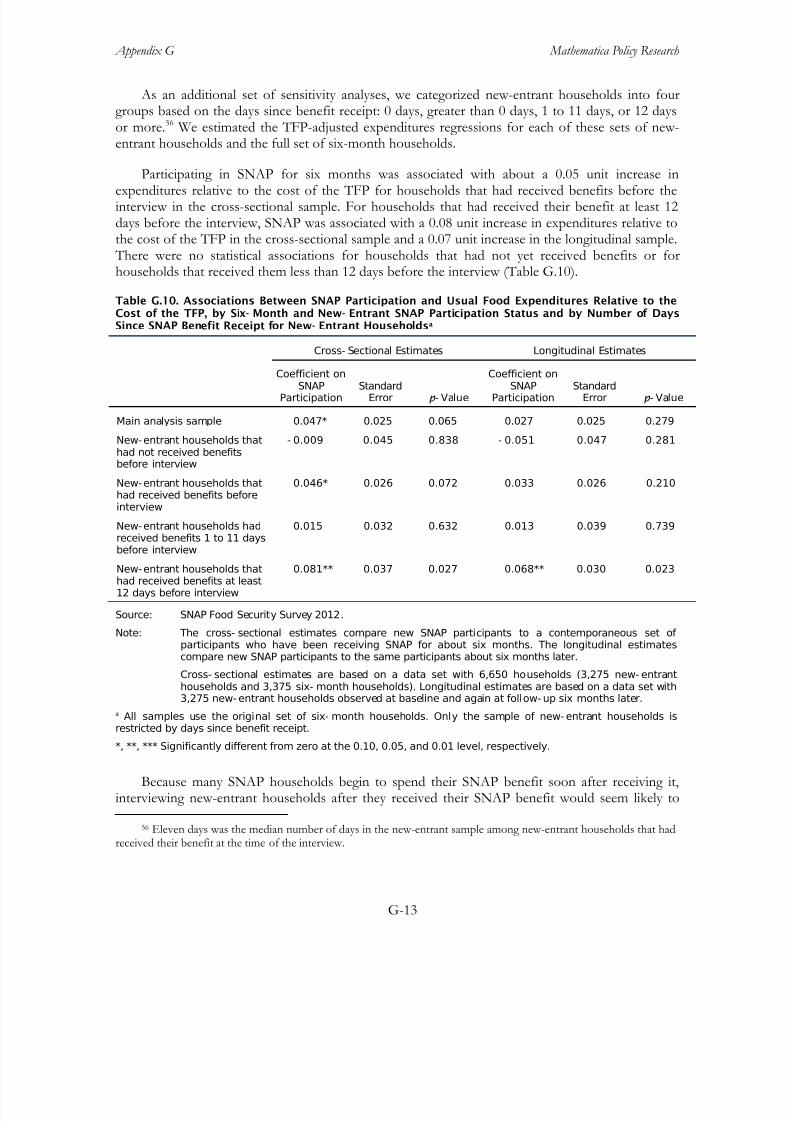
8/22/2019 USDA Report re SNAP & Food Security 08/2013
http://slidepdf.com/reader/full/usda-report-re-snap-food-security-082013 197/355
Appendix G Mathematica Policy Research
G-13
As an additional set of sensitivity analyses, we categorized new-entrant households into fourgroups based on the days since benefit receipt: 0 days, greater than 0 days, 1 to 11 days, or 12 daysor more.56
Participating in SNAP for six months was associated with about a 0.05 unit increase inexpenditures relative to the cost of the TFP for households that had received benefits before theinterview in the cross-sectional sample. For households that had received their benefit at least 12days before the interview, SNAP was associated with a 0.08 unit increase in expenditures relative tothe cost of the TFP in the cross-sectional sample and a 0.07 unit increase in the longitudinal sample. There were no statistical associations for households that had not yet received benefits or forhouseholds that received them less than 12 days before the interview (Table G.10).
We estimated the TFP-adjusted expenditures regressions for each of these sets of new-entrant households and the full set of six-month households.
Table G.10. Associations Between SNAP Participation and Usual Food Expenditures Relative to theCost of the TFP, by Six- Month and New- Entrant SNAP Participation Status and by Number of DaysSince SNAP Benefit Receipt for New- Entrant Householdsa
Cross- Sectional Estimates Longitudinal Estimates
Coefficient onSNAP
ParticipationStandard
Error p - Value
Coefficient onSNAP
ParticipationStandard
Error p - Value
Main analysis sample 0.047* 0.025 0.065 0.027 0.025 0.279
New-entrant households thathad not received benefitsbefore interview
- 0.009 0.045 0.838 - 0.051 0.047 0.281
New-entrant households thathad received benefits beforeinterview
0.046* 0.026 0.072 0.033 0.026 0.210
New-entrant households hadreceived benefits 1 to 11 days
before interview
0.015 0.032 0.632 0.013 0.039 0.739
New-entrant households thathad received benefits at least12 days before interview
0.081** 0.037 0.027 0.068** 0.030 0.023
Source: SNAP Food Security Survey 2012.
Note: The cross- sectional estimates compare new SNAP participants to a contemporaneous set of participants who have been receiving SNAP for about six months. The longitudinal estimatescompare new SNAP participants to the same participants about six months later.
Cross- sectional estimates are based on a data set with 6,650 households (3,275 new- entranthouseholds and 3,375 six- month households). Longitudinal estimates are based on a data set with3,275 new- entrant households observed at baseline and again at follow- up six months later.
a All samples use the original set of six- month households. Only the sample of new- entrant households isrestricted by days since benefit receipt.
*, **, *** Significantly different from zero at the 0.10, 0.05, and 0.01 level, respectively.
Because many SNAP households begin to spend their SNAP benefit soon after receiving it,interviewing new-entrant households after they received their SNAP benefit would seem likely to
56 Eleven days was the median number of days in the new-entrant sample among new-entrant households that hadreceived their benefit at the time of the interview.
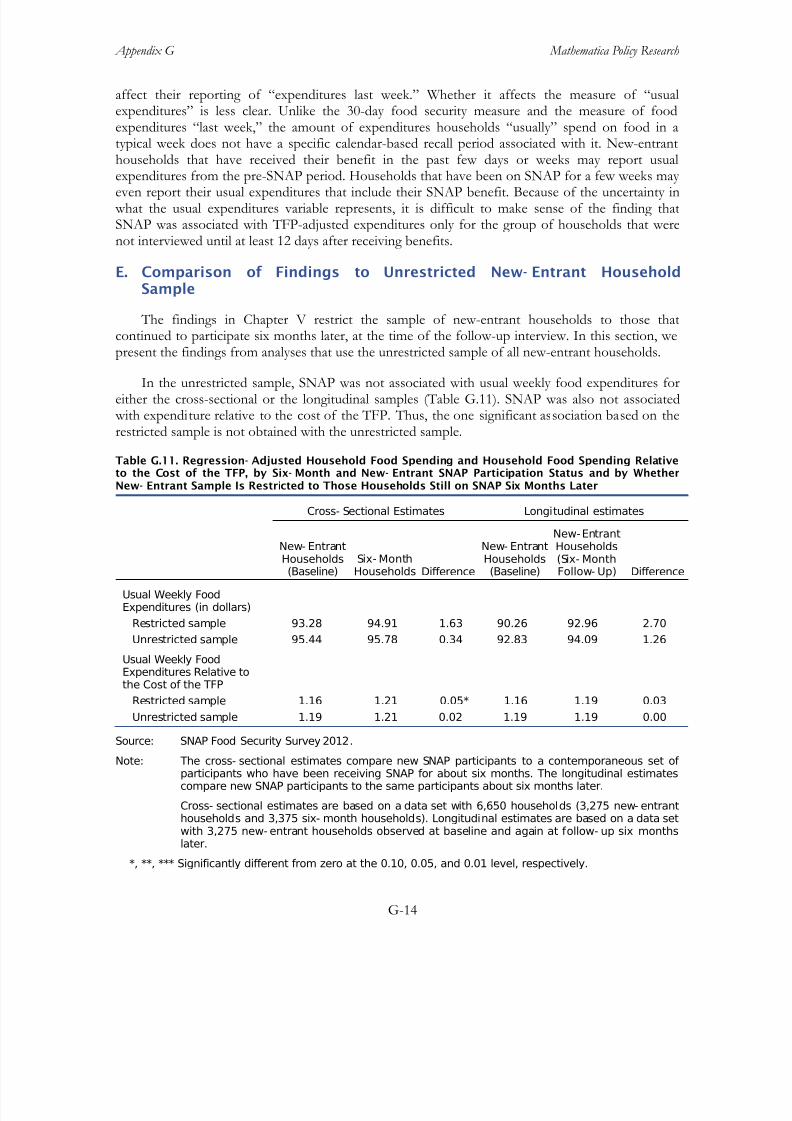
8/22/2019 USDA Report re SNAP & Food Security 08/2013
http://slidepdf.com/reader/full/usda-report-re-snap-food-security-082013 198/355
Appendix G Mathematica Policy Research
G-14
affect their reporting of “expenditures last week.” Whether it affects the measure of “usualexpenditures” is less clear. Unlike the 30-day food security measure and the measure of foodexpenditures “last week,” the amount of expenditures households “usually” spend on food in atypical week does not have a specific calendar-based recall period associated with it. New-entranthouseholds that have received their benefit in the past few days or weeks may report usual
expenditures from the pre-SNAP period. Households that have been on SNAP for a few weeks may even report their usual expenditures that include their SNAP benefit. Because of the uncertainty in what the usual expenditures variable represents, it is difficult to make sense of the finding thatSNAP was associated with TFP-adjusted expenditures only for the group of households that werenot interviewed until at least 12 days after receiving benefits.
E. Comparison of Findings to Unrestricted New- Entrant HouseholdSample
The findings in Chapter V restrict the sample of new-entrant households to those thatcontinued to participate six months later, at the time of the follow-up interview. In this section, wepresent the findings from analyses that use the unrestricted sample of all new-entrant households.
In the unrestricted sample, SNAP was not associated with usual weekly food expenditures foreither the cross-sectional or the longitudinal samples (Table G.11). SNAP was also not associated with expenditure relative to the cost of the TFP. Thus, the one significant association based on therestricted sample is not obtained with the unrestricted sample.
Table G.11. Regression- Adjusted Household Food Spending and Household Food Spending Relativeto the Cost of the TFP, by Six- Month and New- Entrant SNAP Participation Status and by WhetherNew- Entrant Sample Is Restricted to Those Households Still on SNAP Six Months Later
Cross- Sectional Estimates Longitudinal estimates
New- EntrantHouseholds(Baseline)
Six- MonthHouseholds Difference
New- EntrantHouseholds(Baseline)
New-Entrant
Households(Six- MonthFollow- Up) Difference
Usual Weekly FoodExpenditures (in dollars)
Restricted sample 93.28 94.91 1.63 90.26 92.96 2.70
Unrestricted sample 95.44 95.78 0.34 92.83 94.09 1.26
Usual Weekly FoodExpenditures Relative tothe Cost of the TFP
Restricted sample 1.16 1.21 0.05* 1.16 1.19 0.03
Unrestricted sample 1.19 1.21 0.02 1.19 1.19 0.00
Source: SNAP Food Security Survey 2012.
Note: The cross- sectional estimates compare new SNAP participants to a contemporaneous set of participants who have been receiving SNAP for about six months. The longitudinal estimatescompare new SNAP participants to the same participants about six months later.
Cross- sectional estimates are based on a data set with 6,650 households (3,275 new- entranthouseholds and 3,375 six- month households). Longitudinal estimates are based on a data setwith 3,275 new- entrant households observed at baseline and again at follow- up six monthslater.
*, **, *** Significantly different from zero at the 0.10, 0.05, and 0.01 level, respectively.
8/22/2019 USDA Report re SNAP & Food Security 08/2013
http://slidepdf.com/reader/full/usda-report-re-snap-food-security-082013 199/355
Appendix G Mathematica Policy Research
G-15
F. Potential Reporting Error for Expenditure Questions
As mentioned in Chapter V, another possible explanation for our unexpected findings regarding the association between SNAP and food expenditures is that, for some respondents, the questionsequence may not have elicited the desired information about expenditures. We consider thispossibility here.
In gathering the “expenditures last week” information, the module asked a set of questionsdisaggregated by type of food store. These were then aggregated across stores in conducting theanalysis. A separate question that came after the “last week” questions asked about usual weekly food expenditures. Both types of questions explicitly asked respondents to include purchases made with SNAP benefits.
This question structure is included in the CPS-FSS, on which the annual volumes of the“Household Food Security in the United States” report, produced by ERS, are based. To the best of our knowledge, no major difficulties with the CPS data have been identified.
However, the fact that we obtained a nontrivial percentage of households that reported usually spending zero dollars on food in both our baseline and follow-up surveys raises issues regarding how respondents interpreted the questions. The percentages of households that reported they usually spend zero dollars on food in a typical week were 4.7 and 5.0 percent for new-entrant andsix-month households in the cross-sectional sample, and 4.7 and 3.4 percent, respectively, in thelongitudinal sample. If respondents who were receiving SNAP benefits at the time correctly understood the question, they would presumably report a positive usual weekly expenditure—thatmade with SNAP benefits. Therefore, correct responses of “zero usual expenditures” seem unlikely,particularly for the households that have been on SNAP for six months.
The existence of “zero expenditure” responses raises issues not only about the data for thoserespondents themselves, but also about whether other respondents may have failed to include SNAPbenefits in reporting their expenditures. It is uncertain what effects any potential reporting errormight have on the association between SNAP and food expenditures.
G. Relationship Between SNAP Benefit Amount and Food Expenditures
As another diagnostic assessment of the quality of the reported expenditure data, we estimatedthe association between SNAP benefit amount and reported usual food expenditures for six-monthhouseholds to determine whether households that receive greater amounts in SNAP benefits spendmore on food. The purpose of this assessment was to determine whether the association fell withinthe range of estimates presented in a previous study (Fraker 1990) in a literature review of the effectsof SNAP on food consumption.
Fraker (1990) summarized the findings from 17 studies, spanning two decades, of the effects of SNAP on the money value of food used by households.57
57 The study first reviewed the association between SNAP benefits and food expenditures. Next, it compared the
association between SNAP benefits and food expenditures to the association between cash income and foodexpenditures to consider the implications of the differences for the effectiveness of food coupons versus cash assistanceat increasing food expenditures. It also examined the effects of SNAP on the availability of nutrients in the householdfrom the home food supply and the effects of SNAP on the intake of nutrient by individuals.
The underlying data sets, analytic
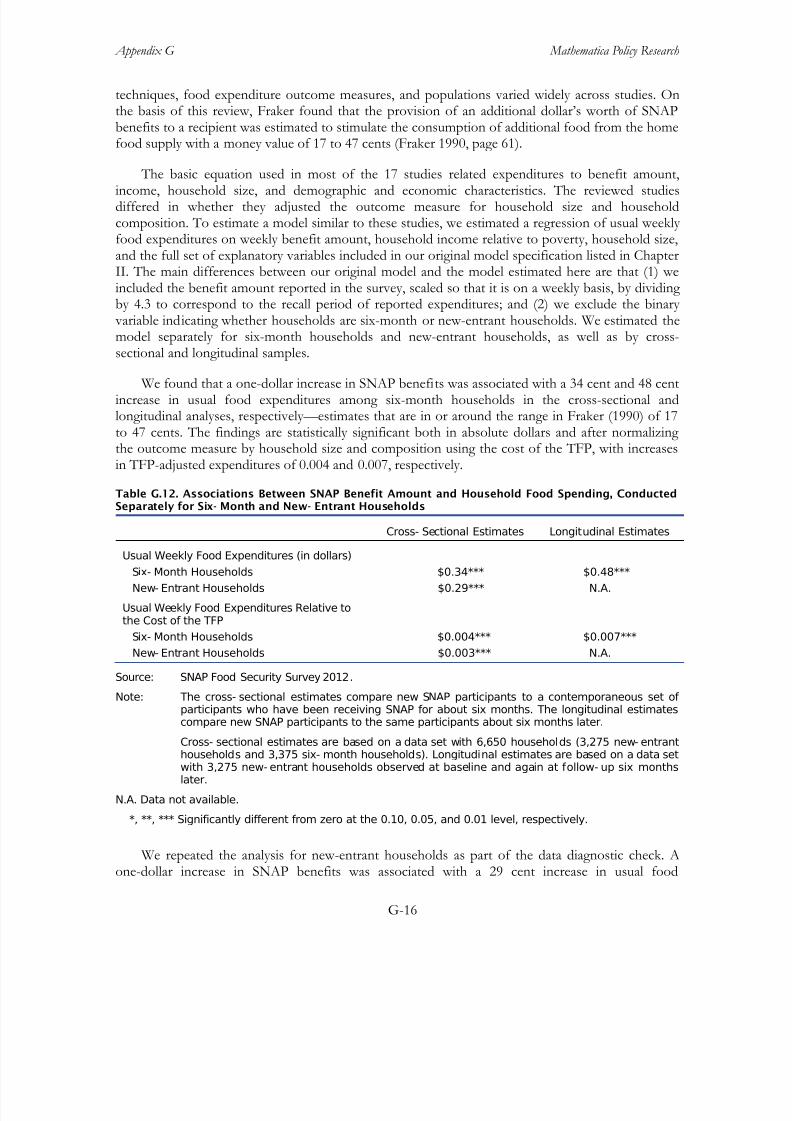
8/22/2019 USDA Report re SNAP & Food Security 08/2013
http://slidepdf.com/reader/full/usda-report-re-snap-food-security-082013 200/355
Appendix G Mathematica Policy Research
G-16
techniques, food expenditure outcome measures, and populations varied widely across studies. Onthe basis of this review, Fraker found that the provision of an additional dollar’s worth of SNAPbenefits to a recipient was estimated to stimulate the consumption of additional food from the homefood supply with a money value of 17 to 47 cents (Fraker 1990, page 61).
The basic equation used in most of the 17 studies related expenditures to benefit amount,income, household size, and demographic and economic characteristics. The reviewed studiesdiffered in whether they adjusted the outcome measure for household size and householdcomposition. To estimate a model similar to these studies, we estimated a regression of usual weekly food expenditures on weekly benefit amount, household income relative to poverty, household size,and the full set of explanatory variables included in our original model specification listed in ChapterII. The main differences between our original model and the model estimated here are that (1) weincluded the benefit amount reported in the survey, scaled so that it is on a weekly basis, by dividing by 4.3 to correspond to the recall period of reported expenditures; and (2) we exclude the binary variable indicating whether households are six-month or new-entrant households. We estimated themodel separately for six-month households and new-entrant households, as well as by cross-sectional and longitudinal samples.
We found that a one-dollar increase in SNAP benefits was associated with a 34 cent and 48 centincrease in usual food expenditures among six-month households in the cross-sectional andlongitudinal analyses, respectively—estimates that are in or around the range in Fraker (1990) of 17to 47 cents. The findings are statistically significant both in absolute dollars and after normalizing the outcome measure by household size and composition using the cost of the TFP, with increasesin TFP-adjusted expenditures of 0.004 and 0.007, respectively.
Table G.12. Associations Between SNAP Benefit Amount and Household Food Spending, ConductedSeparately for Six- Month and New- Entrant Households
Cross- Sectional Estimates Longitudinal Estimates
Usual Weekly Food Expenditures (in dollars)
Six- Month Households $0.34*** $0.48***
New- Entrant Households $0.29*** N.A.
Usual Weekly Food Expenditures Relative tothe Cost of the TFP
Six- Month Households $0.004*** $0.007***
New- Entrant Households $0.003*** N.A.
Source: SNAP Food Security Survey 2012.
Note: The cross- sectional estimates compare new SNAP participants to a contemporaneous set of participants who have been receiving SNAP for about six months. The longitudinal estimatescompare new SNAP participants to the same participants about six months later.
Cross- sectional estimates are based on a data set with 6,650 households (3,275 new- entranthouseholds and 3,375 six- month households). Longitudinal estimates are based on a data setwith 3,275 new- entrant households observed at baseline and again at follow- up six monthslater.
N.A. Data not available.
*, **, *** Significantly different from zero at the 0.10, 0.05, and 0.01 level, respectively.
We repeated the analysis for new-entrant households as part of the data diagnostic check. Aone-dollar increase in SNAP benefits was associated with a 29 cent increase in usual food

8/22/2019 USDA Report re SNAP & Food Security 08/2013
http://slidepdf.com/reader/full/usda-report-re-snap-food-security-082013 201/355
Appendix G Mathematica Policy Research
G-17
expenditures among new-entrant households (Table G.12) in both the cross-sectional andlongitudinal samples. If reported expenditures reflected the period before receiving SNAP benefits, we would only expect a positive association between benefit amount and food expenditures if there was a third variable correlated with both benefits and expenditures. We believe we have accountedfor most of those likely factors (household size, household composition, income, region of
residence). Thus, we believe the new-entrant findings are consistent with the points made earlier thatmany of the baseline respondents had received their initial benefits before the survey and that somemay have included food bought with these initial allotments in their reported “usual” expenditures.
Overall, this analysis suggests that limitations in our ability to collect accurate data on usualspending by new-entrant households may have affected our ability to estimate accurately theassociation between SNAP participation and food spending.

8/22/2019 USDA Report re SNAP & Food Security 08/2013
http://slidepdf.com/reader/full/usda-report-re-snap-food-security-082013 202/355
This page has been left blank for double-sided copying.

8/22/2019 USDA Report re SNAP & Food Security 08/2013
http://slidepdf.com/reader/full/usda-report-re-snap-food-security-082013 203/355
APPENDIX H
SUBGROUP SAMPLE SIZES

8/22/2019 USDA Report re SNAP & Food Security 08/2013
http://slidepdf.com/reader/full/usda-report-re-snap-food-security-082013 204/355
This page has been left blank for double-sided copying.
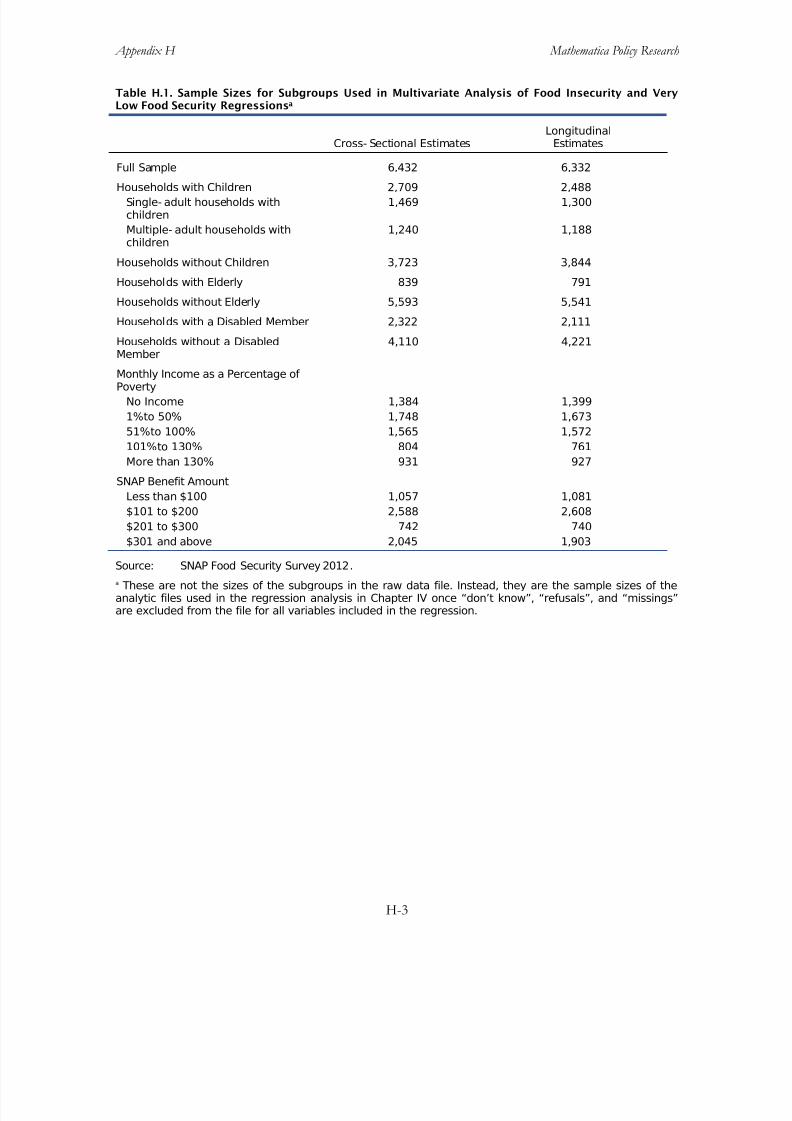
8/22/2019 USDA Report re SNAP & Food Security 08/2013
http://slidepdf.com/reader/full/usda-report-re-snap-food-security-082013 205/355
Appendix H Mathematica Policy Research
H-3
Table H.1. Sample Sizes for Subgroups Used in Multivariate Analysis of Food Insecurity and VeryLow Food Security Regressionsa
Cross- Sectional EstimatesLongitudinal
Estimates
Full Sample 6,432 6,332
Households with Children 2,709 2,488
Single- adult households withchildren
1,469 1,300
Multiple- adult households withchildren
1,240 1,188
Households without Children 3,723 3,844
Households with Elderly 839 791
Households without Elderly 5,593 5,541
Households with a Disabled Member 2,322 2,111
Households without a DisabledMember
4,110 4,221
Monthly Income as a Percentage of Poverty
No Income 1,384 1,399
1%to 50% 1,748 1,673
51%to 100% 1,565 1,572
101%to 130% 804 761
More than 130% 931 927
SNAP Benefit Amount
Less than $100 1,057 1,081
$101 to $200 2,588 2,608
$201 to $300 742 740
$301 and above 2,045 1,903
Source: SNAP Food Security Survey 2012.
a These are not the sizes of the subgroups in the raw data file. Instead, they are the sample sizes of theanalytic files used in the regression analysis in Chapter IV once “don’t know”, “refusals”, and “missings”are excluded from the file for all variables included in the regression.

8/22/2019 USDA Report re SNAP & Food Security 08/2013
http://slidepdf.com/reader/full/usda-report-re-snap-food-security-082013 206/355
This page has been left blank for double-sided copying.
8/22/2019 USDA Report re SNAP & Food Security 08/2013
http://slidepdf.com/reader/full/usda-report-re-snap-food-security-082013 207/355
APPENDIX I
BASELINE CHARACTERISTICS OF NEW- ENTRANT HOUSEHOLDS WITH AND
WITHOUT A FOLLOW- UP INTERVIEW

8/22/2019 USDA Report re SNAP & Food Security 08/2013
http://slidepdf.com/reader/full/usda-report-re-snap-food-security-082013 208/355
This page has been left blank for double-sided copying.
8/22/2019 USDA Report re SNAP & Food Security 08/2013
http://slidepdf.com/reader/full/usda-report-re-snap-food-security-082013 209/355
Appendix I Mathematica Policy Research
I-3
In this appendix, we use tabular methods to examine the characteristics of new-entrant SNAPhouseholds by whether the household completed a follow-up interview approximately six monthslater. Because all characteristics are measured at the time of the baseline interview, we have removedthe table headers indicating whether estimates are from the cross-sectional or longitudinal analysis.Estimates are presented for all new-entrant households (column 1); new-entrant households at
baseline that completed a follow-up interview about six months later (column 2); and new-entranthouseholds at baseline that did not complete a follow-up interview (column 3). The fourth columnsubtracts the estimate for households without a follow-up interview (column 3) from the estimatefor households with a follow-up interview (column 2). All analyses are weighted using survey weights for new-entrant households.58
The tables are structured the same as the Appendix B tables.
58 The weights differ from those used in Chapters III through V and Appendices B through H in that they havenot been normalized to sum to the sum of the weights of the six-month households.
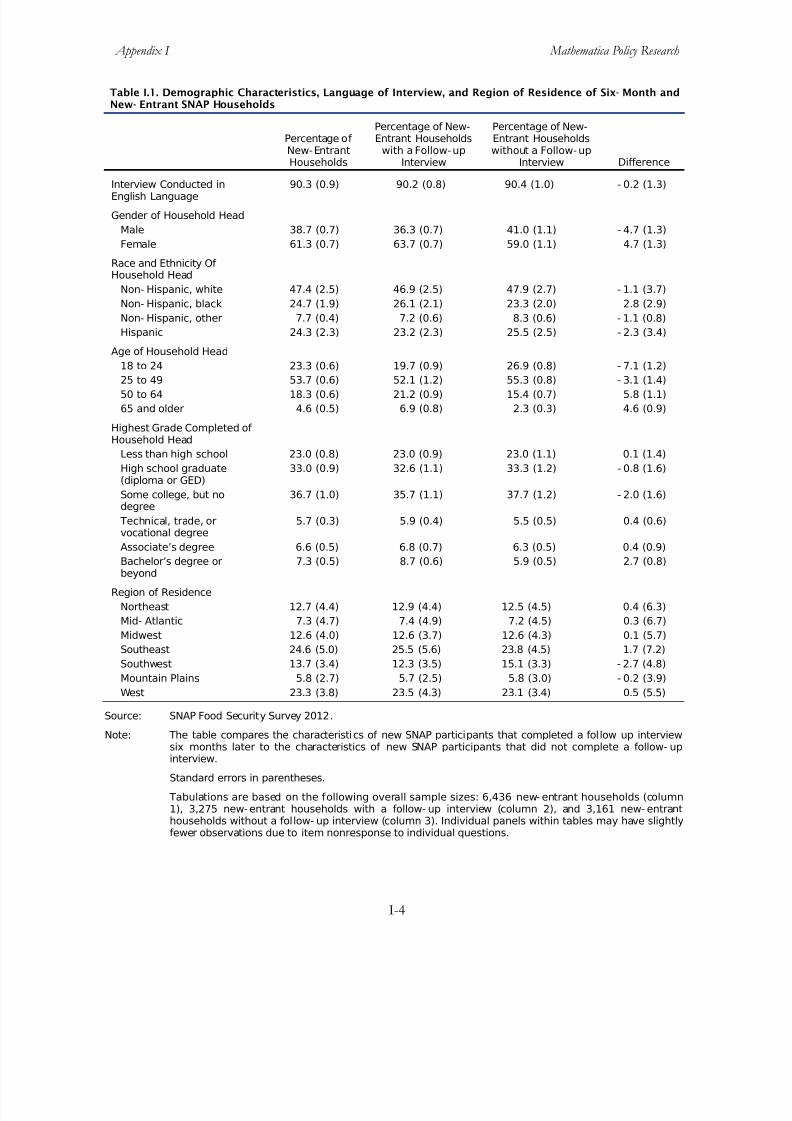
8/22/2019 USDA Report re SNAP & Food Security 08/2013
http://slidepdf.com/reader/full/usda-report-re-snap-food-security-082013 210/355
Appendix I Mathematica Policy Research
I-4
Table I.1. Demographic Characteristics, Language of Interview, and Region of Residence of Six- Month andNew- Entrant SNAP Households
Percentage of New-EntrantHouseholds
Percentage of New-Entrant Households
with a Follow-upInterview
Percentage of New-Entrant Householdswithout a Follow-up
Interview Difference
Interview Conducted inEnglish Language
90.3 (0.9) 90.2 (0.8) 90.4 (1.0) - 0.2 (1.3)
Gender of Household Head
Male 38.7 (0.7) 36.3 (0.7) 41.0 (1.1) - 4.7 (1.3)
Female 61.3 (0.7) 63.7 (0.7) 59.0 (1.1) 4.7 (1.3)
Race and Ethnicity Of Household Head
Non- Hispanic, white 47.4 (2.5) 46.9 (2.5) 47.9 (2.7) - 1.1 (3.7)
Non- Hispanic, black 24.7 (1.9) 26.1 (2.1) 23.3 (2.0) 2.8 (2.9)
Non- Hispanic, other 7.7 (0.4) 7.2 (0.6) 8.3 (0.6) - 1.1 (0.8)
Hispanic 24.3 (2.3) 23.2 (2.3) 25.5 (2.5) - 2.3 (3.4)
Age of Household Head
18 to 24 23.3 (0.6) 19.7 (0.9) 26.9 (0.8) - 7.1 (1.2)25 to 49 53.7 (0.6) 52.1 (1.2) 55.3 (0.8) - 3.1 (1.4)
50 to 64 18.3 (0.6) 21.2 (0.9) 15.4 (0.7) 5.8 (1.1)
65 and older 4.6 (0.5) 6.9 (0.8) 2.3 (0.3) 4.6 (0.9)
Highest Grade Completed of Household Head
Less than high school 23.0 (0.8) 23.0 (0.9) 23.0 (1.1) 0.1 (1.4)
High school graduate(diploma or GED)
33.0 (0.9) 32.6 (1.1) 33.3 (1.2) - 0.8 (1.6)
Some college, but nodegree
36.7 (1.0) 35.7 (1.1) 37.7 (1.2) - 2.0 (1.6)
Technical, trade, orvocational degree
5.7 (0.3) 5.9 (0.4) 5.5 (0.5) 0.4 (0.6)
Associate’s degree 6.6 (0.5) 6.8 (0.7) 6.3 (0.5) 0.4 (0.9)Bachelor’s degree orbeyond
7.3 (0.5) 8.7 (0.6) 5.9 (0.5) 2.7 (0.8)
Region of Residence
Northeast 12.7 (4.4) 12.9 (4.4) 12.5 (4.5) 0.4 (6.3)
Mid- Atlantic 7.3 (4.7) 7.4 (4.9) 7.2 (4.5) 0.3 (6.7)
Midwest 12.6 (4.0) 12.6 (3.7) 12.6 (4.3) 0.1 (5.7)
Southeast 24.6 (5.0) 25.5 (5.6) 23.8 (4.5) 1.7 (7.2)
Southwest 13.7 (3.4) 12.3 (3.5) 15.1 (3.3) - 2.7 (4.8)
Mountain Plains 5.8 (2.7) 5.7 (2.5) 5.8 (3.0) - 0.2 (3.9)
West 23.3 (3.8) 23.5 (4.3) 23.1 (3.4) 0.5 (5.5)
Source: SNAP Food Security Survey 2012.
Note: The table compares the characteristics of new SNAP participants that completed a follow up interviewsix months later to the characteristics of new SNAP participants that did not complete a follow- upinterview.
Standard errors in parentheses.
Tabulations are based on the following overall sample sizes: 6,436 new- entrant households (column1), 3,275 new-entrant households with a follow- up interview (column 2), and 3,161 new- entranthouseholds without a follow- up interview (column 3). Individual panels within tables may have slightlyfewer observations due to item nonresponse to individual questions.

8/22/2019 USDA Report re SNAP & Food Security 08/2013
http://slidepdf.com/reader/full/usda-report-re-snap-food-security-082013 211/355
Appendix I Mathematica Policy Research
I-5
Table I.2. Household Size and Composition of Six- Month and New- Entrant SNAP Households
Percentage of New- EntrantHouseholds
Percentage of New-Entrant Households
with a Follow-upInterview
Percentage of New-Entrant Householdswithout a Follow- up
Interview Difference
Household Size
1 Person 36.8 (0.8) 38.4 (1.1) 35.1 (1.0) 3.3 (1.5)
2 Person 24.0 (0.7) 24.6 (1.1) 23.4 (1.0) 1.2 (1.5)
3 Person 18.3 (0.4) 17.6 (0.6) 19.0 (0.7) - 1.4 (0.9)
4 Person 11.1 (0.5) 10.0 (0.5) 12.2 (0.8) - 2.2 (0.9)
5 Person 5.7 (0.4) 5.6 (0.5) 5.8 (0.5) - 0.1 (0.7)
6+ Person 4.1 (0.2) 3.7 (0.4) 4.5 (0.3) - 0.7 (0.5)
Households with Children 42.5 (0.8) 40.7 (1.1) 44.3 (1.1) - 3.5 (1.6)
Single adult 17.8 (0.5) 17.9 (0.7) 17.6 (0.8) 0.3 (1.1)
Multiple adults 24.7 (0.7) 22.8 (0.9) 26.6 (1) - 3.8 (1.3)
Households withoutChildren
57.5 (0.8) 59.3 (1.1) 55.7 (1.1) 3.6 (1.6)
Households with Elderly 8.9 (0.5) 12.2 (0.8) 5.7 (0.5) 6.5 (0.9)
Elderly living alone 2.8 (0.3) 4.3 (0.4) 1.3 (0.2) 3.0 (0.4)
Elderly living with others 6.1 (0.4) 7.9 (0.6) 4.4 (0.4) 3.5 (0.7)
Households without Elderly 91.1 (0.5) 87.8 (0.8) 94.3 (0.5) - 6.5 (0.9)
Households with aDisabled Member
28.2 (0.9) 32.4 (1.2) 23.9 (0.9) 8.5 (1.5)
Households without aDisabled Member
71.8 (0.9) 67.6 (1.2) 76.1 (0.9) - 8.5 (1.5)
Source: SNAP Food Security Survey 2012.
Note: The table compares the characteristics of new SNAP participants that completed a follow up
interview six months later to the characteristics of new SNAP participants that did notcomplete a follow- up interview.
Standard errors in parentheses.
Tabulations are based on the following overall sample sizes: 6,436 new-entrant households(column 1), 3,275 new- entrant households with a follow- up interview (column 2), and 3,161new- entrant households without a follow- up interview (column 3). Individual panels withintables may have slightly fewer observations due to item nonresponse to individual questions..
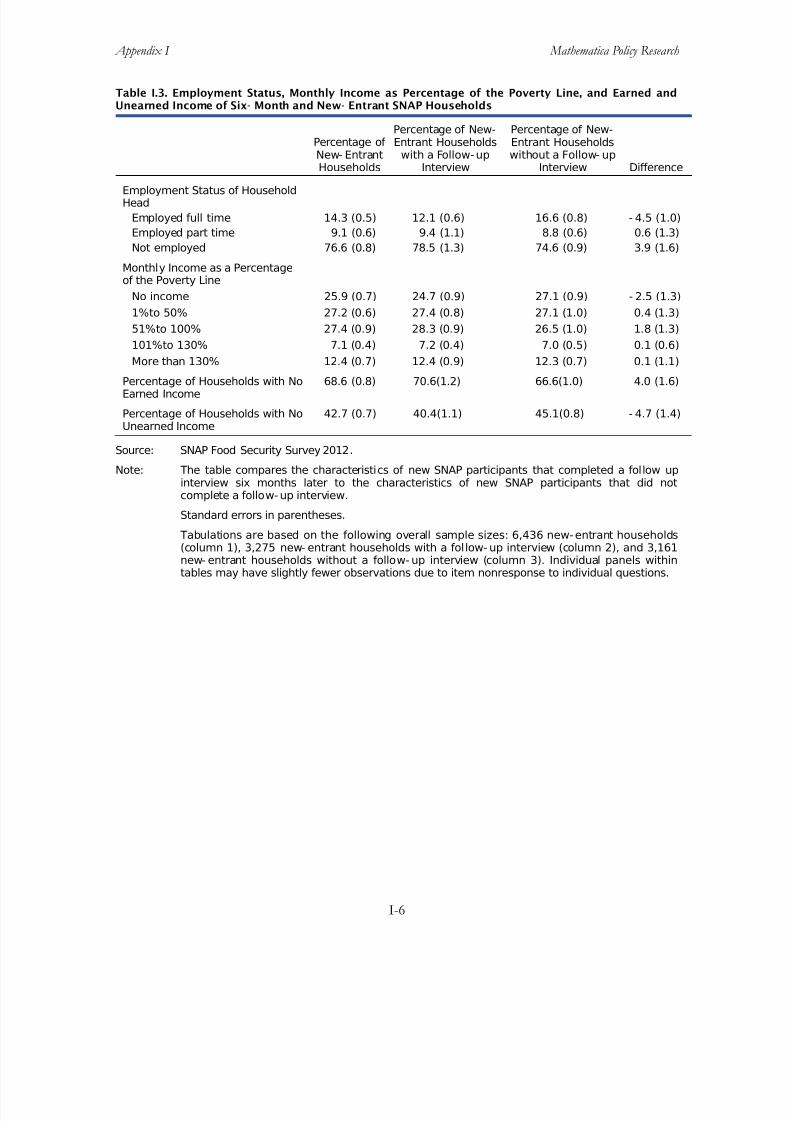
8/22/2019 USDA Report re SNAP & Food Security 08/2013
http://slidepdf.com/reader/full/usda-report-re-snap-food-security-082013 212/355
Appendix I Mathematica Policy Research
I-6
Table I.3. Employment Status, Monthly Income as Percentage of the Poverty Line, and Earned andUnearned Income of Six- Month and New- Entrant SNAP Households
Percentage of New- EntrantHouseholds
Percentage of New-Entrant Households
with a Follow-upInterview
Percentage of New-Entrant Householdswithout a Follow- up
Interview Difference
Employment Status of HouseholdHead
Employed full time 14.3 (0.5) 12.1 (0.6) 16.6 (0.8) - 4.5 (1.0)
Employed part time 9.1 (0.6) 9.4 (1.1) 8.8 (0.6) 0.6 (1.3)
Not employed 76.6 (0.8) 78.5 (1.3) 74.6 (0.9) 3.9 (1.6)
Monthly Income as a Percentageof the Poverty Line
No income 25.9 (0.7) 24.7 (0.9) 27.1 (0.9) - 2.5 (1.3)
1%to 50% 27.2 (0.6) 27.4 (0.8) 27.1 (1.0) 0.4 (1.3)
51%to 100% 27.4 (0.9) 28.3 (0.9) 26.5 (1.0) 1.8 (1.3)
101%to 130% 7.1 (0.4) 7.2 (0.4) 7.0 (0.5) 0.1 (0.6)
More than 130% 12.4 (0.7) 12.4 (0.9) 12.3 (0.7) 0.1 (1.1)
Percentage of Households with NoEarned Income
68.6 (0.8) 70.6(1.2) 66.6(1.0) 4.0 (1.6)
Percentage of Households with NoUnearned Income
42.7 (0.7) 40.4(1.1) 45.1(0.8) - 4.7 (1.4)
Source: SNAP Food Security Survey 2012.
Note: The table compares the characteristics of new SNAP participants that completed a follow upinterview six months later to the characteristics of new SNAP participants that did notcomplete a follow- up interview.
Standard errors in parentheses.
Tabulations are based on the following overall sample sizes: 6,436 new-entrant households
(column 1), 3,275 new- entrant households with a follow- up interview (column 2), and 3,161new- entrant households without a follow- up interview (column 3). Individual panels withintables may have slightly fewer observations due to item nonresponse to individual questions.

8/22/2019 USDA Report re SNAP & Food Security 08/2013
http://slidepdf.com/reader/full/usda-report-re-snap-food-security-082013 213/355
Appendix I Mathematica Policy Research
I-7
Table I.4. Income Sources and Average Monthly Income Amounts of Six- Month and New- EntrantSNAP Households
Percentage of New- EntrantHouseholds
Percentage of New-Entrant Households
with a Follow-upInterview
Percentage of New-Entrant Householdswithout a Follow- up
Interview Difference
Percentage of Householdswith Income Type
TANF 2.2 (0.2) 2.5 (0.4) 1.8 (0.3) 0.8 (0.5)
Social Security 17.9 (1.2) 21.1 (1.3) 14.7 (1.2) 6.4 (1.8)
SSI or Supplemental SecurityIncome
7.7 (0.6) 9.1 (0.7) 6.3 (0.6) 2.8 (0.9)
Unemployment insurance orworker's compensationbenefits
9.4 (0.5) 9.6 (0.7) 9.1 (0.6) 0.5 (0.9)
Child support payments 6.0 (0.3) 5.2 (0.5) 6.8 (0.5) - 1.5 (0.7)
Financial support fromfriends or family
29.8 (0.6) 28.6 (0.7) 31.0 (0.8) - 2.4 (1.1)
Other income 7.8 (0.3) 8.4 (0.6) 7.2 (0.5) - 1.2 (0.8)
Median Monthly IncomeAmount among Householdswith Positive Income from theSpecified Source (in dollars)
TANF 300.0 254.0 361.0 - 107.0
Social Security 801.0 821.0 776.0 45.0
Supplemental SecurityIncome (SSI)
674.0 674.0 674.0 0.0
Unemployment insurance orworker's compensationbenefits
624.0 600.0 696.0 - 96.0
Child support payments 292.0 281.0 292.0 - 11.0
Financial support fromfriends or family
150.0 130.0 150.0 - 20.0
Other income 335.0 316.0 350.0 - 34.0
Source: SNAP Food Security Survey 2012.
Note: The table compares the characteristics of new SNAP participants that completed a follow upinterview six months later to the characteristics of new SNAP participants that did notcomplete a follow- up interview.
Standard errors in parentheses.
Tabulations are based on the following overall sample sizes: 6,436 new-entrant households(column 1), 3,275 new- entrant households with a follow- up interview (column 2), and 3,161new- entrant households without a follow- up interview (column 3). Individual panels withintables may have slightly fewer observations due to item nonresponse to individual questions.
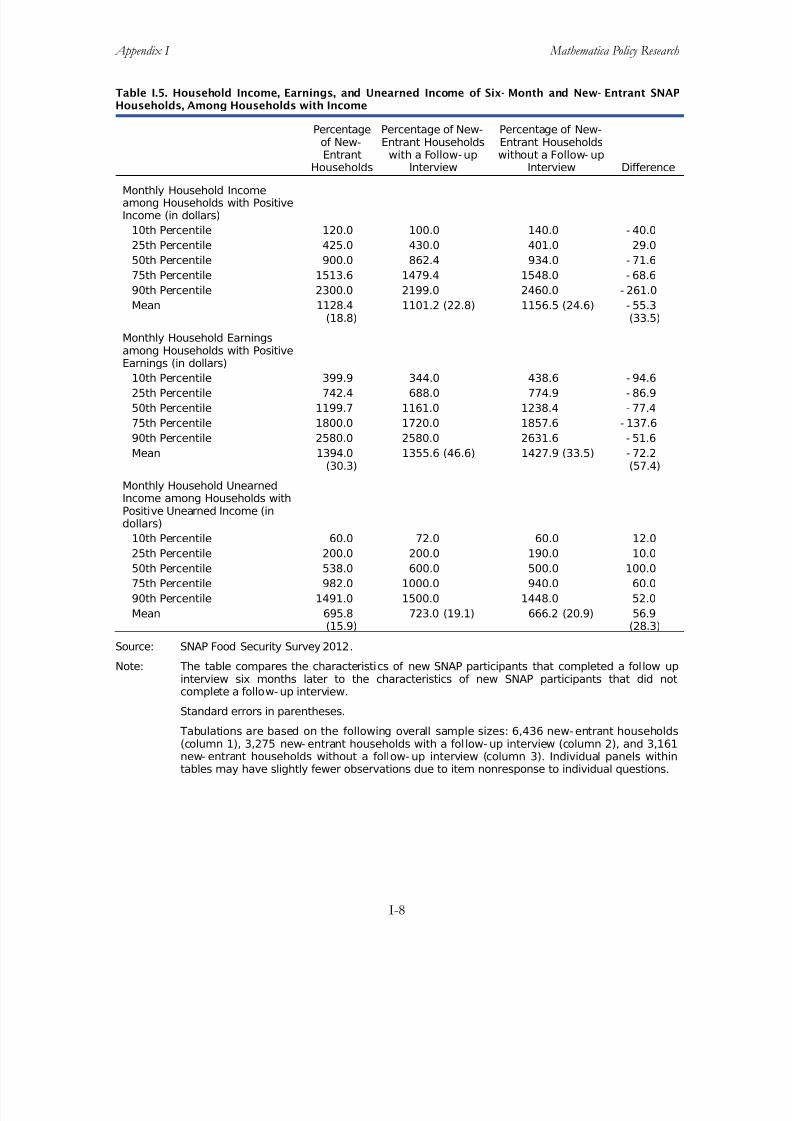
8/22/2019 USDA Report re SNAP & Food Security 08/2013
http://slidepdf.com/reader/full/usda-report-re-snap-food-security-082013 214/355
Appendix I Mathematica Policy Research
I-8
Table I.5. Household Income, Earnings, and Unearned Income of Six- Month and New- Entrant SNAPHouseholds, Among Households with Income
Percentageof New-Entrant
Households
Percentage of New-Entrant Households
with a Follow-upInterview
Percentage of New-Entrant Householdswithout a Follow- up
Interview Difference
Monthly Household Incomeamong Households with PositiveIncome (in dollars)
10th Percentile 120.0 100.0 140.0 - 40.0
25th Percentile 425.0 430.0 401.0 29.0
50th Percentile 900.0 862.4 934.0 - 71.6
75th Percentile 1513.6 1479.4 1548.0 - 68.6
90th Percentile 2300.0 2199.0 2460.0 - 261.0
Mean 1128.4(18.8)
1101.2 (22.8) 1156.5 (24.6) - 55.3(33.5)
Monthly Household Earningsamong Households with Positive
Earnings (in dollars)10th Percentile 399.9 344.0 438.6 - 94.6
25th Percentile 742.4 688.0 774.9 - 86.9
50th Percentile 1199.7 1161.0 1238.4 - 77.4
75th Percentile 1800.0 1720.0 1857.6 - 137.6
90th Percentile 2580.0 2580.0 2631.6 - 51.6
Mean 1394.0(30.3)
1355.6 (46.6) 1427.9 (33.5) - 72.2(57.4)
Monthly Household UnearnedIncome among Households withPositive Unearned Income (indollars)
10th Percentile 60.0 72.0 60.0 12.0
25th Percentile 200.0 200.0 190.0 10.050th Percentile 538.0 600.0 500.0 100.0
75th Percentile 982.0 1000.0 940.0 60.0
90th Percentile 1491.0 1500.0 1448.0 52.0
Mean 695.8(15.9)
723.0 (19.1) 666.2 (20.9) 56.9(28.3)
Source: SNAP Food Security Survey 2012.
Note: The table compares the characteristics of new SNAP participants that completed a follow upinterview six months later to the characteristics of new SNAP participants that did notcomplete a follow- up interview.
Standard errors in parentheses.
Tabulations are based on the following overall sample sizes: 6,436 new-entrant households(column 1), 3,275 new- entrant households with a follow- up interview (column 2), and 3,161new- entrant households without a follow- up interview (column 3). Individual panels withintables may have slightly fewer observations due to item nonresponse to individual questions.
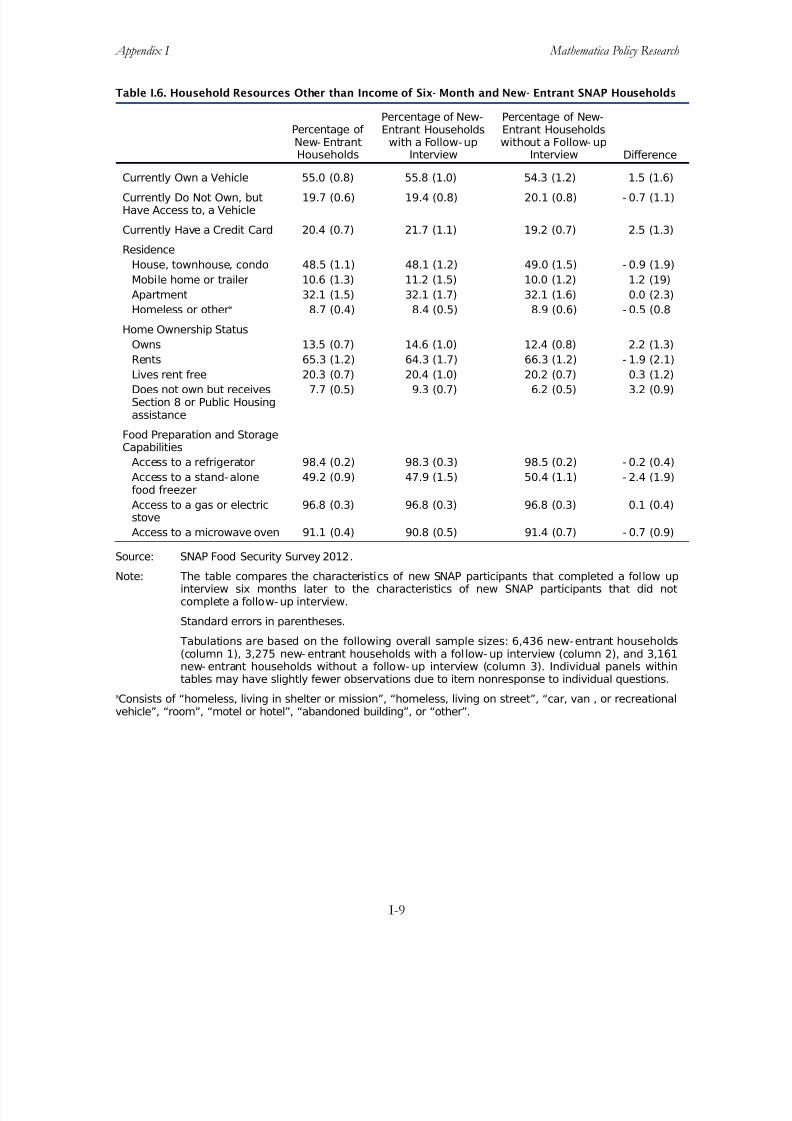
8/22/2019 USDA Report re SNAP & Food Security 08/2013
http://slidepdf.com/reader/full/usda-report-re-snap-food-security-082013 215/355
Appendix I Mathematica Policy Research
I-9
Table I.6. Household Resources Other than Income of Six- Month and New- Entrant SNAP Households
Percentage of New- EntrantHouseholds
Percentage of New-Entrant Households
with a Follow-upInterview
Percentage of New-Entrant Householdswithout a Follow- up
Interview Difference
Currently Own a Vehicle 55.0 (0.8) 55.8 (1.0) 54.3 (1.2) 1.5 (1.6)
Currently Do Not Own, butHave Access to, a Vehicle
19.7 (0.6) 19.4 (0.8) 20.1 (0.8) - 0.7 (1.1)
Currently Have a Credit Card 20.4 (0.7) 21.7 (1.1) 19.2 (0.7) 2.5 (1.3)
Residence
House, townhouse, condo 48.5 (1.1) 48.1 (1.2) 49.0 (1.5) - 0.9 (1.9)
Mobile home or trailer 10.6 (1.3) 11.2 (1.5) 10.0 (1.2) 1.2 (19)
Apartment 32.1 (1.5) 32.1 (1.7) 32.1 (1.6) 0.0 (2.3)
Homeless or othera 8.7 (0.4) 8.4 (0.5) 8.9 (0.6) - 0.5 (0.8
Home Ownership Status
Owns 13.5 (0.7) 14.6 (1.0) 12.4 (0.8) 2.2 (1.3)
Rents 65.3 (1.2) 64.3 (1.7) 66.3 (1.2) - 1.9 (2.1)
Lives rent free 20.3 (0.7) 20.4 (1.0) 20.2 (0.7) 0.3 (1.2)
Does not own but receivesSection 8 or Public Housingassistance
7.7 (0.5) 9.3 (0.7) 6.2 (0.5) 3.2 (0.9)
Food Preparation and StorageCapabilities
Access to a refrigerator 98.4 (0.2) 98.3 (0.3) 98.5 (0.2) - 0.2 (0.4)
Access to a stand-alonefood freezer
49.2 (0.9) 47.9 (1.5) 50.4 (1.1) - 2.4 (1.9)
Access to a gas or electricstove
96.8 (0.3) 96.8 (0.3) 96.8 (0.3) 0.1 (0.4)
Access to a microwave oven 91.1 (0.4) 90.8 (0.5) 91.4 (0.7) - 0.7 (0.9)
Source: SNAP Food Security Survey 2012.
Note: The table compares the characteristics of new SNAP participants that completed a follow upinterview six months later to the characteristics of new SNAP participants that did notcomplete a follow- up interview.
Standard errors in parentheses.
Tabulations are based on the following overall sample sizes: 6,436 new-entrant households(column 1), 3,275 new- entrant households with a follow- up interview (column 2), and 3,161new- entrant households without a follow- up interview (column 3). Individual panels withintables may have slightly fewer observations due to item nonresponse to individual questions.
aConsists of “homeless, living in shelter or mission”, “homeless, living on street”, “car, van , or recreationalvehicle”, “room”, “motel or hotel”, “abandoned building”, or “other”.

8/22/2019 USDA Report re SNAP & Food Security 08/2013
http://slidepdf.com/reader/full/usda-report-re-snap-food-security-082013 216/355
Appendix I Mathematica Policy Research
I-10
Table I.7. Changes in Household Size, Housing Status, or Employment, Pay, or Hours Worked in PastSix Months Experienced by Six- Month and New- Entrant SNAP Households
Percentageof New-Entrant
Households
Percentage of New-Entrant Households
with a Follow-upInterview
Percentage of New-Entrant Householdswithout a Follow- up
Interview Difference
Experienced Change in HouseholdSize, Housing Status, orEmployment, Pay, or Hours Workedin Past 6 Months
Change in Household Size 20.3 (0.8) 21.1 (1.2) 19.5(0.7) 1.7 (1.4)
Birth of child 2.4 (0.2) 2.3 (0.3) 2.5 (0.3) - 0.2 (0.4)
New step, foster, or adopted child 0.1 (0.0) 0.1 (0.0) 0.1 (0.1) 0.0 (0.1)
Marriage or new partner 0.3 (0.1) 0.2 (0.1) 0.5 (0.1) - 0.3 (0.1)
Separation or divorce 3.7 (0.3) 3.7 (0.4) 3.6 (0.3) 0.0 (0.5)
Death of household member 0.8 (0.1) 1.2 (0.2) 0.4 (0.1) 0.8 (0.2)
Family/boarder moving in 4.4 (0.3) 3.9 (0.4) 5.0 (0.5) - 1.1 (0.6)
Family/boarder moving out 4.6 (0.3) 5.5 (0.4) 3.7 (0.3) 1.9 (0.5)
Evicted from House or Apartment 4.6 (0.4) 4.7 (0.5) 4.5 (0.6) 0.1 (0.8)
Change in Employment, Pay, orHours Worked
42.6 (1.0) 39.0 (1.2) 46.1(1.4) - 7.1 (1.8)
Obtained a job (self) 3.2 (0.3) 2.6 (0.4) 3.9 (0.4) - 1.3 (0.6)
Obtained a job (other householdmember)
3.8 (0.3) 2.8 (0.4) 5.0 (0.6) - 2.1 (0.7)
Lost a job (self) 18.2 (0.7) 14.9 (0.9) 21.6(1.1) - 6.7 (1.4)
Lost a job (other householdmember)
20.6 (0.8) 18.4 (1.0) 23.0(1.4) - 4.6 (1.7)
Increase in pay or hours worked(self)
1.2 (0.2) 0.8 (0.2) 1.6 (0.3) - 0.8 (0.4)
Increase in pay or hours worked
(other household member)
0.7 (0.1) 1.0 (0.2) 0.4 (0.1) 0.6 (0.2)
Decrease in pay or hours worked(self)
7.2 (0.5) 5.9 (0.6) 8.6 (0.8) - 2.7 (1.0)
Decrease in pay or hours worked(other household member)
6.9 (0.4) 6.4 (0.6) 7.3 (0.7) - 0.9 (0.9)
Source: SNAP Food Security Survey 2012.
Note: The table compares the characteristics of new SNAP participants that completed a follow upinterview six months later to the characteristics of new SNAP participants that did notcomplete a follow- up interview.
Standard errors in parentheses.
Tabulations are based on the following overall sample sizes: 6,436 new-entrant households(column 1), 3,275 new- entrant households with a follow- up interview (column 2), and 3,161
new- entrant households without a follow- up interview (column 3). Individual panels withintables may have slightly fewer observations due to item nonresponse to individual questions.
Because respondents may experience multiple trigger events, percentages for aggregatecategories such as “any trigger” may not equal the sum of the percentages for the componentcategories.
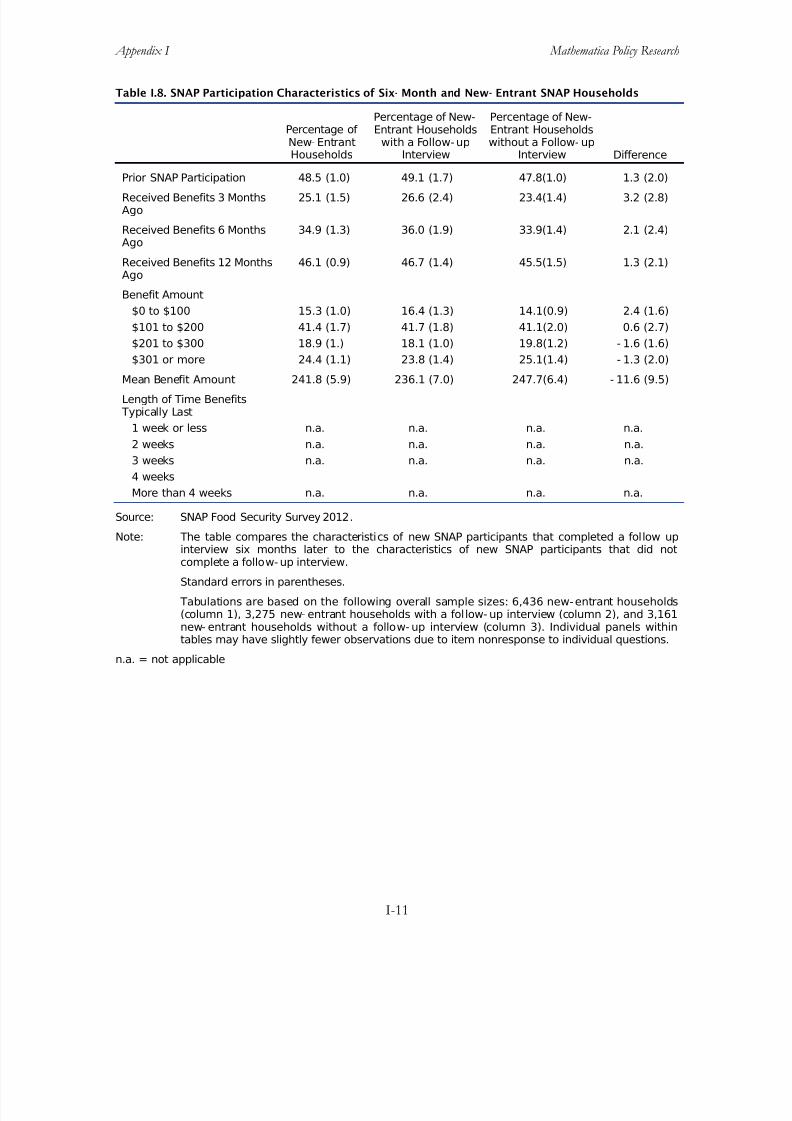
8/22/2019 USDA Report re SNAP & Food Security 08/2013
http://slidepdf.com/reader/full/usda-report-re-snap-food-security-082013 217/355
Appendix I Mathematica Policy Research
I-11
Table I.8. SNAP Participation Characteristics of Six- Month and New- Entrant SNAP Households
Percentage of New- EntrantHouseholds
Percentage of New-Entrant Households
with a Follow-upInterview
Percentage of New-Entrant Householdswithout a Follow- up
Interview Difference
Prior SNAP Participation 48.5 (1.0) 49.1 (1.7) 47.8(1.0) 1.3 (2.0)
Received Benefits 3 MonthsAgo
25.1 (1.5) 26.6 (2.4) 23.4(1.4) 3.2 (2.8)
Received Benefits 6 MonthsAgo
34.9 (1.3) 36.0 (1.9) 33.9(1.4) 2.1 (2.4)
Received Benefits 12 MonthsAgo
46.1 (0.9) 46.7 (1.4) 45.5(1.5) 1.3 (2.1)
Benefit Amount
$0 to $100 15.3 (1.0) 16.4 (1.3) 14.1(0.9) 2.4 (1.6)
$101 to $200 41.4 (1.7) 41.7 (1.8) 41.1(2.0) 0.6 (2.7)
$201 to $300 18.9 (1.) 18.1 (1.0) 19.8(1.2) - 1.6 (1.6)
$301 or more 24.4 (1.1) 23.8 (1.4) 25.1(1.4) - 1.3 (2.0)
Mean Benefit Amount 241.8 (5.9) 236.1 (7.0) 247.7(6.4) - 11.6 (9.5)
Length of Time Benefits Typically Last
1 week or less n.a. n.a. n.a. n.a.
2 weeks n.a. n.a. n.a. n.a.
3 weeks n.a. n.a. n.a. n.a.
4 weeks
More than 4 weeks n.a. n.a. n.a. n.a.
Source: SNAP Food Security Survey 2012.
Note: The table compares the characteristics of new SNAP participants that completed a follow up
interview six months later to the characteristics of new SNAP participants that did notcomplete a follow- up interview.
Standard errors in parentheses.
Tabulations are based on the following overall sample sizes: 6,436 new-entrant households(column 1), 3,275 new- entrant households with a follow- up interview (column 2), and 3,161new- entrant households without a follow- up interview (column 3). Individual panels withintables may have slightly fewer observations due to item nonresponse to individual questions.
n.a. = not applicable
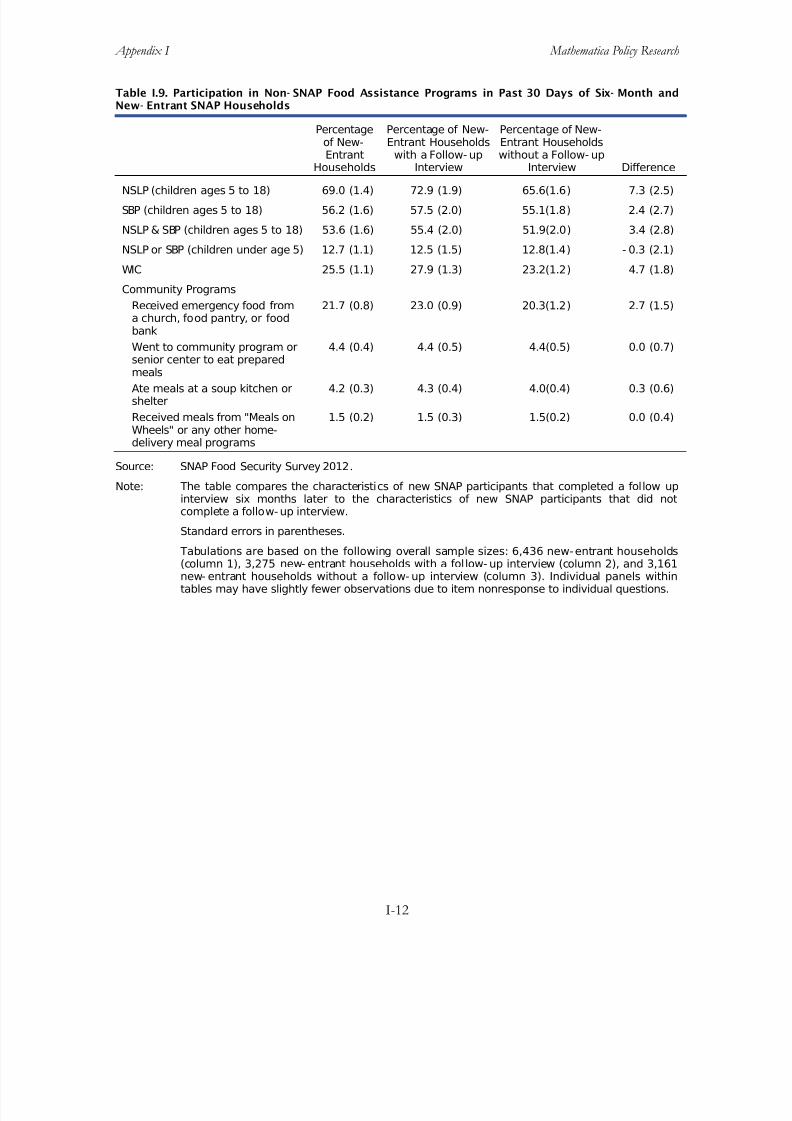
8/22/2019 USDA Report re SNAP & Food Security 08/2013
http://slidepdf.com/reader/full/usda-report-re-snap-food-security-082013 218/355
Appendix I Mathematica Policy Research
I-12
Table I.9. Participation in Non- SNAP Food Assistance Programs in Past 30 Days of Six- Month andNew- Entrant SNAP Households
Percentageof New-Entrant
Households
Percentage of New-Entrant Households
with a Follow- upInterview
Percentage of New-Entrant Householdswithout a Follow- up
Interview Difference
NSLP (children ages 5 to 18) 69.0 (1.4) 72.9 (1.9) 65.6(1.6) 7.3 (2.5)
SBP (children ages 5 to 18) 56.2 (1.6) 57.5 (2.0) 55.1(1.8) 2.4 (2.7)
NSLP & SBP (children ages 5 to 18) 53.6 (1.6) 55.4 (2.0) 51.9(2.0) 3.4 (2.8)
NSLP or SBP (children under age 5) 12.7 (1.1) 12.5 (1.5) 12.8(1.4) - 0.3 (2.1)
WIC 25.5 (1.1) 27.9 (1.3) 23.2(1.2) 4.7 (1.8)
Community Programs
Received emergency food froma church, food pantry, or foodbank
21.7 (0.8) 23.0 (0.9) 20.3(1.2) 2.7 (1.5)
Went to community program orsenior center to eat preparedmeals
4.4 (0.4) 4.4 (0.5) 4.4(0.5) 0.0 (0.7)
Ate meals at a soup kitchen orshelter
4.2 (0.3) 4.3 (0.4) 4.0(0.4) 0.3 (0.6)
Received meals from "Meals onWheels" or any other home-delivery meal programs
1.5 (0.2) 1.5 (0.3) 1.5(0.2) 0.0 (0.4)
Source: SNAP Food Security Survey 2012.
Note: The table compares the characteristics of new SNAP participants that completed a follow upinterview six months later to the characteristics of new SNAP participants that did notcomplete a follow- up interview.
Standard errors in parentheses.
Tabulations are based on the following overall sample sizes: 6,436 new-entrant households(column 1), 3,275 new- entrant households with a follow- up interview (column 2), and 3,161new- entrant households without a follow- up interview (column 3). Individual panels withintables may have slightly fewer observations due to item nonresponse to individual questions.
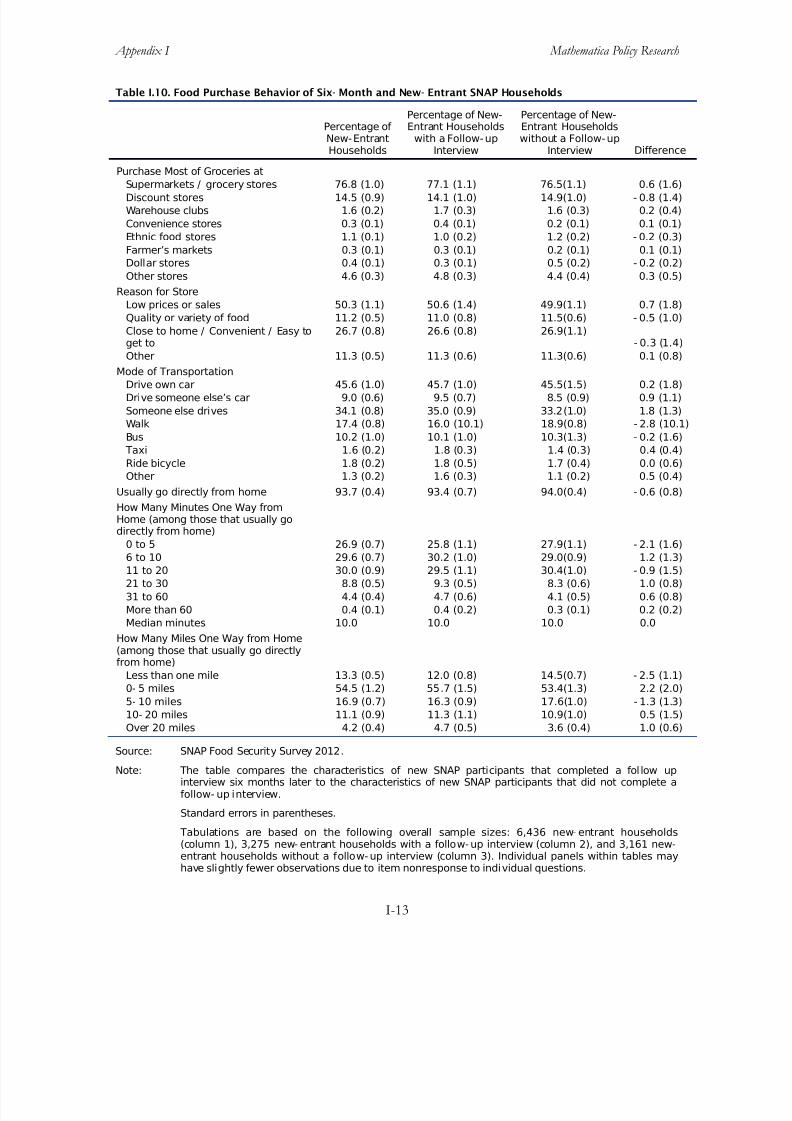
8/22/2019 USDA Report re SNAP & Food Security 08/2013
http://slidepdf.com/reader/full/usda-report-re-snap-food-security-082013 219/355
Appendix I Mathematica Policy Research
I-13
Table I.10. Food Purchase Behavior of Six- Month and New- Entrant SNAP Households
Percentage of New-EntrantHouseholds
Percentage of New-Entrant Households
with a Follow-upInterview
Percentage of New-Entrant Householdswithout a Follow-up
Interview Difference
Purchase Most of Groceries at
Supermarkets / grocery stores 76.8 (1.0) 77.1 (1.1) 76.5(1.1) 0.6 (1.6)Discount stores 14.5 (0.9) 14.1 (1.0) 14.9(1.0) - 0.8 (1.4)
Warehouse clubs 1.6 (0.2) 1.7 (0.3) 1.6 (0.3) 0.2 (0.4)
Convenience stores 0.3 (0.1) 0.4 (0.1) 0.2 (0.1) 0.1 (0.1)
Ethnic food stores 1.1 (0.1) 1.0 (0.2) 1.2 (0.2) - 0.2 (0.3)
Farmer’s markets 0.3 (0.1) 0.3 (0.1) 0.2 (0.1) 0.1 (0.1)
Dollar stores 0.4 (0.1) 0.3 (0.1) 0.5 (0.2) - 0.2 (0.2)
Other stores 4.6 (0.3) 4.8 (0.3) 4.4 (0.4) 0.3 (0.5)
Reason for Store
Low prices or sales 50.3 (1.1) 50.6 (1.4) 49.9(1.1) 0.7 (1.8)
Quality or variety of food 11.2 (0.5) 11.0 (0.8) 11.5(0.6) - 0.5 (1.0)
Close to home / Convenient / Easy toget to
26.7 (0.8) 26.6 (0.8) 26.9(1.1)- 0.3 (1.4)
Other 11.3 (0.5) 11.3 (0.6) 11.3(0.6) 0.1 (0.8)
Mode of Transportation
Drive own car 45.6 (1.0) 45.7 (1.0) 45.5(1.5) 0.2 (1.8)
Drive someone else’s car 9.0 (0.6) 9.5 (0.7) 8.5 (0.9) 0.9 (1.1)
Someone else drives 34.1 (0.8) 35.0 (0.9) 33.2(1.0) 1.8 (1.3)
Walk 17.4 (0.8) 16.0 (10.1) 18.9(0.8) - 2.8 (10.1)
Bus 10.2 (1.0) 10.1 (1.0) 10.3(1.3) - 0.2 (1.6)
Taxi 1.6 (0.2) 1.8 (0.3) 1.4 (0.3) 0.4 (0.4)
Ride bicycle 1.8 (0.2) 1.8 (0.5) 1.7 (0.4) 0.0 (0.6)
Other 1.3 (0.2) 1.6 (0.3) 1.1 (0.2) 0.5 (0.4)
Usually go directly from home 93.7 (0.4) 93.4 (0.7) 94.0(0.4) - 0.6 (0.8)
How Many Minutes One Way fromHome (among those that usually godirectly from home)
0 to 5 26.9 (0.7) 25.8 (1.1) 27.9(1.1) - 2.1 (1.6)
6 to 10 29.6 (0.7) 30.2 (1.0) 29.0(0.9) 1.2 (1.3)
11 to 20 30.0 (0.9) 29.5 (1.1) 30.4(1.0) - 0.9 (1.5)
21 to 30 8.8 (0.5) 9.3 (0.5) 8.3 (0.6) 1.0 (0.8)
31 to 60 4.4 (0.4) 4.7 (0.6) 4.1 (0.5) 0.6 (0.8)
More than 60 0.4 (0.1) 0.4 (0.2) 0.3 (0.1) 0.2 (0.2)
Median minutes 10.0 10.0 10.0 0.0
How Many Miles One Way from Home(among those that usually go directlyfrom home)
Less than one mile 13.3 (0.5) 12.0 (0.8) 14.5(0.7) - 2.5 (1.1)
0- 5 miles 54.5 (1.2) 55.7 (1.5) 53.4(1.3) 2.2 (2.0)
5- 10 miles 16.9 (0.7) 16.3 (0.9) 17.6(1.0) - 1.3 (1.3)
10- 20 miles 11.1 (0.9) 11.3 (1.1) 10.9(1.0) 0.5 (1.5)
Over 20 miles 4.2 (0.4) 4.7 (0.5) 3.6 (0.4) 1.0 (0.6)
Source: SNAP Food Security Survey 2012.
Note: The table compares the characteristics of new SNAP participants that completed a fol low upinterview six months later to the characteristics of new SNAP participants that did not complete afollow- up interview.
Standard errors in parentheses.
Tabulations are based on the following overall sample sizes: 6,436 new- entrant households(column 1), 3,275 new- entrant households with a follow- up interview (column 2), and 3,161 new-entrant households without a follow- up interview (column 3). Individual panels within tables mayhave slightly fewer observations due to item nonresponse to individual questions.

8/22/2019 USDA Report re SNAP & Food Security 08/2013
http://slidepdf.com/reader/full/usda-report-re-snap-food-security-082013 220/355
Appendix I Mathematica Policy Research
I-14
Table I.11. EBT Usage, Timing of Receipt of SNAP Benefit Relative to Interview Date, and MoneySaving Techniques for Food Spending of Six- Month and New- Entrant SNAP Households
Percentageof New-Entrant
Households
Percentage of New-Entrant Households
with a Follow-upInterview
Percentage of New-Entrant Householdswithout a Follow- up
Interview Difference
Percentage of Actual FoodSpending Last Week BoughtUsing EBT Card
Less than half 11.0 (0.7) 11.0 (0.8) 11.0(0.9) - 0.1 (1.2)
About half 5.2 (0.4) 5.2 (0.5) 5.3 (0.6) - 0.1 (0.8)
More than half 83.8 (0.8) 83.9 (1.0) 83.7(0.9) 0.2 (1.3)
Length of Time BetweenInterview Date and ReportedSNAP Benefit Receipt
0 to 5 days 27.3 (1.6) 28.0 (1.5) 28.7 (1.7) 0.7 (2.3)
6 to 10 days 25.8 (1.3) 23.5 (0.9) 21.3 (1.0) - 2.2 (1.3)
11 to 15 days 23.3 (0.8) 22.8 (1.2) 22.3 (1.6) - 0.5 (2.0)
16 to 20 days 12.9 (0.8) 13.5 (0.5) 14.2 (0.6) 0.7 (0.8)21 to 25 days 6.4 (0.7) 6.8 (0.5) 7.2 (0.5) 0.4 (0.7)
26+ days 4.3 (0.4) 5.3 (0.3) 6.3 (0.5) 1.0 (0.6)
Money Saving Techniques forFood Spending 10.0
Used coupons when buyingfood
44.5 (0.9) 45.2 (1.0) 43.8 1.3) 1.4 (1.6)
Bought food in largequantities to receive bulkdiscounts
37.7 (0.8) 37.8 (0.9) 37.6(1.1) 0.2 (1.4)
Bought food items becausethey were on sale
84.8 (0.7) 85.3 (0.8) 84.3(1.0) 0.9 (1.3)
Bought food that was near
or past its expiration date ata discount
23.9 (0.8) 25.8 (0.9) 21.9(1.1) 4.0 (1.4)
Source: SNAP Food Security Survey 2012.
Note: The table compares the characteristics of new SNAP participants that completed a follow upinterview six months later to the characteristics of new SNAP participants that did notcomplete a follow- up interview.
Standard errors in parentheses.
Tabulations are based on the following overall sample sizes: 6,436 new-entrant households(column 1), 3,275 new- entrant households with a follow- up interview (column 2), and 3,161new- entrant households without a follow- up interview (column 3). Individual panels withintables may have slightly fewer observations due to item nonresponse to individual questions.
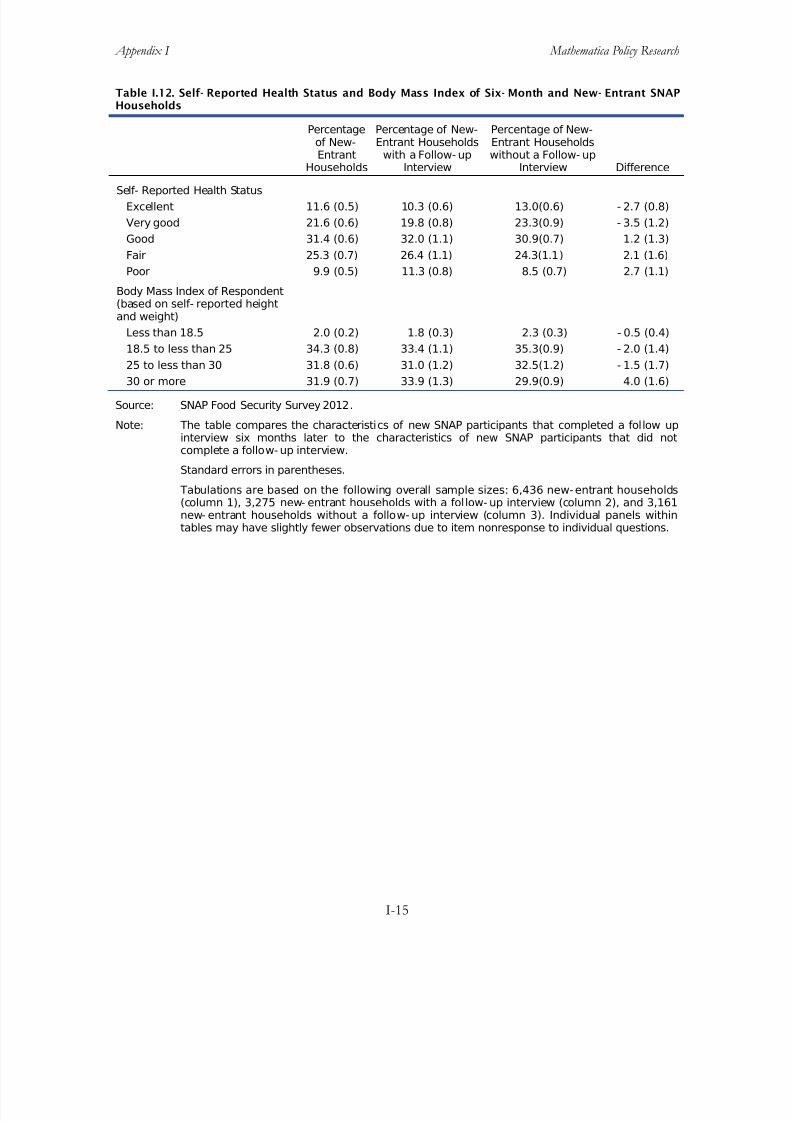
8/22/2019 USDA Report re SNAP & Food Security 08/2013
http://slidepdf.com/reader/full/usda-report-re-snap-food-security-082013 221/355
Appendix I Mathematica Policy Research
I-15
Table I.12. Self- Reported Health Status and Body Mass Index of Six- Month and New- Entrant SNAPHouseholds
Percentageof New-Entrant
Households
Percentage of New-Entrant Households
with a Follow- upInterview
Percentage of New-Entrant Householdswithout a Follow- up
Interview Difference
Self- Reported Health Status
Excellent 11.6 (0.5) 10.3 (0.6) 13.0(0.6) - 2.7 (0.8)
Very good 21.6 (0.6) 19.8 (0.8) 23.3(0.9) - 3.5 (1.2)
Good 31.4 (0.6) 32.0 (1.1) 30.9(0.7) 1.2 (1.3)
Fair 25.3 (0.7) 26.4 (1.1) 24.3(1.1) 2.1 (1.6)
Poor 9.9 (0.5) 11.3 (0.8) 8.5 (0.7) 2.7 (1.1)
Body Mass Index of Respondent(based on self- reported heightand weight)
Less than 18.5 2.0 (0.2) 1.8 (0.3) 2.3 (0.3) - 0.5 (0.4)
18.5 to less than 25 34.3 (0.8) 33.4 (1.1) 35.3(0.9) - 2.0 (1.4)
25 to less than 30 31.8 (0.6) 31.0 (1.2) 32.5(1.2) - 1.5 (1.7)30 or more 31.9 (0.7) 33.9 (1.3) 29.9(0.9) 4.0 (1.6)
Source: SNAP Food Security Survey 2012.
Note: The table compares the characteristics of new SNAP participants that completed a follow upinterview six months later to the characteristics of new SNAP participants that did notcomplete a follow- up interview.
Standard errors in parentheses.
Tabulations are based on the following overall sample sizes: 6,436 new-entrant households(column 1), 3,275 new- entrant households with a follow- up interview (column 2), and 3,161new- entrant households without a follow- up interview (column 3). Individual panels withintables may have slightly fewer observations due to item nonresponse to individual questions.
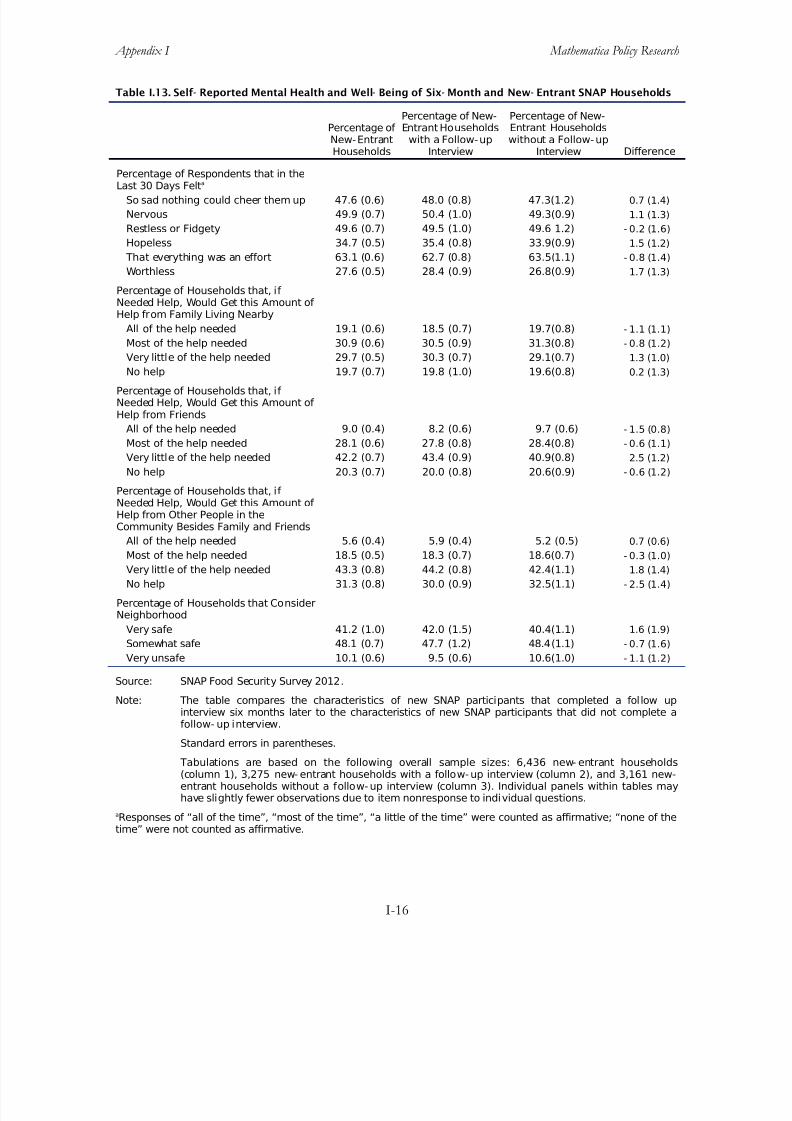
8/22/2019 USDA Report re SNAP & Food Security 08/2013
http://slidepdf.com/reader/full/usda-report-re-snap-food-security-082013 222/355
Appendix I Mathematica Policy Research
I-16
Table I.13. Self- Reported Mental Health and Well- Being of Six- Month and New- Entrant SNAP Households
Percentage of New-EntrantHouseholds
Percentage of New-Entrant Households
with a Follow-upInterview
Percentage of New-Entrant Householdswithout a Follow-up
Interview Difference
Percentage of Respondents that in the
Last 30 Days Felta So sad nothing could cheer them up 47.6 (0.6) 48.0 (0.8) 47.3(1.2) 0.7 (1.4)
Nervous 49.9 (0.7) 50.4 (1.0) 49.3(0.9) 1.1 (1.3)
Restless or Fidgety 49.6 (0.7) 49.5 (1.0) 49.6 1.2) - 0.2 (1.6)
Hopeless 34.7 (0.5) 35.4 (0.8) 33.9(0.9) 1.5 (1.2)
That everything was an effort 63.1 (0.6) 62.7 (0.8) 63.5(1.1) - 0.8 (1.4)
Worthless 27.6 (0.5) 28.4 (0.9) 26.8(0.9) 1.7 (1.3)
Percentage of Households that, if Needed Help, Would Get this Amount of Help from Family Living Nearby
All of the help needed 19.1 (0.6) 18.5 (0.7) 19.7(0.8) - 1.1 (1.1)
Most of the help needed 30.9 (0.6) 30.5 (0.9) 31.3(0.8) - 0.8 (1.2)
Very little of the help needed 29.7 (0.5) 30.3 (0.7) 29.1(0.7) 1.3 (1.0)
No help 19.7 (0.7) 19.8 (1.0) 19.6(0.8) 0.2 (1.3)
Percentage of Households that, if Needed Help, Would Get this Amount of Help from Friends
All of the help needed 9.0 (0.4) 8.2 (0.6) 9.7 (0.6) - 1.5 (0.8)
Most of the help needed 28.1 (0.6) 27.8 (0.8) 28.4(0.8) - 0.6 (1.1)
Very little of the help needed 42.2 (0.7) 43.4 (0.9) 40.9(0.8) 2.5 (1.2)
No help 20.3 (0.7) 20.0 (0.8) 20.6(0.9) - 0.6 (1.2)
Percentage of Households that, if Needed Help, Would Get this Amount of Help from Other People in theCommunity Besides Family and Friends
All of the help needed 5.6 (0.4) 5.9 (0.4) 5.2 (0.5) 0.7 (0.6)
Most of the help needed 18.5 (0.5) 18.3 (0.7) 18.6(0.7) - 0.3 (1.0)
Very little of the help needed 43.3 (0.8) 44.2 (0.8) 42.4(1.1) 1.8 (1.4)
No help 31.3 (0.8) 30.0 (0.9) 32.5(1.1) - 2.5 (1.4)
Percentage of Households that ConsiderNeighborhood
Very safe 41.2 (1.0) 42.0 (1.5) 40.4(1.1) 1.6 (1.9)
Somewhat safe 48.1 (0.7) 47.7 (1.2) 48.4(1.1) - 0.7 (1.6)
Very unsafe 10.1 (0.6) 9.5 (0.6) 10.6(1.0) - 1.1 (1.2)
Source: SNAP Food Security Survey 2012.
Note: The table compares the characteristics of new SNAP participants that completed a follow upinterview six months later to the characteristics of new SNAP participants that did not complete afollow- up interview.
Standard errors in parentheses.
Tabulations are based on the following overall sample sizes: 6,436 new- entrant households(column 1), 3,275 new- entrant households with a follow- up interview (column 2), and 3,161 new-entrant households without a follow- up interview (column 3). Individual panels within tables mayhave slightly fewer observations due to item nonresponse to individual questions.
aResponses of “all of the time”, “most of the time”, “a little of the time” were counted as affirmative; “none of thetime” were not counted as affirmative.

8/22/2019 USDA Report re SNAP & Food Security 08/2013
http://slidepdf.com/reader/full/usda-report-re-snap-food-security-082013 223/355
Appendix I Mathematica Policy Research
I-17
Table I.14. State Characteristics Associated with Six- Month and New- Entrant SNAP Households
Percentage of New- EntrantHouseholds
Percentage of New-Entrant Households
with a Follow-upInterview
Percentage of New-Entrant Householdswithout a Follow- up
Interview Difference
State 25th Percentile Wage(Dollars)
10.7 (0.1) 10.8 (0.1) 10.7 (0.1) 0.0 (0.1)
State Unemployment Rate(Percentage)
8.7 (0.2) 8.8 (0.2) 8.7 (0.2) 0.1 (0.3)
State Offers Broad- BasedCategorical Eligibility for SNAP(Percentage)
89.3 (5.6) 89.1 (5.6) 89.4 (5.6) - 0.3 (7.9)
Average State SNAPCertification Period (Months)
12.1 (0.3) 12.2 (0.3) 12.1 (0.3) 0.1 (0.4)
Source: SNAP Food Security Survey 2012.
Note: The table compares the characteristics of new SNAP participants that completed a follow upinterview six months later to the characteristics of new SNAP participants that did notcomplete a follow- up interview.
Standard errors in parentheses.
Tabulations are based on the following overall sample sizes: 6,436 new-entrant households(column 1), 3,275 new- entrant households with a follow- up interview (column 2), and 3,161new- entrant households without a follow- up interview (column 3). Individual panels withintables may have slightly fewer observations due to item nonresponse to individual questions.

8/22/2019 USDA Report re SNAP & Food Security 08/2013
http://slidepdf.com/reader/full/usda-report-re-snap-food-security-082013 224/355
This page has been left blank for double-sided copying.

8/22/2019 USDA Report re SNAP & Food Security 08/2013
http://slidepdf.com/reader/full/usda-report-re-snap-food-security-082013 225/355
APPENDIX J
SURVEY INSTRUMENTS

8/22/2019 USDA Report re SNAP & Food Security 08/2013
http://slidepdf.com/reader/full/usda-report-re-snap-food-security-082013 226/355
This page has been left blank for double-sided copying.
8/22/2019 USDA Report re SNAP & Food Security 08/2013
http://slidepdf.com/reader/full/usda-report-re-snap-food-security-082013 227/355
MPR Reference No.: 06801.602
SNAP Food Security
Telephone SurveyCATI SPECIFICATION S
M ay 24, 2011
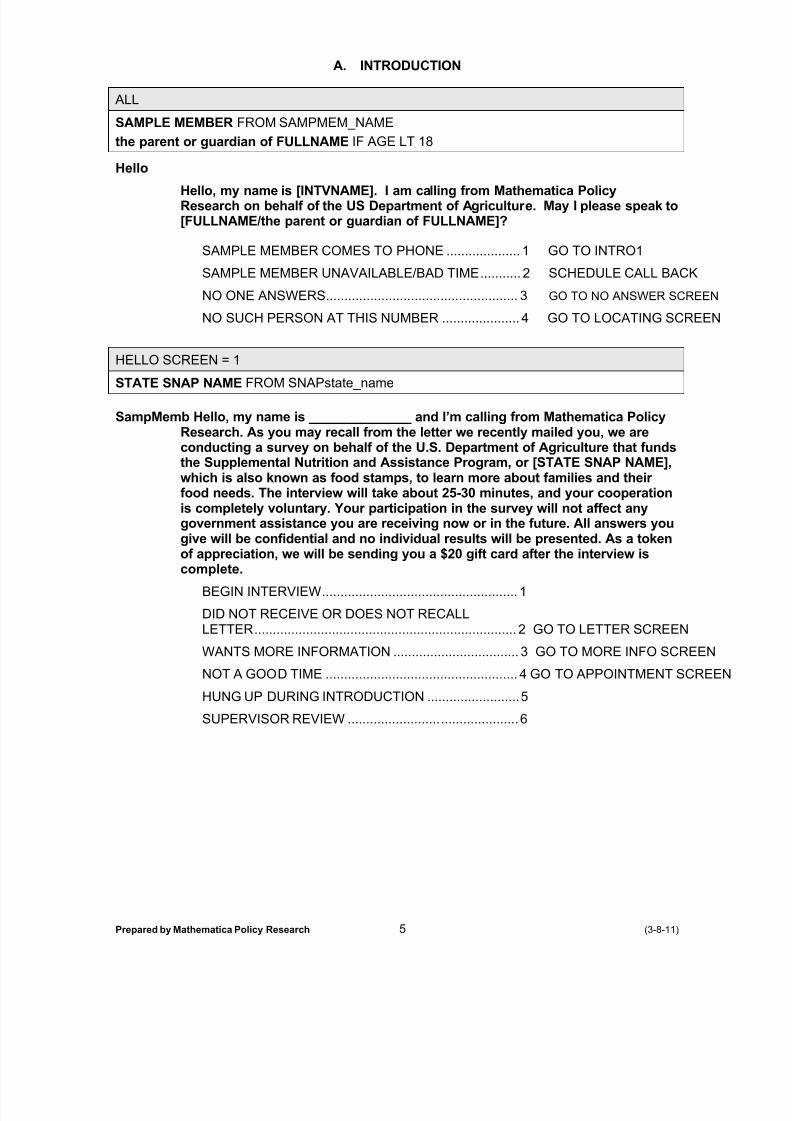
8/22/2019 USDA Report re SNAP & Food Security 08/2013
http://slidepdf.com/reader/full/usda-report-re-snap-food-security-082013 228/355
Prepared by Mathematica Policy Research 5 (3-8-11)
A. INTRODUCTION
ALL
SAMPLE MEMBER FROM SAMPMEM_NAME
the parent or guardian of FULLNAME IF AGE LT 18
Hello
Hello, my name is [INTVNAME]. I am calling from Mathematica PolicyResearch on behalf of the US Department of Agriculture. May I please speak to[FULLNAME/the parent or guardian of FULLNAME]?
SAMPLE MEMBER COMES TO PHONE .................... 1 GO TO INTRO1
SAMPLE MEMBER UNAVAILABLE/BAD TIME ........... 2 SCHEDULE CALL BACK
NO ONE ANSWERS .................................................... 3 GO TO NO ANSWER SCREEN
NO SUCH PERSON AT THIS NUMBER ..................... 4 GO TO LOCATING SCREEN
HELLO SCREEN = 1
STATE SNAP NAME FROM SNAPstate_name
SampMemb Hello, my name is ______________ and I’m calling from Mathematica PolicyResearch. As you may recall from the letter we recently mailed you, we areconducting a survey on behalf of the U.S. Department of Agriculture that fundsthe Supplemental Nutrition and Assistance Program, or [STATE SNAP NAME],which is also known as food stamps, to learn more about families and their food needs. The interview will take about 25-30 minutes, and your cooperationis completely voluntary. Your participation in the survey will not affect anygovernment assistance you are receiving now or in the future. All answers yougive will be confidential and no individual results will be presented. As a token
of appreciation, we will be sending you a $20 gift card after the interview iscomplete.
BEGIN INTERVIEW ..................................................... 1
DID NOT RECEIVE OR DOES NOT RECALLLETTER ....................................................................... 2 GO TO LETTER SCREEN
WANTS MORE INFORMATION .................................. 3 GO TO MORE INFO SCREEN
NOT A GOOD TIME .................................................... 4 GO TO APPOINTMENT SCREE
HUNG UP DURING INTRODUCTION ......................... 5
SUPERVISOR REVIEW .............................................. 6

8/22/2019 USDA Report re SNAP & Food Security 08/2013
http://slidepdf.com/reader/full/usda-report-re-snap-food-security-082013 229/355
Prepared by Mathematica Policy Research 6 (3-8-11)
INTRO1 = 1
STATE SNAP NAME FROM SNAPstate_name
EBT STATE NAME FROM EBTstate_name
MONTH, YEAR FROM CertificationDate
in MONTH, YEAR IF NEW PARTICIPANT
around 6 months ago IF CURRENT PARTICIPANT
SCRN1a. Based on the information we have, you were most recently approved for [STATE SNAP NAME] benefits (NEW: in MONTH, YEAR / CURRENT: around 6 months ago). Is that correct?
PROBE: This program used to be called food stamps. It puts money on an[EBT STATE NAME] card that you can use to buy food.
YES ............................................................................. 1
NO ............................................................................... 0DON’T KNOW .............................................................. d GO TO Sup Review
REFUSED.................................................................... r GO TO Sup Review
IF NEW PARTICIPANT AND SCRN1A = 1, GO TO A1
IF CURRENT PARTICIPANT AND SCRN1A = 1 OR 0, GO TO SCRN1D
NEW PARTICIPANT AND SCRN1A = 0
STATE SNAP NAME FROM SNAPstate_name
SCRN1b. Have you applied for [STATE SNAP NAME] benefits in the last two months?
YES ............................................................................. 1
NO ............................................................................... 0 GO TO END
DON’T KNOW .............................................................. d GO TO Sup Review
REFUSED.................................................................... r GO TO Sup Review
NEW PARTICIPANT AND SCRN1B = 1
SCRN1c. What was the outcome of that application?
APPLICATION WAS APPROVED ............................... 1
APPLICATION IS STILL PENDING ............................. 2 GO TO Sup Review
APPLICATION WAS DENIED ...................................... 3 GO TO END
DON’T KNOW .............................................................. d GO TO Sup Review
REFUSED.................................................................... r GO TO Sup Review
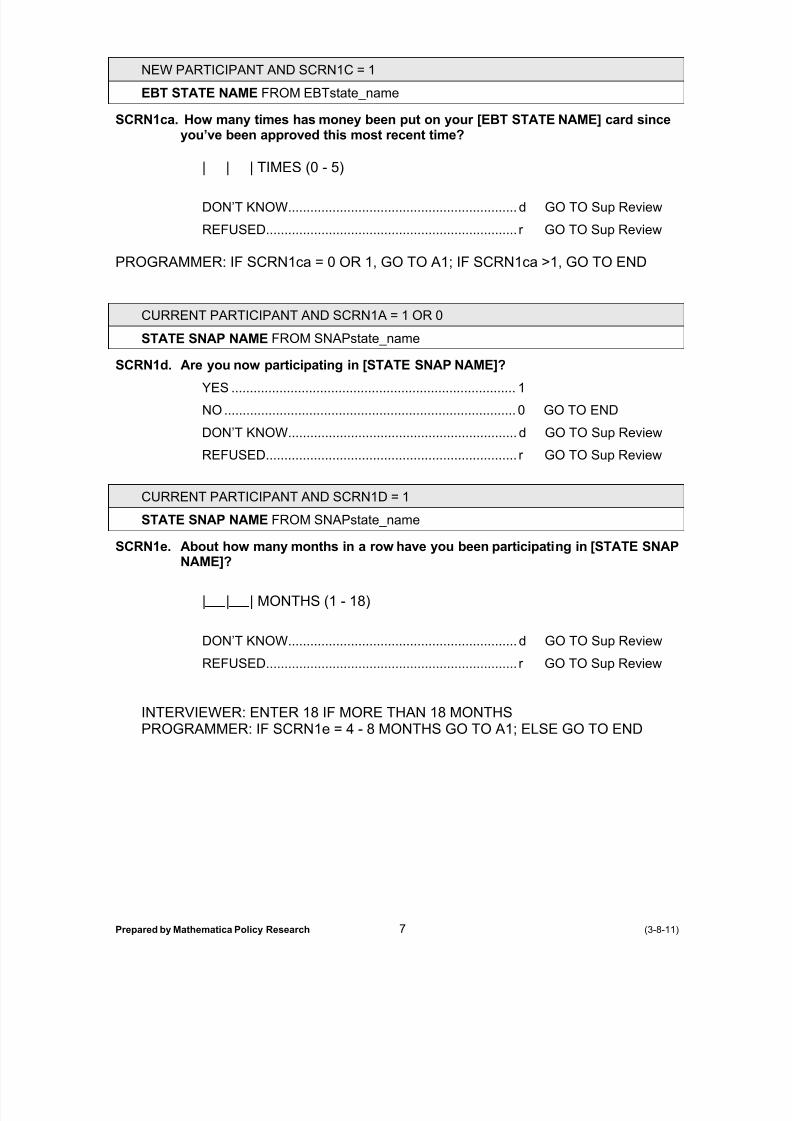
8/22/2019 USDA Report re SNAP & Food Security 08/2013
http://slidepdf.com/reader/full/usda-report-re-snap-food-security-082013 230/355
Prepared by Mathematica Policy Research 7 (3-8-11)
NEW PARTICIPANT AND SCRN1C = 1
EBT STATE NAME FROM EBTstate_name
SCRN1ca. How many times has money been put on your [EBT STATE NAME] card sinceyou’ve been approved this most recent time?
| | | TIMES (0 - 5)
DON’T KNOW .............................................................. d GO TO Sup Review
REFUSED.................................................................... r GO TO Sup Review
PROGRAMMER: IF SCRN1ca = 0 OR 1, GO TO A1; IF SCRN1ca >1, GO TO END
CURRENT PARTICIPANT AND SCRN1A = 1 OR 0
STATE SNAP NAME FROM SNAPstate_name
SCRN1d. Are you now participating in [STATE SNAP NAME]?YES ............................................................................. 1
NO ............................................................................... 0 GO TO END
DON’T KNOW .............................................................. d GO TO Sup Review
REFUSED.................................................................... r GO TO Sup Review
CURRENT PARTICIPANT AND SCRN1D = 1
STATE SNAP NAME FROM SNAPstate_name
SCRN1e. About how many months in a row have you been participating in [STATE SNAPNAME]?
| | | MONTHS (1 - 18)
DON’T KNOW .............................................................. d GO TO Sup Review
REFUSED.................................................................... r GO TO Sup Review
INTERVIEWER: ENTER 18 IF MORE THAN 18 MONTHS
PROGRAMMER: IF SCRN1e = 4 - 8 MONTHS GO TO A1; ELSE GO TO END
8/22/2019 USDA Report re SNAP & Food Security 08/2013
http://slidepdf.com/reader/full/usda-report-re-snap-food-security-082013 231/355
Prepared by Mathematica Policy Research 8 (3-8-11)
SCRN1B = 0 OR R; SCRN1C = 3 OR 4; SCRN1CA>1 OR = R; SCRN1D=0 OR 4; SCRN1E=R
just recently were approved in [STATE SNAP NAME] IF NEW PARTICIPANT
have been participating in [STATE SNAP NAME] for about 6 months IF CURRENTPARTICIPANT
STATE SNAP NAME FROM SNAPstate_name
END Those are all the questions I have. This survey is for people who are currentlyparticipating in [STATE SNAP NAME] and (were just recently approved /havebeen participating in [STATE SNAP NAME] for about 6 months). Thank you for your time. Good-bye. CODE AS INELIGIBLE
Sup Review Those are all the questions I have for now. I need to clarify some information withmy supervisor. We will call you back if we have additional questions.
SCRN1A = 1
A1. Are you the person who does most of the planning or preparing of meals inyour family?
INTERVIEWER: IF R ANSWERS “SOMETIMES” OR “50/50,” ENTER YES.
YES ............................................................................. 1 GO TO A2
NO ............................................................................... 0
DON’T KNOW .............................................................. d GO TO A2
REFUSED.................................................................... r GO TO A2
A1 = 0
A1a. Which adult in your household does most
(STRING 40)
of the planning or preparing of meals?
FIRST NAME
(STRING 40)LAST NAME
DON’T KNOW .............................................................. d
REFUSED.................................................................... r
SCRN1A = 1
A2. Are you the person who does most of the shopping for food
YES ............................................................................. 1 GO TO A3
in your family?
NO ............................................................................... 0
DON’T KNOW .............................................................. d GO TO A3
REFUSED.................................................................... r GO TO A3

8/22/2019 USDA Report re SNAP & Food Security 08/2013
http://slidepdf.com/reader/full/usda-report-re-snap-food-security-082013 232/355
Prepared by Mathematica Policy Research 9 (3-8-11)
A2 = 0
A2a. Which adult in your household does most
of the shopping for food?
ENTER 1 TO RECORD NAME .................................... 1
SAME AS MEAL PLANNER ........................................ 2 GO TO A3 CHECK
A2A = 1
A2a_NAME RECORD NAME
(STRING 40)FIRST NAME
(STRING 40)LAST NAME
DON’T KNOW .............................................................. d
REFUSED.................................................................... r
A3 PROGRAMMER CHECK
IS RESPONDENT THE MEAL PLANNER OR FOOD SHOPPER?IF YES, GO TO B1, IF NO, GO TO A3a. IF NEITHER FOOD SHOPPER NOR MEAL PLANNER
IS AVAILABLE, SCHEDULE CALL BACK.
A1 = 0 AND A2 = 0
A3a. Can I please speak to [FILL NAME COLLECTED AT A2a]?
COMES TO PHONE .................................................... 1 GO TO INTRO2
FOOD SHOPPER UNAVAILABLE ............................... 2
BAD TIME/CALL BACK ............................................... 3 SCHEDULE CALL BACK
A3A = 2 AND A2A NE TO 2
A4a. Can I please speak to [FILL NAME COLLECTED AT A1a]?
COMES TO PHONE .................................................... 1 GO TO INTRO2
MEAL PLANNER UNAVAILABLE ................................ 2 SCHEDULE CALL BACKBAD TIME/CALL BACK ............................................... 3 SCHEDULE CALL BACK

8/22/2019 USDA Report re SNAP & Food Security 08/2013
http://slidepdf.com/reader/full/usda-report-re-snap-food-security-082013 233/355
Prepared by Mathematica Policy Research 10 (3-8-11)
A4A = 1
STATE SNAP NAME FROM SNAPstate_name
INTRO2 Hello, my name is __________ and I’m calling from Mathematica PolicyResearch. We are conducting a survey on behalf of the U.S. Department of Agriculture that funds the Supplemental Nutrition and Assistance Program, or
[STATE SNAP NAME], which is also known as food stamps, to learn moreabout families and their food needs. The interview will take about 25-30minutes, and your cooperation is completely voluntary. Your participation inthe survey will not affect any government assistance you are receiving now or in the future. All answers you give will be confidential and no individual resultswill be presented. As a token of appreciation, we will be sending you a $20 giftcard after the interview is complete.
PROCEED WITH INTERVIEW .................................... 1
BAD TIME/CALL BACK ............................................... 2 SCHEDULE CALL BACK
A5. Are you at least 18 years old?
YES ............................................................................. 1 GO TO B1
NO ............................................................................... 0 GO TO SUP REVIEW
DON’T KNOW .............................................................. d GO TO SUP REVIEW
REFUSED.................................................................... r GO TO SUP REVIEW

8/22/2019 USDA Report re SNAP & Food Security 08/2013
http://slidepdf.com/reader/full/usda-report-re-snap-food-security-082013 234/355
Prepared by Mathematica Policy Research 11 (3-8-11)
B. HOUSEHOLD COMPOSITION
ALL
The first few questions are about the people you live with.
B1. Please tell me the first name of everyone who lives in your household. Byhousehold, I mean the people who live with you and share food with you.
Please include babies, small children, and people who are not related to you.RESPONDENT LIVES ALONE .................................... 0 GO TO B4
ENTER NAMES ........................................................... 1(ALLOW UP TO 10 NAMES)
(STRING 40)NAME
B1 NE 0
ASK B2 FOR ALL HOUSEHOLD MEMBERS RECORDED IN B1.
NAME 1 FILL FIRST NAME COLLECTED AT B1
THEN FILL EACH SUBSEQUENT NAME (NAME 2 – NAME 10)
B2. And what is [NAME 1]’s relationship to you
INTERVIEWER: CODE COHABITEE’S CHILD AND OTHER CHILDREN WHO ARENOT NATURAL, ADOPTED OR STEP, BUT FOR WHOM THESAMPLE MEMBER TAKES RESPONSIBILITY, AS “OTHERCUSTODIAL CHILD.”
?
HUSBAND OR WIFE ................................................... 1
UNMARRIED PARTNER ............................................. 2
SON OR DAUGHTER (INCLUDING
BIOLOGICAL, STEP, OR ADOPTED CHILD) .............. 3OTHER CUSTODIAL OR FOSTER CHILD .................. 4
PARENT (MOTHER, FATHER,INCLUDING STEPPARENTS AND IN-LAWS) ............. 5
SIBLING (BROTHER OR SISTERINCLUDING IN-LAWS) ................................................ 6
GRANDCHILD ............................................................. 7
OTHER RELATIVE ...................................................... 8
NON-RELATIVE (INCLUDING
ROOMER OR BOARDER) ........................................... 9OTHER SPECIFY ........................................................ 10
________________________________(STRING 60)
DON’T KNOW .............................................................. d
REFUSED.................................................................... r
8/22/2019 USDA Report re SNAP & Food Security 08/2013
http://slidepdf.com/reader/full/usda-report-re-snap-food-security-082013 235/355
Prepared by Mathematica Policy Research 12 (3-8-11)
B1 NE 0
ASK B3 FOR ALL HOUSEHOLD MEMBERS RECORDED IN B1.
NAME 1 FILL FIRST NAME COLLECTED AT B1
THEN FILL EACH SUBSEQUENT NAME (NAME 2 – NAME 10)
B3. What is [NAME 1]’s age?
| | | AGE (0 - 99)
INTERVIEWER: IF LESS THAN 1 YEAR OLD ENTER “0”.
YEARS ........................................................................ 1
B3 GE 15 (HOUSEHOLD MEMBERS RECORDED IN B1 15 OR OLDER).
NAME 1 FILL FIRST NAME COLLECTED AT B1
THEN FILL EACH SUBSEQUENT NAME (NAME 2 – NAME 10)
B3a. ASK ONLY IF NEEDED: IS [NAME 1] male or female?
MALE ........................................................................... 1
FEMALE ...................................................................... 2
DON’T KNOW .............................................................. d
REFUSED.................................................................... r
ALL
Do you IF B1 = 0Does anyone in your household IF B1 NE 0
you IF B1 = 0
anyone in the household IF B1 NE 0
B4. (Do you/Does anyone in your household) have a physical, mental, or other health condition that limits the kind or amount of work that (you/anyone in thehousehold) can do?
YES ............................................................................. 1
NO ............................................................................... 0
DON’T KNOW .............................................................. dREFUSED.................................................................... r
8/22/2019 USDA Report re SNAP & Food Security 08/2013
http://slidepdf.com/reader/full/usda-report-re-snap-food-security-082013 236/355
Prepared by Mathematica Policy Research 13 (3-8-11)
C. TRIGGER EVENTS
ALL
The next few questions are about changes that may have occurred in your household inthe past 6 months.
C1. Has there been a change in the number of people living in your household over the past 6 months?
YES ............................................................................. 1
NO ............................................................................... 0 GO TO C2
DON’T KNOW .............................................................. d GO TO C2
REFUSED.................................................................... r GO TO C2
C1 = 1
C1a. What caused that change?
CODE ALL THAT APPLY
BIRTH OF CHILD ........................................................ 1
NEW STEP, FOSTER OR ADOPTED CHILD .............. 2
MARRIAGE/NEW PARTNER....................................... 3
SEPARATION OR DIVORCE ...................................... 4
DEATH OF HOUSEHOLD MEMBER ........................... 5
FAMILY/BOARDER MOVING IN ................................. 6
FAMILY/BOARDER MOVING OUT.............................. 7
OTHER (SPECIFY) ...................................................... 8
________________________________(STRING 500)
DON’T KNOW .............................................................. d
REFUSED.................................................................... r

8/22/2019 USDA Report re SNAP & Food Security 08/2013
http://slidepdf.com/reader/full/usda-report-re-snap-food-security-082013 237/355
Prepared by Mathematica Policy Research 14 (3-8-11)
ALL
were you IF B1 = 0
was your household IF B1 NE 0
C2. At any time in the past 6 months (were you/was your household) evicted fromyour house or apartment?
YES ............................................................................. 1
NO ............................................................................... 0
DON’T KNOW .............................................................. d
REFUSED.................................................................... r
ALL
or anyone in your household IF B1 NE 0
C3. Have you (or anyone in your household) had a change in employment or achange in pay or hours worked from a job in the past 6 months?
YES ............................................................................. 1
NO ............................................................................... 0 GO TO D1
DON’T KNOW .............................................................. d GO TO D1
REFUSED.................................................................... r GO TO D1
B1 NE 0
C3a. Who in your household had a change in employment or a change in pay or hours worked from a job in the past 6 months?
[LIST ALL MEMBERS OF HOUSEHOLD AGE 15 AND OVER FROM B1]
CODE ALL THAT APPLY
RESPONDENT ............................................................ 1
NAME 1 ....................................................................... 2
NAME 2 ....................................................................... 3
NAME 3 ....................................................................... 4
NAME 4 ....................................................................... 5

8/22/2019 USDA Report re SNAP & Food Security 08/2013
http://slidepdf.com/reader/full/usda-report-re-snap-food-security-082013 238/355
Prepared by Mathematica Policy Research 15 (3-8-11)
C3 = 1
you IF B1 = 0 OR C3A = 1
NAME FILL FROM C3A
C3b. What was that change in employment or a change in pay or hours worked froma job that (you/[NAME]) experienced in the past 6 months?
CODE ALL THAT APPLY
OBTAINED A JOB ....................................................... 1
LOST JOB ................................................................... 2
INCREASE IN PAY OR HOURS .................................. 3
DECREASE IN PAY OR HOURS ................................ 4
OTHER (SPECIFY) ...................................................... 5
________________________________(STRING 500)
DON’T KNOW .............................................................. d
REFUSED.................................................................... r
[REPEAT FOR EACH PERSON RECORDED IN C3a]
8/22/2019 USDA Report re SNAP & Food Security 08/2013
http://slidepdf.com/reader/full/usda-report-re-snap-food-security-082013 239/355
Prepared by Mathematica Policy Research 16 (3-8-11)
D. SNAP PARTICIPATION
ALL
D1. Next, we’re going to ask you about your participation in SNAP.
NEW PARTICIPANT
EBT STATE NAME FROM EBTstate_name
D1a. [IF CURRENT PARTICIPANT, GO TO D1b. IF NEW PARTICIPANT, ASK:] Haveyou already received your SNAP benefits? That is, has money been put onyour [EBT/STATE NAME] card?
YES ............................................................................. 1
NO ............................................................................... 0 GO TO D6
DON’T KNOW .............................................................. d GO TO D6
REFUSED.................................................................... r GO TO D6
CURRENT PARTICIPANT OR D1A = 1
And on what IF D1a = 1
On what IF CURRENT PARTICIPANT
you IF B1 = 0
your household IF B1 NE 0
D1b. (And on what/On what) date did (you/your household) receive your most recentSNAP benefits? That is, when was money most recently put on your [EBT/STATE NAME] card?
| | | / | | | / | | | | |
MONTH DAY YEAR(1 - 12) (1 - 31) (2011-2012)
DON’T KNOW .............................................................. d
REFUSED.................................................................... r
SOFT CHECK: IF DATE IS MORE THAN 1 MONTH PRIOR TO INTERVIEW DATE I just wantto be sure I recorded the date correctly. Did you say DATE?
HARD CHECK: IF DATE IN FUTURE I’m sorry. I must have recorded the date incorrectly.Can you please give me that date again?
CURRENT PARTICIPANT OR D1A = 1
household’s IF B1 NE 0
EBT/STATE NAME FROM EBTstate_name
D2. How many dollars were put on your (household’s) [EBT/STATE NAME] cardthis most recent time?
$ | | | | AMOUNT ISSUED ON EBT CARD (1 – 2,000)
DON’T KNOW .............................................................. d GO TO D5
8/22/2019 USDA Report re SNAP & Food Security 08/2013
http://slidepdf.com/reader/full/usda-report-re-snap-food-security-082013 240/355
Prepared by Mathematica Policy Research 17 (3-8-11)
REFUSED.................................................................... r GO TO D5
SOFT CHECK: IF HH MEMBERS LISTED IN B1 LT 8 AND D2 IS GT 1,000 I just want to besure I recorded your response correctly. Did you say NUM?
D2 NE D OR R
D3. How much of the [FILL AMOUNT IN D2] that you most recently received haveyou used so far?
NONE - HAVE NOT USED YET .................................. 0
ENTER AMOUNT SPENT SO FAR ............................. 1
ENTER BALANCE REMAINING .................................. 2
DON’T KNOW .............................................................. d GO TO D4
REFUSED.................................................................... r GO TO D4
D3 = 1 OR 2
D3a.
$ | | | | AMOUNT (1 – 2,000) GO TO D5
HARD CHECK: IF AMOUNT RECORDED IN D3A GT AMOUNT IN D2 I’m sorry. I must havemade a mistake. The (amount spent/balance remaining) is more than the amount you
received. Is there an error?
D3 OR D3A = D OR R
D4. Would you say as of now you have used…
CODE ONE ONLY
Less than half,............................................................ 1
About half, .................................................................. 2
Or more than half of your monthly
SNAP benefits?.......................................................... 3DON’T KNOW .............................................................. d
REFUSED.................................................................... r
IF NEW PARTICIPANT, GO TO D6. IF CURRENT PARTICIPANT, ASK:
8/22/2019 USDA Report re SNAP & Food Security 08/2013
http://slidepdf.com/reader/full/usda-report-re-snap-food-security-082013 241/355
Prepared by Mathematica Policy Research 18 (3-8-11)
CURRENT PARTICIPANTS
D5. How many weeks do your SNAP benefits usually last? Do they last…
CODE ONE ONLY
1 week or less, ........................................................... 1
2 weeks, ...................................................................... 23 weeks, ...................................................................... 3
4 weeks, or ................................................................. 4
more than 4 weeks?................................................... 5
DON’T KNOW .............................................................. d
REFUSED.................................................................... r
ALL
you IF B1 = 0your household IF B1 NE 0
or anyone in your household IF B1 NE 0
MONTH, YEAR FROM CertificationDate
D6. Before (you/your household) began receiving SNAP benefits this most recenttime, that is in (MONTH, YEAR), had you (or anyone in your household) ever participated in SNAP before?
PROBE: This program used to be called food stamps.
PROBE: IF RESPONDENT MENTIONS RECEIVING SNAP AS A CHILD, SAY:
Since turning 18.
YES ............................................................................. 1
NO ............................................................................... 0 GO TO E1
DON’T KNOW .............................................................. d GO TO E1
REFUSED.................................................................... r GO TO E1
NEW PARTICIPANT AND D6=1
or anyone in your household IF B1 NE 0
FILL MONTH AND YEAR FROM INTERVIEW DATE MINUS 3 MONTHS
IF CURRENT PARTICIPANT GO TO D9; IF NEW ENTRANT, ASK D7, D8 AND D9
D7. Were you (or anyone in your household) receiving SNAP benefits 3 monthsago, that is, in [FILL MONTH AND YEAR]?
YES ............................................................................. 1
NO ............................................................................... 0
DON’T KNOW .............................................................. d
8/22/2019 USDA Report re SNAP & Food Security 08/2013
http://slidepdf.com/reader/full/usda-report-re-snap-food-security-082013 242/355
Prepared by Mathematica Policy Research 19 (3-8-11)
REFUSED.................................................................... r
NEW PARTICIPANT AND D6=1
or anyone in your household IF B1 NE 0
FILL MONTH AND YEAR FROM INTERVIEW DATE MINUS 6 MONTHS
D8. Were you (or anyone in your household) receiving SNAP benefits 6 monthsago, that is, in [FILL MONTH AND YEAR]?
YES ............................................................................. 1
NO ............................................................................... 0
DON’T KNOW .............................................................. d
REFUSED.................................................................... r
D6=1
or anyone in your householdIF B1 NE 0
FILL MONTH AND YEAR FROM INTERVIEW DATE MINUS 1 YEAR
D9. Were you (or anyone in your household) receiving SNAP benefits a year ago,that is, in [FILL MONTH AND YEAR]?
YES ............................................................................. 1
NO ............................................................................... 0
DON’T KNOW .............................................................. d
REFUSED.................................................................... r

8/22/2019 USDA Report re SNAP & Food Security 08/2013
http://slidepdf.com/reader/full/usda-report-re-snap-food-security-082013 243/355
Prepared by Mathematica Policy Research 20 (3-8-11)
E. FOOD PURCHASE BEHAVIOR
ALL
E1. Where do you buy most of your groceries?
ENTER NAME OF ONE STORE .................................. 1 GO TO E1_NAME
MULTIPLE STORES NAMED ...................................... 2 GO TO E1_NAME2
DON’T KNOW .............................................................. d GO TO F1
REFUSED.................................................................... r GO TO F1
E1 = 1
E1_NAME
INTERVIEWER: RECORD NAME OF STORE
________________________________(STRING 60) GO TO E1a
E1=2
E1_NAME2 If you had to choose just one of these stores, which one would you say youshop at most often?
INTERVIEWER: RECORD NAME OF STORE
________________________________(STRING 60)

8/22/2019 USDA Report re SNAP & Food Security 08/2013
http://slidepdf.com/reader/full/usda-report-re-snap-food-security-082013 244/355
Prepared by Mathematica Policy Research 21 (3-8-11)
E1 NE D OR R
E1a. What kind of store is that?
INTERVIEWER: CODE TYPE OF STORE
CODE ONE ONLY
SUPERMARKETS/GROCERY STORES ..................... 1
DISCOUNT STORES SUCH AS WAL-MART,TARGET, OR KMART ................................................. 2
WAREHOUSE CLUBS, SUCH AS PRICE CLUB,COSTCO, PACE, SAM’S CLUB, BJ’S ......................... 3
CONVENIENCE STORES SUCH AS 7-11,QUICK CHECK, QUICK STOP, WAWA ....................... 4
ETHNIC FOOD STORES SUCH ASBODEGA’S ASIAN FOOD MARKETS, ORCARIBBEAN MARKETS .............................................. 5
FARMER’S MARKET ................................................... 6
DOLLAR STORES ....................................................... 7
OTHER (SPECIFY) ...................................................... 8
________________________________(STRING 100)
DON’T KNOW .............................................................. d
REFUSED.................................................................... r
8/22/2019 USDA Report re SNAP & Food Security 08/2013
http://slidepdf.com/reader/full/usda-report-re-snap-food-security-082013 245/355
Prepared by Mathematica Policy Research 22 (3-8-11)
E1 NE D OR R
E2. What is the main
CODE ONE ONLY
reason you shop at (FILL NAME FROM E1)?
LOW PRICES .............................................................. 01
SALES ......................................................................... 02QUALITY OF FOOD .................................................... 03
VARIETY OF FOODS (GENERAL) .............................. 04
VARIETY OF SPECIAL FOODS(SUCH AS GLUTEN FREE) ......................................... 05
CLOSE TO HOME/CONVENIENT ............................... 06
EASY TO GET TO ....................................................... 07
PRODUCE SELECTION .............................................. 08
MEAT DEPARTMENT ................................................. 09
LOYALTY/FREQUENT SHOPPER PROGRAM ........... 10
OTHER (SPECIFY) ...................................................... 11
________________________________(STRING 200)
DON’T KNOW .............................................................. d
REFUSED.................................................................... r
E1 NE D OR R
E3. How do you usually get to (FILL NAME FROM E1)?CODE ALL THAT APPLY
DRIVE OWN CAR ........................................................ 1
DRIVE SOMEONE ELSE’S CAR ................................. 2
SOMEONE ELSE DRIVES ME .................................... 3
WALK .......................................................................... 4
BUS ............................................................................ 5
TAXI ............................................................................ 6
RIDE BICYCLE ............................................................ 7
OTHER (SPECIFY) ...................................................... 8
________________________________(STRING 100)
DON’T KNOW .............................................................. d
REFUSED.................................................................... r

8/22/2019 USDA Report re SNAP & Food Security 08/2013
http://slidepdf.com/reader/full/usda-report-re-snap-food-security-082013 246/355
Prepared by Mathematica Policy Research 23 (3-8-11)
E1 NE D OR R
E3a. Do you usually go to (FILL NAME FROM E1) directly from home?
YES ............................................................................. 1
NO ............................................................................... 0
DON’T KNOW .............................................................. dREFUSED.................................................................... r
E1 NE D OR R
E3b. About how long does it take to go one way from home to (FILL NAME FROME1)?
| | | NUMBER OF MINUTES ONE WAY (1 - 120)
DON’T KNOW .............................................................. d
REFUSED.................................................................... r
E1 NE D OR R
E3c. And approximately how many miles away is (FILL NAME FROM E1) from your home – one way?
| | | MILES ONE WAY (0 - 99)
INTERVIEWER: IF LESS THAN ONE MILE ENTER “0”
DON’T KNOW .............................................................. d
REFUSED.................................................................... r
SOFT CHECK: IF GT 30 I just want to make sure I recorded your answer correctly. Didyou say NUM?

8/22/2019 USDA Report re SNAP & Food Security 08/2013
http://slidepdf.com/reader/full/usda-report-re-snap-food-security-082013 247/355
Prepared by Mathematica Policy Research 24 (3-8-11)
F. FOOD EXPENDITURES
These next questions are about all the places at which you bought food last week. (Bylast week I mean Sunday through Saturday. When answering these questions, pleasethink about all food purchases, meaning those purchased with and without your [STATENAME EBT CARD].
ALL
you IF B1 = 0
anyone in your household IF B1 NE 0
F1. First, did (you/anyone in your household) shop for food at a supermarket or grocery store last week
(PROBE IF INTERVIEWDATE = SATURDAY: By last week we don’t mean the weekthat ends today, but the week that ended last Saturday.)
?
YES ............................................................................. 1
NO ............................................................................... 0
DON’T KNOW .............................................................. d
REFUSED.................................................................... r
ALL
you IF B1 = 0
anyone in your household IF B1 NE 0
F2. Think about other places where people buy food, such as meat markets,produce stands, bakeries, warehouse clubs, and convenience stores. Did
(you/anyone in your household) buy food from any stores such as theselast week
(PROBE IF INTERVIEWDATE = SATURDAY: By last week we don’t mean the weekthat ends today, but the week that ended last Saturday.)
?
YES ............................................................................. 1
NO ............................................................................... 0
DON’T KNOW .............................................................. d
REFUSED.................................................................... r

8/22/2019 USDA Report re SNAP & Food Security 08/2013
http://slidepdf.com/reader/full/usda-report-re-snap-food-security-082013 248/355
Prepared by Mathematica Policy Research 25 (3-8-11)
ALL
you IF B1 = 0
anyone in your household IF B1 NE 0
include any children who may have bought food at the school cafeteria IF B3 = 5 TO 18
F3. Last week
YES ............................................................................. 1
, did (you/anyone in your household) buy food at a restaurant, fastfood place, cafeteria, or vending machine? (Include any children who mayhave bought food at the school cafeteria.)
NO ............................................................................... 0
DON’T KNOW .............................................................. d
REFUSED.................................................................... r
ALL
you IF B1 = 0
anyone in your household IF B1 NE 0
F4. Did (you/anyone in your household) buy food from any other kind of placelast week
YES ............................................................................. 1
?
NO ............................................................................... 0
DON’T KNOW .............................................................. d
REFUSED.................................................................... r
F1, F2, F3 OR F4 = 1
IF “NO” TO F1 AND F2 AND F3 AND F4, GO TO F10.Now I’m going to ask you about the actual amount you spent on food last week in all theplaces where you bought food. Then, since last week may have been unusual for you, Iwill ask about the amount you usually
spend.
F1 = 1
you IF B1 = 0
anyone in your household IF B1 NE 0
including any purchases made with [STATE NAME EBT CARD] card or food stampbenefits IF CURRENT PARTICIPANT OR IF D1A = 1
STATE NAME EBT CARD FROM EBTstate_name
F5. How much did (you/anyone in your household) actually spend at supermarketsand grocery stores last week
PROBE: Your best estimate is fine.
(including any purchases made with [STATENAME EBT CARD] card or food stamp benefits)?
$ | | | |.| | | AMOUNT SPENT LAST WEEK (1 – 2000.00)
DON’T KNOW .............................................................. d GO TO F6

8/22/2019 USDA Report re SNAP & Food Security 08/2013
http://slidepdf.com/reader/full/usda-report-re-snap-food-security-082013 249/355
Prepared by Mathematica Policy Research 26 (3-8-11)
REFUSED.................................................................... r GO TO F6
SOFT CHECK: IF NUMBER OF HH MEMBERS IS LT 8 AND AMOUNT REPORTED HERE GT999.99 I just want to make sure I recorded your response correctly. Did you say NUM?
F5 GT 0
F5a. How much of the [FILL AMOUNT FROM F5] was for non-food items, such aspet food, paper products, alcohol, detergents, or cleaning supplies?
PROBE: Your best estimate is fine.
$ | | | |.| | | AMOUNT SPENT ON NON-FOOD ITEMS (0 – 2,000.00)
DON’T KNOW .............................................................. d
REFUSED.................................................................... r
HARD CHECK: IF AMOUNT GT AMOUNT COLLECTED AT F5 I’m sorry. I must have made amistake. This amount is more than the total amount spent that you reported in the lastquestion. Is there an error?
F2 = 1
you IF B1 = 0
your household IF B1 NE 0
including any purchases made with [STATE NAME EBT CARD] card or food stampbenefits IF CURRENT PARTICIPANT OR IF D1A = 1
STATE NAME EBT CARD FROM EBTstate_name
F6. How much did (you/your household) spend at stores such as meat markets,produce stands, bakeries, warehouse clubs, and convenience stores last week
PROBE: Your best estimate is fine.
(including any purchases made with your [STATE NAME EBT CARD] or foodstamp benefits)?
$ | | | |.| | | AMOUNT SPENT LAST WEEK (1 – 2000.00)
DON’T KNOW .............................................................. d GO TO F7
REFUSED.................................................................... r GO TO F7
SOFT CHECK: IF NUMBER OF HH MEMBERS IS LT 8 AND AMOUNT REPORTED HERE GT999.99 I just want to make sure I recorded your response correctly. Did you say NUM?

8/22/2019 USDA Report re SNAP & Food Security 08/2013
http://slidepdf.com/reader/full/usda-report-re-snap-food-security-082013 250/355
Prepared by Mathematica Policy Research 27 (3-8-11)
F6 GT 0
F6a. How much of the [FILL AMOUNT FROM F6] was for nonfood items, such as petfood, paper products, alcohol, detergents, or cleaning supplies?
PROBE: Your best estimate is fine.
$ | | | |.| | | AMOUNT SPENT ON NON-FOOD ITEMS (0 – 2000.00)
DON’T KNOW .............................................................. d
REFUSED.................................................................... r
HARD CHECK: IF AMOUNT GT AMOUNT COLLECTED AT F6 I’m sorry. I must have made amistake. This amount is more than the total amount spent that you reported in the lastquestion. Is there an error?
F3 = 1
you IF B1 = 0
your household IF B1 NE 0
F7. How much did (you/your household) spend for food at restaurants, fast foodplaces, cafeterias, and vending machines last week
PROBE: Your best estimate is fine.
, not including alcoholpurchases?
$ | | | |.| | | AMOUNT SPENT LAST WEEK (1 – 2000.00)
DON’T KNOW .............................................................. d
REFUSED.................................................................... r
SOFT CHECK: IF NUMBER OF HH MEMBERS IS LT 8 AND AMOUNT REPORTED HERE GT999.99 I just want to make sure I recorded your response correctly. Did you say NUM?
8/22/2019 USDA Report re SNAP & Food Security 08/2013
http://slidepdf.com/reader/full/usda-report-re-snap-food-security-082013 251/355
Prepared by Mathematica Policy Research 28 (3-8-11)
F4 = 1
you IF B1 = 0
your household IF B1 NE 0
F8. How much did (you/your household) spend for food at any other kind of placelast week
PROBE: Your best estimate is fine.
?
$ | | | |.| | | AMOUNT SPENT LAST WEEK (1 – 2000.00)
DON’T KNOW .............................................................. d
REFUSED.................................................................... r
SOFT CHECK: IF NUMBER OF HH MEMBERS IS LT 8 AND AMOUNT REPORTED HERE GT999.99 I just want to make sure I recorded your response correctly. Did you say NUM?
D1A NE 0 AND F1, F2, F3, OR F4 = 1
you IF B1 = 0
your household IF B1 NE 0
AMOUNT FROM SUM OF (F5-F5a)+(F6-F6a)+F7+F8
STATE NAME EBT CARD FROM EBTstate_name
F9. Let’s see, (you/your household) spent about [AMOUNT] on food last week.How much of that was bought using your [STATE NAME EBT CARD] card?
$ | | | | AMOUNT SPENT WITH EBT CARD (0 - 2000) GO TO F10
DON’T KNOW .............................................................. d
REFUSED.................................................................... r
SOFT CHECK: IF AMOUNT IS GT THAN AMOUNT RECORDED IN D3 I’m sorry. I may havemade a mistake. This amount is more than the amount you said you used earlier. Is therean error?
SOFT CHECK: IF AMOUNT IS GT THAN SUM AMOUNT: I’m sorry. I may have made amistake. This amount is more than the amount you said you spent on food last week.
F9 = D OR R
F9a. Would you say you spent…
CODE ONE ONLY
Less than half,............................................................ 1
About half, .................................................................. 2
Or more than half? ..................................................... 3
DON’T KNOW .............................................................. d

8/22/2019 USDA Report re SNAP & Food Security 08/2013
http://slidepdf.com/reader/full/usda-report-re-snap-food-security-082013 252/355
Prepared by Mathematica Policy Research 29 (3-8-11)
REFUSED.................................................................... r
ALL
Let’s see, it seems that (you/your household) did not buy any food last week IF F1, F2,F3, AND F4 = 0
Again,(you/your household) spent about (FILL AMOUNT) on food last week. IF F1, F2, F3,OR F4 = 1 AND D1A NE 0
(You/Your household) spent about (FILL AMOUNT) on food last week. IF F1, F2, F3, OR F4 = 1 AND D1A=0
you AND do you IF B1 = 0
your household AND does your household IF B1 NE 0
Please include any purchases made with your [STATE NAME EBT CARD] or food stampbenefits IF CURRENT PARTICIPANT OR IF D1A = 1
STATE NAME EBT CARD FROM EBTstate_name
FILL AMOUNT FROM SUM OF (F5-F5a)+(F6-F6a)+F7+F8
F10. [Let’s see, it seems that (you/your household) did not buy any food lastweek./Again,(you/your household) spent about (FILL AMOUNT) on food lastweek / (You/Your household) spent about (FILL AMOUNT) on food last week.]Now think about how much (you/your household) usually (spend/spends). Howmuch (do you/does your household) usually spend on food at all the differentplaces we’ve been talking about in a week
$ | | | |.| | | AMOUNT SPENT IN A TYPICAL WEEK (1 – 3000.00)
? (Please include any purchasesmade with your [STATE NAME EBT CARD] or food stamp benefits). Do notinclude nonfood items such as pet food, paper products, detergent or cleaningsupplies.
DON’T KNOW .............................................................. d
REFUSED.................................................................... r
SOFT CHECK: IF NUMBER OF HH MEMBERS IS LT 8 AND AMOUNT REPORTED HERE GT999.99 I just want to make sure I recorded your response correctly. Did you say NUM?
ALL
or anyone in your household IF B1 NE 0
That completes our questions about food purchased over the last week. Now we’re goingto talk about things people sometimes do each month to save money when buying food.
F11. In the last 30 days, have you (or anyone in your household)…
YES NODON’TKNOW REFUSED
a. Used coupons when buying food? ....... 1 0 d r
b. Bought food in large quantities toreceive bulk discounts? ....................... 1 0 d r
c. Bought food items because they wereon sale? ............................................... 1 0 d r

8/22/2019 USDA Report re SNAP & Food Security 08/2013
http://slidepdf.com/reader/full/usda-report-re-snap-food-security-082013 253/355
Prepared by Mathematica Policy Research 30 (3-8-11)
d. Bought food that was near or past itsexpiration date at a discount? .............. 1 0 d r
G. PROGRAM PARTICIPATION
B3 = 0 – 18 YEARS (SCHOOL-AGE CHILDREN PRESENT IN HH); OR B3 = 15-45 AND B3A =FEMALE (FEMALE AGE 15-45 IN HH); OR SAMPLE MEMBER IS RESPONDENT (A1=1 OR
A2=1) AND GENDER IN LOAD FILE = FEMALE AND AGE IN LOAD FILE = 15-45; OR A1OR A2 NE TO 1 (SAMPLE MEMBER IS NOT RESPONDENT)
or someone in your household IF B1 NE 0
IF NO FEMALE AGE 15-45 IN HH OR B3 > 18 YEARS (NO SCHOOL-AGE CHILDRENPRESENT IN HH), GO TO SECTION H
The next questions are about programs you (or someone in your household) may beparticipating in.
B3 = 5 TO 18 YEARS (SCHOOL-AGE CHILDREN PRESENT IN HH)
G1. During the past 30 days, did any children in the household (between 5 and18 years old) receive free or reduced-cost lunches at school?
YES ............................................................................. 1
NO ............................................................................... 0
DON’T KNOW .............................................................. d
REFUSED.................................................................... r
B3 = 5 TO 18 YEARS (SCHOOL-AGE CHILDREN PRESENT IN HH
IF B3 = 5-18 YEARS (SCHOOL-AGE CHILDREN PRESENT IN HH), ASK:
G2. During the past 30 days, did any children in the household (between 5 and18 years old) receive free or reduced-cost breakfasts at school?
YES ............................................................................. 1
NO ............................................................................... 0
DON’T KNOW .............................................................. d
REFUSED.................................................................... r
8/22/2019 USDA Report re SNAP & Food Security 08/2013
http://slidepdf.com/reader/full/usda-report-re-snap-food-security-082013 254/355
Prepared by Mathematica Policy Research 31 (3-8-11)
B3 LT 5 YEARS (PRE-SCHOOL AGED CHILDREN IN HH)
your child IF B3 LT 5 YEARS FOR ONE CHILD (ONE PRE-SCHOOL CHILD IN HH)
any children in the household IF B3 LT 5 YEARS FOR MORE THAN ONE CHILD
G3. During the past 30 days, did (your child/any children in the household) receivefree or reduced-cost food at a day-care or Head Start program?
YES ............................................................................. 1
NO ............................................................................... 0
DON’T KNOW .............................................................. d
REFUSED.................................................................... r
B3 LT 5 YEARS; OR B3 = 15-45 AND B3A = FEMALE (FEMALE AGE 15-45 IN HH) ORSAMPLE MEMBER IS RESPONDENT (A1=1 OR A2=1) AND AGE IN LOAD FILE = 15-45; OR
A1 OR A2 NE TO 1 (SAMPLE MEMBER IS NOT RESPONDENT)
women IF B3 NE 4 OR LESS (NO CHILDREN 0-4 IN HH)women or children IF B3 LT 5 YEARS AND B3 = 15-45 AND B3a=FEMALE (FEMALE AGE15-45 IN HH)
children IF B3 LT 5 YEARS AND B3 NE 15-45 FOR ANY FEMALE IN HH
IF B3 <5, OR FEMALE AGE 15-45 IN HH, ASK:
G4. During the past 30 days, did any (women/women or children/children) in thishousehold get food through the WIC program?
YES ............................................................................. 1
NO ............................................................................... 0DON’T KNOW .............................................................. d
REFUSED.................................................................... r
8/22/2019 USDA Report re SNAP & Food Security 08/2013
http://slidepdf.com/reader/full/usda-report-re-snap-food-security-082013 255/355
Prepared by Mathematica Policy Research 32 (3-8-11)
H. FOOD SECURITY AND SUFFICIENCY
ALL
you AND I AND my IF B1 = 0 OR B3 LE 17 AND B2 NE 1 OR 2 (NO OTHER ADULTS IN HH)
your household AND we AND our IF B1 NE 0 AND B3 GE 18 (MORE THAN ONE ADULT INHH) OR B2=1 OR 2
Now, I’m going to read you several statements that people have made about their foodsituation. For these statements, please tell me whether the statement was often true,sometimes true, or never
H1. The first statement is, “(I/We) worried whether (my/our) food would run outbefore (I/we) got money to buy more.” Was that
true for (you/your household) in the last 30 days.
often true, sometimes true,or never
CODE ONE ONLY
true for (you/your household) in the last 30 days?
OFTEN TRUE .............................................................. 1
SOMETIMES TRUE ..................................................... 2NEVER TRUE .............................................................. 3
DON’T KNOW .............................................................. d
REFUSED.................................................................... r
ALL
I AND you IF B1 = 0 OR B3 LE 17 AND B2 NE 1 OR 2 (NO OTHER ADULTS IN HH)
we AND your household IF B1 NE 0 AND B3 GE 18 (MORE THAN ONE ADULT IN HH) ORB2 = 1 OR 2
H2. “The food that (I/we) bought just didn’t last, and (I/we) didn’t have money to getmore.” Was that often, sometimes, or never true for (you/your household) inthe last 30 days?
CODE ONE ONLY
OFTEN TRUE .............................................................. 1
SOMETIMES TRUE ..................................................... 2
NEVER TRUE .............................................................. 3
DON’T KNOW .............................................................. d
REFUSED.................................................................... r
8/22/2019 USDA Report re SNAP & Food Security 08/2013
http://slidepdf.com/reader/full/usda-report-re-snap-food-security-082013 256/355
Prepared by Mathematica Policy Research 33 (3-8-11)
ALL
I AND you IF B1 = 0 OR B3 LE 17 AND B2 NE 1 OR 2 (NO OTHER ADULTS IN HH)
we AND your household IF B1 NE 0 AND B3 GE 18 (MORE THAN ONE ADULT IN HH) ORB2 = 1 OR 2
H3. “(I/We) couldn’t afford to eat balanced meals.” Was that often, sometimes, or
never
CODE ONE ONLY
true for (you/your household) in the last 30 days?
OFTEN TRUE .............................................................. 1
SOMETIMES TRUE ..................................................... 2
NEVER TRUE .............................................................. 3
DON’T KNOW .............................................................. d
REFUSED.................................................................... r
INSERT CHECK: IF AFFIRMATIVE RESPONSE (i.e., OFTEN TRUE OR SOMETIMES TRUE)TO ONE OR MORE OF QUESTIONS H1-H3, THEN CONTINUE, ELSE SKIP TO H10.
H1, H2, OR H3 = 1 OR 2
you IF B1 = 0 OR B3 LE 17 AND B2 NE 1 OR 2 (NO OTHER ADULTS IN HH)
you or other adults in your household IF B1 NE 0 AND B3 GE 18 (MORE THAN ONE ADULT IN HH)
H4. In the last 30 days, did (you/you or other adults in your household) ever cut thesize of your meals or skip meals because there wasn’t enough money for food?
YES ............................................................................. 1NO ............................................................................... 0 GO TO H5
DON’T KNOW .............................................................. d GO TO H5
REFUSED.................................................................... r GO TO H5
H4 = 1
H4a. How many days did this happen in the last 30 days?
| | | NUMBER OF DAYS (1 – 30) GO TO H5
DON’T KNOW .............................................................. d
REFUSED.................................................................... r GO TO H5

8/22/2019 USDA Report re SNAP & Food Security 08/2013
http://slidepdf.com/reader/full/usda-report-re-snap-food-security-082013 257/355
Prepared by Mathematica Policy Research 34 (3-8-11)
H4A = D
H4b. Do you think it was more than one or two days?
YES ............................................................................. 1
NO ............................................................................... 0
DON’T KNOW .............................................................. dREFUSED.................................................................... r
H1, H2, OR H3 = 1 OR 2
H5. In the last 30 days, did you ever eat less than you felt you should becausethere wasn’t enough money for food?
YES ............................................................................. 1
NO ............................................................................... 0
DON’T KNOW .............................................................. d
REFUSED.................................................................... r
H1, H2, OR H3 = 1 OR 2
H6. In the last 30 days, were you ever hungry but didn’t eat because there wasn’tenough money for food?
YES ............................................................................. 1
NO ............................................................................... 0
DON’T KNOW .............................................................. d
REFUSED.................................................................... r
H1, H2, OR H3 = 1 OR 2
H7. In the last 30 days, did you lose weight because there wasn’t enough moneyfor food?
YES ............................................................................. 1
NO ............................................................................... 0
DON’T KNOW .............................................................. d
REFUSED.................................................................... r
INSERT CHECK: IF AFFIRMATIVE RESPONSE (i.e., OFTEN TRUE OR SOMETIMES TRUE)TO ONE OR MORE OF QUESTIONS H4-H7, THEN CONTINUE, ELSE SKIPTO H10.
8/22/2019 USDA Report re SNAP & Food Security 08/2013
http://slidepdf.com/reader/full/usda-report-re-snap-food-security-082013 258/355
Prepared by Mathematica Policy Research 35 (3-8-11)
H4, H5, H6, OR H7 = 1
you IF B1 = 0 OR B3 LE 17 AND B2 NE 1 OR 2 (NO OTHER ADULTS IN HH)
you or other adults in your household IF B1 NE 0 AND B3 GE 18 (MORE THAN ONE ADULT IN HH)
H8. In the last 30 days, did (you/you or other adults in your household) ever not eat
for a whole day because there wasn’t enough money for food?
YES ............................................................................. 1
NO ............................................................................... 0 GO TO H10
DON’T KNOW .............................................................. d GO TO H10
REFUSED.................................................................... r GO TO H10
H8 = 1
H9. How many times did this happen in the last 30 days?
| | | NUMBER OF TIMES (1 – 30) GO TO H10
DON’T KNOW .............................................................. d
REFUSED.................................................................... r GO TO H10
H9 = D
H9a. Do you think it was more than one or two days?
YES ............................................................................. 1
NO ............................................................................... 0
DON’T KNOW .............................................................. d
REFUSED.................................................................... r
8/22/2019 USDA Report re SNAP & Food Security 08/2013
http://slidepdf.com/reader/full/usda-report-re-snap-food-security-082013 259/355
Prepared by Mathematica Policy Research 36 (3-8-11)
B3 = 0 – 18 (CHILDREN IN HOUSEHOLD)
I AND my AND I was AND you IF B3 LE 17 AND B2 NE 1 OR 2 (NO OTHER ADULT/PARTNER IN HH) AND B2 NE 1 OR 2
we AND our AND we were AND your household IF B3 GE 18 (MORE THAN ONE ADULT INHH) OR B2 = 1 OR 2
the child in IF B3 LE 17 AND B2 NE 1 OR 2 FOR JUST ONE INSTANCE (ONE CHILD IN HH)
the children IF B3 LE 17 AND B2 NE 1 OR 2 FOR MULTIPLE INSTANCES (MORE THANONE CHILD IN HH)
IF NO CHILDREN IN HOUSEHOLD, GO TO H17. ELSE ASK:
Now I’m going to read you several statements that people have made about the foodsituation of their children. For these statements, please tell me whether the statementwas often true, sometimes true, or never true in the last 30 days for any child under 18 years old living in the household.
H10. “(I/We) relied on only a few kinds of low-cost food to feed (the child in (my/our)household/the children) because (I was/we were) running out of money to buyfood.” Was that often, sometimes, or never
CODE ONE ONLY
true for (you/your household) in thelast 30 days?
OFTEN TRUE .............................................................. 1
SOMETIMES TRUE ..................................................... 2
NEVER TRUE .............................................................. 3
DON’T KNOW .............................................................. d
REFUSED.................................................................... r
B3 = 0 – 18 (CHILDREN IN HOUSEHOLD)
I AND my household AND you IF B3 LE 17 AND B2 NE 1 OR 2 (NO OTHER ADULT/PARTNER IN HH)
we AND our household AND your household IF B3 GE 18 (MORE THAN ONE ADULT INHH) OR B2 = 1 OR 2
the child in IF B3 LE 17 AND B2 NE 1 OR 2 FOR JUST ONE INSTANCE (ONE CHILD IN HH)
the children IF B3 LE 17 AND B2 NE 1 OR 2 FOR MULTIPLE INSTANCES (MORE THANONE CHILD IN HH)
H11. “(I/We) couldn’t feed (the child in (my/our)household/ the children) a balancedmeal, because (I/we) couldn’t afford that.” Was that often, sometimes, or never
CODE ONE ONLY
true for (you/your household) in the last 30 days?
OFTEN TRUE .............................................................. 1
SOMETIMES TRUE ..................................................... 2
NEVER TRUE .............................................................. 3
DON’T KNOW .............................................................. d
REFUSED.................................................................... r
8/22/2019 USDA Report re SNAP & Food Security 08/2013
http://slidepdf.com/reader/full/usda-report-re-snap-food-security-082013 260/355
Prepared by Mathematica Policy Research 37 (3-8-11)
B3 = 0 – 18 (CHILDREN IN HOUSEHOLD)
The child in IF B3 LE 17 AND B2 NE 1 OR 2 FOR JUST ONE INSTANCE (ONE CHILD INHH)
the children were IF B3 LE 17 AND B2 NE 1 OR 2 FOR MULTIPLE INSTANCES (MORETHAN ONE CHILD IN HH)
my AND I AND you IF B3 LE 17 AND B2 NE 1 OR 2 (NO OTHER ADULTS/PARTNER IN HH)
our AND we AND your household IF B3 GE 18 (MORE THAN ONE ADULT IN HH) OR B2 = 1OR 2
H12. “(The child in (my/our) household was/The children were) not eating enoughbecause (I/we) just couldn’t afford enough food.” Was that often, sometimes,or never
CODE ONE ONLY
true for (you/your household) in the last 30 days?
OFTEN TRUE .............................................................. 1
SOMETIMES TRUE ..................................................... 2
NEVER TRUE .............................................................. 3
DON’T KNOW .............................................................. dREFUSED.................................................................... r
H10, H11, OR H12 = 1 OR 2
the child’s IF B3 LE 17 AND B2 NE 1 OR 2 FOR JUST ONE INSTANCE (ONE CHILD IN HH)
any of the children’s IF B3 LE 17 AND B2 NE 1 OR 2 FOR MULTIPLE INSTANCES (MORETHAN ONE CHILD IN HH)
INSERT CHECK: IF AFFIRMATIVE RESPONSE (i.e., OFTEN TRUE OR SOMETIMES TRUE)TO ONE OR MORE OF QUESTIONS H10-H12, THEN CONTINUE, ELSESKIP TO H17.
H13. In the last 30 days, did you ever cut the size of (the child’s/any of thechildren’s) meals because there wasn’t enough money for food?
YES ............................................................................. 1
NO ............................................................................... 0
DON’T KNOW .............................................................. d
REFUSED.................................................................... r
H10, H11, OR H12 = 1 OR 2
the child’sIF B3 LE 17 AND B2 NE 1 OR 2 FOR JUST ONE INSTANCE (ONE CHILD IN HH)
any of the children’s IF B3 LE 17 AND B2 NE 1 OR 2 FOR MULTIPLE INSTANCES (MORETHAN ONE CHILD IN HH)
H14. In the last 30 days, did (the child/any of the children) ever skip a meal becausethere wasn’t enough money for food?
YES ............................................................................. 1
NO ............................................................................... 0 GO TO H15
DON’T KNOW .............................................................. d GO TO H15
REFUSED.................................................................... r GO TO H15

8/22/2019 USDA Report re SNAP & Food Security 08/2013
http://slidepdf.com/reader/full/usda-report-re-snap-food-security-082013 261/355
Prepared by Mathematica Policy Research 38 (3-8-11)
H14 = 1
H14a. How many days did this happen in the last 30 days?
| | | NUMBER OF DAYS (1 – 30) GO TO H15
DON’T KNOW .............................................................. d
REFUSED.................................................................... r GO TO H15
H14A = D
H14b. Do you think it was more than one or two days?
YES ............................................................................. 1
NO ............................................................................... 0
DON’T KNOW .............................................................. d
REFUSED.................................................................... r
H10, H11, OR H12 = 1 OR 2
was the child IF B3 LE 17 AND B2 NE 1 OR 2 FOR JUST ONE INSTANCE (ONE CHILD INHH)
were the children IF B3 LE 17 AND B2 NE 1 OR 2 FOR MULTIPLE INSTANCES (MORETHAN ONE CHILD IN HH)
H15. In the last 30 days, (was the child/were the children) ever hungry but you justcouldn’t afford more food?
YES ............................................................................. 1
NO ............................................................................... 0
DON’T KNOW .............................................................. d
REFUSED.................................................................... r
H10, H11, OR H12 = 1 OR 2
the child IF B3 LE 17 AND B2 NE 1 OR 2 FOR JUST ONE INSTANCE (ONE CHILD IN HH)
any of the children IF B3 LE 17 AND B2 NE 1 OR 2 FOR MULTIPLE INSTANCES (MORETHAN ONE CHILD IN HH)
H16. In the last 30 days, did (the child/any of the children) ever not eat for a wholeday because there wasn’t enough money for food?
YES ............................................................................. 1
NO ............................................................................... 0
DON’T KNOW .............................................................. d
REFUSED.................................................................... r
8/22/2019 USDA Report re SNAP & Food Security 08/2013
http://slidepdf.com/reader/full/usda-report-re-snap-food-security-082013 262/355
Prepared by Mathematica Policy Research 39 (3-8-11)
ALL
or someone in your household IF B1 NE 0 AND B3 GE 18
you IF B1 = 0
you or other adults in your household IF B1 NE 0 AND B3 GE 18
H17. The next questions are about some community programs you (or someone in your household) may have participated in during the past 30 days.
In the last 30 days, did (you/ you or other adults in your household) ever getemergency food from a church, a food pantry or food bank?
PROBE: This includes all religious and charitable organizations.
YES ............................................................................. 1
NO ............................................................................... 0
DON’T KNOW .............................................................. d
REFUSED.................................................................... r
ALL
you IF B1 = 0
anyone in this household IF B1 NE 0 AND B3 GE 18
H18. During the past 30 days, did (you/anyone in this household) go to a communityprogram or senior center to eat prepared meals?
YES ............................................................................. 1
NO ............................................................................... 0
DON’T KNOW .............................................................. d
REFUSED.................................................................... r
ALL
you IF B1 = 0
you or other adults in your household IF B1 NE 0 AND B3 GE 18
H19. During the last 30 days, did (you/you or other adults in your household) ever eat any meals at a soup kitchen or shelter?
YES ............................................................................. 1
NO ............................................................................... 0
DON’T KNOW .............................................................. d
REFUSED.................................................................... r
8/22/2019 USDA Report re SNAP & Food Security 08/2013
http://slidepdf.com/reader/full/usda-report-re-snap-food-security-082013 263/355
Prepared by Mathematica Policy Research 40 (3-8-11)
ALL
you IF B1 = 0
anyone in this household IF B1 NE 0 AND B3 GE 18
H20. During the past 30 days, did (you/anyone in this household) receive any mealsfrom “Meals on Wheels” or any other program delivering meals to your home?
YES ............................................................................. 1
NO ............................................................................... 0
DON’T KNOW .............................................................. d
REFUSED.................................................................... r
8/22/2019 USDA Report re SNAP & Food Security 08/2013
http://slidepdf.com/reader/full/usda-report-re-snap-food-security-082013 264/355
Prepared by Mathematica Policy Research 41 (3-8-11)
I. HOUSEHOLD RESOURCES
ALL
or anyone in your household IF B1 NE 0
LAST MONTH FROM MONTH PRIOR TO INTERVIEW DATE
STATE WELFARE NAME FROM StateWelfare_Name
The next questions are about sources of income. The answer to these and all other questions on this survey will be kept strictly confidential and will never be associatedwith your name.
I1a_a. During (LAST MONTH), did you (or anyone in your household) receive any…
TANF, Temporary Assistance to Needy Families (also known as [STATEWELFARE NAME])?
YES ............................................................................. 1
NO ............................................................................... 0DON’T KNOW .............................................................. d
REFUSED.................................................................... r
ALL
or anyone in your household IF B1 NE 0
I1a_b. (During [LAST MONTH], did you (or anyone in your household) receive…)
Other welfare such as General Assistance?
YES ............................................................................. 1
NO ............................................................................... 0
DON’T KNOW .............................................................. d
REFUSED.................................................................... r
ALL
or anyone in your household IF B1 NE 0
I1a_c. (During [LAST MONTH], did you (or anyone in your household) receive any…)
Social Security checks from the government for retirement, disability, or survivors’ benefits?
YES ............................................................................. 1
NO ............................................................................... 0
DON’T KNOW .............................................................. d

8/22/2019 USDA Report re SNAP & Food Security 08/2013
http://slidepdf.com/reader/full/usda-report-re-snap-food-security-082013 265/355
Prepared by Mathematica Policy Research 42 (3-8-11)
REFUSED.................................................................... r
ALL
or anyone in your household IF B1 NE 0
I1a_d. (During [LAST MONTH], did you (or anyone in your household) receive…)
Other retirement benefits such as a government or private pension or annuity?
YES ............................................................................. 1
NO ............................................................................... 0
DON’T KNOW .............................................................. d
REFUSED.................................................................... r
ALL
or anyone in your household IF B1 NE 0
I1a_e. (During [LAST MONTH], did you (or anyone in your household) receive any…)
SSI or Supplemental Security Income from the federal, state, or localgovernment?
YES ............................................................................. 1
NO ............................................................................... 0
DON’T KNOW .............................................................. d
REFUSED.................................................................... r
ALL
or anyone in your household IF B1 NE 0
I1a_f. (During [LAST MONTH], did you (or anyone in your household) receive any…)
Veteran’s Benefits?
YES ............................................................................. 1
NO ............................................................................... 0
DON’T KNOW .............................................................. d
REFUSED.................................................................... r
8/22/2019 USDA Report re SNAP & Food Security 08/2013
http://slidepdf.com/reader/full/usda-report-re-snap-food-security-082013 266/355
Prepared by Mathematica Policy Research 43 (3-8-11)
ALL
or anyone in your household IF B1 NE 0
I1a_g. (During [LAST MONTH], did you (or anyone in your household) receive any…)
Unemployment Insurance or worker’s compensation benefits?
YES ............................................................................. 1
NO ............................................................................... 0
DON’T KNOW .............................................................. d
REFUSED.................................................................... r
ALL
or anyone in your household IF B1 NE 0I1a_h. (During [LAST MONTH], did you (or anyone in your household) receive any…)
Child support payments?
YES ............................................................................. 1
NO ............................................................................... 0
DON’T KNOW .............................................................. d
REFUSED.................................................................... r
ALL
or anyone in your household IF B1 NE 0
I1a_i. (During [LAST MONTH], did you (or anyone in your household) receive any…)
Payments from roomers or boarders?
YES ............................................................................. 1
NO ............................................................................... 0
DON’T KNOW .............................................................. dREFUSED.................................................................... r
8/22/2019 USDA Report re SNAP & Food Security 08/2013
http://slidepdf.com/reader/full/usda-report-re-snap-food-security-082013 267/355
Prepared by Mathematica Policy Research 44 (3-8-11)
ALL
or anyone in your household IF B1 NE 0
I1a_j. (During [LAST MONTH], did you (or anyone in your household) receive any…)
Financial support from friends or family?
YES ............................................................................. 1
NO ............................................................................... 0
DON’T KNOW .............................................................. d
REFUSED.................................................................... r
ALL
or anyone in your household IF B1 NE 0I1a_k. (During [LAST MONTH], did you (or anyone in your household) receive …)
Any other income besides earnings?
YES ............................................................................. 1
NO ............................................................................... 0
DON’T KNOW .............................................................. d
REFUSED.................................................................... r
I1A_K = 1
I1a_k_Specify What is that other income?
______________________________________________
I1A_A = 1
STATE WELFARE NAME FROM StateWelfare_Name
I1b_a. How much did you receive last month from TANF, Temporary Assistance toNeedy Families (also known as [STATE WELFARE NAME])?
$| | | | | ENTER AMOUNT (0 – 9999)
DON’T KNOW .............................................................. d
REFUSED.................................................................... r
8/22/2019 USDA Report re SNAP & Food Security 08/2013
http://slidepdf.com/reader/full/usda-report-re-snap-food-security-082013 268/355
Prepared by Mathematica Policy Research 45 (3-8-11)
I1A_A=1 AND B1 NE 0 AND B3 GE 18
I1c_a. How much did other people in your household receive from TANF last monthaltogether?
$| | | | | ENTER AMOUNT (0 – 9999)
DON’T KNOW .............................................................. d
REFUSED.................................................................... r
HARD CHECK: IF I1A_A = 1 AND BOTH I1B_A AND I1C_A = 0: I must have made a mistake.I previously recorded that you or someone in your household received TANF last month.Is there an error?
I1A_B = 1
I1b_b. How much did you receive last month from Other welfare such as General
Assistance?
$| | | | | ENTER AMOUNT (0 – 9999)
DON’T KNOW .............................................................. d
REFUSED.................................................................... r
I1A_B=1 AND B1 NE 0 AND B3 GE 18
I1c_b. How much did other people in your household receive from Other welfare such
as General Assistance?
$| | | | | ENTER AMOUNT (0 – 9999)
DON’T KNOW .............................................................. d
REFUSED.................................................................... r
HARD CHECK: IF I1A_B = 1 AND BOTH I1B_B AND I1C_B = 0: I must have made a mistake.I previously recorded that you or someone in your household received Other welfare lastmonth. Is there an error?
I1A_C = 1
I1b_c. How much did you receive last month from Social Security checks from thegovernment for retirement, disability, or survivors’ benefits?
$| | | | | ENTER AMOUNT (0 – 9999)
DON’T KNOW .............................................................. d

8/22/2019 USDA Report re SNAP & Food Security 08/2013
http://slidepdf.com/reader/full/usda-report-re-snap-food-security-082013 269/355
Prepared by Mathematica Policy Research 46 (3-8-11)
REFUSED.................................................................... r
I1A_C=1 AND B1 NE 0 AND B3 GE 18
I1c_c. How much did other people in your household receive from Social Securitychecks from the government for retirement, disability, or survivors’ benefits?
$| | | | | ENTER AMOUNT (0 – 9999)
DON’T KNOW .............................................................. d
REFUSED.................................................................... r
HARD CHECK: IF I1A_C = 1 AND BOTH I1B_C AND I1C_C = 0: I must have made amistake. I previously recorded that you or someone in your household received SocialSecurity checks last month. Is there an error?
I1A_D = 1
I1b_d. How much did you receive last month from Other retirement benefits such as agovernment or private pension or annuity?
$| | | | | ENTER AMOUNT (0 – 9999)
DON’T KNOW .............................................................. d
REFUSED.................................................................... r
I1A_D=1 AND B1 NE 0 AND B3 GE 18
I1c_d. How much did other people in your household receive from Other retirementbenefits such as a government or private pension or annuity?
$| | | | | ENTER AMOUNT (0 – 9999)
DON’T KNOW .............................................................. d
REFUSED.................................................................... r
HARD CHECK: IF I1A_D = 1 AND BOTH I1B_D AND I1C_D = 0: I must have made a
mistake. I previously recorded that you or someone in your household received Other retirement benefits last month. Is there an error?
I1A_E = 1
I1b_e. How much did you receive last month from SSI or Supplemental SecurityIncome from the federal, state, or local government?
$| | | | | ENTER AMOUNT (0 – 9999)
8/22/2019 USDA Report re SNAP & Food Security 08/2013
http://slidepdf.com/reader/full/usda-report-re-snap-food-security-082013 270/355
Prepared by Mathematica Policy Research 47 (3-8-11)
DON’T KNOW .............................................................. d
REFUSED.................................................................... r
I1A_E=1 AND B1 NE 0
I1c_e. How much did other people in your household receive from SSI or Supplemental Security Income from the federal, state, or local government?
$| | | | | ENTER AMOUNT (0 – 9999)
DON’T KNOW .............................................................. d
REFUSED.................................................................... r
HARD CHECK: IF I1A_E = 1 AND BOTH I1B_E AND I1C_E = 0: I must have made a mistake.I previously recorded that you or someone in your household received SSI or Supplemental Security Income last month. Is there an error?
I1A_F = 1
I1b_f. How much did you receive last month from Veteran’s Benefits?
$| | | | | ENTER AMOUNT (0 – 9999)
DON’T KNOW .............................................................. d
REFUSED.................................................................... r
I1A_F=1 AND B1 NE 0 AND B3 GE 18I1c_f. How much did other people in your household receive from Veteran’s
Benefits?
$| | | | | ENTER AMOUNT (0 – 9999)
DON’T KNOW .............................................................. d
REFUSED.................................................................... r
HARD CHECK: IF I1A_F = 1 AND BOTH I1B_F AND I1C_F = 0: I must have made a mistake.
I previously recorded that you or someone in your household received Veteran’s Benefitslast month. Is there an error?
I1A_G = 1
I1b_g. How much did you receive last month from Unemployment Insurance or worker’s compensation benefits?
8/22/2019 USDA Report re SNAP & Food Security 08/2013
http://slidepdf.com/reader/full/usda-report-re-snap-food-security-082013 271/355
Prepared by Mathematica Policy Research 48 (3-8-11)
$| | | | | ENTER AMOUNT (0 – 9999)
DON’T KNOW .............................................................. d
REFUSED.................................................................... r
I1A_G=1 AND B1 NE 0 AND B3 GE 18
I1c_g. How much did other people in your household receive from UnemploymentInsurance or worker’s compensation benefits?
$| | | | | ENTER AMOUNT (0 – 9999)
DON’T KNOW .............................................................. d
REFUSED.................................................................... r
HARD CHECK: IF I1A_G = 1 AND BOTH I1B_G AND I1C_G = 0: I must have made amistake. I previously recorded that you or someone in your household receivedUnemployment Insurance or worker’s compensation benefits last month. Is there an
error?
I1A_H = 1
I1b_h. How much did you receive last month from Child support payments?
$| | | | | ENTER AMOUNT (0 – 9999)
DON’T KNOW .............................................................. d
REFUSED.................................................................... r
I1A_H=1 AND B1 NE 0 AND B3 GE 18
I1c_h. How much did other people in your household receive from Child supportpayments?
$| | | | | ENTER AMOUNT (0 – 9999)
DON’T KNOW .............................................................. d
REFUSED.................................................................... r
HARD CHECK: IF I1A_H = 1 AND BOTH I1B_H AND I1C_H = 0: I must have made amistake. I previously recorded that you or someone in your household received Childsupport payments last month. Is there an error?
I1A_I = 1
I1b_i. How much did you receive last month from Payments from roomers or boarders?
8/22/2019 USDA Report re SNAP & Food Security 08/2013
http://slidepdf.com/reader/full/usda-report-re-snap-food-security-082013 272/355
Prepared by Mathematica Policy Research 49 (3-8-11)
$| | | | | ENTER AMOUNT (0 – 9999)
DON’T KNOW .............................................................. d
REFUSED.................................................................... r
I1A_I=1 AND B1 NE 0 AND B3 GE 18
I1c_i. How much did other people in your household receive from Payments fromroomers or boarders?
$| | | | | ENTER AMOUNT (0 – 9999)
DON’T KNOW .............................................................. d
REFUSED.................................................................... r
HARD CHECK: IF I1A_I = 1 AND BOTH I1B_I AND I1C_I = 0: I must have made a mistake. Ipreviously recorded that you or someone in your household received Payments fromroomers or boarders last month. Is there an error?
I1A_J = 1
I1b_j. How much did you receive last month from Financial support from friends or family?
$| | | | | ENTER AMOUNT (0 – 9999)
DON’T KNOW .............................................................. d
REFUSED.................................................................... r
I1A_J=1 AND B1 NE 0 AND B3 GE 18
I1c_j. How much did other people in your household receive from Financial supportfrom friends or family?
$| | | | | ENTER AMOUNT (0 – 9999)
DON’T KNOW .............................................................. d
REFUSED.................................................................... r
HARD CHECK: IF I1A_J = 1 AND BOTH I1B_J AND I1C_J = 0: I must have made a mistake.I previously recorded that you or someone in your household received Financial supportfrom friends or family last month. Is there an error?
I1A_K = 1
I1b_k. How much did you receive last month from (FILL FROM I1a_k_Specify)?
8/22/2019 USDA Report re SNAP & Food Security 08/2013
http://slidepdf.com/reader/full/usda-report-re-snap-food-security-082013 273/355
Prepared by Mathematica Policy Research 50 (3-8-11)
$| | | | | ENTER AMOUNT (0 – 9999)
DON’T KNOW .............................................................. d
REFUSED.................................................................... r
I1A_K=1 AND B1 NE 0 AND B3 GE 18
I1c_k. How much did other people in your household receive from (FILL FROMI1a_k_Specify)?
$| | | | | ENTER AMOUNT (0 – 9999)
DON’T KNOW .............................................................. d
REFUSED.................................................................... r
HARD CHECK: IF I1A_K = 1 AND BOTH I1B_K AND I1C_K = 0: I must have made a mistake.I previously recorded that you or someone in your household received (FILL FROMI1a_k_Specify) last month. Is there an error?
ALL
I2. Are you currently working at a job for pay? Include any self-employment.
YES ............................................................................. 1
NO ............................................................................... 0 GO TO I6
DON’T KNOW .............................................................. d GO TO I6
REFUSED.................................................................... r GO TO I6
I2 = 1
I3. How many hours do you usually work per week on this job?
| | | NUMBER OF HOURS (1 – 80)
DON’T KNOW .............................................................. d
REFUSED.................................................................... r
SOFT CHECK: IF GT 60 I just want to make sure I recorded you answer correctly. Did yousay NUM?
I2 = 1
I4. How much do you earn per hour on this job, before taxes and other deductions?
$ | | |.| | | HOURLY WAGE (1.00 – 40.99) GO TO I6
NOT PAID BY THE HOUR ........................................... 0
DON’T KNOW .............................................................. d GO TO I6
8/22/2019 USDA Report re SNAP & Food Security 08/2013
http://slidepdf.com/reader/full/usda-report-re-snap-food-security-082013 274/355
Prepared by Mathematica Policy Research 51 (3-8-11)
REFUSED.................................................................... r GO TO I6
SOFT CHECK: IF GT 20 I just want to make sure I recorded your answer correctly. Didyou say NUM?
I4 = 0
I5. ENTER AMOUNT
$ | | |,| | | | (1 - 99999)
ENTER PAY PERIOD
CODE ONE ONLY
WEEK .......................................................................... 1
DAY ............................................................................. 2
EVERY TWO WEEKS ................................................. 3
TWICE A MONTH ........................................................ 4
MONTHLY ................................................................... 5
YEARLY ...................................................................... 6
OTHER (SPECIFY) ...................................................... 7
(STRING (NUM))
DON’T KNOW .............................................................. d
REFUSED.................................................................... r
SOFT CHECK: IF GT $2,000 / MONTH I just want to make sure I recorded your responsecorrectly. Did you say NUM PER UNIT?
B1 NE 0 AND B3 GE15
else IF I2 = 1
IF R LIVES ALONE, GO TO I9
I6. Does anyone (else) in your household work at a job for pay?
YES ............................................................................. 1
NO ............................................................................... 0 GO TO I9
DON’T KNOW .............................................................. d GO TO I9
REFUSED.................................................................... r GO TO I9

8/22/2019 USDA Report re SNAP & Food Security 08/2013
http://slidepdf.com/reader/full/usda-report-re-snap-food-security-082013 275/355
Prepared by Mathematica Policy Research 52 (3-8-11)
I6 = 1
other IF I2 = 1
I7. How many (other) people in your household work at a job for pay?
PROBE: Not including yourself.
| | | NUMBER OF WORKING HOUSEHOLD MEMBERS (1 - 10)
NONE .......................................................................... 0 GO TO I9
DON’T KNOW .............................................................. d
REFUSED.................................................................... r
HARD CHECK: IF GT TOTAL HH MEMBERS COLLECTED AT B3 I’m sorry. Earlier in theinterview, I recorded that there were less people living in your HH. Did I make an error?
I7 GT 0else IF I2 = 1
I7a. Who (else) in your household works at a job for pay?
[LIST ALL MEMBERS OF HOUSEHOLD AGE 15 AND OVER FROM B1]
CODE ALL THAT APPLY
NAME 1 ....................................................................... 2
NAME 2 ....................................................................... 3
NAME 3 ....................................................................... 4
NAME 4 ....................................................................... 5
I6 = 1
PERSON 1 FIRST NAME FOR FIRST PERSON SELECTED FROM I7a.
I8_1a. How many hours per week does (PERSON 1) person usually work?
| | | NUMBER OF HOURS (0 - 80)
DON’T KNOW .............................................................. d
REFUSED.................................................................... r
SOFT CHECK: IF GT 60 I just want to make sure I recorded you answer correctly. Did yousay NUM?

8/22/2019 USDA Report re SNAP & Food Security 08/2013
http://slidepdf.com/reader/full/usda-report-re-snap-food-security-082013 276/355
Prepared by Mathematica Policy Research 53 (3-8-11)
I8_1A > 0
PERSON 1 FIRST NAME FOR FIRST PERSON SELECTED FROM I7a.
I8_1b. How much does (PERSON 1) earn per hour on this job, before taxes and other deductions?
PROBE: Your best estimate is fine.
$ | | |.| | | HOURLY WAGE (1 – 40) GO TO LOOP
NOT PAID BY THE HOUR ........................................... 0
DON’T KNOW .............................................................. d GO TO LOOP
REFUSED.................................................................... r GO TO LOOP
SOFT CHECK: IF GT 20 I just want to make sure I recorded your answer correctly. Didyou say NUM?
I8_1B = 0
I8_1c. ENTER AMOUNT
$ | | |,| | | |.| | | (1 – 99999)
ENTER PAY PERIOD
CODE ONE ONLY
WEEK .......................................................................... 1
DAY ............................................................................. 2
EVERY TWO WEEKS ................................................. 3
TWICE A MONTH ........................................................ 4
MONTHLY ................................................................... 5
YEARLY ...................................................................... 6
OTHER (SPECIFY) ...................................................... 7(STRING (NUM))
DON’T KNOW .............................................................. d
REFUSED.................................................................... r
SOFT CHECK: IF GT $2,000 PER MONTH I just want to make sure I recorded your answer correctly. Did you say NUM PER UNIT?

8/22/2019 USDA Report re SNAP & Food Security 08/2013
http://slidepdf.com/reader/full/usda-report-re-snap-food-security-082013 277/355
Prepared by Mathematica Policy Research 54 (3-8-11)
I8_1A > 0
PERSON 2 FIRST NAME FOR NEXT MEMBER OF HH SELECTED AT I7a.
I8_2a. How many hours per week does (PERSON 2) person usually work?
| | | NUMBER OF HOURS (0 - 80)
DON’T KNOW .............................................................. d
REFUSED.................................................................... r
SOFT CHECK: IF GT 60 I just want to make sure I recorded you answer correctly. Did yousay NUM?
I8_2a > 0
PERSON 2 FILL FIRST NAME FOR NEXT MEMBER OF HH SELECTED AT I7a.
I8_2b. How much does (PERSON 2) earn per hour on this job, before taxes and other deductions?
PROBE: Your best estimate is fine.
$ | | |.| | | HOURLY WAGE (1 – 40) GO TO LOOP
NOT PAID BY THE HOUR ........................................... 0
DON’T KNOW .............................................................. d GO TO LOOP
REFUSED.................................................................... r GO TO LOOP
SOFT CHECK: IF GT 20 I just want to make sure I recorded your answer correctly. Didyou say NUM?

8/22/2019 USDA Report re SNAP & Food Security 08/2013
http://slidepdf.com/reader/full/usda-report-re-snap-food-security-082013 278/355
Prepared by Mathematica Policy Research 55 (3-8-11)
I8_2B = 0
I8_2c. ENTER AMOUNT
$ | | |,| | | |.| | | (1 – 99999)
ENTER PAY PERIOD
CODE ONE ONLY
WEEK .......................................................................... 1
DAY ............................................................................. 2
EVERY TWO WEEKS ................................................. 3
TWICE A MONTH ........................................................ 4
MONTHLY ................................................................... 5
YEARLY ...................................................................... 6
OTHER (SPECIFY) ...................................................... 7(STRING 80)
DON’T KNOW .............................................................. d
REFUSED.................................................................... r
CONTINUE LOOP UNTIL ALL HOUSEHOLD MEMBERS SELECTED AT I7a ARE ACCOUNTED FOR
SOFT CHECK: IF GT $2,000 PER MONTH I just want to make sure I recorded your answer correctly. Did you say NUM PER UNIT?
ALL
or anyone in your household IF B1 NE 0
I9. Do you (or anyone in your household) currently own a car, truck, or other typeof vehicle?
YES ............................................................................. 1 GO TO I11
NO ............................................................................... 0
DON’T KNOW .............................................................. d
REFUSED.................................................................... r
I9 = 0, D OR R
I10. Do you have access to car, truck, or other type of vehicle when you need one?
YES ............................................................................. 1
NO ............................................................................... 0
DON’T KNOW .............................................................. d
8/22/2019 USDA Report re SNAP & Food Security 08/2013
http://slidepdf.com/reader/full/usda-report-re-snap-food-security-082013 279/355
Prepared by Mathematica Policy Research 56 (3-8-11)
REFUSED.................................................................... r
ALL
or anyone in your household IF B1 NE 0
I11. Do you (or anyone in your household) currently have a credit card that can be
used to make purchases?YES ............................................................................. 1
NO ............................................................................... 0
DON’T KNOW .............................................................. d
REFUSED.................................................................... r
ALL
I12. Now, I’d like to ask you some questions about where you live.
First, please tell me the kind of place where you now live?
CODE ONE ONLY
HOUSE, TOWNHOUSE, CONDO ............................... 1
MOBILE HOME/TRAILER ............................................ 2
APARTMENT ............................................................... 3
ROOM ......................................................................... 4
MOTEL/HOTEL ........................................................... 5 GO TO I14
HOMELESS, LIVING IN A SHELTER OR MISSION .... 6 GO TO I14
HOMELESS, LIVING ON THE STREET ...................... 7 GO TO I14
CAR, VAN OR RECREATIONAL VEHICLE ................. 8 GO TO I14
ABANDONED BUILDING ............................................ 9 GO TO I14
OTHER (SPECIFY) ...................................................... 10
(STRING 100)
DON’T KNOW .............................................................. d
REFUSED.................................................................... r
I12 = 1, 2, 3, 4, 10, D, OR R
I13. Do you…
CODE ONE ONLY
Own the place you live, ............................................. 1 GO TO I15
Rent your own place or contribute to rentat a friend or family’s place, or ................................. 2
Live rent free? ............................................................ 3

8/22/2019 USDA Report re SNAP & Food Security 08/2013
http://slidepdf.com/reader/full/usda-report-re-snap-food-security-082013 280/355
Prepared by Mathematica Policy Research 57 (3-8-11)
DON’T KNOW .............................................................. d
REFUSED.................................................................... r
I13 = 2, 3, D, OR R
I13a. Does your household receive Section 8 or Public Housing Assistance?
YES ............................................................................. 1NO ............................................................................... 0
DON’T KNOW .............................................................. d
REFUSED.................................................................... r
I14. Do you have access to a place where you can prepare a meal?
YES ............................................................................. 1
NO ............................................................................... 0
DON’T KNOW .............................................................. d
REFUSED.................................................................... r
I12 = 1, 2, 3, 4, 5, 6, D, OR R
I15. Do you currently have the following items in your home in working condition…
YES NODON’TKNOW REFUSED
a. Refrigerator? .............................................. 1 0 d r
b. Stand alone food freezer? .......................... 1 0 d r
c. Gas or electric stove? ................................. 1 0 d r
d. Microwave oven? ....................................... 1 0 d r
8/22/2019 USDA Report re SNAP & Food Security 08/2013
http://slidepdf.com/reader/full/usda-report-re-snap-food-security-082013 281/355
Prepared by Mathematica Policy Research 58 (3-8-11)
J. MENTAL HEALTH AND WELL-BEING
ALL
J1_a. Now I am going to ask you some questions about feelings you may haveexperienced over the past 30 days.
During the past 30 days
So sad that nothing could cheer you up?
, how often did you feel . . .
Would you say: All of the time, most of the time, some of the time, a little of thetime, or none
CODE ONE ONLY
of the time?
ALL OF THE TIME ....................................................... 1
MOST OF THE TIME ................................................... 2
SOME OF THE TIME ................................................... 3
A LITTLE OF THE TIME .............................................. 4
NONE OF THE TIME ................................................... 5
DON’T KNOW .............................................................. d
REFUSED.................................................................... r
ALL
J1_b. During the past 30 days
Nervous?
, how often did you feel . . .
PROBE: Would you say: All of the time, most of the time, some of the time, a little of the time, or none
CODE ONE ONLY
of the time?
ALL OF THE TIME ....................................................... 1
MOST OF THE TIME ................................................... 2
SOME OF THE TIME ................................................... 3
A LITTLE OF THE TIME .............................................. 4
NONE OF THE TIME ................................................... 5
DON’T KNOW .............................................................. d
REFUSED.................................................................... r

8/22/2019 USDA Report re SNAP & Food Security 08/2013
http://slidepdf.com/reader/full/usda-report-re-snap-food-security-082013 282/355
Prepared by Mathematica Policy Research 59 (3-8-11)
ALL
J1_c. During the past 30 days
Restless or fidgety?
, how often did you feel . . .
PROBE: Would you say: All of the time, most of the time, some of the time, a little of the time, or none
CODE ONE ONLY
of the time?
ALL OF THE TIME ....................................................... 1
MOST OF THE TIME ................................................... 2
SOME OF THE TIME ................................................... 3
A LITTLE OF THE TIME .............................................. 4
NONE OF THE TIME ................................................... 5
DON’T KNOW .............................................................. d
REFUSED.................................................................... r
ALL
J1_d. During the past 30 days
Hopeless?
, how often did you feel . . .
PROBE: Would you say: All of the time, most of the time, some of the time, a little of the time, or none
CODE ONE ONLY
of the time?
ALL OF THE TIME ....................................................... 1
MOST OF THE TIME ................................................... 2
SOME OF THE TIME ................................................... 3
A LITTLE OF THE TIME .............................................. 4
NONE OF THE TIME ................................................... 5
DON’T KNOW .............................................................. d
REFUSED.................................................................... r
ALL
J1_e. During the past 30 days
That everything was an effort?
, how often did you feel . . .
PROBE: Would you say: All of the time, most of the time, some of the time, a little of the time, or none
CODE ONE ONLY
of the time?
ALL OF THE TIME ....................................................... 1
MOST OF THE TIME ................................................... 2
SOME OF THE TIME ................................................... 3
A LITTLE OF THE TIME .............................................. 4

8/22/2019 USDA Report re SNAP & Food Security 08/2013
http://slidepdf.com/reader/full/usda-report-re-snap-food-security-082013 283/355
Prepared by Mathematica Policy Research 60 (3-8-11)
NONE OF THE TIME ................................................... 5
DON’T KNOW .............................................................. d
REFUSED.................................................................... r
ALL
J1_f. During the past 30 days
Worthless?
, how often did you feel . . .
PROBE: Would you say: All of the time, most of the time, some of the time, a little of the time, or none
CODE ONE ONLY
of the time?
ALL OF THE TIME ....................................................... 1
MOST OF THE TIME ................................................... 2
SOME OF THE TIME ................................................... 3
A LITTLE OF THE TIME .............................................. 4
NONE OF THE TIME ................................................... 5
DON’T KNOW .............................................................. d
REFUSED.................................................................... r
ALL
you IF B1 = 0
your household IF B1 NE 0
J2. If (you/your household) had a problem with which you needed help, for example, sickness or moving, how much help would you expect to get fromfamily living nearby?
CODE ONE ONLY
All of the help needed, ............................................... 1
Most of the help needed, ........................................... 2
Very little of the help needed, or ............................... 3
No help? ..................................................................... 4
DON’T KNOW .............................................................. d
REFUSED.................................................................... r
ALL
you IF B1 = 0
your household IF B1 NE 0
J3. If (you/your household) had a problem with which you needed help, how muchhelp would you expect to get from friends?
CODE ONE ONLY

8/22/2019 USDA Report re SNAP & Food Security 08/2013
http://slidepdf.com/reader/full/usda-report-re-snap-food-security-082013 284/355
Prepared by Mathematica Policy Research 61 (3-8-11)
All of the help needed, ............................................... 1
Most of the help needed, ........................................... 2
Very little of the help needed, or ............................... 3
No help? ..................................................................... 4
DON’T KNOW .............................................................. d
REFUSED.................................................................... r
ALL
you IF B1 = 0
your household IF B1 NE 0
J4. If (you/your household) had a problem with which you needed help, how muchhelp would you expect to get from other people in the community besidesfamily and friends, such as a social service agency or a church?
CODE ONE ONLY
All of the help needed, ............................................... 1
Most of the help needed, ........................................... 2
Very little of the help needed, or ............................... 3
No help? ..................................................................... 4
DON’T KNOW .............................................................. d
REFUSED.................................................................... r
The next question is about your neighborhood.
ALL
J5. Do you consider your neighborhood very safe from crime, somewhat safe, or very unsafe?
CODE ONE ONLY
VERY SAFE ................................................................. 1
SOMEWHAT SAFE ..................................................... 2
VERY UNSAFE ........................................................... 3
DON’T KNOW .............................................................. d
REFUSED.................................................................... r
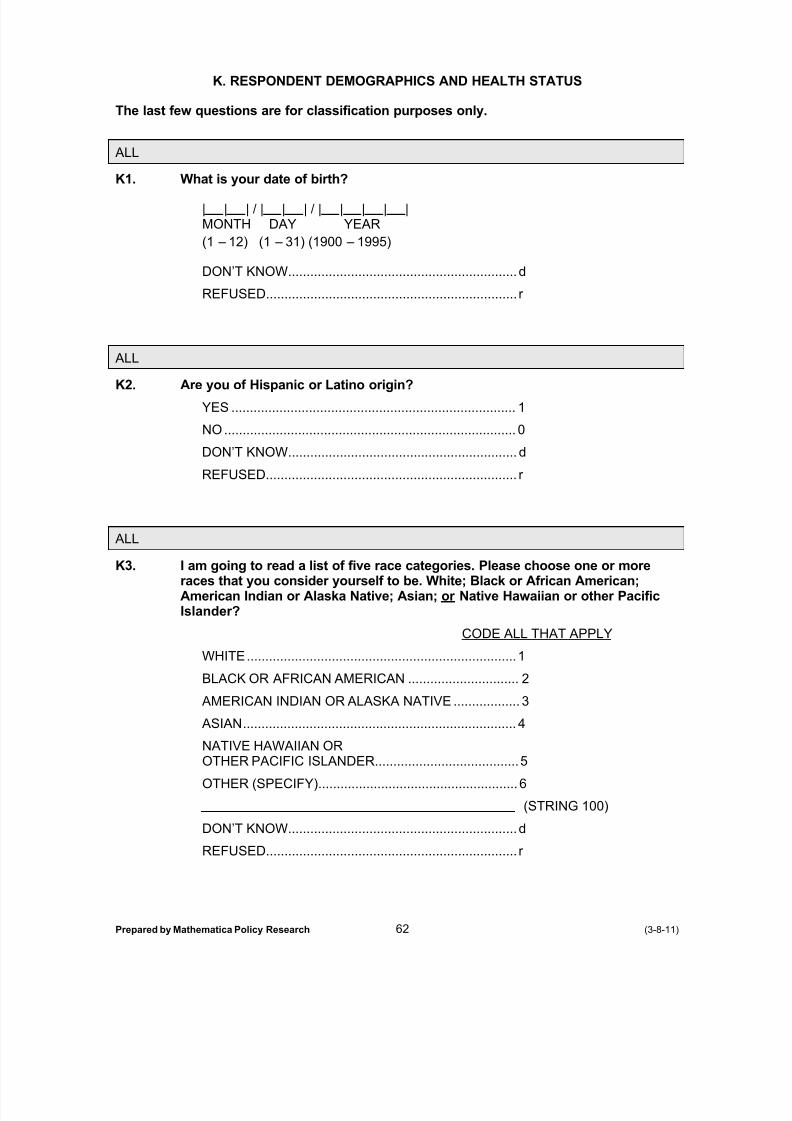
8/22/2019 USDA Report re SNAP & Food Security 08/2013
http://slidepdf.com/reader/full/usda-report-re-snap-food-security-082013 285/355
Prepared by Mathematica Policy Research 62 (3-8-11)
K. RESPONDENT DEMOGRAPHICS AND HEALTH STATUS
The last few questions are for classification purposes only.
ALL
K1. What is your date of birth?
| | | / | | | / | | | | |MONTH DAY YEAR
(1 – 12) (1 – 31) (1900 – 1995)
DON’T KNOW .............................................................. d
REFUSED.................................................................... r
ALL
K2. Are you of Hispanic or Latino origin?
YES ............................................................................. 1
NO ............................................................................... 0
DON’T KNOW .............................................................. d
REFUSED.................................................................... r
ALL
K3. I am going to read a list of five race categories. Please choose one or moreraces that you consider yourself to be. White; Black or African American;American Indian or Alaska Native; Asian; or
CODE ALL THAT APPLY
Native Hawaiian or other PacificIslander?
WHITE ......................................................................... 1
BLACK OR AFRICAN AMERICAN .............................. 2
AMERICAN INDIAN OR ALASKA NATIVE .................. 3
ASIAN .......................................................................... 4
NATIVE HAWAIIAN OROTHER PACIFIC ISLANDER....................................... 5
OTHER (SPECIFY) ...................................................... 6
(STRING 100)
DON’T KNOW .............................................................. d
REFUSED.................................................................... r
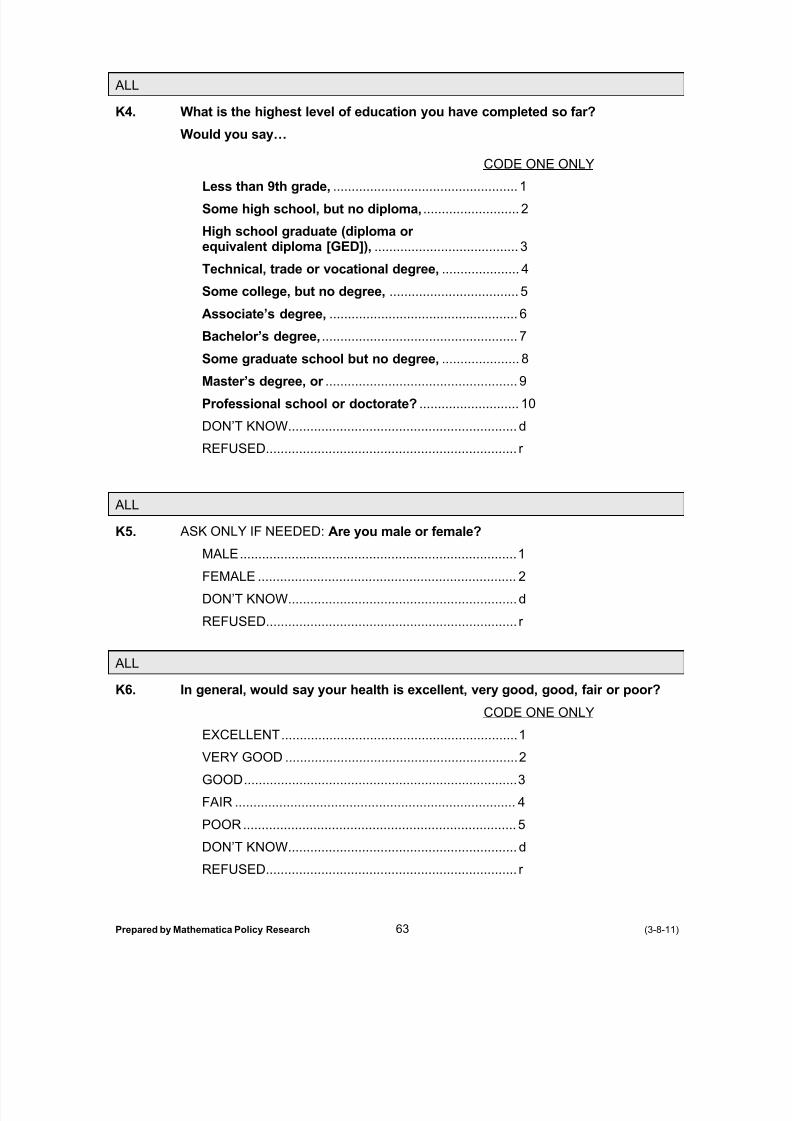
8/22/2019 USDA Report re SNAP & Food Security 08/2013
http://slidepdf.com/reader/full/usda-report-re-snap-food-security-082013 286/355
Prepared by Mathematica Policy Research 63 (3-8-11)
ALL
K4. What is the highest level of education you have completed so far?
Would you say…
CODE ONE ONLY
Less than 9th grade, .................................................. 1
Some high school, but no diploma, .......................... 2
High school graduate (diploma or equivalent diploma [GED]), ....................................... 3
Technical, trade or vocational degree, ..................... 4
Some college, but no degree, ................................... 5
Associate’s degree, ................................................... 6
Bachelor’s degree, ..................................................... 7
Some graduate school but no degree, ..................... 8
Master’s degree, or .................................................... 9
Professional school or doctorate? ........................... 10
DON’T KNOW .............................................................. d
REFUSED.................................................................... r
ALL
K5. ASK ONLY IF NEEDED: Are you male or female?
MALE ........................................................................... 1
FEMALE ...................................................................... 2
DON’T KNOW .............................................................. d
REFUSED.................................................................... r
ALL
K6. In general, would say your health is excellent, very good, good, fair or poor?
CODE ONE ONLY
EXCELLENT ................................................................ 1VERY GOOD ............................................................... 2
GOOD .......................................................................... 3
FAIR ............................................................................ 4
POOR .......................................................................... 5
DON’T KNOW .............................................................. d
REFUSED.................................................................... r
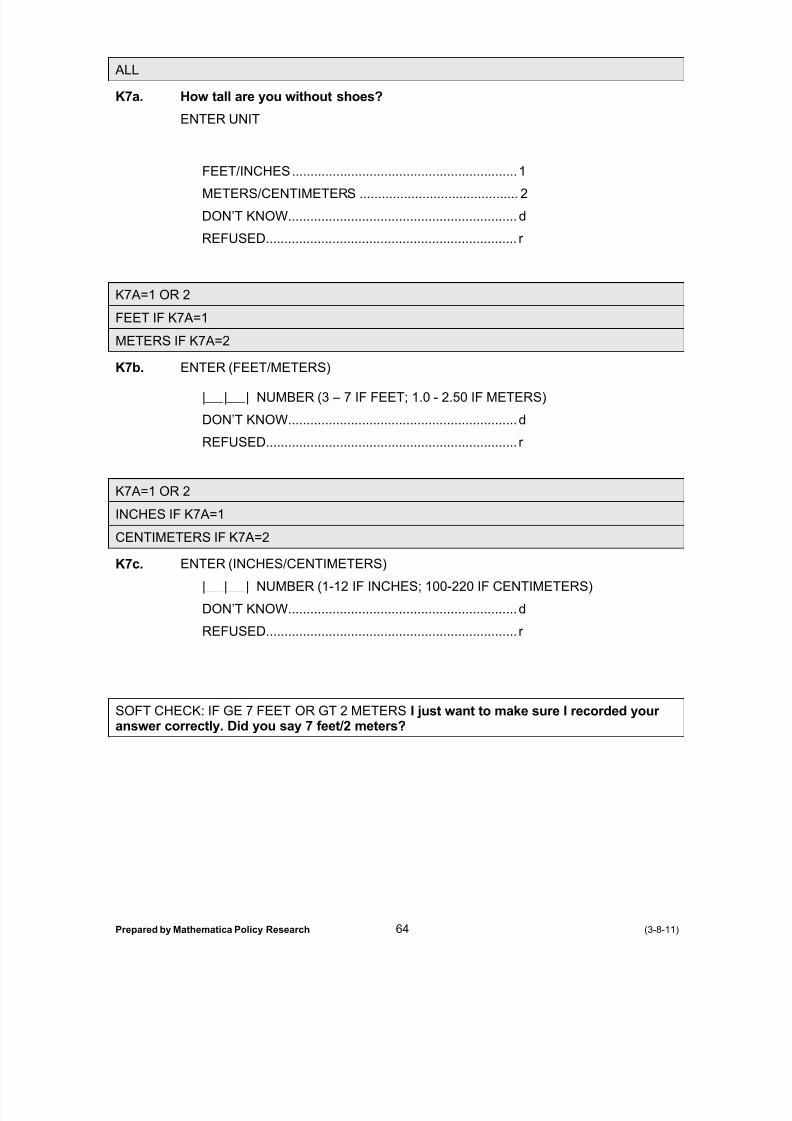
8/22/2019 USDA Report re SNAP & Food Security 08/2013
http://slidepdf.com/reader/full/usda-report-re-snap-food-security-082013 287/355
Prepared by Mathematica Policy Research 64 (3-8-11)
ALL
K7a. How tall are you without shoes?
ENTER UNIT
FEET/INCHES ............................................................. 1
METERS/CENTIMETERS ........................................... 2
DON’T KNOW .............................................................. d
REFUSED.................................................................... r
K7A=1 OR 2
FEET IF K7A=1
METERS IF K7A=2
K7b. ENTER (FEET/METERS)
| | | NUMBER (3 – 7 IF FEET; 1.0 - 2.50 IF METERS)
DON’T KNOW .............................................................. d
REFUSED.................................................................... r
K7A=1 OR 2
INCHES IF K7A=1
CENTIMETERS IF K7A=2
K7c. ENTER (INCHES/CENTIMETERS)
| | | NUMBER (1-12 IF INCHES; 100-220 IF CENTIMETERS)
DON’T KNOW .............................................................. d
REFUSED.................................................................... r
SOFT CHECK: IF GE 7 FEET OR GT 2 METERS I just want to make sure I recorded your answer correctly. Did you say 7 feet/2 meters?

8/22/2019 USDA Report re SNAP & Food Security 08/2013
http://slidepdf.com/reader/full/usda-report-re-snap-food-security-082013 288/355
Prepared by Mathematica Policy Research 65 (3-8-11)
ALL
K8. How much do you weigh without shoes?
IF RESPONDENT SAYS SHE IS PREGNANT, SAY: How much did you weighbefore your pregnancy?
ENTER UNIT
POUNDS ..................................................................... 1
KILOGRAMS ............................................................... 2
DON’T KNOW .............................................................. d
REFUSED.................................................................... r
K8=1 OR 2
K8a. ENTER NUMBER
| | | | NUMBER (70 – 999)
DON’T KNOW .............................................................. d
REFUSED.................................................................... r
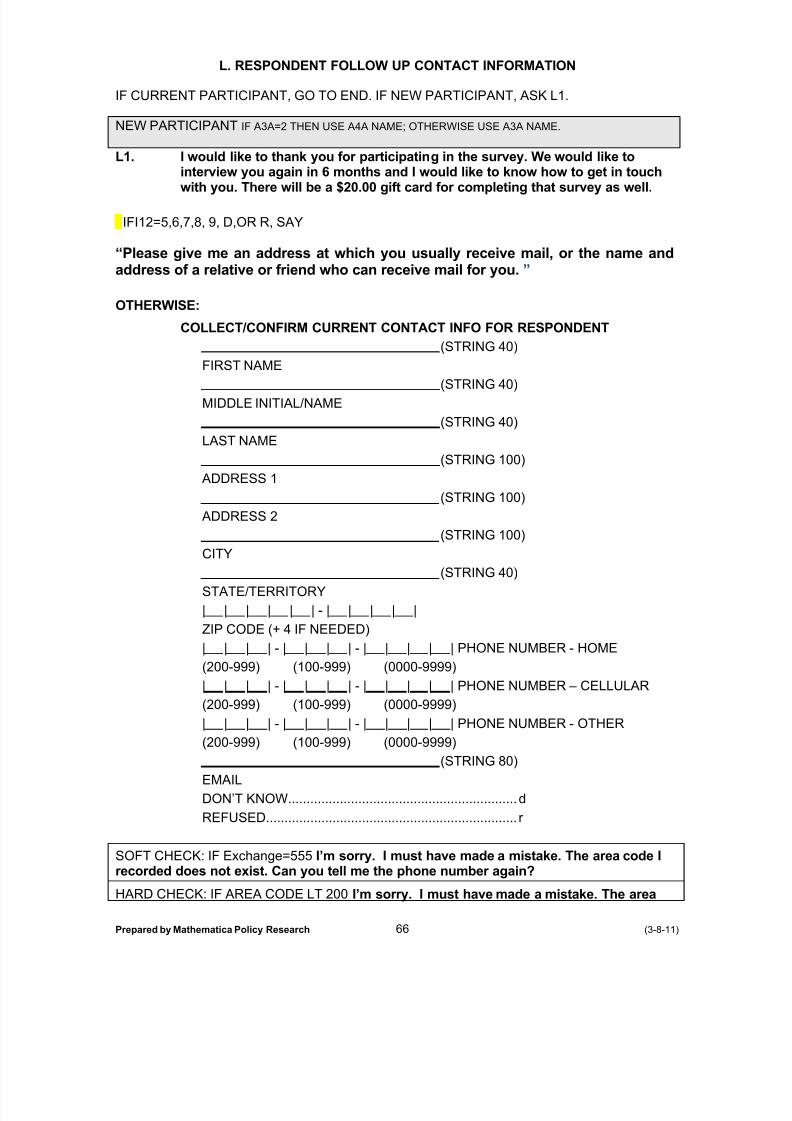
8/22/2019 USDA Report re SNAP & Food Security 08/2013
http://slidepdf.com/reader/full/usda-report-re-snap-food-security-082013 289/355
Prepared by Mathematica Policy Research 66 (3-8-11)
L. RESPONDENT FOLLOW UP CONTACT INFORMATION
IF CURRENT PARTICIPANT, GO TO END. IF NEW PARTICIPANT, ASK L1.
NEW PARTICIPANT IF A3A=2 THEN USE A4A NAME; OTHERWISE USE A3A NAME.
L1. I would like to thank you for participating in the survey. We would like tointerview you again in 6 months and I would like to know how to get in touch
with you. There will be a $20.00 gift card for completing that survey as well.
IFI12=5,6,7,8, 9, D,OR R, SAY
“Please give me an address at which you usually receive mail, or the name andaddress of a relative or friend who can receive mail for you.”
OTHERWISE:
COLLECT/CONFIRM CURRENT CONTACT INFO FOR RESPONDENT
(STRING 40)
FIRST NAME(STRING 40)
MIDDLE INITIAL/NAME
(STRING 40)
LAST NAME
(STRING 100)
ADDRESS 1
(STRING 100)
ADDRESS 2
(STRING 100)
CITY(STRING 40)
STATE/TERRITORY
| | | | | | - | | | | |
ZIP CODE (+ 4 IF NEEDED)
| | | | - | | | | - | | | | | PHONE NUMBER - HOME
(200-999) (100-999) (0000-9999)
| | | | - | | | | - | | | | | PHONE NUMBER – CELLULAR
(200-999) (100-999) (0000-9999)
| | | | - | | | | - | | | | | PHONE NUMBER - OTHER
(200-999) (100-999) (0000-9999)
(STRING 80)
DON’T KNOW .............................................................. d
REFUSED.................................................................... r
SOFT CHECK: IF Exchange=555 I’m sorry. I must have made a mistake. The area code Irecorded does not exist. Can you tell me the phone number again?
HARD CHECK: IF AREA CODE LT 200 I’m sorry. I must have made a mistake. The area

8/22/2019 USDA Report re SNAP & Food Security 08/2013
http://slidepdf.com/reader/full/usda-report-re-snap-food-security-082013 290/355
Prepared by Mathematica Policy Research 67 (3-8-11)
code I recorded does not exist. Can you tell me the phone number again.
NEW PARTICIPANT
L2. Next, I would like to ask you for the name, address, and telephone number of 3 close friends or relatives we can contact in case you move and we cannot
easily locate you for your next interview. All information collected will be heldin strictest confidence and will only be used to locate you if we cannot reachyou at your current address.
CONTACT 1:
(STRING 40)FIRST NAME
(STRING 40)MIDDLE INITIAL/NAME
(STRING 40)LAST NAME
_________________________________(STRING 100)
RELATIONSHIP TO RESPONDENT
(STRING 100) ADDRESS 1
(STRING 100) ADDRESS 2
(STRING 100)CITY
(STRING 40)STATE/TERRITORY
| | | | | | - | | | | |ZIP CODE (+ 4 IF NEEDED)
| | | | - | | | | - | | | | | PHONE NUMBER - HOME(200-999) (100-999) (0000-9999)
| | | | - | | | | - | | | | | PHONE NUMBER – CELLULAR(200-999) (100-999) (0000-9999)
| | | | - | | | | - | | | | | PHONE NUMBER - OTHER(200-999) (100-999) (0000-9999)
.................................................................................... (STRING 80)
DON’T KNOW .............................................................. d GO TO L3
REFUSED.................................................................... r GO TO L3
SOFT CHECK: IF Exchange=555 I’m sorry. I must have made a mistake. The area code Irecorded does not exist. Can you tell me the phone number again?
8/22/2019 USDA Report re SNAP & Food Security 08/2013
http://slidepdf.com/reader/full/usda-report-re-snap-food-security-082013 291/355
Prepared by Mathematica Policy Research 68 (3-8-11)
HARD CHECK: IF AREA CODE LT 200 I’m sorry. I must have made a mistake. The areacode I recorded does not exist. Can you tell me the phone number again.
8/22/2019 USDA Report re SNAP & Food Security 08/2013
http://slidepdf.com/reader/full/usda-report-re-snap-food-security-082013 292/355
Prepared by Mathematica Policy Research 69 (3-8-11)
NEW PARTICIPANT
CONTACT 2:
(STRING 40)FIRST NAME
(STRING 40)MIDDLE INITIAL/NAME
(STRING 40)LAST NAME
_________________________________(STRING 100)
RELATIONSHIP TO RESPONDENT
(STRING 100) ADDRESS 1
(STRING 100) ADDRESS 2
(STRING 100)CITY
(STRING 40)STATE/TERRITORY
| | | | | | - | | | | |ZIP CODE (+ 4 IF NEEDED)
| | | | - | | | | - | | | | | PHONE NUMBER - HOME
(200-999) (100-999) (0000-9999)
| | | | - | | | | - | | | | | PHONE NUMBER – CELLULAR(200-999) (100-999) (0000-9999)
| | | | - | | | | - | | | | | PHONE NUMBER - OTHER
(200-999) (100-999) (0000-9999)
(STRING 80)
DON’T KNOW .............................................................. d GO TO L3
REFUSED.................................................................... r GO TO L3
SOFT CHECK: IF Exchange=555 I’m sorry. I must have made a mistake. The area code Irecorded does not exist. Can you tell me the phone number again?
HARD CHECK: IF AREA CODE LT 200 I’m sorry. I must have made a mistake. The areacode I recorded does not exist. Can you tell me the phone number again.

8/22/2019 USDA Report re SNAP & Food Security 08/2013
http://slidepdf.com/reader/full/usda-report-re-snap-food-security-082013 293/355
Prepared by Mathematica Policy Research 70 (3-8-11)
NEW PARTICIPANT
CONTACT 3:
(STRING 40)FIRST NAME
(STRING 40)MIDDLE INITIAL/NAME
(STRING 40)LAST NAME
_________________________________(STRING 100)
RELATIONSHIP TO RESPONDENT
(STRING 100) ADDRESS 1
(STRING 100) ADDRESS 2
(STRING 100)CITY
(STRING 40)STATE/TERRITORY
| | | | | | - | | | | |ZIP CODE (+ 4 IF NEEDED)
| | | | - | | | | - | | | | | PHONE NUMBER - HOME(200-999) (100-999) (0000-9999)
| | | | - | | | | - | | | | | PHONE NUMBER – CELLULAR(200-999) (100-999) (0000-9999)
| | | | - | | | | - | | | | | PHONE NUMBER - OTHER
(200-999) (100-999) (0000-9999)
(STRING 80)
DON’T KNOW .............................................................. d
REFUSED.................................................................... r
SOFT CHECK: IF Exchange=555 I’m sorry. I must have made a mistake. The area code Irecorded does not exist. Can you tell me the phone number again?
HARD CHECK: IF AREA CODE LT 200 I’m sorry. I must have made a mistake. The areacode I recorded does not exist. Can you tell me the phone number again.
8/22/2019 USDA Report re SNAP & Food Security 08/2013
http://slidepdf.com/reader/full/usda-report-re-snap-food-security-082013 294/355
Prepared by Mathematica Policy Research 71 (3-8-11)
ALL
provide IF ADDRESS COLLECTED AT L1
confirm IF NO ADDRESS COLLECTED AT L1
END. Those are all our questions. Thank you very much for your participation in thesurvey. Please (provide/confirm) the name and address where we should sendthe gift card.
RECORD NAME AND ADDRESS FOR CHECK
[IF ADDRESS COLLECTED AT L1, PRE-FILL HERE]
(STRING 40)FIRST NAME
(STRING 40)MIDDLE INITIAL/NAME
(STRING 40)LAST NAME
(STRING 100) ADDRESS 1
(STRING1 00) ADDRESS 2
(STRING 100)CITY
(STRING 40)STATE/TERRITORY
| | | | | | - | | | | |ZIP CODE (+ 4 IF NEEDED)
DON’T KNOW .............................................................. d
REFUSED.................................................................... r
8/22/2019 USDA Report re SNAP & Food Security 08/2013
http://slidepdf.com/reader/full/usda-report-re-snap-food-security-082013 295/355
MPR Reference No.: 06801.602
SNAP Food Security
Telephone SurveyCATI SPECIFICATION S
Up da ted for the Follow-Up Da ta Collection Effort
April 4, 2012
8/22/2019 USDA Report re SNAP & Food Security 08/2013
http://slidepdf.com/reader/full/usda-report-re-snap-food-security-082013 296/355
Prepared by Mathematica Policy Research 5 (3-8-11)
A. INTRODUCTION
ALL
SAMPLE MEMBER FROM SAMPMEM_NAME
Hello
Hello, my name is [INTVNAME]. I am calling from Mathematica PolicyResearch on behalf of the US Department of Agriculture. May I please speak to[SAMPLE MEMBER]?
SAMPLE MEMBER COMES TO PHONE .................... 1 GO TO INTRO1
SAMPLE MEMBER UNAVAILABLE/BAD TIME ........... 2 SCHEDULE CALL BACK
NO ONE ANSWERS .................................................... 3 GO TO NO ANSWER SCREEN
NO SUCH PERSON AT THIS NUMBER ..................... 4 GO TO LOCATING SCREEN
NEW RESPONDENT ................................................... 5 GO TO SCRN1a
INTERVIEWER: CODE 5 ONLY WITH SUPERVISOR PERMISSION AND WRITENOTE DOCUMENTING CIRCUMSTANCES
HELLO = 1
STATE SNAP NAME FROM SNAPstate_name
Intro1 Hello, my name is ______________ and I’m calling from Mathematica PolicyResearch. As you may recall from the letter we recently mailed you, we areonce again conducting a survey on behalf of the U.S. Department of
Agriculture that funds the Supplemental Nutrition Assistance Program, or [STATE SNAP NAME], which is also known as food stamps.. The interview willtake about 20-30 minutes, and your cooperation is completely voluntary. Your participation in the survey will not affect any government assistance you arereceiving now or in the future. All answers you give will be confidential and noindividual results will be presented. As a token of appreciation, we will onceagain be sending you a $20 gift card after this interview is complete.
BEGIN INTERVIEW ..................................................... 1
DID NOT RECEIVE OR DOES NOT RECALLLETTER ....................................................................... 2 GO TO LETTER SCREEN
WANTS MORE INFORMATION .................................. 3 GO TO MORE INFO SCREEN
NOT A GOOD TIME .................................................... 4 GO TO APPOINTMENT SCRE
HUNG UP DURING INTRODUCTION ......................... 5
SUPERVISOR REVIEW .............................................. 6

8/22/2019 USDA Report re SNAP & Food Security 08/2013
http://slidepdf.com/reader/full/usda-report-re-snap-food-security-082013 297/355
Prepared by Mathematica Policy Research 6 (3-8-11)
INTRO1 = 1 OR HELLO=5
STATE SNAP NAME FROM SNAPstate_name
EBT STATE NAME FROM EBTstate_name
SCRN1a. Based on the information from our last interview, your household beganreceiving [STATE SNAP NAME] benefits around 6 months ago. Is that correct?
PROBE: This program used to be called food stamps. It puts money on an[EBT STATE NAME] card that you can use to buy food.
YES ............................................................................. 1 GO TO SCRN1D
NO ............................................................................... 0 GO TO SCRN1D
DON’T KNOW .............................................................. d GO TO Sup Review
REFUSED.................................................................... r GO TO Sup Review
SCRN1A = 1 OR 0
STATE SNAP NAME FROM SNAPstate_name
SCRN1d. Are you now participating in [STATE SNAP NAME]?
YES ............................................................................. 1
NO ............................................................................... 0 GO TO END
DON’T KNOW .............................................................. d GO TO Sup Review
REFUSED.................................................................... r GO TO Sup Review
PROGRAMMER: IF SCRN1a=0 & SCRN1d=1, GO TO SCRN1e; IF SCRN1a=1 &SCRN1d=1, GO TO A1
SCRN1e. About how many months in a row have you been participating in [STATE SNAPNAME]?
| | | MONTHS (0 - 9)
DON’T KNOW .............................................................. d GO TO Sup Review
REFUSED.................................................................... r GO TO Sup ReviewINTERVIEWER: ENTER 9 IF MORE THAN 9 MONTHS; ENTER 0 IF LESS THAN
1 MONTHPROGRAMMER: IF SCRN1e = 5-8 MONTHSGO TO A1; ELSE GO TO END
8/22/2019 USDA Report re SNAP & Food Security 08/2013
http://slidepdf.com/reader/full/usda-report-re-snap-food-security-082013 298/355
Prepared by Mathematica Policy Research 7 (3-8-11)
SCRN1D=0 OR; SCRN1E=0, 1, 2, 3, 4, 9 OR R
STATE SNAP NAME FROM SNAPstate_name
END Those are all the questions I have. This survey is for people who are currentlyparticipating in [STATE SNAP NAME] and have been participating in [STATESNAP NAME] for about 6 months. Thank you for your time. Good-bye. CODE
AS SUP REVIEW
Sup Review Those are all the questions I have for now. I need to clarify some information withmy supervisor. We will call you back if we have additional questions.
SCRN1A = 1 & SCRN1D = 1 OR SCRN1E=5-8 OR HELLO=5
A1. Are you the person who does most of the planning or preparing of meals inyour family?
INTERVIEWER: IF R ANSWERS “SOMETIMES” OR “50/50,” ENTER YES.
YES ............................................................................. 1 GO TO A2
NO ............................................................................... 0
DON’T KNOW .............................................................. d GO TO A2
REFUSED.................................................................... r GO TO A2
A1 = 0
A1a. Which adult in your household does most
(STRING 40)
of the planning or preparing of meals?
FIRST NAME
(STRING 40)LAST NAME
DON’T KNOW .............................................................. d
REFUSED.................................................................... r
SCRN1A = 1
A2. Are you the person who does most of the shopping for food
YES ............................................................................. 1 GO TO A3
in your family?
NO ............................................................................... 0
DON’T KNOW .............................................................. d GO TO A3
REFUSED.................................................................... r GO TO A3

8/22/2019 USDA Report re SNAP & Food Security 08/2013
http://slidepdf.com/reader/full/usda-report-re-snap-food-security-082013 299/355
Prepared by Mathematica Policy Research 8 (3-8-11)
A2 = 0
A2a. Which adult in your household does most
of the shopping for food?
ENTER 1 TO RECORD NAME .................................... 1
SAME AS MEAL PLANNER ........................................ 2 GO TO A3 CHECK
A2A = 1
A2a_NAME RECORD NAME
(STRING 40)FIRST NAME
(STRING 40)LAST NAME
DON’T KNOW .............................................................. d
REFUSED.................................................................... r
A3 PROGRAMMER CHECK
IS RESPONDENT THE MEAL PLANNER (A1=1) OR FOOD SHOPPER (A2=1)?IF YES, GO TO B1, IF NO, GO TO A3a. IF NEITHER FOOD SHOPPER NOR MEAL PLANNER
IS AVAILABLE, SCHEDULE CALL BACK.
A1 = 0 AND A2 = 0
A3a. May I please speak to [FILL NAME COLLECTED AT A2a]? COMES TOPHONE 1 GO TO INTRO2
FOOD SHOPPER UNAVAILABLE ............................... 2
BAD TIME/CALL BACK ............................................... 3 SCHEDULE CALL BACK
A3A = 2 AND A2A NE TO 2
A4a. May I please speak to [FILL NAME COLLECTED AT A1a]?
COMES TO PHONE .................................................... 1 GO TO INTRO2
MEAL PLANNER UNAVAILABLE ................................ 2 SCHEDULE CALL BACK
BAD TIME/CALL BACK ............................................... 3 SCHEDULE CALL BACK
8/22/2019 USDA Report re SNAP & Food Security 08/2013
http://slidepdf.com/reader/full/usda-report-re-snap-food-security-082013 300/355
Prepared by Mathematica Policy Research 9 (3-8-11)
A4A OR A3A = 1; OR HELLO=5
STATE SNAP NAME FROM SNAPstate_name
Hello, my name is_________and I’m calling from Mathematica Policy Research IF A4AOR A3A=1
INTRO2 (Hello, my name is __________ and I’m calling from Mathematica Policy
Research.) About six months ago, we conducted an interview with your household for a study we are conducting on behalf of the U.S. Department of Agriculture that funds the Supplemental Nutrition Assistance Program, or [STATE SNAP NAME], which is also known as food stamps, to learn moreabout families and their food needs. We would like to conduct a follow-upinterview with you. The interview will take about 20-30 minutes, and your cooperation is completely voluntary. Your participation in the survey will notaffect any government assistance you are receiving now or in the future. Allanswers you give will be confidential and no individual results will bepresented. As a token of appreciation, we will be sending you a $20 Wal-Martgift card after the interview is complete.
PROCEED WITH INTERVIEW .................................... 1
BAD TIME/CALL BACK ............................................... 2 SCHEDULE CALL BACK
IF NEW RESPONDENT (A3A=1, A4A=1, OR HELLO=5)
A5. Are you at least 18 years old?
YES ............................................................................. 1
NO ............................................................................... 0 GO TO SUP REVIEW
DON’T KNOW .............................................................. d GO TO SUP REVIEW
REFUSED.................................................................... r GO TO SUP REVIEW
HELLO=5 AND A4A OR A3A NE 1
HELLO5_NAME What is your name?
RECORD NAME
(STRING 40)
FIRST NAME
(STRING 40)LAST NAME
DON’T KNOW .............................................................. d
REFUSED.................................................................... r
8/22/2019 USDA Report re SNAP & Food Security 08/2013
http://slidepdf.com/reader/full/usda-report-re-snap-food-security-082013 301/355
Prepared by Mathematica Policy Research 10 (3-8-11)
B. HOUSEHOLD COMPOSITION
The first few questions are about the people you live with.
HH SIZE = 1 AT BASELINE AND SAME RESPONDENT
B1. During the last interview, we recorded that you live alone. Is this still correct?YES ............................................................................. 1 GO TO B1b
NO ............................................................................... 0 GO TO B1c
DON’T KNOW .............................................................. d GO TO B1c
REFUSED.................................................................... r GO TO B1c
HH SIZE >1 AT BASELINE AND SAME RESPONDENT
B1a. During the last interview, we recorded that the following people live in your household and share food with you. [READ NAMES] Is this still correct?
[BASELINE RESP]
[NAME 1]
[NAME 2]
[NAME 3]
[NAME 4]
YES ............................................................................. 1 GO TO B1b
NO ............................................................................... 0 GO TO B1c
DON’T KNOW .............................................................. d GO TO B1c
REFUSED.................................................................... r GO TO B1c
B1 =1 OR B1A = 1 AND SAME RESPONDENT
B1b. Has anyone else joined your household since the last interview?
YES ............................................................................. 1 GO TO B1c
NO ............................................................................... 0 GO TO B4
DON’T KNOW .............................................................. d GO TO B4REFUSED.................................................................... r GO TO B4
8/22/2019 USDA Report re SNAP & Food Security 08/2013
http://slidepdf.com/reader/full/usda-report-re-snap-food-security-082013 302/355
Prepared by Mathematica Policy Research 11 (3-8-11)
B1 OR B1A NE1; OR B1B = 1 OR NEW RESPONDENT
now lives in your household IF B1 OR B1a = 0, d, or r, OR NEW RESPONDENT
joined your household since the last interview IF B1b =1
B1c. Please tell me the first name of everyone who (now lives in your household/joined your household since the last interview which was about 6months ago). By household, I mean the people who live with you and sharefood with you. Please include babies, small children, and people who are notrelated to you.
RESPONDENT LIVES ALONE .................................... 0 GO TO B4
ENTER NAMES ........................................................... 1(ALLOW UP TO 10 NAMES)
(STRING 40)NAME
B1c NE 0
ASK B2 FOR ALL HOUSEHOLD MEMBERS RECORDED IN B1c.
NAME 1 FILL FIRST NAME COLLECTED AT B1c
THEN FILL EACH SUBSEQUENT NAME (NAME 2 – NAME 10)
B2. And what is [NAME 1]’s relationship to you
INTERVIEWER: CODE COHABITEE’S CHILD AND OTHER CHILDREN WHO ARENOT NATURAL, ADOPTED OR STEP, BUT FOR WHOM THESAMPLE MEMBER TAKES RESPONSIBILITY, AS “OTHERCUSTODIAL CHILD.”
?
HUSBAND OR WIFE ................................................... 1
UNMARRIED PARTNER ............................................. 2
SON OR DAUGHTER (INCLUDINGBIOLOGICAL, STEP, OR ADOPTED CHILD) .............. 3
OTHER CUSTODIAL OR FOSTER CHILD .................. 4
PARENT (MOTHER, FATHER,INCLUDING STEPPARENTS AND IN-LAWS) ............. 5
SIBLING (BROTHER OR SISTERINCLUDING IN-LAWS) ................................................ 6
GRANDCHILD ............................................................. 7
OTHER RELATIVE ...................................................... 8
NON-RELATIVE (INCLUDINGROOMER OR BOARDER) ........................................... 9
OTHER SPECIFY ........................................................ 10
________________________________(STRING 60)
DON’T KNOW .............................................................. d
REFUSED.................................................................... r
8/22/2019 USDA Report re SNAP & Food Security 08/2013
http://slidepdf.com/reader/full/usda-report-re-snap-food-security-082013 303/355
Prepared by Mathematica Policy Research 12 (3-8-11)
B1c NE 0
ASK B3 FOR ALL HOUSEHOLD MEMBERS RECORDED IN B1c.
NAME 1 FILL FIRST NAME COLLECTED AT B1c
THEN FILL EACH SUBSEQUENT NAME (NAME 2 – NAME 10)
B3. What is [NAME 1]’s age?
| | | AGE (0 - 99)
INTERVIEWER: IF LESS THAN 1 YEAR OLD ENTER “0”.
YEARS ........................................................................ 1
B3 GE 15 (HOUSEHOLD MEMBERS RECORDED IN B1c 15 OR OLDER).
NAME 1 FILL FIRST NAME COLLECTED AT B1c
THEN FILL EACH SUBSEQUENT NAME (NAME 2 – NAME 10)
B3a. ASK ONLY IF NEEDED: IS [NAME 1] male or female?
MALE ........................................................................... 1
FEMALE ...................................................................... 2
DON’T KNOW .............................................................. d
REFUSED.................................................................... r
ALL
Do you IF B1c = 0
Does anyone in your household IF B1c NE 0
you IF B1C = 0
anyone in the household IF B1c NE 0
B4. (Do you/Does anyone in your household) have a physical, mental, or other health condition that limits the kind or amount of work that (you/anyone in thehousehold) can do?
YES ............................................................................. 1
NO ............................................................................... 0
DON’T KNOW .............................................................. d
REFUSED.................................................................... r

8/22/2019 USDA Report re SNAP & Food Security 08/2013
http://slidepdf.com/reader/full/usda-report-re-snap-food-security-082013 304/355
Prepared by Mathematica Policy Research 13 (3-8-11)
C. TRIGGER EVENTS
B1 OR B1A NE1; OR B1B = 1;
C1a. I just recorded that there has been a change in the household since the lastinterview. What caused that change?
CODE ALL THAT APPLY
BIRTH OF CHILD ........................................................ 1
NEW STEP, FOSTER OR ADOPTED CHILD .............. 2
MARRIAGE/NEW PARTNER....................................... 3
SEPARATION OR DIVORCE ...................................... 4
DEATH OF HOUSEHOLD MEMBER ........................... 5
FAMILY/BOARDER MOVING IN ................................. 6
FAMILY/BOARDER MOVING OUT.............................. 7
OTHER (SPECIFY) ...................................................... 8
________________________________(STRING 500)
DON’T KNOW .............................................................. d
REFUSED.................................................................... r

8/22/2019 USDA Report re SNAP & Food Security 08/2013
http://slidepdf.com/reader/full/usda-report-re-snap-food-security-082013 305/355
Prepared by Mathematica Policy Research 14 (3-8-11)
ALL
Since we last interviewed you 6 month ago IF SAME RESPONDENT AS BASELINE
In the past 6 months IF NEW RESPONDENT
Were you IF B1c=0
Was your household IF B1c NE 0
C2. At any time (since we last interviewed you 6 months ago/ in the past 6 months)(were you/was your household) evicted from your house or apartment?
YES ............................................................................. 1
NO ............................................................................... 0
DON’T KNOW .............................................................. d
REFUSED.................................................................... r
ALL
or anyone in your household IF B1c NE 0
in the past 6 months IF NEW RESPONDENT
since our last interview IF SAME RESPONDENT AS BASELINE
C3. Have you (or anyone in your household) had a change in employment or achange in pay or hours worked from a job (in the past 6 months/since our lastinterview)?
YES ............................................................................. 1
NO ............................................................................... 0 GO TO D1
DON’T KNOW .............................................................. d GO TO D1
REFUSED.................................................................... r GO TO D1
B1C NE 0
in the past 6 months IF NEW RESPONDENT
since our last interview IF SAME RESPONDENT AS BASELINE
C3a. Who in your household had a change in employment or a change in pay or hours worked from a job (in the past 6 months/since our last interview)?
[LIST ALL MEMBERS OF HOUSEHOLD AGE 15 AND OVER FROM B1c]
CODE ALL THAT APPLY
RESPONDENT ............................................................ 1
NAME 1 ....................................................................... 2
NAME 2 ....................................................................... 3
NAME 3 ....................................................................... 4
NAME 4 ....................................................................... 5
8/22/2019 USDA Report re SNAP & Food Security 08/2013
http://slidepdf.com/reader/full/usda-report-re-snap-food-security-082013 306/355
Prepared by Mathematica Policy Research 15 (3-8-11)
C3 = 1
you IF B1c = 0 OR C3A = 1
NAME FILL FROM C3A
in the past 6 months IF NEW RESPONDENT
since our last interview IF SAME RESPONDENT AS BASELINE
C3b. What was that change in employment or a change in pay or hours worked froma job that (you/[NAME]) experienced (in the past 6 months/since our lastinterview)?
CODE ALL THAT APPLY
OBTAINED A JOB ....................................................... 1
LOST JOB ................................................................... 2
INCREASE IN PAY OR HOURS .................................. 3
DECREASE IN PAY OR HOURS ................................ 4
OTHER (SPECIFY) ...................................................... 5
________________________________(STRING 500)
DON’T KNOW .............................................................. d
REFUSED.................................................................... r
[REPEAT FOR EACH PERSON RECORDED IN C3a]
8/22/2019 USDA Report re SNAP & Food Security 08/2013
http://slidepdf.com/reader/full/usda-report-re-snap-food-security-082013 307/355
Prepared by Mathematica Policy Research 16 (3-8-11)
D. SNAP PARTICIPATION
ALL
D1. Next, we’re going to ask you about your participation in SNAP.
ALL
you IF B1c = 0
your household IF B1c NE 0
D1b. On what date did (you/your household) receive your most recent SNAPbenefits? That is, when was money most recently put on your [EBT/STATENAME] card?
| | | / | | | / | | | | |MONTH DAY YEAR
(1 - 12) (1 - 31) (2011-2012)
DON’T KNOW .............................................................. d
REFUSED.................................................................... r
SOFT CHECK: IF DATE IS MORE THAN 1 MONTH PRIOR TO INTERVIEW DATE I just wantto be sure I recorded the date correctly. Did you say DATE?
HARD CHECK: IF DATE IN FUTURE I’m sorry. I must have recorded the date incorrectly.Can you please give me that date again?
household’s IF B1c NE 0EBT/STATE NAME FROM EBTstate_name
D2. How many dollars were put on your (household’s) [EBT/STATE NAME] cardthis most recent time?
$ | | | | AMOUNT ISSUED ON EBT CARD (1 – 2,000)
DON’T KNOW .............................................................. d GO TO D5
REFUSED.................................................................... r GO TO D5
SOFT CHECK: IF HH MEMBERS LISTED IN B1c LT 8 AND D2 IS GT 1,000 I just want to be
sure I recorded your response correctly. Did you say NUM?
D2 NE D OR R
D3. How much of the [FILL AMOUNT IN D2] that you most recently received haveyou used so far?
NONE - HAVE NOT USED YET .................................. 0
ENTER AMOUNT SPENT SO FAR ............................. 1

8/22/2019 USDA Report re SNAP & Food Security 08/2013
http://slidepdf.com/reader/full/usda-report-re-snap-food-security-082013 308/355
Prepared by Mathematica Policy Research 17 (3-8-11)
ENTER BALANCE REMAINING .................................. 2
DON’T KNOW .............................................................. d GO TO D4
REFUSED.................................................................... r GO TO D4
D3 = 1 OR 2
D3a.
$ | | | | AMOUNT (1 – 2,000) GO TO D5
HARD CHECK: IF AMOUNT RECORDED IN D3A GT AMOUNT IN D2 I’m sorry. I must havemade a mistake. The (amount spent/balance remaining) is more than the amount youreceived. Is there an error?
D3 OR D3A = D OR R
D4. Would you say as of now you have used…
CODE ONE ONLY
Less than half,............................................................ 1
About half, .................................................................. 2
Or more than half of your monthlySNAP benefits?.......................................................... 3
DON’T KNOW .............................................................. d
REFUSED.................................................................... r
8/22/2019 USDA Report re SNAP & Food Security 08/2013
http://slidepdf.com/reader/full/usda-report-re-snap-food-security-082013 309/355
Prepared by Mathematica Policy Research 18 (3-8-11)
ALL
D5. How many weeks do your SNAP benefits usually last? Do they last…
CODE ONE ONLY
1 week or less, ........................................................... 1
2 weeks, ...................................................................... 23 weeks, ...................................................................... 3
4 weeks, or ................................................................. 4
more than 4 weeks?................................................... 5
DON’T KNOW .............................................................. d
REFUSED.................................................................... r
8/22/2019 USDA Report re SNAP & Food Security 08/2013
http://slidepdf.com/reader/full/usda-report-re-snap-food-security-082013 310/355
Prepared by Mathematica Policy Research 19 (3-8-11)
E. FOOD PURCHASE BEHAVIOR
IF NEW RESPONDENT GO TO E1, ELSE READ INTRO
In this next section I will be asking you many of the same questions we asked you 6months ago because things can change over time.
ALL
E1. Where do you buy most of your groceries?
ENTER NAME OF ONE STORE .................................. 1 GO TO E1_NAME
MULTIPLE STORES NAMED ...................................... 2 GO TO E1_NAME2
DON’T KNOW .............................................................. d GO TO F1
REFUSED.................................................................... r GO TO F1
E1 = 1
E1_NAME
INTERVIEWER: RECORD NAME OF STORE
________________________________(STRING 60) GO TO E1a
E1=2
E1_NAME2 If you had to choose just one of these stores, which one would you say youshop at most often?
INTERVIEWER: RECORD NAME OF STORE
________________________________(STRING 60)
8/22/2019 USDA Report re SNAP & Food Security 08/2013
http://slidepdf.com/reader/full/usda-report-re-snap-food-security-082013 311/355
Prepared by Mathematica Policy Research 20 (3-8-11)
E1 NE D OR R
E1a. What kind of store is that?
INTERVIEWER: CODE TYPE OF STORE
CODE ONE ONLY
SUPERMARKETS/GROCERY STORES ..................... 1
DISCOUNT STORES SUCH AS WAL-MART,TARGET, OR KMART ................................................. 2
WAREHOUSE CLUBS, SUCH AS PRICE CLUB,COSTCO, PACE, SAM’S CLUB, BJ’S ......................... 3
CONVENIENCE STORES SUCH AS 7-11,QUICK CHECK, QUICK STOP, WAWA ....................... 4
ETHNIC FOOD STORES SUCH ASBODEGA’S ASIAN FOOD MARKETS, ORCARIBBEAN MARKETS .............................................. 5
FARMER’S MARKET ................................................... 6
DOLLAR STORES ....................................................... 7
OTHER (SPECIFY) ...................................................... 8
________________________________(STRING 100)
DON’T KNOW .............................................................. d
REFUSED.................................................................... r

8/22/2019 USDA Report re SNAP & Food Security 08/2013
http://slidepdf.com/reader/full/usda-report-re-snap-food-security-082013 312/355
Prepared by Mathematica Policy Research 21 (3-8-11)
E1 NE D OR R
E2. What is the main
CODE ONE ONLY
reason you shop at (FILL NAME FROM E1)?
LOW PRICES .............................................................. 01
SALES ......................................................................... 02QUALITY OF FOOD .................................................... 03
VARIETY OF FOODS (GENERAL) .............................. 04
VARIETY OF SPECIAL FOODS(SUCH AS GLUTEN FREE) ......................................... 05
CLOSE TO HOME/CONVENIENT ............................... 06
EASY TO GET TO ....................................................... 07
PRODUCE SELECTION .............................................. 08
MEAT DEPARTMENT ................................................. 09
LOYALTY/FREQUENT SHOPPER PROGRAM ........... 10
OTHER (SPECIFY) ...................................................... 11
________________________________(STRING 200)
DON’T KNOW .............................................................. d
REFUSED.................................................................... r
E1 NE D OR R
E3. How do you usually get to (FILL NAME FROM E1)?CODE ALL THAT APPLY
DRIVE OWN CAR ........................................................ 1
DRIVE SOMEONE ELSE’S CAR ................................. 2
SOMEONE ELSE DRIVES ME .................................... 3
WALK .......................................................................... 4
BUS ............................................................................ 5
TAXI ............................................................................ 6
RIDE BICYCLE ............................................................ 7
OTHER (SPECIFY) ...................................................... 8
________________________________(STRING 100)
DON’T KNOW .............................................................. d
REFUSED.................................................................... r

8/22/2019 USDA Report re SNAP & Food Security 08/2013
http://slidepdf.com/reader/full/usda-report-re-snap-food-security-082013 313/355
Prepared by Mathematica Policy Research 22 (3-8-11)
E1 NE D OR R
E3a. Do you usually go to (FILL NAME FROM E1) directly from home?
YES ............................................................................. 1
NO ............................................................................... 0
DON’T KNOW .............................................................. dREFUSED.................................................................... r
E1 NE D OR R
E3b. About how long does it take to go one way from home to (FILL NAME FROME1)?
| | | NUMBER OF MINUTES ONE WAY (1 - 120)
DON’T KNOW .............................................................. d
REFUSED.................................................................... r
E1 NE D OR R
E3c. And approximately how many miles away is (FILL NAME FROM E1) from your home – one way?
| | | MILES ONE WAY (0 - 99)
INTERVIEWER: IF LESS THAN ONE MILE ENTER “0”
DON’T KNOW .............................................................. d
REFUSED.................................................................... r
SOFT CHECK: IF GT 30 I just want to make sure I recorded your answer correctly. Didyou say NUM?

8/22/2019 USDA Report re SNAP & Food Security 08/2013
http://slidepdf.com/reader/full/usda-report-re-snap-food-security-082013 314/355
Prepared by Mathematica Policy Research 23 (3-8-11)
F. FOOD EXPENDITURES
These next questions are about all the places at which you bought food last week. (Bylast week I mean Sunday through Saturday. When answering these questions, pleasethink about all food purchases, meaning those purchased with and without your [STATENAME EBT CARD].
ALL
you IF B1c = 0
anyone in your household IF B1c NE 0
F1. First, did (you/anyone in your household) shop for food at a supermarket or grocery store last week
(PROBE IF INTERVIEWDATE = SATURDAY: By last week we don’t mean the weekthat ends today, but the week that ended last Saturday.)
?
YES ............................................................................. 1
NO ............................................................................... 0
DON’T KNOW .............................................................. d
REFUSED.................................................................... r
ALL
you IF B1c = 0
anyone in your household IF B1c NE 0
F2. Think about other places where people buy food, such as meat markets,produce stands, bakeries, warehouse clubs, and convenience stores. Did
(you/anyone in your household) buy food from any stores such as theselast week
(PROBE IF INTERVIEWDATE = SATURDAY: By last week we don’t mean the weekthat ends today, but the week that ended last Saturday.)
?
YES ............................................................................. 1
NO ............................................................................... 0
DON’T KNOW .............................................................. d
REFUSED.................................................................... r
8/22/2019 USDA Report re SNAP & Food Security 08/2013
http://slidepdf.com/reader/full/usda-report-re-snap-food-security-082013 315/355
Prepared by Mathematica Policy Research 24 (3-8-11)
ALL
you IF B1c = 0
anyone in your household IF B1c NE 0
include any children who may have bought food at the school cafeteria IF B3 = 5 TO 18
F3. Last week
YES ............................................................................. 1
, did (you/anyone in your household) buy food at a restaurant, fastfood place, cafeteria, or vending machine? (Include any children who mayhave bought food at the school cafeteria.)
NO ............................................................................... 0
DON’T KNOW .............................................................. d
REFUSED.................................................................... r
ALL
you IF B1c = 0
anyone in your household IF B1c NE 0
F4. Did (you/anyone in your household) buy food from any other kind of placelast week
YES ............................................................................. 1
?
NO ............................................................................... 0
DON’T KNOW .............................................................. d
REFUSED.................................................................... r
F1, F2, F3 OR F4 = 1
IF “NO” TO F1 AND F2 AND F3 AND F4, GO TO F10.Now I’m going to ask you about the actual amount you spent on food last week in all theplaces where you bought food. Then, since last week may have been unusual for you, Iwill ask about the amount you usually
spend.
F1 = 1
you IF B1c = 0
anyone in your household IF B1c NE 0
STATE NAME EBT CARD FROM EBTstate_name
F5. How much did (you/anyone in your household) actually spend at supermarketsand grocery stores last week
PROBE: Your best estimate is fine.
including any purchases made with [STATENAME EBT CARD] card or food stamp benefits?
$ | | | |.| | | AMOUNT SPENT LAST WEEK (1 – 2000.00)
DON’T KNOW .............................................................. d GO TO F6
REFUSED.................................................................... r GO TO F6
8/22/2019 USDA Report re SNAP & Food Security 08/2013
http://slidepdf.com/reader/full/usda-report-re-snap-food-security-082013 316/355
Prepared by Mathematica Policy Research 25 (3-8-11)
SOFT CHECK: IF NUMBER OF HH MEMBERS IS LT 8 AND AMOUNT REPORTED HERE GT999.99 I just want to make sure I recorded your response correctly. Did you say NUM?
F5 GT 0
F5a. How much of the [FILL AMOUNT FROM F5] was for non-food items, such aspet food, paper products, alcohol, detergents, or cleaning supplies?
PROBE: Your best estimate is fine.
$ | | | |.| | | AMOUNT SPENT ON NON-FOOD ITEMS (0 – 2,000.00)
DON’T KNOW .............................................................. d
REFUSED.................................................................... r
HARD CHECK: IF AMOUNT GT AMOUNT COLLECTED AT F5 I’m sorry. I must have made amistake. This amount is more than the total amount spent that you reported in the lastquestion. Is there an error?
F2 = 1
you IF B1c = 0
your household IF B1c NE 0
STATE NAME EBT CARD FROM EBTstate_name
F6. How much did (you/your household) spend at stores such as meat markets,
produce stands, bakeries, warehouse clubs, and convenience stores last week
PROBE: Your best estimate is fine.
including any purchases made with your [STATE NAME EBT CARD] or foodstamp benefits?
$ | | | |.| | | AMOUNT SPENT LAST WEEK (1 – 2000.00)
DON’T KNOW .............................................................. d GO TO F7
REFUSED.................................................................... r GO TO F7
SOFT CHECK: IF NUMBER OF HH MEMBERS IS LT 8 AND AMOUNT REPORTED HERE GT999.99 I just want to make sure I recorded your response correctly. Did you say NUM?
8/22/2019 USDA Report re SNAP & Food Security 08/2013
http://slidepdf.com/reader/full/usda-report-re-snap-food-security-082013 317/355
Prepared by Mathematica Policy Research 26 (3-8-11)
F6 GT 0
F6a. How much of the [FILL AMOUNT FROM F6] was for nonfood items, such as petfood, paper products, alcohol, detergents, or cleaning supplies?
PROBE: Your best estimate is fine.
$ | | | |.| | | AMOUNT SPENT ON NON-FOOD ITEMS (0 – 2000.00)
DON’T KNOW .............................................................. d
REFUSED.................................................................... r
HARD CHECK: IF AMOUNT GT AMOUNT COLLECTED AT F6 I’m sorry. I must have made amistake. This amount is more than the total amount spent that you reported in the lastquestion. Is there an error?
F3 = 1
you IF B1c = 0
your household IF B1c NE 0
F7. How much did (you/your household) spend for food at restaurants, fast foodplaces, cafeterias, and vending machines last week
PROBE: Your best estimate is fine.
, not including alcoholpurchases?
$ | | | |.| | | AMOUNT SPENT LAST WEEK (1 – 2000.00)
DON’T KNOW .............................................................. d
REFUSED.................................................................... r
SOFT CHECK: IF NUMBER OF HH MEMBERS IS LT 8 AND AMOUNT REPORTED HERE GT999.99 I just want to make sure I recorded your response correctly. Did you say NUM?

8/22/2019 USDA Report re SNAP & Food Security 08/2013
http://slidepdf.com/reader/full/usda-report-re-snap-food-security-082013 318/355
Prepared by Mathematica Policy Research 27 (3-8-11)
F4 = 1
you IF B1c = 0
your household IF B1c NE 0
F8. How much did (you/your household) spend for food at any other kind of placelast week
PROBE: Your best estimate is fine.
?
$ | | | |.| | | AMOUNT SPENT LAST WEEK (1 – 2000.00)
DON’T KNOW .............................................................. d
REFUSED.................................................................... r
SOFT CHECK: IF NUMBER OF HH MEMBERS IS LT 8 AND AMOUNT REPORTED HERE GT999.99 I just want to make sure I recorded your response correctly. Did you say NUM?
F1, F2, F3, OR F4 = 1
you IF B1c = 0
your household IF B1c NE 0
AMOUNT FROM SUM OF (F5-F5a)+(F6-F6a)+F7+F8
STATE NAME EBT CARD FROM EBTstate_name
F9. Let’s see, (you/your household) spent about [AMOUNT] on food last week.How much of that was bought using your [STATE NAME EBT CARD] card?
$ | | | | AMOUNT SPENT WITH EBT CARD (0 - 2000) GO TO F10
DON’T KNOW .............................................................. d
REFUSED.................................................................... r
SOFT CHECK: IF AMOUNT IS GT THAN AMOUNT RECORDED IN D3 I’m sorry. I may havemade a mistake. This amount is more than the amount you said you used earlier. Is therean error?
SOFT CHECK: IF AMOUNT IS GT THAN SUM AMOUNT: I’m sorry. I may have made amistake. This amount is more than the amount you said you spent on food last week.
F9 = D OR R
F9a. Would you say you spent…
CODE ONE ONLY
Less than half,............................................................ 1
About half, .................................................................. 2
Or more than half? ..................................................... 3
DON’T KNOW .............................................................. d
8/22/2019 USDA Report re SNAP & Food Security 08/2013
http://slidepdf.com/reader/full/usda-report-re-snap-food-security-082013 319/355
Prepared by Mathematica Policy Research 28 (3-8-11)
REFUSED.................................................................... r
ALL
Let’s see, it seems that (you/your household) did not buy any food last week IF F1, F2,F3, AND F4 = 0
Again,(you/your household) spent about (FILL AMOUNT) on food last week. IF F1, F2, F3,OR F4 = 1
(You/Your household) spent about (FILL AMOUNT) on food last week. IF F1, F2, F3, OR F4 = 1
you AND do you IF B1c = 0
your household AND does your household IF B1c NE 0
STATE NAME EBT CARD FROM EBTstate_name
FILL AMOUNT FROM SUM OF (F5-F5a)+(F6-F6a)+F7+F8
F10. [Let’s see, it seems that (you/your household) did not buy any food lastweek./Again,(you/your household) spent about (FILL AMOUNT) on food lastweek / (You/Your household) spent about (FILL AMOUNT) on food last week.]Now think about how much (you/your household) usually (spend/spends). Howmuch (do you/does your household) usually spend on food at all the differentplaces we’ve been talking about in a week
$ | | | |.| | | AMOUNT SPENT IN A TYPICAL WEEK (1 – 3000.00)
? Please include any purchases
made with your [STATE NAME EBT CARD] or food stamp benefits. Do notinclude nonfood items such as pet food, paper products, detergent or cleaningsupplies.
DON’T KNOW .............................................................. d
REFUSED.................................................................... r
SOFT CHECK: IF NUMBER OF HH MEMBERS IS LT 8 AND AMOUNT REPORTED HERE GT999.99 I just want to make sure I recorded your response correctly. Did you say NUM?
ALL
or anyone in your household IF B1c NE 0
That completes our questions about food purchased over the last week. Now we’re goingto talk about things people sometimes do each month to save money when buying food.
F11. In the last 30 days, have you (or anyone in your household)…
YES NODON’TKNOW REFUSED
a. Used coupons when buying food? ....... 1 0 d r
b. Bought food in large quantities toreceive bulk discounts? ....................... 1 0 d r
c. Bought food items because they wereon sale? ............................................... 1 0 d r
d. Bought food that was near or past itsexpiration date at a discount? .............. 1 0 d r
8/22/2019 USDA Report re SNAP & Food Security 08/2013
http://slidepdf.com/reader/full/usda-report-re-snap-food-security-082013 320/355
Prepared by Mathematica Policy Research 29 (3-8-11)
G. PROGRAM PARTICIPATION
B3 = 0 – 18 YEARS (SCHOOL-AGE CHILDREN PRESENT IN HH); OR B3 = 15-45 AND B3A =FEMALE (FEMALE AGE 15-45 IN HH); OR SAMPLE MEMBER IS RESPONDENT (A1=1 OR
A2=1) AND GENDER IN LOAD FILE = FEMALE AND AGE IN LOAD FILE = 15-45; OR A1OR A2 NE TO 1 (SAMPLE MEMBER IS NOT RESPONDENT)
or someone in your household IF B1c NE 0IF NO FEMALE AGE 15-45 IN HH OR B3 > 18 YEARS (NO SCHOOL-AGE CHILDRENPRESENT IN HH), GO TO SECTION H
The next questions are about programs you (or someone in your household) may beparticipating in.
B3 = 5 TO 18 YEARS (SCHOOL-AGE CHILDREN PRESENT IN HH)
G1. During the past 30 days, did any children in the household (between 5 and18 years old) receive free or reduced-cost lunches at school?
YES ............................................................................. 1NO ............................................................................... 0
DON’T KNOW .............................................................. d
REFUSED.................................................................... r
B3 = 5 TO 18 YEARS (SCHOOL-AGE CHILDREN PRESENT IN HH
IF B3 = 5-18 YEARS (SCHOOL-AGE CHILDREN PRESENT IN HH), ASK:
G2. During the past 30 days, did any children in the household (between 5 and18 years old) receive free or reduced-cost breakfasts at school?
YES ............................................................................. 1
NO ............................................................................... 0
DON’T KNOW .............................................................. d
REFUSED.................................................................... r

8/22/2019 USDA Report re SNAP & Food Security 08/2013
http://slidepdf.com/reader/full/usda-report-re-snap-food-security-082013 321/355
Prepared by Mathematica Policy Research 30 (3-8-11)
B3 LT 5 YEARS (PRE-SCHOOL AGED CHILDREN IN HH)
your child IF B3 LT 5 YEARS FOR ONE CHILD (ONE PRE-SCHOOL CHILD IN HH)
any children in the household IF B3 LT 5 YEARS FOR MORE THAN ONE CHILD
G3. During the past 30 days, did (your child/any children in the household) receivefree or reduced-cost food at a day-care or Head Start program?
YES ............................................................................. 1
NO ............................................................................... 0
DON’T KNOW .............................................................. d
REFUSED.................................................................... r
B3 LT 5 YEARS; OR B3 = 15-45 AND B3A = FEMALE (FEMALE AGE 15-45 IN HH) ORSAMPLE MEMBER IS RESPONDENT (A1=1 OR A2=1) AND AGE IN LOAD FILE = 15-45; OR
A1 OR A2 NE TO 1 (SAMPLE MEMBER IS NOT RESPONDENT)
women IF B3 NE 4 OR LESS (NO CHILDREN 0-4 IN HH)women or children IF B3 LT 5 YEARS AND B3 = 15-45 AND B3a=FEMALE (FEMALE AGE15-45 IN HH)
children IF B3 LT 5 YEARS AND B3 NE 15-45 FOR ANY FEMALE IN HH
IF B3 <5, OR FEMALE AGE 15-45 IN HH, ASK:
G4. During the past 30 days, did any (women/women or children/children) in thishousehold get food through the WIC program?
YES ............................................................................. 1
NO ............................................................................... 0DON’T KNOW .............................................................. d
REFUSED.................................................................... r

8/22/2019 USDA Report re SNAP & Food Security 08/2013
http://slidepdf.com/reader/full/usda-report-re-snap-food-security-082013 322/355
Prepared by Mathematica Policy Research 31 (3-8-11)
H. FOOD SECURITY AND SUFFICIENCY
ALL
you AND I AND my IF B1c = 0 OR B3 LE 17 AND B2 NE 1 OR 2 (NO OTHER ADULTS IN HH)
your household AND we AND our IF B1c NE 0 AND B3 GE 18 (MORE THAN ONE ADULT INHH) OR B2=1 OR 2
Now, I’m going to read you several statements that people have made about their foodsituation. For these statements, please tell me whether the statement was often true,sometimes true, or never
H1. The first statement is, “(I/We) worried whether (my/our) food would run outbefore (I/we) got money to buy more.” Was that
true for (you/your household) in the last 30 days.
often true, sometimes true,or never
CODE ONE ONLY
true for (you/your household) in the last 30 days?
OFTEN TRUE .............................................................. 1
SOMETIMES TRUE ..................................................... 2NEVER TRUE .............................................................. 3
DON’T KNOW .............................................................. d
REFUSED.................................................................... r
ALL
I AND you IF B1c = 0 OR B3 LE 17 AND B2 NE 1 OR 2 (NO OTHER ADULTS IN HH)
we AND your household IF B1c NE 0 AND B3 GE 18 (MORE THAN ONE ADULT IN HH) ORB2 = 1 OR 2
H2. “The food that (I/we) bought just didn’t last, and (I/we) didn’t have money to getmore.” Was that often, sometimes, or never true for (you/your household) inthe last 30 days?
CODE ONE ONLY
OFTEN TRUE .............................................................. 1
SOMETIMES TRUE ..................................................... 2
NEVER TRUE .............................................................. 3
DON’T KNOW .............................................................. d
REFUSED.................................................................... r

8/22/2019 USDA Report re SNAP & Food Security 08/2013
http://slidepdf.com/reader/full/usda-report-re-snap-food-security-082013 323/355
Prepared by Mathematica Policy Research 32 (3-8-11)
ALL
I AND you IF B1c = 0 OR B3 LE 17 AND B2 NE 1 OR 2 (NO OTHER ADULTS IN HH)
we AND your household IF B1c NE 0 AND B3 GE 18 (MORE THAN ONE ADULT IN HH) ORB2 = 1 OR 2
H3. “(I/We) couldn’t afford to eat balanced meals.” Was that often, sometimes, or
never
CODE ONE ONLY
true for (you/your household) in the last 30 days?
OFTEN TRUE .............................................................. 1
SOMETIMES TRUE ..................................................... 2
NEVER TRUE .............................................................. 3
DON’T KNOW .............................................................. d
REFUSED.................................................................... r
INSERT CHECK: IF AFFIRMATIVE RESPONSE (i.e., OFTEN TRUE OR SOMETIMES TRUE)TO ONE OR MORE OF QUESTIONS H1-H3, THEN CONTINUE, ELSE SKIP TO H10.
H1, H2, OR H3 = 1 OR 2
you IF B1c = 0 OR B3 LE 17 AND B2 NE 1 OR 2 (NO OTHER ADULTS IN HH)
you or other adults in your household IF B1c NE 0 AND B3 GE 18 (MORE THAN ONE ADULT IN HH)
H4. In the last 30 days, did (you/you or other adults in your household) ever cut thesize of your meals or skip meals because there wasn’t enough money for food?
YES ............................................................................. 1NO ............................................................................... 0 GO TO H5
DON’T KNOW .............................................................. d GO TO H5
REFUSED.................................................................... r GO TO H5
H4 = 1
H4a. How many days did this happen in the last 30 days?
| | | NUMBER OF DAYS (1 – 30) GO TO H5
DON’T KNOW .............................................................. d
REFUSED.................................................................... r GO TO H5
8/22/2019 USDA Report re SNAP & Food Security 08/2013
http://slidepdf.com/reader/full/usda-report-re-snap-food-security-082013 324/355
Prepared by Mathematica Policy Research 33 (3-8-11)
H4A = D
H4b. Do you think it was more than one or two days?
YES ............................................................................. 1
NO ............................................................................... 0
DON’T KNOW .............................................................. dREFUSED.................................................................... r
H1, H2, OR H3 = 1 OR 2
H5. In the last 30 days, did you ever eat less than you felt you should becausethere wasn’t enough money for food?
YES ............................................................................. 1
NO ............................................................................... 0
DON’T KNOW .............................................................. d
REFUSED.................................................................... r
H1, H2, OR H3 = 1 OR 2
H6. In the last 30 days, were you ever hungry but didn’t eat because there wasn’tenough money for food?
YES ............................................................................. 1
NO ............................................................................... 0
DON’T KNOW .............................................................. d
REFUSED.................................................................... r
H1, H2, OR H3 = 1 OR 2
H7. In the last 30 days, did you lose weight because there wasn’t enough moneyfor food?
YES ............................................................................. 1
NO ............................................................................... 0
DON’T KNOW .............................................................. d
REFUSED.................................................................... r
INSERT CHECK: IF AFFIRMATIVE RESPONSE (i.e., OFTEN TRUE OR SOMETIMES TRUE)TO ONE OR MORE OF QUESTIONS H4-H7, THEN CONTINUE, ELSE SKIPTO H10.

8/22/2019 USDA Report re SNAP & Food Security 08/2013
http://slidepdf.com/reader/full/usda-report-re-snap-food-security-082013 325/355
Prepared by Mathematica Policy Research 34 (3-8-11)
H4, H5, H6, OR H7 = 1
you IF B1c = 0 OR B3 LE 17 AND B2 NE 1 OR 2 (NO OTHER ADULTS IN HH)
you or other adults in your household IF B1C NE 0 AND B3 GE 18 (MORE THAN ONE ADULT IN HH)
H8. In the last 30 days, did (you/you or other adults in your household) ever not eat
for a whole day because there wasn’t enough money for food?
YES ............................................................................. 1
NO ............................................................................... 0 GO TO H10
DON’T KNOW .............................................................. d GO TO H10
REFUSED.................................................................... r GO TO H10
H8 = 1
H9. How many times did this happen in the last 30 days?
| | | NUMBER OF TIMES (1 – 30) GO TO H10
DON’T KNOW .............................................................. d
REFUSED.................................................................... r GO TO H10
H9 = D
H9a. Do you think it was more than one or two days?
YES ............................................................................. 1
NO ............................................................................... 0
DON’T KNOW .............................................................. d
REFUSED.................................................................... r

8/22/2019 USDA Report re SNAP & Food Security 08/2013
http://slidepdf.com/reader/full/usda-report-re-snap-food-security-082013 326/355
Prepared by Mathematica Policy Research 35 (3-8-11)
B3 = 0 – 18 (CHILDREN IN HOUSEHOLD)
I AND my AND I was AND you IF B3 LE 17 AND B2 NE 1 OR 2 (NO OTHER ADULT/PARTNER IN HH) AND B2 NE 1 OR 2
we AND our AND we were AND your household IF B3 GE 18 (MORE THAN ONE ADULT INHH) OR B2 = 1 OR 2
the child in IF B3 LE 17 AND B2 NE 1 OR 2 FOR JUST ONE INSTANCE (ONE CHILD IN HH)
the children IF B3 LE 17 AND B2 NE 1 OR 2 FOR MULTIPLE INSTANCES (MORE THANONE CHILD IN HH)
IF NO CHILDREN IN HOUSEHOLD, GO TO H17. ELSE ASK:
Now I’m going to read you several statements that people have made about the foodsituation of their children. For these statements, please tell me whether the statementwas often true, sometimes true, or never true in the last 30 days for any child under 18 years old living in the household.
H10. “(I/We) relied on only a few kinds of low-cost food to feed (the child in (my/our)household/the children) because (I was/we were) running out of money to buyfood.” Was that often, sometimes, or never
CODE ONE ONLY
true for (you/your household) in thelast 30 days?
OFTEN TRUE .............................................................. 1
SOMETIMES TRUE ..................................................... 2
NEVER TRUE .............................................................. 3
DON’T KNOW .............................................................. d
REFUSED.................................................................... r
B3 = 0 – 18 (CHILDREN IN HOUSEHOLD)
I AND my household AND you IF B3 LE 17 AND B2 NE 1 OR 2 (NO OTHER ADULT/PARTNER IN HH)
we AND our household AND your household IF B3 GE 18 (MORE THAN ONE ADULT INHH) OR B2 = 1 OR 2
the child in IF B3 LE 17 AND B2 NE 1 OR 2 FOR JUST ONE INSTANCE (ONE CHILD IN HH)
the children IF B3 LE 17 AND B2 NE 1 OR 2 FOR MULTIPLE INSTANCES (MORE THANONE CHILD IN HH)
H11. “(I/We) couldn’t feed (the child in (my/our)household/ the children) a balancedmeal, because (I/we) couldn’t afford that.” Was that often, sometimes, or never
CODE ONE ONLY
true for (you/your household) in the last 30 days?
OFTEN TRUE .............................................................. 1
SOMETIMES TRUE ..................................................... 2
NEVER TRUE .............................................................. 3
DON’T KNOW .............................................................. d
REFUSED.................................................................... r
8/22/2019 USDA Report re SNAP & Food Security 08/2013
http://slidepdf.com/reader/full/usda-report-re-snap-food-security-082013 327/355
Prepared by Mathematica Policy Research 36 (3-8-11)
B3 = 0 – 18 (CHILDREN IN HOUSEHOLD)
The child in IF B3 LE 17 AND B2 NE 1 OR 2 FOR JUST ONE INSTANCE (ONE CHILD INHH)
the children were IF B3 LE 17 AND B2 NE 1 OR 2 FOR MULTIPLE INSTANCES (MORETHAN ONE CHILD IN HH)
my AND I AND you IF B3 LE 17 AND B2 NE 1 OR 2 (NO OTHER ADULTS/PARTNER IN HH)
our AND we AND your household IF B3 GE 18 (MORE THAN ONE ADULT IN HH) OR B2 = 1OR 2
H12. “(The child in (my/our) household was/The children were) not eating enoughbecause (I/we) just couldn’t afford enough food.” Was that often, sometimes,or never
CODE ONE ONLY
true for (you/your household) in the last 30 days?
OFTEN TRUE .............................................................. 1
SOMETIMES TRUE ..................................................... 2
NEVER TRUE .............................................................. 3
DON’T KNOW .............................................................. dREFUSED.................................................................... r
H10, H11, OR H12 = 1 OR 2
the child’s IF B3 LE 17 AND B2 NE 1 OR 2 FOR JUST ONE INSTANCE (ONE CHILD IN HH)
any of the children’s IF B3 LE 17 AND B2 NE 1 OR 2 FOR MULTIPLE INSTANCES (MORETHAN ONE CHILD IN HH)
INSERT CHECK: IF AFFIRMATIVE RESPONSE (i.e., OFTEN TRUE OR SOMETIMES TRUE)TO ONE OR MORE OF QUESTIONS H10-H12, THEN CONTINUE, ELSESKIP TO H17.
H13. In the last 30 days, did you ever cut the size of (the child’s/any of thechildren’s) meals because there wasn’t enough money for food?
YES ............................................................................. 1
NO ............................................................................... 0
DON’T KNOW .............................................................. d
REFUSED.................................................................... r
H10, H11, OR H12 = 1 OR 2
the childIF B3 LE 17 AND B2 NE 1 OR 2 FOR JUST ONE INSTANCE (ONE CHILD IN HH)
any of the children IF B3 LE 17 AND B2 NE 1 OR 2 FOR MULTIPLE INSTANCES (MORETHAN ONE CHILD IN HH)
H14. In the last 30 days, did (the child/any of the children) ever skip a meal becausethere wasn’t enough money for food?
YES ............................................................................. 1
NO ............................................................................... 0 GO TO H15
DON’T KNOW .............................................................. d GO TO H15
REFUSED.................................................................... r GO TO H15
8/22/2019 USDA Report re SNAP & Food Security 08/2013
http://slidepdf.com/reader/full/usda-report-re-snap-food-security-082013 328/355
Prepared by Mathematica Policy Research 37 (3-8-11)
H14 = 1
H14a. How many days did this happen in the last 30 days?
| | | NUMBER OF DAYS (1 – 30) GO TO H15
DON’T KNOW .............................................................. d
REFUSED.................................................................... r GO TO H15
H14A = D
H14b. Do you think it was more than one or two days?
YES ............................................................................. 1
NO ............................................................................... 0
DON’T KNOW .............................................................. d
REFUSED.................................................................... r
H10, H11, OR H12 = 1 OR 2
was the child IF B3 LE 17 AND B2 NE 1 OR 2 FOR JUST ONE INSTANCE (ONE CHILD INHH)
were the children IF B3 LE 17 AND B2 NE 1 OR 2 FOR MULTIPLE INSTANCES (MORETHAN ONE CHILD IN HH)
H15. In the last 30 days, (was the child/were the children) ever hungry but you justcouldn’t afford more food?
YES ............................................................................. 1
NO ............................................................................... 0
DON’T KNOW .............................................................. d
REFUSED.................................................................... r
H10, H11, OR H12 = 1 OR 2
the child IF B3 LE 17 AND B2 NE 1 OR 2 FOR JUST ONE INSTANCE (ONE CHILD IN HH)
any of the children IF B3 LE 17 AND B2 NE 1 OR 2 FOR MULTIPLE INSTANCES (MORETHAN ONE CHILD IN HH)
H16. In the last 30 days, did (the child/any of the children) ever not eat for a wholeday because there wasn’t enough money for food?
YES ............................................................................. 1
NO ............................................................................... 0
DON’T KNOW .............................................................. d
REFUSED.................................................................... r

8/22/2019 USDA Report re SNAP & Food Security 08/2013
http://slidepdf.com/reader/full/usda-report-re-snap-food-security-082013 329/355
Prepared by Mathematica Policy Research 38 (3-8-11)
ALL
or someone in your household IF B1C NE 0 AND B3 GE 18
you IF B1C = 0
you or other adults in your household IF B1C NE 0 AND B3 GE 18
H17. The next questions are about some community programs you (or someone in your household) may have participated in during the past 30 days.
In the last 30 days, did (you/ you or other adults in your household) ever getemergency food from a church, a food pantry or food bank?
PROBE: This includes all religious and charitable organizations.
YES ............................................................................. 1
NO ............................................................................... 0
DON’T KNOW .............................................................. d
REFUSED.................................................................... r
ALL
you IF B1C = 0
anyone in this household IF B1C NE 0 AND B3 GE 18
H18. During the past 30 days, did (you/anyone in this household) go to a communityprogram or senior center to eat prepared meals?
YES ............................................................................. 1
NO ............................................................................... 0
DON’T KNOW .............................................................. d
REFUSED.................................................................... r
ALL
you IF B1C = 0
you or other adults in your household IF B1C NE 0 AND B3 GE 18
H19. During the last 30 days, did (you/you or other adults in your household) ever eat any meals at a soup kitchen or shelter?
YES ............................................................................. 1
NO ............................................................................... 0
DON’T KNOW .............................................................. d
REFUSED.................................................................... r
8/22/2019 USDA Report re SNAP & Food Security 08/2013
http://slidepdf.com/reader/full/usda-report-re-snap-food-security-082013 330/355
Prepared by Mathematica Policy Research 39 (3-8-11)
ALL
you IF B1C = 0
anyone in this household IF B1C NE 0 AND B3 GE 18
H20. During the past 30 days, did (you/anyone in this household) receive any mealsfrom “Meals on Wheels” or any other program delivering meals to your home?
YES ............................................................................. 1
NO ............................................................................... 0
DON’T KNOW .............................................................. d
REFUSED.................................................................... r

8/22/2019 USDA Report re SNAP & Food Security 08/2013
http://slidepdf.com/reader/full/usda-report-re-snap-food-security-082013 331/355
Prepared by Mathematica Policy Research 40 (3-8-11)
I. HOUSEHOLD RESOURCES
ALL
or anyone in your household IF B1C NE 0
LAST MONTH FROM MONTH PRIOR TO INTERVIEW DATE
STATE WELFARE NAME FROM StateWelfare_Name
The next questions are about sources of income. The answer to these and all other questions on this survey will be kept strictly confidential and will never be associatedwith your name.
I1a_a. During (LAST MONTH), did you (or anyone in your household) receive any…
TANF, Temporary Assistance to Needy Families (also known as [STATEWELFARE NAME])?
YES ............................................................................. 1
NO ............................................................................... 0DON’T KNOW .............................................................. d
REFUSED.................................................................... r
ALL
or anyone in your household IF B1C NE 0
I1a_b. (During [LAST MONTH], did you (or anyone in your household) receive…)
Other welfare such as General Assistance?
YES ............................................................................. 1
NO ............................................................................... 0
DON’T KNOW .............................................................. d
REFUSED.................................................................... r
ALL
or anyone in your household IF B1C NE 0
I1a_c. (During [LAST MONTH], did you (or anyone in your household) receive any…)
Social Security checks from the government for retirement, disability, or survivors’ benefits?
YES ............................................................................. 1
NO ............................................................................... 0
DON’T KNOW .............................................................. d
8/22/2019 USDA Report re SNAP & Food Security 08/2013
http://slidepdf.com/reader/full/usda-report-re-snap-food-security-082013 332/355
Prepared by Mathematica Policy Research 41 (3-8-11)
REFUSED.................................................................... r
ALL
or anyone in your household IF B1C NE 0
I1a_d. (During [LAST MONTH], did you (or anyone in your household) receive…)
Other retirement benefits such as a government or private pension or annuity?
YES ............................................................................. 1
NO ............................................................................... 0
DON’T KNOW .............................................................. d
REFUSED.................................................................... r
ALL
or anyone in your household IF B1C NE 0
I1a_e. (During [LAST MONTH], did you (or anyone in your household) receive any…)
SSI or Supplemental Security Income from the federal, state, or localgovernment?
YES ............................................................................. 1
NO ............................................................................... 0
DON’T KNOW .............................................................. d
REFUSED.................................................................... r
ALL
or anyone in your household IF B1C NE 0
I1a_f. (During [LAST MONTH], did you (or anyone in your household) receive any…)
Veteran’s Benefits?
YES ............................................................................. 1
NO ............................................................................... 0
DON’T KNOW .............................................................. d
REFUSED.................................................................... r
8/22/2019 USDA Report re SNAP & Food Security 08/2013
http://slidepdf.com/reader/full/usda-report-re-snap-food-security-082013 333/355
Prepared by Mathematica Policy Research 42 (3-8-11)
ALL
or anyone in your household IF B1C NE 0
I1a_g. (During [LAST MONTH], did you (or anyone in your household) receive any…)
Unemployment Insurance or worker’s compensation benefits?
YES ............................................................................. 1
NO ............................................................................... 0
DON’T KNOW .............................................................. d
REFUSED.................................................................... r
ALL
or anyone in your household IF B1C NE 0I1a_h. (During [LAST MONTH], did you (or anyone in your household) receive any…)
Child support payments?
YES ............................................................................. 1
NO ............................................................................... 0
DON’T KNOW .............................................................. d
REFUSED.................................................................... r
ALL
or anyone in your household IF B1C NE 0
I1a_i. (During [LAST MONTH], did you (or anyone in your household) receive any…)
Payments from roomers or boarders?
YES ............................................................................. 1
NO ............................................................................... 0
DON’T KNOW .............................................................. dREFUSED.................................................................... r

8/22/2019 USDA Report re SNAP & Food Security 08/2013
http://slidepdf.com/reader/full/usda-report-re-snap-food-security-082013 334/355
Prepared by Mathematica Policy Research 43 (3-8-11)
ALL
or anyone in your household IF B1C NE 0
I1a_j. (During [LAST MONTH], did you (or anyone in your household) receive any…)
Financial support from friends or family?
YES ............................................................................. 1
NO ............................................................................... 0
DON’T KNOW .............................................................. d
REFUSED.................................................................... r
ALL
or anyone in your household IF B1C NE 0I1a_k. (During [LAST MONTH], did you (or anyone in your household) receive …)
Any other income besides earnings?
YES ............................................................................. 1
NO ............................................................................... 0
DON’T KNOW .............................................................. d
REFUSED.................................................................... r
I1A_K = 1
I1a_k_Specify What is that other income?
______________________________________________
I1A_A = 1
STATE WELFARE NAME FROM StateWelfare_Name
I1b_a. How much did you receive last month from TANF, Temporary Assistance toNeedy Families (also known as [STATE WELFARE NAME])?
$| | | | | ENTER AMOUNT (0 – 9999)
DON’T KNOW .............................................................. d
REFUSED.................................................................... r
8/22/2019 USDA Report re SNAP & Food Security 08/2013
http://slidepdf.com/reader/full/usda-report-re-snap-food-security-082013 335/355
Prepared by Mathematica Policy Research 44 (3-8-11)
I1A_A=1 AND B1C NE 0 AND B3 GE 18
I1c_a. How much did other people in your household receive from TANF last monthaltogether?
$| | | | | ENTER AMOUNT (0 – 9999)
DON’T KNOW .............................................................. d
REFUSED.................................................................... r
HARD CHECK: IF I1A_A = 1 AND BOTH I1B_A AND I1C_A = 0: I must have made a mistake.I previously recorded that you or someone in your household received TANF last month.Is there an error?
I1A_B = 1
I1b_b. How much did you receive last month from Other welfare such as General
Assistance?
$| | | | | ENTER AMOUNT (0 – 9999)
DON’T KNOW .............................................................. d
REFUSED.................................................................... r
I1A_B=1 AND B1C NE 0 AND B3 GE 18
I1c_b. How much did other people in your household receive from Other welfare such
as General Assistance?
$| | | | | ENTER AMOUNT (0 – 9999)
DON’T KNOW .............................................................. d
REFUSED.................................................................... r
HARD CHECK: IF I1A_B = 1 AND BOTH I1B_B AND I1C_B = 0: I must have made a mistake.I previously recorded that you or someone in your household received Other welfare lastmonth. Is there an error?
I1A_C = 1
I1b_c. How much did you receive last month from Social Security checks from thegovernment for retirement, disability, or survivors’ benefits?
$| | | | | ENTER AMOUNT (0 – 9999)
DON’T KNOW .............................................................. d
8/22/2019 USDA Report re SNAP & Food Security 08/2013
http://slidepdf.com/reader/full/usda-report-re-snap-food-security-082013 336/355
Prepared by Mathematica Policy Research 45 (3-8-11)
REFUSED.................................................................... r
I1A_C=1 AND B1C NE 0 AND B3 GE 18
I1c_c. How much did other people in your household receive from Social Securitychecks from the government for retirement, disability, or survivors’ benefits?
$| | | | | ENTER AMOUNT (0 – 9999)
DON’T KNOW .............................................................. d
REFUSED.................................................................... r
HARD CHECK: IF I1A_C = 1 AND BOTH I1B_C AND I1C_C = 0: I must have made amistake. I previously recorded that you or someone in your household received SocialSecurity checks last month. Is there an error?
I1A_D = 1
I1b_d. How much did you receive last month from Other retirement benefits such as agovernment or private pension or annuity?
$| | | | | ENTER AMOUNT (0 – 9999)
DON’T KNOW .............................................................. d
REFUSED.................................................................... r
I1A_D=1 AND B1C NE 0 AND B3 GE 18
I1c_d. How much did other people in your household receive from Other retirementbenefits such as a government or private pension or annuity?
$| | | | | ENTER AMOUNT (0 – 9999)
DON’T KNOW .............................................................. d
REFUSED.................................................................... r
HARD CHECK: IF I1A_D = 1 AND BOTH I1B_D AND I1C_D = 0: I must have made a
mistake. I previously recorded that you or someone in your household received Other retirement benefits last month. Is there an error?
I1A_E = 1
I1b_e. How much did you receive last month from SSI or Supplemental SecurityIncome from the federal, state, or local government?
$| | | | | ENTER AMOUNT (0 – 9999)

8/22/2019 USDA Report re SNAP & Food Security 08/2013
http://slidepdf.com/reader/full/usda-report-re-snap-food-security-082013 337/355
Prepared by Mathematica Policy Research 46 (3-8-11)
DON’T KNOW .............................................................. d
REFUSED.................................................................... r
I1A_E=1 AND B1C NE 0
I1c_e. How much did other people in your household receive from SSI or Supplemental Security Income from the federal, state, or local government?
$| | | | | ENTER AMOUNT (0 – 9999)
DON’T KNOW .............................................................. d
REFUSED.................................................................... r
HARD CHECK: IF I1A_E = 1 AND BOTH I1B_E AND I1C_E = 0: I must have made a mistake.I previously recorded that you or someone in your household received SSI or Supplemental Security Income last month. Is there an error?
I1A_F = 1
I1b_f. How much did you receive last month from Veteran’s Benefits?
$| | | | | ENTER AMOUNT (0 – 9999)
DON’T KNOW .............................................................. d
REFUSED.................................................................... r
I1A_F=1 AND B1C NE 0 AND B3 GE 18I1c_f. How much did other people in your household receive from Veteran’s
Benefits?
$| | | | | ENTER AMOUNT (0 – 9999)
DON’T KNOW .............................................................. d
REFUSED.................................................................... r
HARD CHECK: IF I1A_F = 1 AND BOTH I1B_F AND I1C_F = 0: I must have made a mistake.
I previously recorded that you or someone in your household received Veteran’s Benefitslast month. Is there an error?
I1A_G = 1
I1b_g. How much did you receive last month from Unemployment Insurance or worker’s compensation benefits?

8/22/2019 USDA Report re SNAP & Food Security 08/2013
http://slidepdf.com/reader/full/usda-report-re-snap-food-security-082013 338/355
Prepared by Mathematica Policy Research 47 (3-8-11)
$| | | | | ENTER AMOUNT (0 – 9999)
DON’T KNOW .............................................................. d
REFUSED.................................................................... r
I1A_G=1 AND B1C NE 0 AND B3 GE 18
I1c_g. How much did other people in your household receive from UnemploymentInsurance or worker’s compensation benefits?
$| | | | | ENTER AMOUNT (0 – 9999)
DON’T KNOW .............................................................. d
REFUSED.................................................................... r
HARD CHECK: IF I1A_G = 1 AND BOTH I1B_G AND I1C_G = 0: I must have made amistake. I previously recorded that you or someone in your household receivedUnemployment Insurance or worker’s compensation benefits last month. Is there an
error?
I1A_H = 1
I1b_h. How much did you receive last month from Child support payments?
$| | | | | ENTER AMOUNT (0 – 9999)
DON’T KNOW .............................................................. d
REFUSED.................................................................... r
I1A_H=1 AND B1C NE 0 AND B3 GE 18
I1c_h. How much did other people in your household receive from Child supportpayments?
$| | | | | ENTER AMOUNT (0 – 9999)
DON’T KNOW .............................................................. d
REFUSED.................................................................... r
HARD CHECK: IF I1A_H = 1 AND BOTH I1B_H AND I1C_H = 0: I must have made amistake. I previously recorded that you or someone in your household received Childsupport payments last month. Is there an error?
I1A_I = 1
I1b_i. How much did you receive last month from Payments from roomers or boarders?

8/22/2019 USDA Report re SNAP & Food Security 08/2013
http://slidepdf.com/reader/full/usda-report-re-snap-food-security-082013 339/355
Prepared by Mathematica Policy Research 48 (3-8-11)
$| | | | | ENTER AMOUNT (0 – 9999)
DON’T KNOW .............................................................. d
REFUSED.................................................................... r
I1A_I=1 AND B1C NE 0 AND B3 GE 18
I1c_i. How much did other people in your household receive from Payments fromroomers or boarders?
$| | | | | ENTER AMOUNT (0 – 9999)
DON’T KNOW .............................................................. d
REFUSED.................................................................... r
HARD CHECK: IF I1A_I = 1 AND BOTH I1B_I AND I1C_I = 0: I must have made a mistake. Ipreviously recorded that you or someone in your household received Payments fromroomers or boarders last month. Is there an error?
I1A_J = 1
I1b_j. How much did you receive last month from Financial support from friends or family?
$| | | | | ENTER AMOUNT (0 – 9999)
DON’T KNOW .............................................................. d
REFUSED.................................................................... r
I1A_J=1 AND B1C NE 0 AND B3 GE 18
I1c_j. How much did other people in your household receive from Financial supportfrom friends or family?
$| | | | | ENTER AMOUNT (0 – 9999)
DON’T KNOW .............................................................. d
REFUSED.................................................................... r
HARD CHECK: IF I1A_J = 1 AND BOTH I1B_J AND I1C_J = 0: I must have made a mistake.I previously recorded that you or someone in your household received Financial supportfrom friends or family last month. Is there an error?
I1A_K = 1
I1b_k. How much did you receive last month from (FILL FROM I1a_k_Specify)?

8/22/2019 USDA Report re SNAP & Food Security 08/2013
http://slidepdf.com/reader/full/usda-report-re-snap-food-security-082013 340/355
Prepared by Mathematica Policy Research 49 (3-8-11)
$| | | | | ENTER AMOUNT (0 – 9999)
DON’T KNOW .............................................................. d
REFUSED.................................................................... r
I1A_K=1 AND B1C NE 0 AND B3 GE 18
I1c_k. How much did other people in your household receive from (FILL FROMI1a_k_Specify)?
$| | | | | ENTER AMOUNT (0 – 9999)
DON’T KNOW .............................................................. d
REFUSED.................................................................... r
HARD CHECK: IF I1A_K = 1 AND BOTH I1B_K AND I1C_K = 0: I must have made a mistake.I previously recorded that you or someone in your household received (FILL FROMI1a_k_Specify) last month. Is there an error?
ALL
I2. Are you currently working at a job for pay? Include any self-employment.
YES ............................................................................. 1
NO ............................................................................... 0 GO TO I6
DON’T KNOW .............................................................. d GO TO I6
REFUSED.................................................................... r GO TO I6
I2 = 1
I3. How many hours do you usually work per week on this job?
| | | NUMBER OF HOURS (1 – 80)
DON’T KNOW .............................................................. d
REFUSED.................................................................... r
SOFT CHECK: IF GT 60 I just want to make sure I recorded you answer correctly. Did yousay NUM?
I2 = 1
I4. How much do you earn per hour on this job, before taxes and other deductions?
$ | | |.| | | HOURLY WAGE (1.00 – 40.99) GO TO I6
NOT PAID BY THE HOUR ........................................... 0
DON’T KNOW .............................................................. d GO TO I6

8/22/2019 USDA Report re SNAP & Food Security 08/2013
http://slidepdf.com/reader/full/usda-report-re-snap-food-security-082013 341/355
Prepared by Mathematica Policy Research 50 (3-8-11)
REFUSED.................................................................... r GO TO I6
SOFT CHECK: IF GT 20 I just want to make sure I recorded your answer correctly. Didyou say NUM?
I4 = 0
I5. ENTER AMOUNT
$ | | |,| | | | (1 - 99999)
ENTER PAY PERIOD
CODE ONE ONLY
WEEK .......................................................................... 1
DAY ............................................................................. 2
EVERY TWO WEEKS ................................................. 3
TWICE A MONTH ........................................................ 4
MONTHLY ................................................................... 5
YEARLY ...................................................................... 6
OTHER (SPECIFY) ...................................................... 7
(STRING (NUM))
DON’T KNOW .............................................................. d
REFUSED.................................................................... r
SOFT CHECK: IF GT $2,000 / MONTH I just want to make sure I recorded your responsecorrectly. Did you say NUM PER UNIT?
B1C NE 0 AND B3 GE15
else IF I2 = 1
IF R LIVES ALONE, GO TO I9
I6. Does anyone (else) in your household work at a job for pay?
YES ............................................................................. 1
NO ............................................................................... 0 GO TO I9
DON’T KNOW .............................................................. d GO TO I9
REFUSED.................................................................... r GO TO I9
8/22/2019 USDA Report re SNAP & Food Security 08/2013
http://slidepdf.com/reader/full/usda-report-re-snap-food-security-082013 342/355
Prepared by Mathematica Policy Research 51 (3-8-11)
I6 = 1
other IF I2 = 1
I7. How many (other) people in your household work at a job for pay?
PROBE: Not including yourself.
| | | NUMBER OF WORKING HOUSEHOLD MEMBERS (1 - 10)
NONE .......................................................................... 0 GO TO I9
DON’T KNOW .............................................................. d
REFUSED.................................................................... r
HARD CHECK: IF GT TOTAL HH MEMBERS COLLECTED AT B3 I’m sorry. Earlier in theinterview, I recorded that there were less people living in your HH. Did I make an error?
I7 GT 0else IF I2 = 1
I7a. Who (else) in your household works at a job for pay?
[LIST ALL MEMBERS OF HOUSEHOLD AGE 15 AND OVER FROM B1C]
CODE ALL THAT APPLY
NAME 1 ....................................................................... 2
NAME 2 ....................................................................... 3
NAME 3 ....................................................................... 4
NAME 4 ....................................................................... 5
I6 = 1
PERSON 1 FIRST NAME FOR FIRST PERSON SELECTED FROM I7a.
I8_1a. How many hours per week does (PERSON 1) person usually work?
| | | NUMBER OF HOURS (0 - 80)
DON’T KNOW .............................................................. d
REFUSED.................................................................... r
SOFT CHECK: IF GT 60 I just want to make sure I recorded you answer correctly. Did yousay NUM?
8/22/2019 USDA Report re SNAP & Food Security 08/2013
http://slidepdf.com/reader/full/usda-report-re-snap-food-security-082013 343/355
Prepared by Mathematica Policy Research 52 (3-8-11)
I8_1A > 0
PERSON 1 FIRST NAME FOR FIRST PERSON SELECTED FROM I7a.
I8_1b. How much does (PERSON 1) earn per hour on this job, before taxes and other deductions?
PROBE: Your best estimate is fine.
$ | | |.| | | HOURLY WAGE (1 – 40) GO TO LOOP
NOT PAID BY THE HOUR ........................................... 0
DON’T KNOW .............................................................. d GO TO LOOP
REFUSED.................................................................... r GO TO LOOP
SOFT CHECK: IF GT 20 I just want to make sure I recorded your answer correctly. Didyou say NUM?
I8_1B = 0
I8_1c. ENTER AMOUNT
$ | | |,| | | |.| | | (1 – 99999)
ENTER PAY PERIOD
CODE ONE ONLY
WEEK .......................................................................... 1
DAY ............................................................................. 2
EVERY TWO WEEKS ................................................. 3
TWICE A MONTH ........................................................ 4
MONTHLY ................................................................... 5
YEARLY ...................................................................... 6
OTHER (SPECIFY) ...................................................... 7(STRING (NUM))
DON’T KNOW .............................................................. d
REFUSED.................................................................... r
SOFT CHECK: IF GT $2,000 PER MONTH I just want to make sure I recorded your answer correctly. Did you say NUM PER UNIT?

8/22/2019 USDA Report re SNAP & Food Security 08/2013
http://slidepdf.com/reader/full/usda-report-re-snap-food-security-082013 344/355
Prepared by Mathematica Policy Research 53 (3-8-11)
I8_1A > 0
PERSON 2 FIRST NAME FOR NEXT MEMBER OF HH SELECTED AT I7a.
I8_2a. How many hours per week does (PERSON 2) person usually work?
| | | NUMBER OF HOURS (0 - 80)
DON’T KNOW .............................................................. d
REFUSED.................................................................... r
SOFT CHECK: IF GT 60 I just want to make sure I recorded you answer correctly. Did yousay NUM?
I8_2a > 0
PERSON 2 FILL FIRST NAME FOR NEXT MEMBER OF HH SELECTED AT I7a.
I8_2b. How much does (PERSON 2) earn per hour on this job, before taxes and other deductions?
PROBE: Your best estimate is fine.
$ | | |.| | | HOURLY WAGE (1 – 40) GO TO LOOP
NOT PAID BY THE HOUR ........................................... 0
DON’T KNOW .............................................................. d GO TO LOOP
REFUSED.................................................................... r GO TO LOOP
SOFT CHECK: IF GT 20 I just want to make sure I recorded your answer correctly. Didyou say NUM?
8/22/2019 USDA Report re SNAP & Food Security 08/2013
http://slidepdf.com/reader/full/usda-report-re-snap-food-security-082013 345/355
Prepared by Mathematica Policy Research 54 (3-8-11)
I8_2B = 0
I8_2c. ENTER AMOUNT
$ | | |,| | | |.| | | (1 – 99999)
ENTER PAY PERIOD
CODE ONE ONLY
WEEK .......................................................................... 1
DAY ............................................................................. 2
EVERY TWO WEEKS ................................................. 3
TWICE A MONTH ........................................................ 4
MONTHLY ................................................................... 5
YEARLY ...................................................................... 6
OTHER (SPECIFY) ...................................................... 7(STRING 80)
DON’T KNOW .............................................................. d
REFUSED.................................................................... r
CONTINUE LOOP UNTIL ALL HOUSEHOLD MEMBERS SELECTED AT I7a ARE ACCOUNTED FOR
SOFT CHECK: IF GT $2,000 PER MONTH I just want to make sure I recorded your answer correctly. Did you say NUM PER UNIT?
IF SAME RESPONDENT ASK I9INTRO; OTHERWISE GO TO I9.
I9INTRO Once again, I am going to ask some questions we asked in your last interviewbecause things can change over time.
ALL
or anyone in your household IF B1C NE 0
I9. Do you (or anyone in your household) currently own a car, truck, or other typeof vehicle?
YES ............................................................................. 1 GO TO I11
NO ............................................................................... 0
DON’T KNOW .............................................................. d
REFUSED.................................................................... r
I9 = 0, D OR R

8/22/2019 USDA Report re SNAP & Food Security 08/2013
http://slidepdf.com/reader/full/usda-report-re-snap-food-security-082013 346/355
Prepared by Mathematica Policy Research 55 (3-8-11)
I10. Do you have access to car, truck, or other type of vehicle when you need one?
YES ............................................................................. 1
NO ............................................................................... 0
DON’T KNOW .............................................................. d
REFUSED.................................................................... r
ALL
or anyone in your household IF B1C NE 0
I11. Do you (or anyone in your household) currently have a credit card that can beused to make purchases?
YES ............................................................................. 1
NO ............................................................................... 0
DON’T KNOW .............................................................. d
REFUSED.................................................................... r
ALL
I12. Next some questions about where you live.
First, please tell me the kind of place where you now live?
CODE ONE ONLY
HOUSE, TOWNHOUSE, CONDO ............................... 1
MOBILE HOME/TRAILER ............................................ 2
APARTMENT ............................................................... 3
ROOM ......................................................................... 4
MOTEL/HOTEL ........................................................... 5 GO TO I14
HOMELESS, LIVING IN A SHELTER OR MISSION .... 6 GO TO I14
HOMELESS, LIVING ON THE STREET ...................... 7 GO TO I14
CAR, VAN OR RECREATIONAL VEHICLE ................. 8 GO TO I14
ABANDONED BUILDING ............................................ 9 GO TO I14
OTHER (SPECIFY) ...................................................... 10
(STRING 100)
DON’T KNOW .............................................................. d
REFUSED.................................................................... r
I12 = 1, 2, 3, 4, 10, D, OR R
I13. Do you…
CODE ONE ONLY
8/22/2019 USDA Report re SNAP & Food Security 08/2013
http://slidepdf.com/reader/full/usda-report-re-snap-food-security-082013 347/355
Prepared by Mathematica Policy Research 56 (3-8-11)
Own the place you live, ............................................. 1 GO TO I15
Rent your own place or contribute to rentat a friend or family’s place, or ................................. 2
Live rent free? ............................................................ 3
DON’T KNOW .............................................................. d
REFUSED.................................................................... r
I13 = 2, 3, D, OR R
I13a. Does your household receive Section 8 or Public Housing Assistance?
YES ............................................................................. 1
NO ............................................................................... 0
DON’T KNOW .............................................................. d
REFUSED.................................................................... r
I14. Do you have access to a place where you can prepare a meal?
YES ............................................................................. 1
NO ............................................................................... 0
DON’T KNOW .............................................................. d
REFUSED.................................................................... r
I12 = 1, 2, 3, 4, 5, 6, D, OR R
I15. Do you currently have the following items in your home in working condition…
YES NODON’TKNOW REFUSED
a. Refrigerator? .............................................. 1 0 d r
b. Stand alone food freezer? .......................... 1 0 d r
c. Gas or electric stove? ................................. 1 0 d r
d. Microwave oven? ....................................... 1 0 d r

8/22/2019 USDA Report re SNAP & Food Security 08/2013
http://slidepdf.com/reader/full/usda-report-re-snap-food-security-082013 348/355
Prepared by Mathematica Policy Research 57 (3-8-11)
J. MENTAL HEALTH AND WELL-BEING
ALL
J1_a. Now I am going to ask you some questions about feelings you may haveexperienced over the past 30 days.
During the past 30 days
So sad that nothing could cheer you up?
, how often did you feel . . .
Would you say: All of the time, most of the time, some of the time, a little of thetime, or none
CODE ONE ONLY
of the time?
ALL OF THE TIME ....................................................... 1
MOST OF THE TIME ................................................... 2
SOME OF THE TIME ................................................... 3
A LITTLE OF THE TIME .............................................. 4
NONE OF THE TIME ................................................... 5
DON’T KNOW .............................................................. d
REFUSED.................................................................... r
ALL
J1_b. During the past 30 days
Nervous?
, how often did you feel . . .
PROBE: Would you say: All of the time, most of the time, some of the time, a little of the time, or none
CODE ONE ONLY
of the time?
ALL OF THE TIME ....................................................... 1
MOST OF THE TIME ................................................... 2
SOME OF THE TIME ................................................... 3
A LITTLE OF THE TIME .............................................. 4
NONE OF THE TIME ................................................... 5
DON’T KNOW .............................................................. d
REFUSED.................................................................... r
8/22/2019 USDA Report re SNAP & Food Security 08/2013
http://slidepdf.com/reader/full/usda-report-re-snap-food-security-082013 349/355
Prepared by Mathematica Policy Research 58 (3-8-11)
ALL
J1_c. During the past 30 days
Restless or fidgety?
, how often did you feel . . .
PROBE: Would you say: All of the time, most of the time, some of the time, a little of the time, or none
CODE ONE ONLY
of the time?
ALL OF THE TIME ....................................................... 1
MOST OF THE TIME ................................................... 2
SOME OF THE TIME ................................................... 3
A LITTLE OF THE TIME .............................................. 4
NONE OF THE TIME ................................................... 5
DON’T KNOW .............................................................. d
REFUSED.................................................................... r
ALL
J1_d. During the past 30 days
Hopeless?
, how often did you feel . . .
PROBE: Would you say: All of the time, most of the time, some of the time, a little of the time, or none
CODE ONE ONLY
of the time?
ALL OF THE TIME ....................................................... 1
MOST OF THE TIME ................................................... 2
SOME OF THE TIME ................................................... 3
A LITTLE OF THE TIME .............................................. 4
NONE OF THE TIME ................................................... 5
DON’T KNOW .............................................................. d
REFUSED.................................................................... r
ALL
J1_e. During the past 30 days
That everything was an effort?
, how often did you feel . . .
PROBE: Would you say: All of the time, most of the time, some of the time, a little of the time, or none
CODE ONE ONLY
of the time?
ALL OF THE TIME ....................................................... 1
MOST OF THE TIME ................................................... 2
SOME OF THE TIME ................................................... 3
A LITTLE OF THE TIME .............................................. 4
8/22/2019 USDA Report re SNAP & Food Security 08/2013
http://slidepdf.com/reader/full/usda-report-re-snap-food-security-082013 350/355
Prepared by Mathematica Policy Research 59 (3-8-11)
NONE OF THE TIME ................................................... 5
DON’T KNOW .............................................................. d
REFUSED.................................................................... r
ALL
J1_f. During the past 30 days
Worthless?
, how often did you feel . . .
PROBE: Would you say: All of the time, most of the time, some of the time, a little of the time, or none
CODE ONE ONLY
of the time?
ALL OF THE TIME ....................................................... 1
MOST OF THE TIME ................................................... 2
SOME OF THE TIME ................................................... 3
A LITTLE OF THE TIME .............................................. 4
NONE OF THE TIME ................................................... 5
DON’T KNOW .............................................................. d
REFUSED.................................................................... r
ALL
you IF B1C = 0
your household IF B1C NE 0
J2. If (you/your household) had a problem with which you needed help, for example, sickness or moving, how much help would you expect to get fromfamily living nearby?
CODE ONE ONLY
All of the help needed, ............................................... 1
Most of the help needed, ........................................... 2
Very little of the help needed, or ............................... 3
No help? ..................................................................... 4
DON’T KNOW .............................................................. d
REFUSED.................................................................... r
ALL
you IF B1C = 0
your household IF B1C NE 0
J3. If (you/your household) had a problem with which you needed help, how muchhelp would you expect to get from friends?
CODE ONE ONLY
8/22/2019 USDA Report re SNAP & Food Security 08/2013
http://slidepdf.com/reader/full/usda-report-re-snap-food-security-082013 351/355
Prepared by Mathematica Policy Research 60 (3-8-11)
All of the help needed, ............................................... 1
Most of the help needed, ........................................... 2
Very little of the help needed, or ............................... 3
No help? ..................................................................... 4
DON’T KNOW .............................................................. d
REFUSED.................................................................... r
ALL
you IF B1C = 0
your household IF B1C NE 0
J4. If (you/your household) had a problem with which you needed help, how muchhelp would you expect to get from other people in the community besidesfamily and friends, such as a social service agency or a church?
CODE ONE ONLY
All of the help needed, ............................................... 1
Most of the help needed, ........................................... 2
Very little of the help needed, or ............................... 3
No help? ..................................................................... 4
DON’T KNOW .............................................................. d
REFUSED.................................................................... r
The next question is about your neighborhood.
ALL
J5. Do you consider your neighborhood very safe from crime, somewhat safe, or very unsafe?
CODE ONE ONLY
VERY SAFE ................................................................. 1
SOMEWHAT SAFE ..................................................... 2
VERY UNSAFE ........................................................... 3
DON’T KNOW .............................................................. d
REFUSED.................................................................... r
8/22/2019 USDA Report re SNAP & Food Security 08/2013
http://slidepdf.com/reader/full/usda-report-re-snap-food-security-082013 352/355
Prepared by Mathematica Policy Research 61 (3-8-11)
K. RESPONDENT DEMOGRAPHICS AND HEALTH STATUS
The last few questions are for classification purposes only.
IF NEW RESPONDENT, ELSE GO TO K6
K1. What is your date of birth?
| | | / | | | / | | | | |MONTH DAY YEAR
(1 – 12) (1 – 31) (1900 – 1995)
DON’T KNOW .............................................................. d
REFUSED.................................................................... r
IF NEW RESPONDENT
K2. Are you of Hispanic or Latino origin?
YES ............................................................................. 1
NO ............................................................................... 0
DON’T KNOW .............................................................. d
REFUSED.................................................................... r
IF NEW RESPONDENT
K3. I am going to read a list of five race categories. Please choose one or moreraces that you consider yourself to be. White; Black or African American;American Indian or Alaska Native; Asian; or
CODE ALL THAT APPLY
Native Hawaiian or other PacificIslander?
WHITE ......................................................................... 1
BLACK OR AFRICAN AMERICAN .............................. 2
AMERICAN INDIAN OR ALASKA NATIVE .................. 3
ASIAN .......................................................................... 4
NATIVE HAWAIIAN OROTHER PACIFIC ISLANDER....................................... 5
OTHER (SPECIFY) ...................................................... 6
(STRING 100)
DON’T KNOW .............................................................. d
REFUSED.................................................................... r
8/22/2019 USDA Report re SNAP & Food Security 08/2013
http://slidepdf.com/reader/full/usda-report-re-snap-food-security-082013 353/355
Prepared by Mathematica Policy Research 62 (3-8-11)
IF NEW RESPONDENT
K4. What is the highest level of education you have completed so far?
Would you say…
CODE ONE ONLY
Less than 9th grade, .................................................. 1
Some high school, but no diploma, .......................... 2
High school graduate (diploma or equivalent diploma [GED]), ....................................... 3
Technical, trade or vocational degree, ..................... 4
Some college, but no degree, ................................... 5
Associate’s degree, ................................................... 6
Bachelor’s degree, ..................................................... 7
Some graduate school but no degree, ..................... 8
Master’s degree, or .................................................... 9
Professional school or doctorate? ........................... 10
DON’T KNOW .............................................................. d
REFUSED.................................................................... r
IF NEW RESPONDENT
K5. ASK ONLY IF NEEDED: Are you male or female?
MALE ........................................................................... 1
FEMALE ...................................................................... 2
DON’T KNOW .............................................................. d
REFUSED.................................................................... r
ALL
K6. In general, would say your health is excellent, very good, good, fair or poor?
CODE ONE ONLY
EXCELLENT ................................................................ 1VERY GOOD ............................................................... 2
GOOD .......................................................................... 3
FAIR ............................................................................ 4
POOR .......................................................................... 5
DON’T KNOW .............................................................. d
REFUSED.................................................................... r

8/22/2019 USDA Report re SNAP & Food Security 08/2013
http://slidepdf.com/reader/full/usda-report-re-snap-food-security-082013 354/355
Prepared by Mathematica Policy Research 63 (3-8-11)
ALL (NOTE: ASKING K7A&K7B AGAIN SO K8 IS NOT SO SENSITIVE
K7a. How tall are you without shoes?
ENTER UNIT
FEET/INCHES ............................................................. 1
METERS/CENTIMETERS ........................................... 2
DON’T KNOW .............................................................. d
REFUSED.................................................................... r
K7A=1 OR 2
FEET IF K7A=1
METERS IF K7A=2
K7b. ENTER (FEET/METERS)
| | | NUMBER (3 – 7 IF FEET; 1.0 - 2.50 IF METERS)
DON’T KNOW .............................................................. d
REFUSED.................................................................... r
K7A=1 OR 2
INCHES IF K7A=1
CENTIMETERS IF K7A=2
K7c. ENTER (INCHES/CENTIMETERS)
| | | NUMBER (1-12 IF INCHES; 100-220 IF CENTIMETERS)
DON’T KNOW .............................................................. d
REFUSED.................................................................... r
SOFT CHECK: IF GE 7 FEET OR GT 2 METERS I just want to make sure I recorded your answer correctly. Did you say 7 feet/2 meters?
8/22/2019 USDA Report re SNAP & Food Security 08/2013
http://slidepdf.com/reader/full/usda-report-re-snap-food-security-082013 355/355
ALL
K8. How much do you weigh without shoes?
IF RESPONDENT SAYS SHE IS PREGNANT, SAY: How much did you weighbefore your pregnancy?
ENTER UNIT
POUNDS ..................................................................... 1
KILOGRAMS ............................................................... 2
DON’T KNOW .............................................................. d
REFUSED.................................................................... r
K8=1 OR 2
K8a. ENTER NUMBER
| | | | NUMBER (70 – 999)
DON’T KNOW .............................................................. d
REFUSED.................................................................... r